I blogged here about the WDR 2024 which, among other things, extols the importance of economic openness to improve domestic manufacturing competitiveness. However, this claim does not corroborate the empirical evidence on FDI among the North East Asian economies in their early high growth periods.
There are two channels of economic openness - trade in goods and services, and foreign direct investments. The economic orthodoxy has been that openness on both fronts is essential for developing countries to increase competitiveness and productivity, and broaden their manufacturing base. This post will examine the trends among developing countries on each.
The historically low penetration of FDI in North East Asian economies is captured nicely in this recent FT article about how corporate Japan is opening up to foreign investments. In the context of an attempt by Canadian retailer ACT to buy 7&I Holdings, the Tokyo-listed company that owns the 7-Eleven convenience stores, the article describes the challenges faced by foreign investors in Japan.
For decades, would-be foreign buyers have despaired of getting anywhere with Japan, however obviously desirable (Yakult? Konami? Canon? Nintendo? Yamaha?) the list of potential targets. A market for corporate control, whether led by domestic consolidation or foreign takeover, has never properly evolved — in part because no one has forced Japanese companies to accept the primacy of shareholder interests. Absent the forces driving valuations higher, the Tokyo Stock Exchange twinkles with heavily undervalued brands and brilliance… Japanese companies are not rated as if they are profit-hungry, because the country’s long years of ultra-low interest rates means a great many are not. But Japan has also exuded — through fierce resistance, poison pill strategies and more — the message that its treasures were off-limits. Chief executives were not historically obliged, by law, best practice or feisty shareholders, to take unsolicited offers seriously, and conventional wisdom (along with the recommendation of financial advisers) was that only a fully agreed takeover could work.
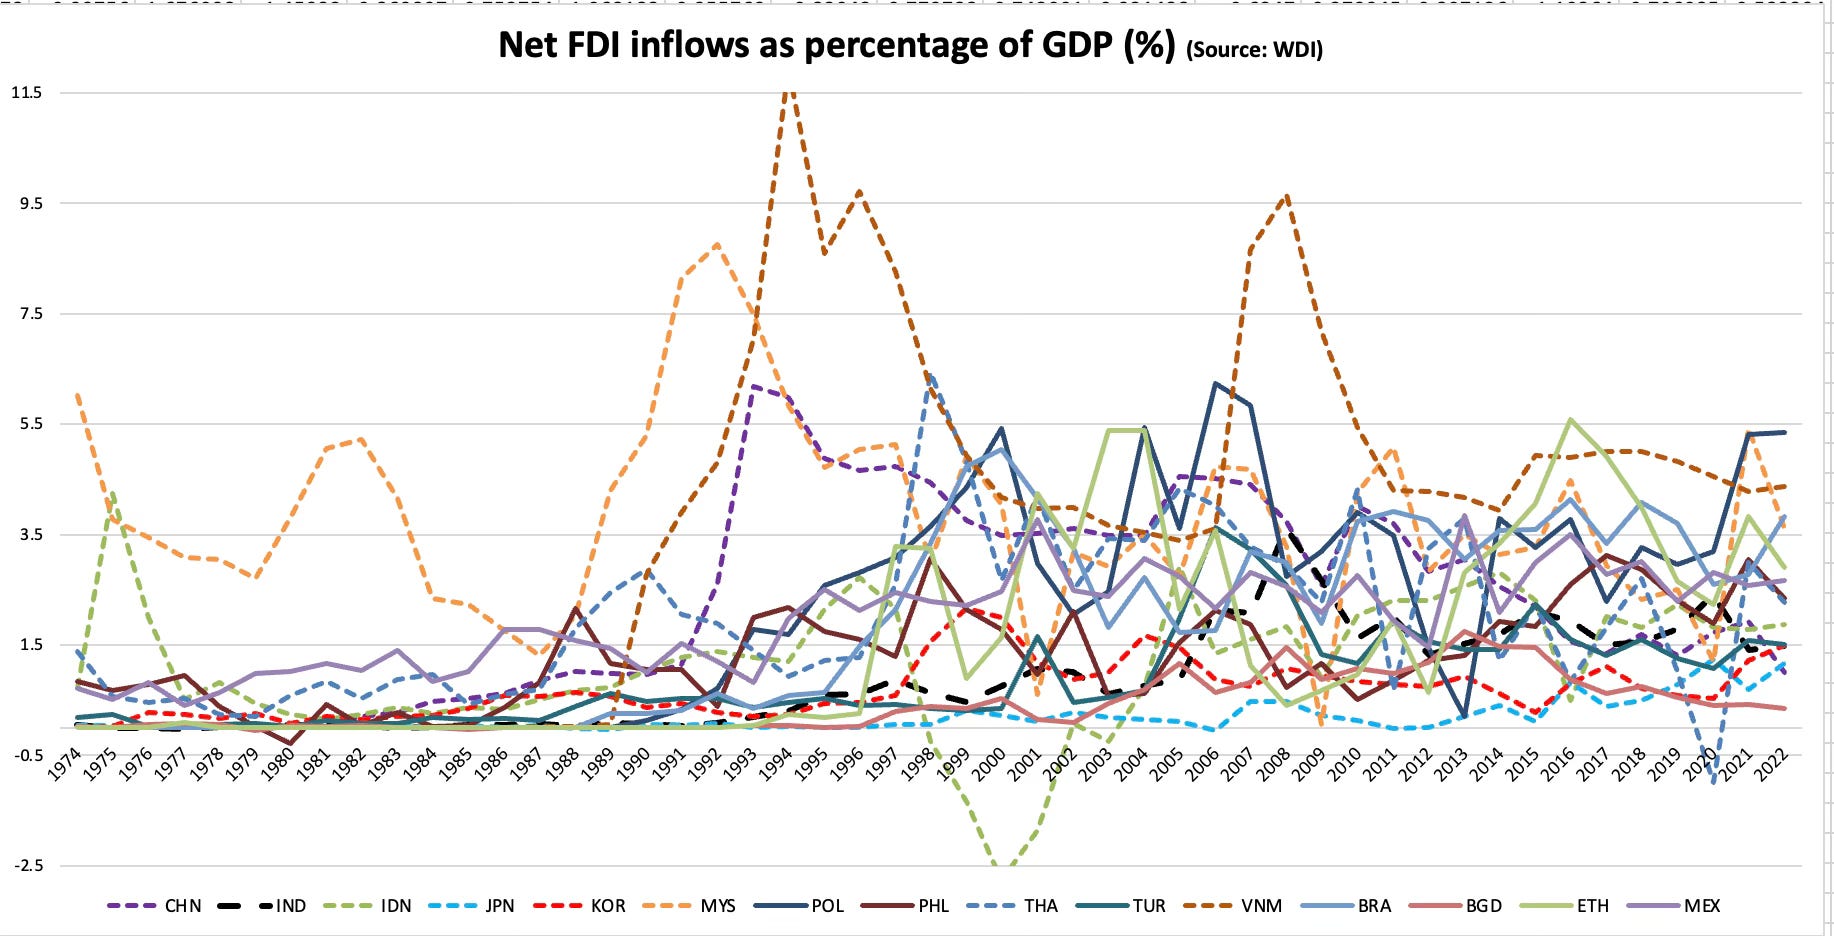
So what has been the historical trend of FDI inflows into the major developing economies? The graphic below compares 16 major developing countries for the period from 1974 to 2022.
This graphic removes Vietnam and Malaysia so that we can zoom into the trends.
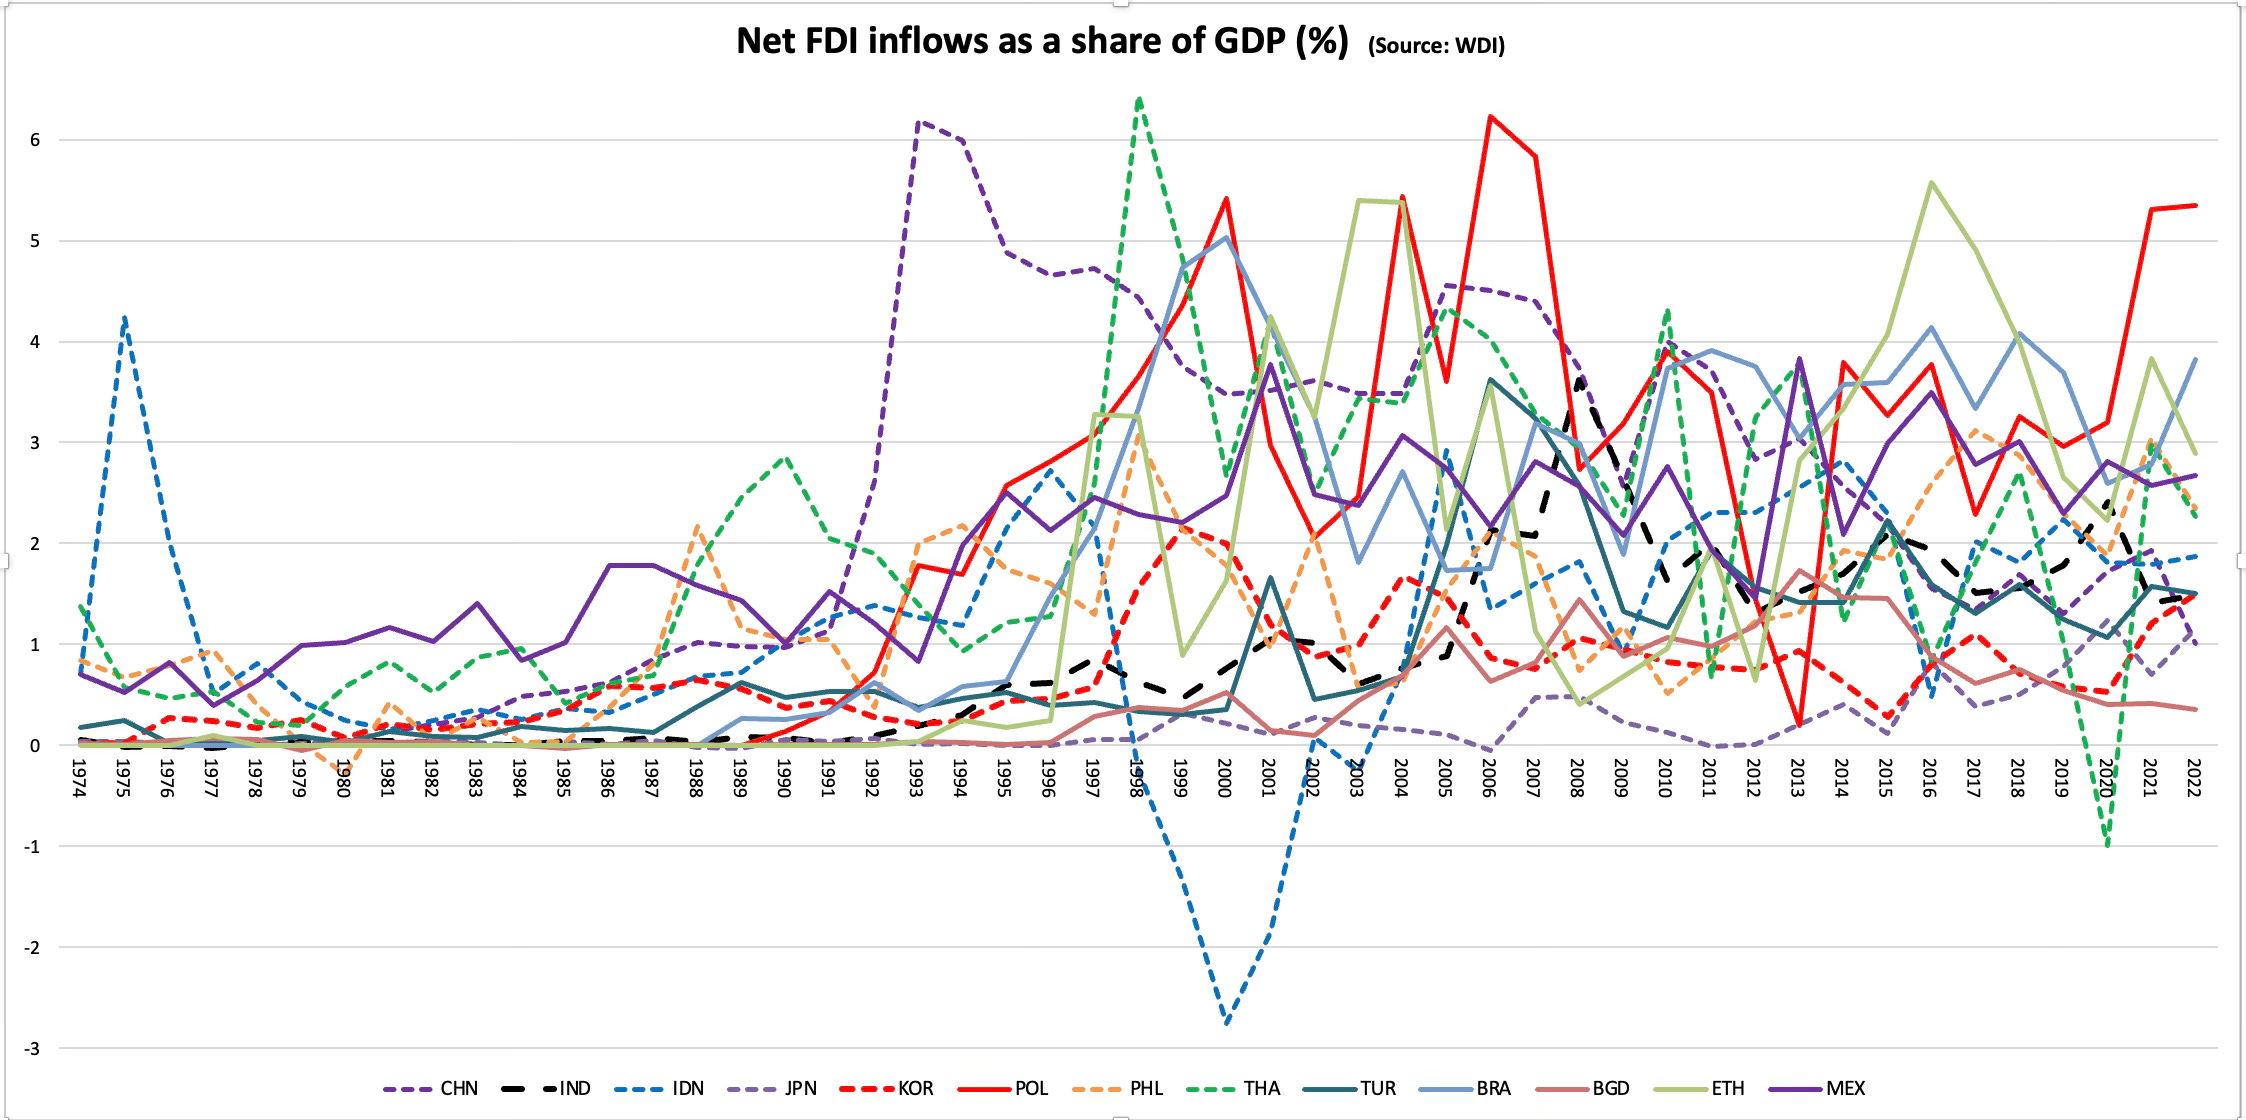
There’s a very large diversity in the FDI experiences of these countries. At one end are Japan and South Korea. It’s remarkable how little of FDI Japan and South Korea received during their high growth periods. In both countries, FDI has been consistently less than 1% of GDP (apart from a brief period in late nineties for South Korea). Clearly foreign competition and FDI-based technology transfers had little to do with the classic North East Asian economic success. As Joe Studwell has nicely described in his book, these countries pursued the classic infant industry protection policies (that countries like the UK and the US pursued before them) with the strong disciplining force of export competition.
In contrast, China is the star case for FDI. In the 1991-2012 period which coincided with the country’s spectacular economic growth surge, China received 3-5% of GDP every year. But since 2012, it has dwindled to less than 2% of GDP. China perfected the art of inviting foreign companies to establish manufacturing facilities, gradually form joint ventures, force technology transfers, and create local manufacturing champions across sectors using very generous doses of subsidies. But how many countries have the political discipline, resources, and market power to pursue this path?
Since the mid-nineties, the consistently higher FDI recipient countries have been Malaysia, Vietnam, Poland, Brazil, and Ethiopia, with Vietnam being the standout. Since the turn of the millennium, Thailand, Philippines, and Indonesia have received significant FDI, though it has been characterised by large volatility for Indonesia and Thailand. In the last quarter century, apart from Vietnam and Poland (whose case might be different), none of these countries who benefited from large FDI inflows can claim to have grown at high rates, and established diversified economies leave aside become manufacturing powerhouses.
But for the first half of last decade, FDI has been a very small share of Bangladesh’s economic output, underlining the country’s struggles to go beyond textiles and diversify its economy.
India has received FDI of about 1.5-2% of GDP for the last decade and a half. However, in its high growth period of the second half of the 2000s, FDI inflows went beyond 3% of GDP and stayed above 2% of GDP. This has not since been replicated.
Now, let’s do a similar analysis for trade as a percentage of GDP. Let’s first take the case of today’s advanced economies - US, Japan, Germany, France, UK, Spain, Netherlands, Italy, Australia, and a few regions (E Asia, OECD, N America, and Euro Area - shown as dashed lines below).
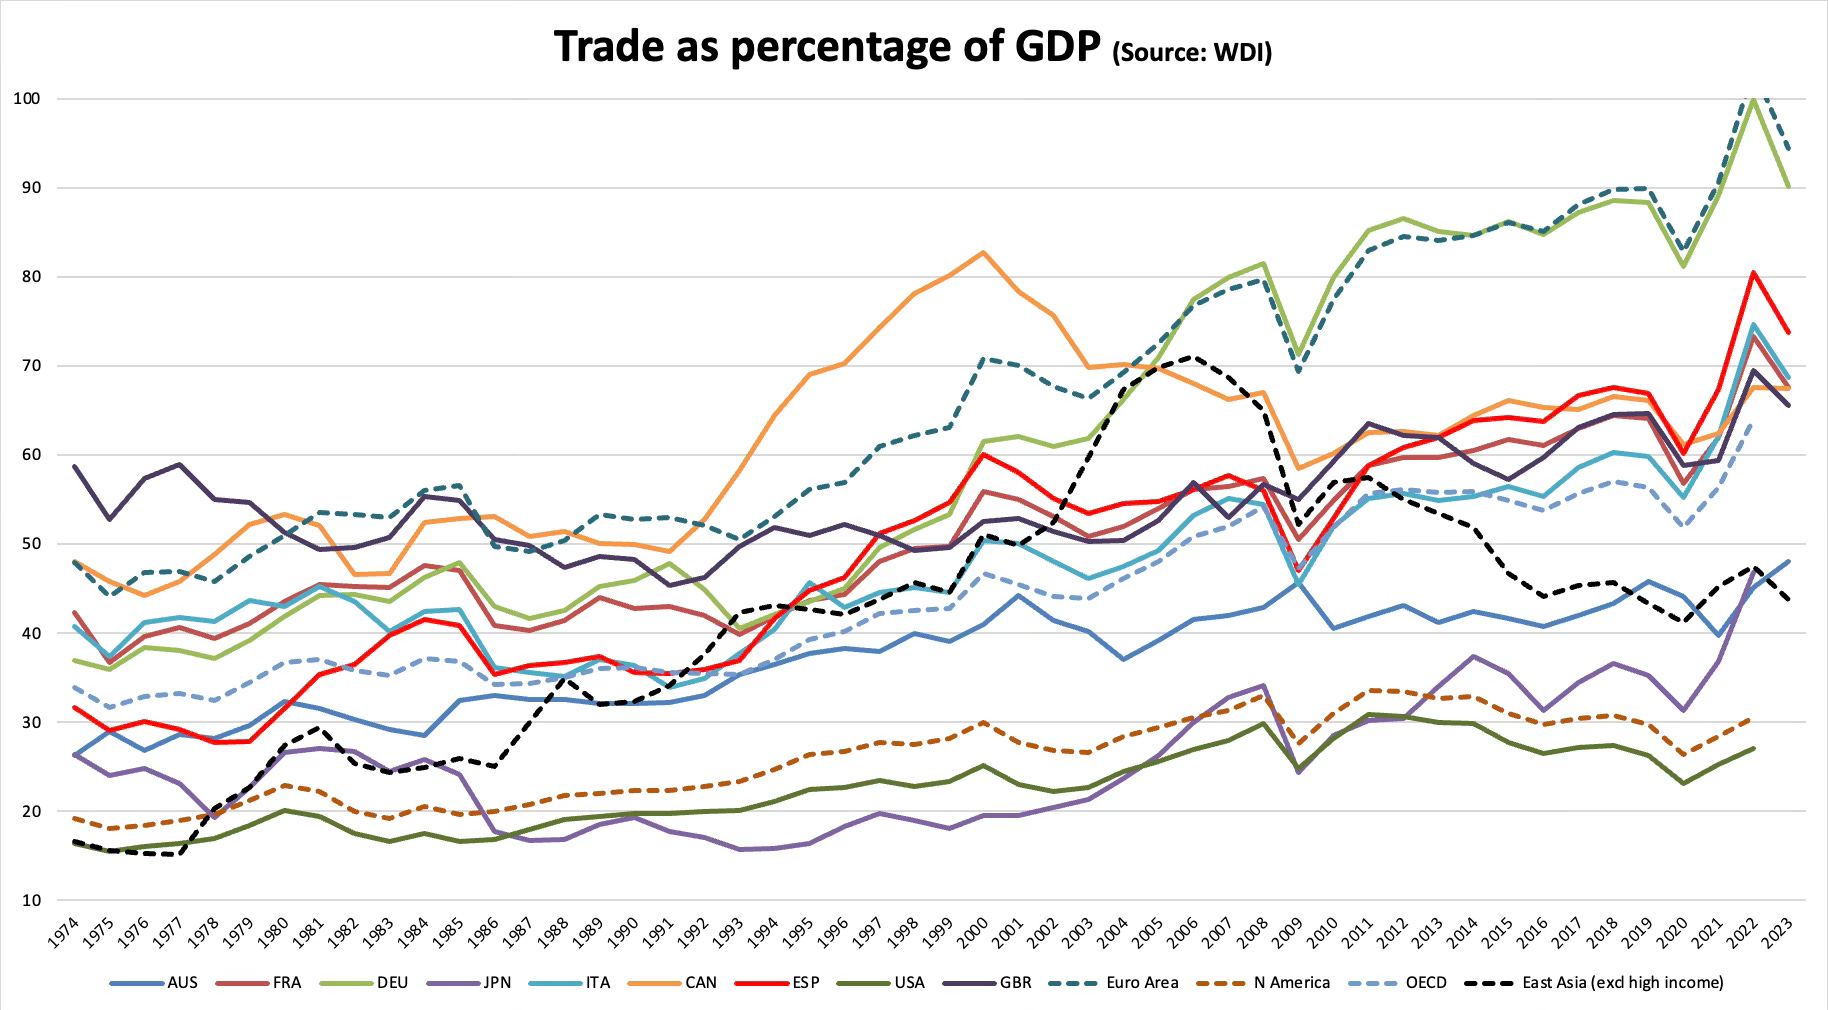
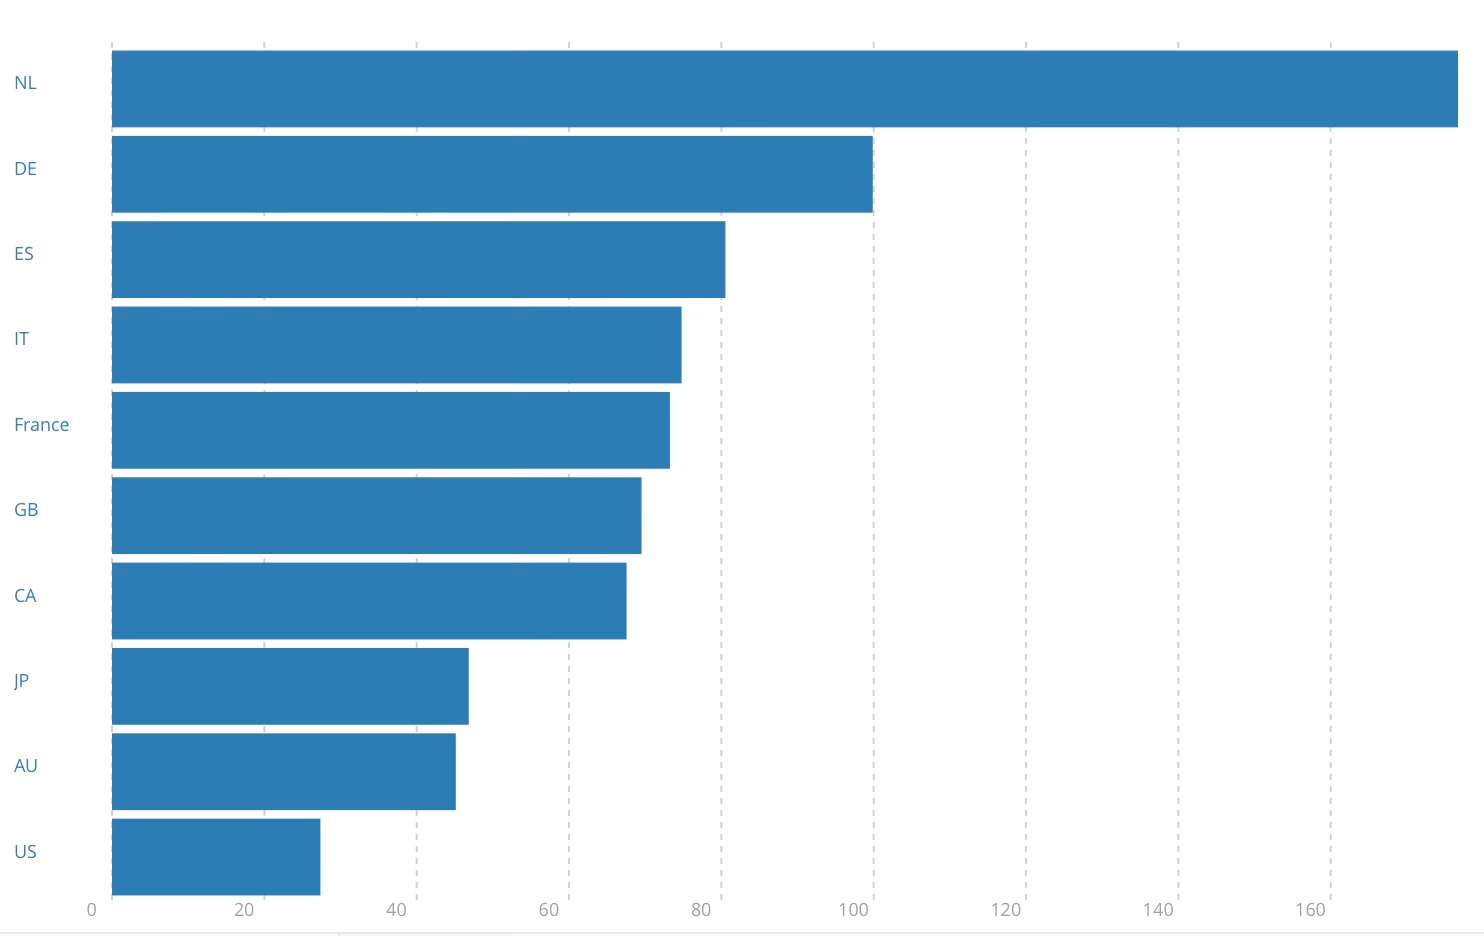
The clear outliers are the Netherlands (not in the graph) and Germany, whose large trade shares skew the number for the Euro area. For the US it has never touched 30% and Japan it has been below 40%. For the rest, the trade share has been in the 40-60% range for a long time, before rising gradually since the financial crisis and sharply since the pandemic to cross 70% (though it’s falling back now). The trade shares for 2022 are in the graphic below.
Now consider the case of developing countries, especially the East Asian and Latin American ones. The same trend comparison since 1989 shows the following.
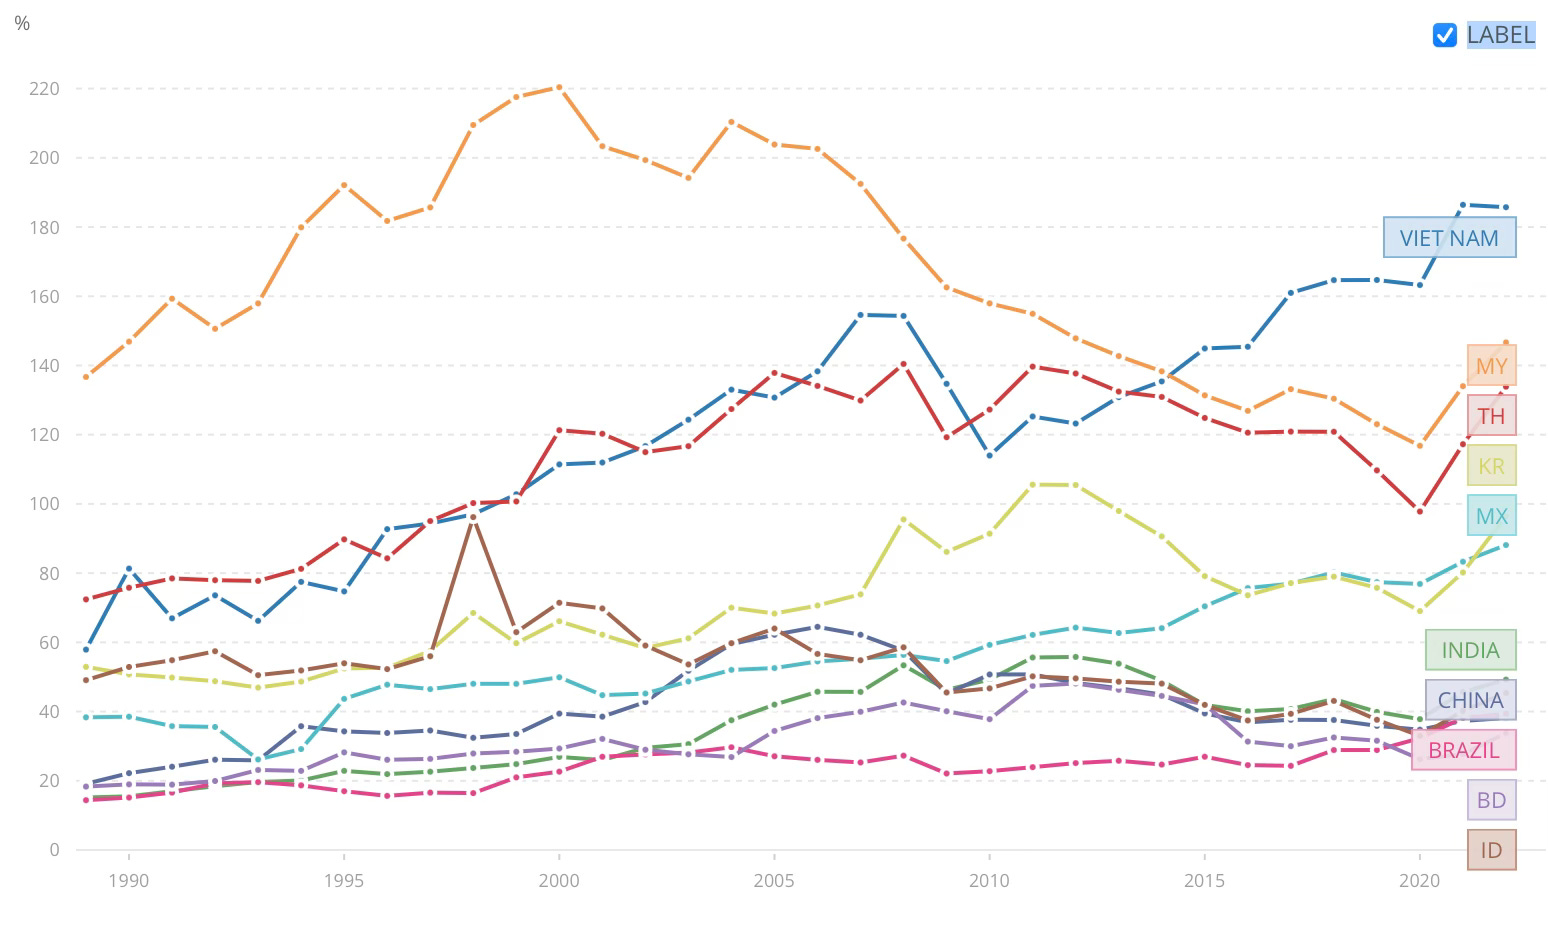
The trade shares of the big economies - China, India, Brazil, and Indonesia - appear to have stabilised in the forties, after having risen from the twenties. They are in a much higher 100-150% of GDP range for the smaller East Asian economies, with Vietnam being a clear outlier among all economies.
Vietnam and, to a lesser extent, Malaysia and Thailand, are the standout performers. Vietnam’s history shows two phases of trade growth, from 1993 to 2007 and then from 2010 to 2022. South Korea has had trade share of consistently more than 60% since the mid-nineties.
Interestingly, even in its peak growth periods, China’s trade share only touched 64% of GDP in 2006. India’s trade share rose from 30% in 2002 to reach 53% in 2008 and then to 56% in 2011 and 2012 before falling. But since the pandemic, it has been rising.
The trade shares touched peaks of 220%, 140%, and 106% for Malaysia, Thailand, and Korea before declining. It’s important to note that trade share remains very low for both Indonesia and Bangladesh, especially striking for the latter given its oft-repeated image as a poster child for textiles exports.
For the year 2022, the trade shares are as follows.
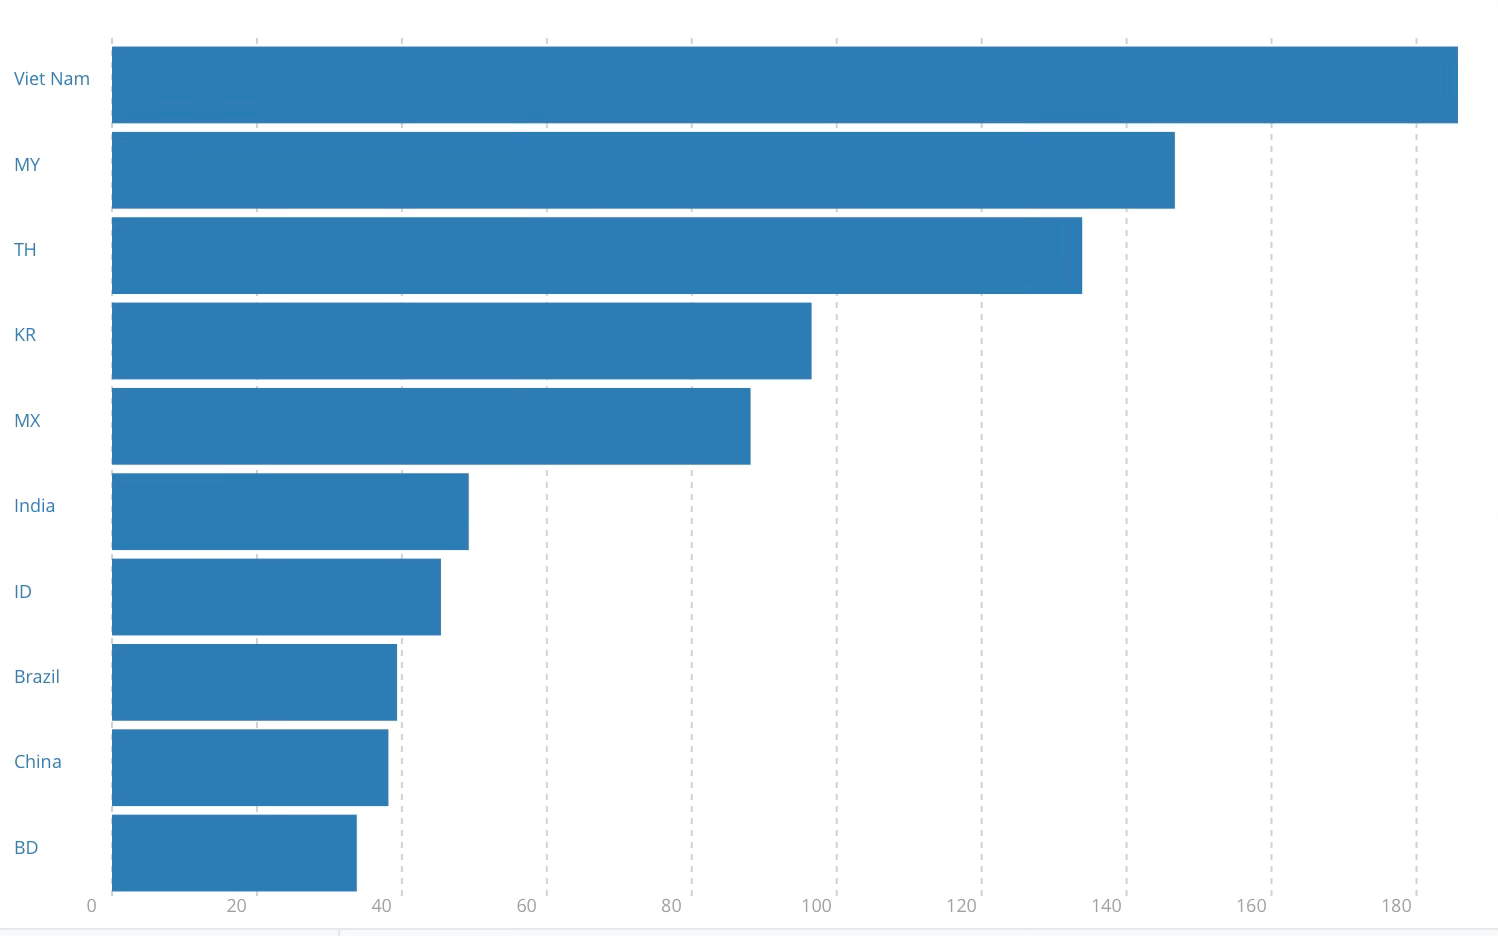
Again, like with FDI inflows, there’s a lot of heterogeneity among countries and it’s not possible to draw any broad generalisation. The high trade shares of the smaller Southeast Asian economies point to their high dependence on foreign trade for economic growth. Given their current account surpluses (the graphic below), these economies appear to have established themselves as input suppliers in the global value chains centring on China.
The graphic below shows the current account balances of the East Asian economies since 1975. As can be seen, there was a structural break since the East Asian crisis of 1997 whence these countries flipped from running current account deficits to having current account surpluses. Some like Malaysia and Thailand have often run very high surpluses.
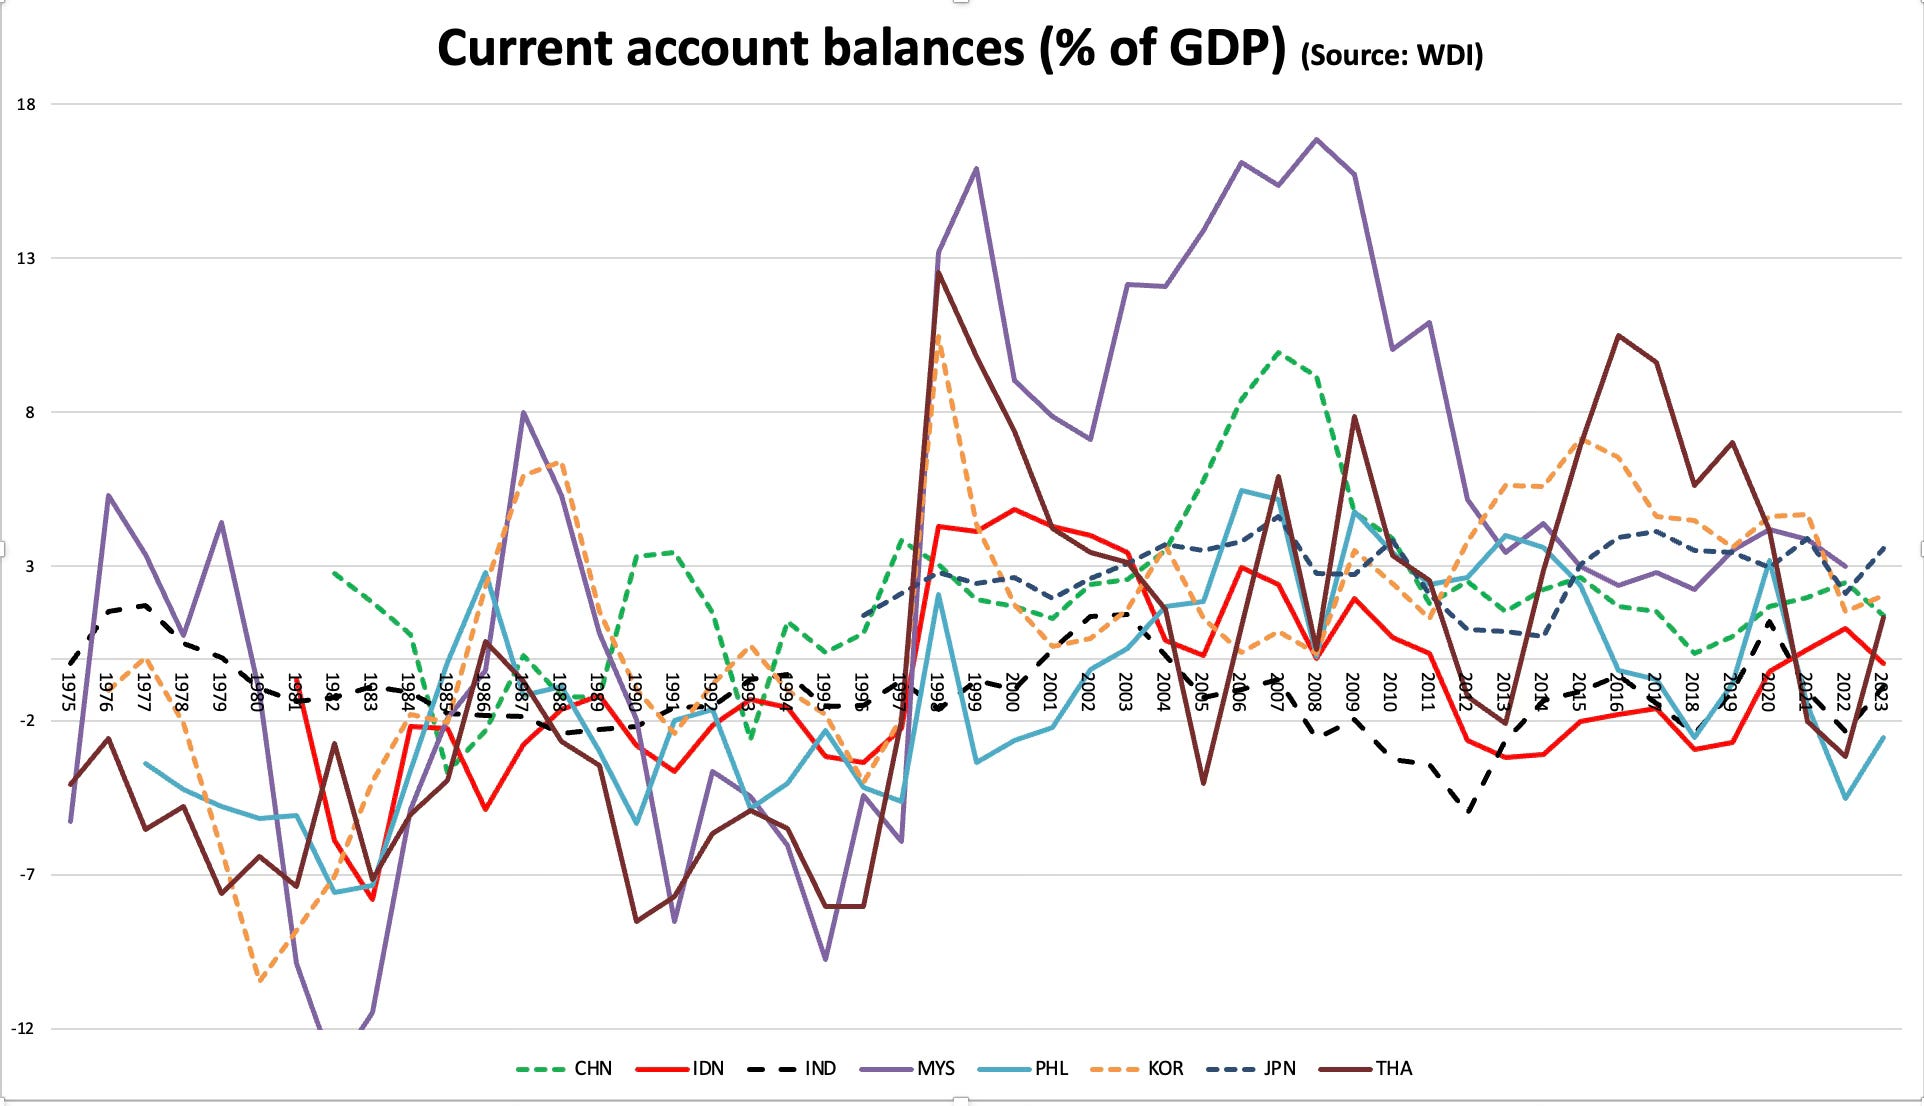
China, South Korea, and Japan have consistently run surpluses, at least since the early eighties (except for a brief period in the nineties for S Korea). In contrast, India has been running deficits, albeit mostly within limits, except the brief period in 2012-13.
The graphics show that the trade shares of economic output for both the developed and developing large economies have been in the range of 40-60% (apart from the US and Japan, for whom it has been much lower) for the last fifty years.
In sum, if we go by historical examples, India, with current FDI and trade shares of slightly below 1.5% of GDP and 50% of GDP respectively, can at most strive to move its shares to about 2.5% of GDP and 65-70% of GDP respectively.
No comments:
Post a Comment