Substack

Showing posts with label market failures. Show all posts

Wednesday, January 28, 2026

Market failures in deep tech markets

There’s a fundamental competition problem in markets where network effects (e.g., the platforms offered byAmazon, Google, and Meta) and/or technological path dependencies (e.g. Nvidia’s constantly evolving versions of ever more sophisticated GPUs) create rising entry barriers and confer ever-widening competitive advantage, and where accordingly companies are incentivised to deepen their moats and keep expanding their market shares.

As an illustration, the Dutch lithography behemoth, ASML, may have the deepest and broadest moat among firms in any industry. 

Even in an industry with dominant or near-monopolistic firms - Nvidia in the design of chips that run AI applications, TSMC in the fabrication of processing chips, and Samsung and SK Hynix in high bandwidth memory (HBM) chips - ASML stands out. Consider the extent of its monopoly.

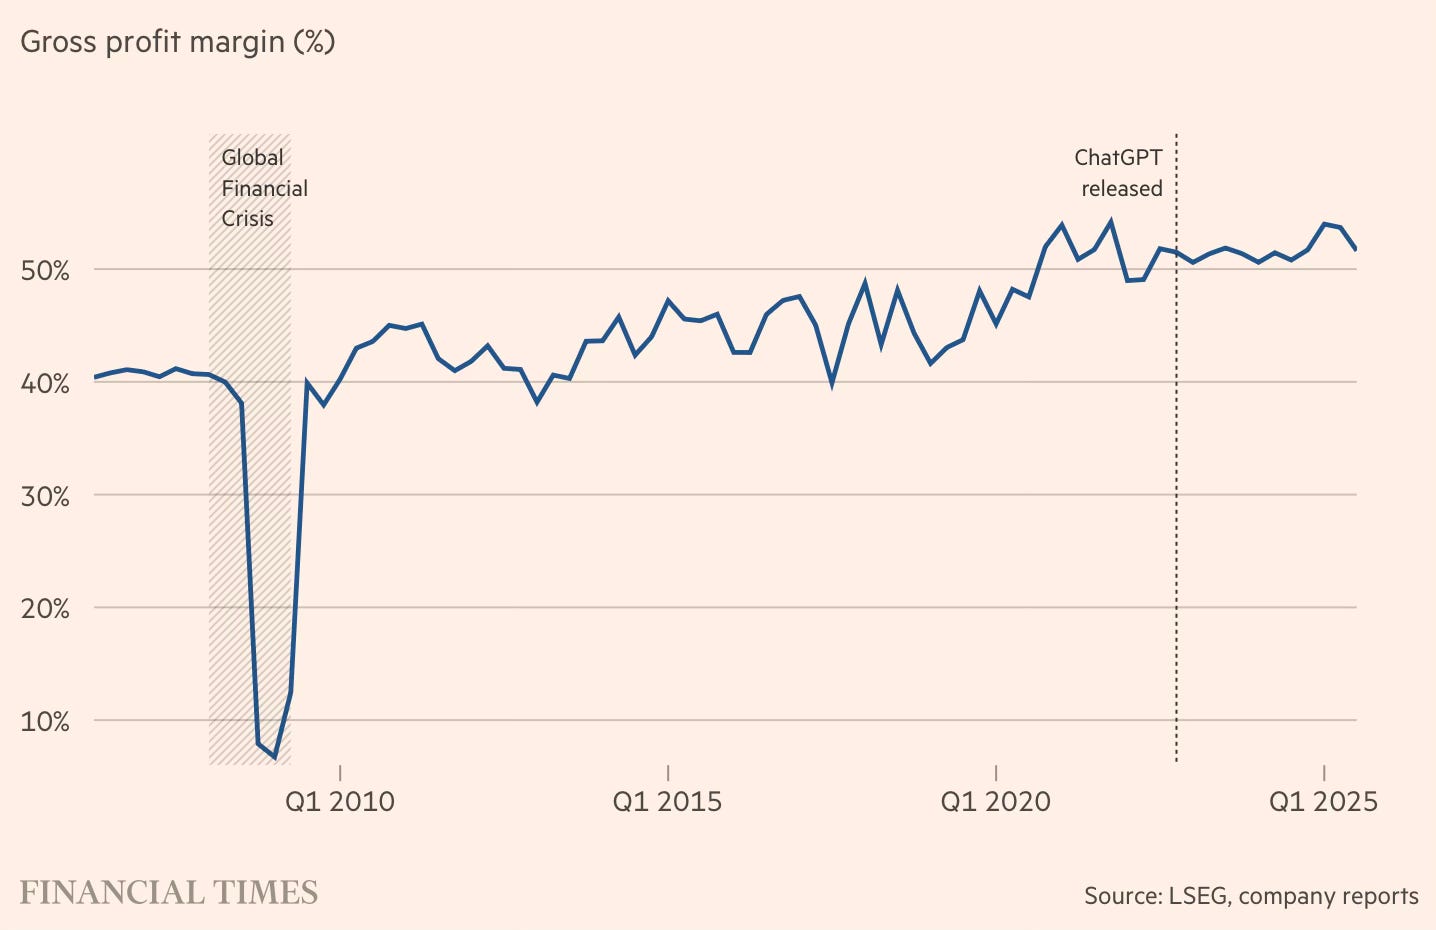
ASML sells just over 40 of its most advanced chipmaking machines each year. For over a decade, investors questioned whether such limited volumes could ever add up to a viable business. Those doubts have aged badly. After an 80 per cent rise in its share price over the past six months, ASML is now valued at more than $500bn... It is the only company that can make the extreme ultraviolet lithography machines required to produce those advanced chips. Each one has a starting price of $220mn and there is no commercially credible alternative supplier... In most industries, a monopoly this profitable — ASML’s gross profit margins were 52 per cent in the third quarter — would attract competition, especially from regions that already lead in related technologies.

What explains this monopoly?

The technology behind EUV machines is a chain of almost impossible steps, all of which have to work at the same time. Modern chips are made by printing patterns, layer by layer, on to silicon using light. To do this, engineers first need to create a form of light that does not occur naturally. Powerful lasers are fired at microscopic droplets of molten tin, turning them into plasma hotter than the surface of the Sun. That creates a pulse of extreme ultraviolet light, which is then reflected off a series of mirrors, each made with atomic-level precision and taking months to make, before the pattern is finally transferred to the silicon wafer. The hardest part to replicate is the optics. EUV-grade mirrors are produced by a single supplier: Carl Zeiss SMT. They are the product of decades of tightly integrated development between Zeiss and ASML.

Even if a peer could replicate that technology, the economics do not work. Any new entrant would sell too few machines each year to recover development costs, yet those machines would still be expected to deliver near-perfect reliability from day one. Chip fabrication plants operate continuously… As a result, chipmakers are unwilling to experiment with unproven EUV tools in volume production. That means a rival would never accumulate the field data required to improve. 

ASML shipped its first EUV machine in 2006 and its first production capable system in 2013. Because chip factories run around the clock, cumulative operating hours now run into the millions. That gap in real world operating data explains why Nikon and Canon, once ASML’s peers in lithography, ultimately withdrew from pursuing EUV lithography systems over a decade before it became commercially viable, and why no successor has emerged since their exit… ASML shows how, beyond a certain technological threshold, markets no longer correct monopolies.

ASML may be the most egregious illustration of a pervasive market failure in deep technology markets, arising from innovation-induced moats. 

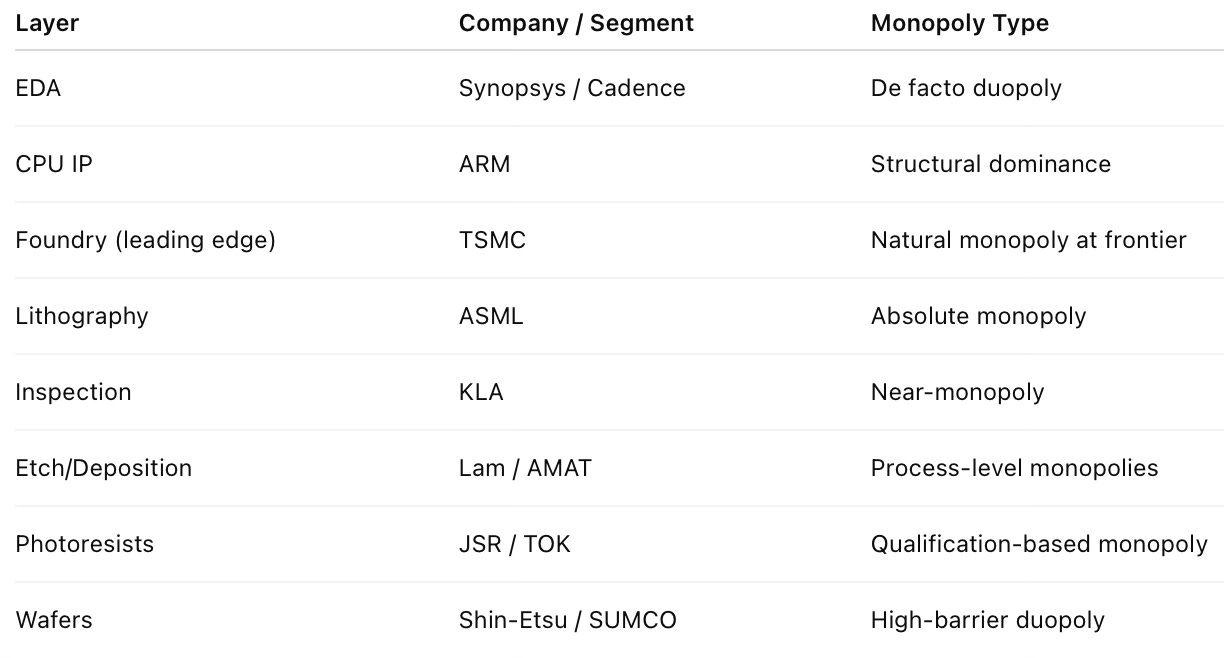
This moat is a result of the structural characteristics of the technology that creates a dynamic natural monopoly, arising from a combination of a long period of co-evolution with suppliers and customers, unmatchable accumulated R&D and tacit knowledge, high capital intensity and irreversibility (once invested, exit is costly and entry is irrational), and very long time horizons. In fact, the entire semiconductor chip design-to-fabrication value chain, including the equipment used, can be considered a stack of interlocking monopolies. 

It is therefore unsurprising that this is the only major market where China has struggled to make a breakthrough. All the dominant firms are either US, European, or Japanese. 

Such market failures are true across deep technology markets - commercial aircraft (Boeing/Airbus), jet engines (GE Aerospace, Rolls-Royce, Pratt & Whitney), electron microscope (Thermo Fisher Scientific, JEOL), industrial automation (Siemens, Rockwell Automation), etc. 

Traditional anti-trust measures are unlikely to be effective in addressing market failures arising from the structural characteristics of the technologies involved. As the Chinese are finding out, even throwing massive amounts of money can do little to cross the moats.

In addition to the moats created by the structural characteristics of the technology itself in these deep tech products, the manufacturing of major components for these products is also protected by daunting entry barriers arising from the market structure. 

Take semiconductor chip design, say, for a market for System on Chips (SoC) for various digital equipment (laptops, cameras, mobile phones, telecom equipment, etc.). This market is dominated by the likes of American (Qualcomm and Broadcom) and Taiwanese (Mediatek and Realtek) SoC designers. The OEMs in this market, themselves large multinational incumbents, are locked into close long-term partnerships with one or other of these companies. 

Even if a new chip design startup assembles a solid team and does tapeouts of an SoC that can be readily deployed in a device, it would still need an OEM to deploy the same. However, the OEM, which has a well-established supply chain, would have limited incentive to risk the experiment of trying out a brand-new supplier for any component, much less a critical one like the SoC. The OEM’s concerns are understandable given that it would require deep and mature institutional capabilities for the supplier to respond swiftly to rapidly evolving technologies and standards (for example, in telecommunications, a new 3GPP release happens every 6-12 months) and the resultant demands of the OEM. 

This is a problem not just to SoC but to any chip, or any other sophisticated electronic component, where moats are high. The net result is that breaking into this market becomes almost impossible. Since component manufacturing is generally an essential requirement to catalyse product manufacturing, barriers to the former end up further entrenching incumbents in the latter. 

It is relevant here that Chinese firms have made some headway in these markets. Their breakthroughs have come by riding on a wide base of domestic OEMs. In their quest to diversify away from the Western chip firms and lower their costs by leveraging their massive volumes (also from their ever-expanding export volumes), they had the incentive to bet long-term on domestic chip design firms. As a practice, starting with a small share of their overall requirement, they gradually increase the share of their sourcing from domestic chip firms. The massive subsidies and the strong push by the Chinese state to nurture indigenous firms have facilitated this process. 

The chip design firms, too, have generally started with a less sophisticated version of chips, developed capabilities and moved up the value chain into more sophisticated versions. 

As an example, by privileging a Chinese 3G standard, Beijing forced carriers and vendors to adopt equipment and handsets that supported it — creating immediate, captive volume for domestic baseband suppliers. That is a strong example where a regulatory mandate (a standard) directly created market share for local firms.

So what can be done to lower the moats and enable entry in some of these markets?

In these markets, where moats are so deep and wide, industrial policy actions by way of financial incentives (subsidies) to lower entry barriers may struggle. How much incentive is adequate to bridge the disability faced by domestic chip firms? How will it help open up the platforms of OEMs to the new chip design firms? There are hard limits to how much support can be given by fiscally constrained governments.

Therefore, in some of these markets, notwithstanding their distortionary risks, hard constraints by way of mandates may be required to break the entrenched market equilibrium of dominant foreign OEMs and their suppliers. These mandates can take the form of domestic content rules, public procurement preferences, and standards.

These mandates must be carefully designed and implemented to minimise market distortions and inefficiencies. It may be advisable to start the domestic mandate with a small percentage of sourcing, and that too in components where local capability is plausible, and by allowing tradeable compliance credits (firms unable to source locally can buy credits that fund supplier development). There should also be sufficient safeguards in terms of waivers and emergency provisions that allow temporary exceptions. Most importantly, the mandates should be administered transparently and closely monitored to make course corrections if required.

For sure, these mandates can only create some initial market access and cannot work on their own. They must be complemented with industrial policy incentives, patient risk capital, supply-chain development, and commercial incentives for OEMs. And even with all these, it can be effective in facilitating entry only to a few deep tech market segments.

Wednesday, February 19, 2025

Agriculture needs more dynamic entrepreneurship

I blogged here that supporting enterprising farmers is perhaps the highest value for money investments in agriculture and their activities have the highest local economic multipliers. 

Harish Damodaran has another story of agriculture entrepreneurship involving processing potatoes to make french fries and exporting them. He points to a stunning transformation in the market for french fries.

As consumption of the crispy straight-cut deep-fried potatoes grew, so did imports – crossing 5,000 tonnes annually by the mid-2000s and peaking at 7,863 tonnes in 2010-11 (April-March). But cut to 2023-24, when not only have imports practically ceased, India actually exported 135,877 tonnes of FF valued at Rs 1,478.73 crore. During April-October 2024, exports were 106,506 tonnes and worth Rs 1,056.92 crore. This turnaround – from an importer to an exporter of a highly western fast-food product – has been thanks to opportunity-seizing domestic entrepreneurs, who also harnessed the potential of processing potato varieties suitable for making FF and cultivating them in India…

The Ahmedabad-headquartered HyFun Foods Pvt. Ltd. accounted for about 85,000 out of the 175,000 tonnes of FF – plus another 8,000 out of 12,000 tonnes of potato hash browns – exported from India in the last calendar year. Other major exporters are Iscon Balaji Foods, Funwave Foods and ChillFill Foods (all from Gujarat) and the US-based J.R. Simplot (it also has a plant in the state). India’s export of FF exceeds its estimated domestic consumption of 100,000 tonnes. Roughly 80% of that comprises sales to businesses (the likes of McDonald’s, KFC and Burger King, besides hotels, restaurants and caterers) at an average Rs 125/kg realisation and the rest to the retail segment at Rs 200/kg, adding to a total market size of Rs 1,400 crore… 

In the 2023-24 season – potato is sown in October-November and harvested in February-March – HyFun procured 300,000 tonnes from 6,000 farmers in Banaskantha, Sabarkantha, Gandhinagar and Mehsana districts of Gujarat. For the current season, the company plans to buy 400,000 tonnes from 7,250 farmers growing in 30,000 acres of Gujarat, 1,500 acres of Madhya Pradesh and 500 acres of Uttar Pradesh… HyFun provides good quality disease-free seeds of Santana, Frysona and FryoM potato to its farmers. It sources their mini-tubers grown in tissue-culture labs by seed-potato companies: ITC Technico Agri Sciences, Mahindra HZPC and KF Biotech. These are multiplied first in 250-plus acres of HyFun’s corporate farms and then over two generations through contract seed growers in Punjab, Haryana and UP. The third-generation seed is what farmers like Patel plant for supplying back as commercial potato to HyFun.

The article informs how these firms contracted with farmers to grow potato varieties with higher dry matter (lower moisture content), high-reducing sugars, and large oblong-shaped that are best suited for fries by enabling the supply of seeds of Kufri variety developed by the Central Potato Research Institute, Shimla. It also highlights how HyFun collaborated with farmers to improve their productivity and bring down their cost of cultivation. This collaboration covered inter-cropping practices to improve soil fertility, demonstration plots to optimise planting space and depth, optimise fertiliser use, and adopt drip irrigation. 

Agriculture sector interventions by the government have hitherto been to create public goods - irrigation infrastructure, post-harvest facilities including godowns and cold storages, public procurement, and extension services - and provide subsidised inputs - seeds, fertilisers, power, credit, etc. By their very nature, all these are targeted to benefit all farmers. 

Instead, there’s a need for a complementary policy that looks at unlocking enterprise among farmers. The examples of HyFun, Sahayadri Farms in Nashik (grapes), shrimp farmers in the coastal districts of Andhra Pradesh, and Pomegranate farmers in Rajasthan show that successful examples arise from persistent problem-solving and seizing of emerging market opportunities by enterprising farmers.

Public policy should indulge in similar problem-solving in a focussed manner so as to catalyse at least hundreds, if not thousands, of such successes over a five-year period. 

What do entrepreneurs in agriculture and agri-processing need? What are the specific facilities or facilitations that they need? What regulatory enablers and financial and other forms of support are required? What market access support can be provided?How can existing markets be leveraged to provide those? What are the market-making requirements? What financial instruments can achieve the objectives? In general, what coordination failures can be addressed by governments and how? 

These are the kind of questions that must be explored in the design of this policy.

Public policy has focused on supporting entrepreneurs and their startups, and their successes, though mostly confined to those engaged in technology-based activities, have been celebrated. This salience should extend to the agriculture sector, and supporting agriculture entrepreneurs should occupy primacy in public policy. 

As a cautionary note, this policy initiative should stay clear of infrastructure and other publicly provisioned support to avoid any mission creep and remain focused. It should also steer clear of the politically sensitive regulatory reforms. In fact, it should avoid macro-interventions unless otherwise essential to meet its objectives. 

Instead, it should seek to support entrepreneurial farmers to access market facilities and incentivise the market to deliver services required by these farmers. Such support would involve facilitating market access to good quality seeds (including subsidies), affordable and timely credit, coordinating on accessing various post-harvest services, facilitating trade-related clearances and permissions, and generally supporting on market access interventions. 

A low-hanging fruit would be to harness the services of the several non-profits and for-profit startups engaged with the agriculture sector. This can be done by creating platforms systems that perform the market access and matching role - expose entrepreneurial farmers to these entities and allow enterprising startups to engage with similarly enterprising farmers. It should designed to encourage problem-solving and iteration by entrepreneurs to develop business models and access markets and similarly encourage market service providers to engage with entrepreneurial farmers. 

The central (or some state) government could consider a mission to unlock rural entrepreneurship by identifying and supporting enterprising farmers and rural startups in commercial agriculture production and agri-processing, which can localise value capture, increase farm-related incomes, and create productive jobs in rural areas. This would be expanding Startup India which is currently confined largely to technology-related sectors to cover agriculture, Startup India for Rural Entrepreneurs.

This initiative should avoid the pitfall of spreading the butter thin and trying to cover the entire country. Instead, it might have to be confined to a few prioritised geographies with potential for agricultural entrepreneurship.

Thursday, December 5, 2024

Market failures from profit maximisation in US healthcare

A Bloomberg series (this and this) chronicles US hospital chains' widespread use of Nurse Practitioners (NPs) in primary care to emergency rooms. NYT has a two-part series (this and this) on how pharmacy benefit managers (PBMs) are driving up drug prices and forcing out independent drug stores across the US. 

The four articles are a case study on how profit maximisation incentives in sectors like health care distort incentives, erode service quality, hurt consumer welfare, and inflict pain on customers and communities. 

The Bloomberg series illustrates the example of Hospital Corporation of America (HCA), a $84 billion for-profit, which is the largest hospital chain in the US, with its over 180 network hospitals across the country having treated over 1.9 million patients in 2022 alone. 

It has gone the farthest in using NPs to maximise efficiencies. 

Busy ERs are constantly triaging, determining where the physicians on duty are most needed. And nurse practitioners have significant responsibility and authority—perhaps more than many patients realize. In important respects, they’re now at the center of health care in the US… There are already more than 300,000 nurse practitioners, and that figure is rising far faster than the number of doctors. In 2014 there was 1 NP for every 5 physicians and surgeons in the US, according to the Bureau of Labor Statistics. Last year the ratio was 1 to 2.75. The gap is going to shrink further still: Nurse practitioner is the fastest-growing profession in the country, and the ranks are expected to climb 45% by 2032.

After getting an advanced degree—typically a master’s or doctorate in nursing—and an additional license, nurse practitioners are allowed to treat patients in many of the same ways medical doctors do, including diagnosing ailments and prescribing medications. The shift has many benefits. For patients, more clinicians means getting care sooner. (The average wait time for an appointment with a physician is at an all-time high of 26 days.) For health-care organizations, NPs are cheaper to employ than physicians, and under some circumstances the organizations can bill insurers for their time at physician rates. The NPs themselves can get more pay, more prestige and a better work-life balance than registered nurses, which many NPs formerly were.

Such demand creates its own supply albeit with serious distortions

The problems result from the surging number of programs, which graduate thousands of NPs a year without adequately preparing some of them to care for patients. The former director of the largest NP program in the country says she can’t recall denying acceptance to a single student. More than 600 US schools graduated students with advanced nursing degrees in 2022, according to US Department of Education data. That’s triple the number of medical schools training physicians. More than 39,000 NPsgraduated in the 2022 class, according to the AANP, up 50% from 2017.

Unlike the training program for physicians, education for NPs isn’t standardized. Some candidates attend in-person classes at well-regarded teaching hospitals, but a much larger number are educated entirely online, sometimes via recorded lectures that can be years old. Interaction with professors is often limited to emails and message boards. These circumstances make the required clinical portion of an NP’s education even more important—but compared with doctors’ residencies, those stints are brief, and students say they’re of wildly variable quality. In 2022 the advanced nursing programs that awarded the most degrees were offered by institutions that deliver the classroom portion of instruction primarily over the internet…

Early waves of NP students were often experienced registered nurses seeking to increase their skills and responsibilities. But as demand spiked, more schools began offering “direct entry” programs that accepted students with a bachelor’s degree in unrelated fields. Today the fastest among them can prepare students for NP licensure exams in three years of education that encompasses a bachelor’s in nursing, registered nursing licensing (all NPs have to become RNs, even if they haven’t yet worked in the field) and a master’s in nursing. In 27 states, licensed graduates are allowed to treat patients and prescribe drugs with no physician oversight, even if they have no prior nursing experience… With a separate license from the Drug Enforcement Administration, NPs can also prescribe controlled substances. This license has made NPs particularly attractive to telemedicine companies… Students must obtain 500 clinical hours to graduate. That’s less than 5% of the amount required of medical doctors before they can practice medicine.

Fundamentally, the demand for NPs is driven by unit economics

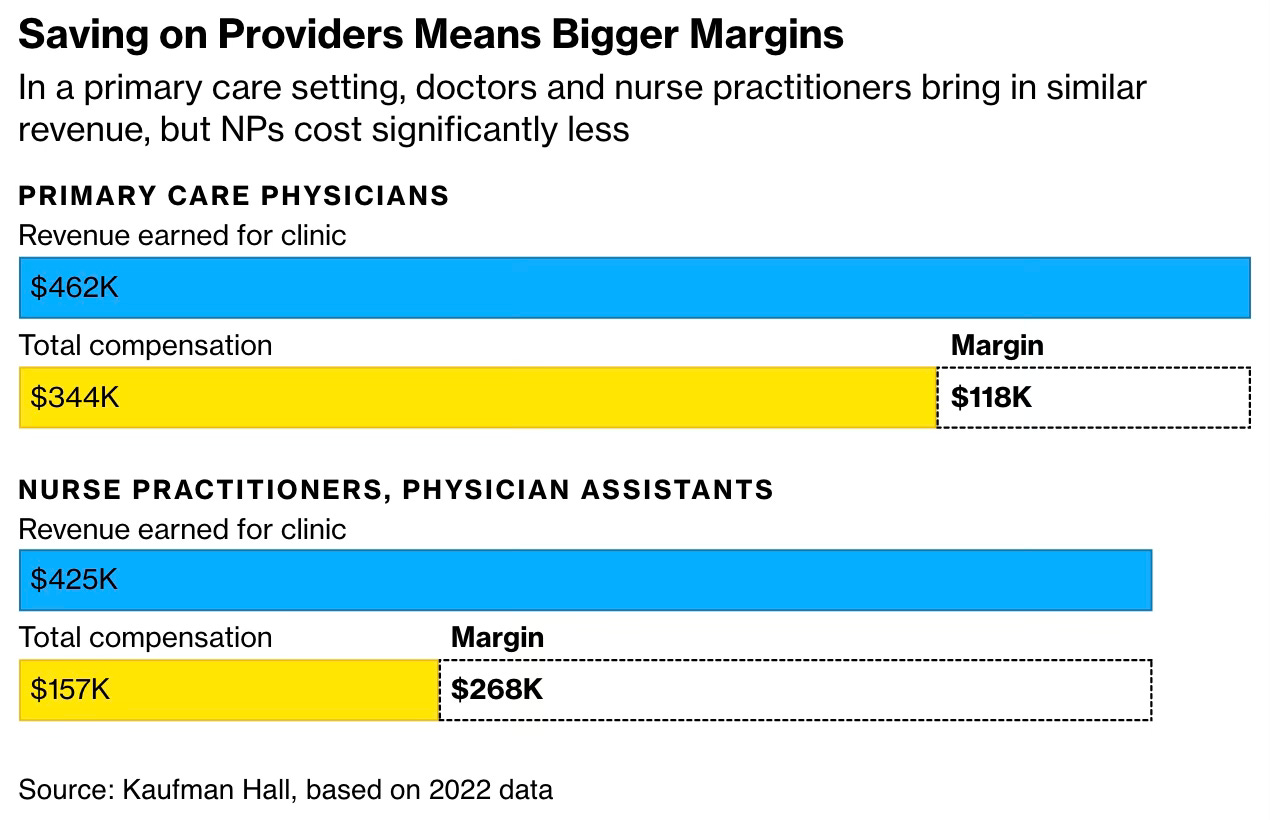
Physicians are in short supply, and NPs can fill the gap. There’s also a financial motivation. A primary care physician costs $344,308 a year, whereas a primary care NP costs about $156,546, according to 2022 data compiled by Kaufman Hall, a health-care consulting company. Yet primary care NPs can generate $424,979 of direct revenue a year, only $37,000 less than a physician. Put another way, NPs are twice as profitable.

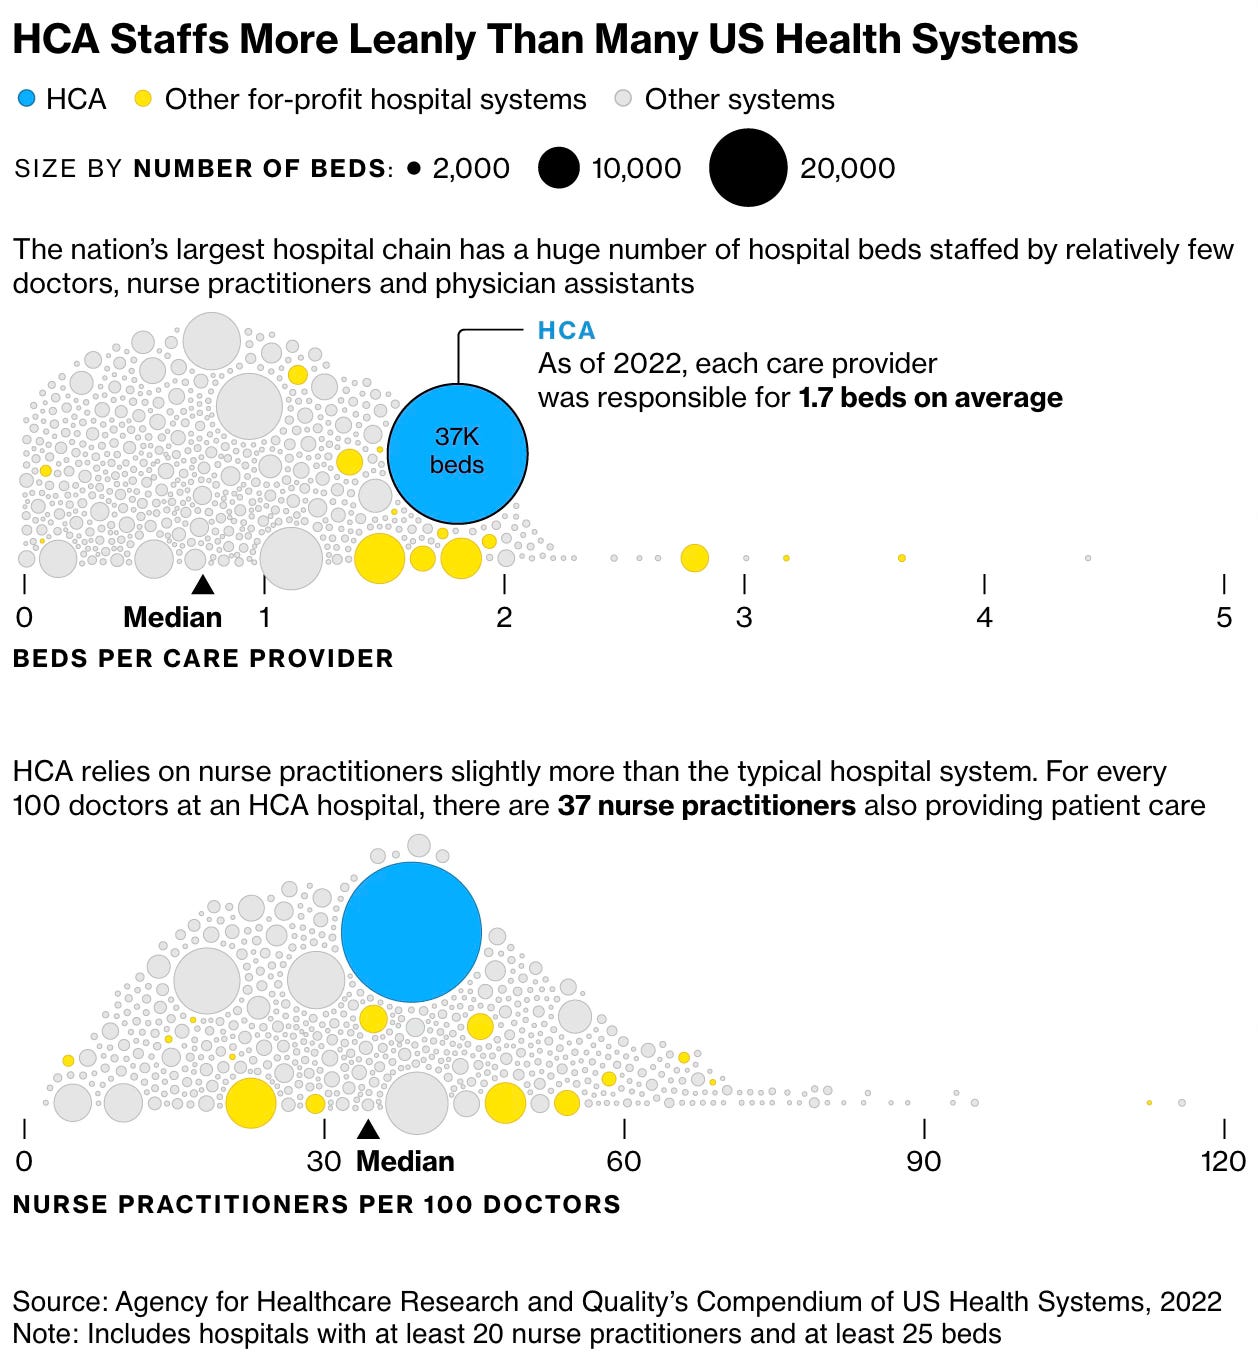
The largest US hospital chain, HCA, a for-profit firm, is illustrative of the extreme dependence on NPs.

This staffing pattern has soundly rewarded HCA’s shareholders.

The company has one of the lowest ratios of physicians and advanced practice providers (a catchall term for nurse practitioners and physician assistants) per bed among more than 600 US health-care systems that the federal government tracks. Registered nurses and other support staff aren’t included in that tally, but other government data that accounts for a wide range of roles also show HCA tends to staff leanly. It’s one reason HCA is widely regarded as one of the most efficient operators in its industry, with the largest profit margins of any American hospital chain that trades on the stock market. Shares have returned fivefold in the past decade, even after falling recently amid concerns about reduced Affordable Care Act subsidies.

With the advances in technology and data analysis, it has now become possible, in theory at least, to disaggregate the job of doctors and parcel many parts out to NPs and others.

Some HCA staff say the company is merely going where the data is taking it—a future with fewer medical doctors. This trend has been evident for years in primary care: Fewer physicians are pursuing it, and NPs have filled that role for many Americans. HCA staff who spoke to Businessweek said that shift is now underway in other practice settings. In many of them, “we will get to a point where there will be no physicians left,” says one executive who recently left HCA after several years at its Nashville headquarters and asked for anonymity to speak on the sensitive topic. “You just won’t have physician oversight, because we won’t have the supply.

The power of economies of scale and search for cost-minimisation has been a big driver of the historical evolution of HCA.

The Hospital Corp. of America was co-founded by Dr. Thomas Frist Sr. more than a half-century ago in Nashville. Frist, a cardiologist and internist, complained he had trouble getting his patients into nearby hospitals, so he opened his first for-profit hospital, a squat, five-story facility called Park View, as a remedy. Frist’s son Thomas Jr. saw the power in economies of scale, and the company started gobbling up more facilities. American health care has been bending Frist’s way ever since, and HCA’s value has soared. Thomas Jr. has become the world’s 56th-richest man, with a $30 billion fortune largely derived from his HCA shares. His younger brother, Bill, became majority leader in the US Senate, where he helped pass the Medicare Modernisation Act of 2003, allowing retirees to receive benefits through private insurers. The company’s gravitational pull has turned Nashville into the world’s unofficial headquarters of for-profit health care, drawing more than 900 companies to the area. Its own holdings have exploded, too, with more than 180 hospitals across several states, and a toehold in the UK. 

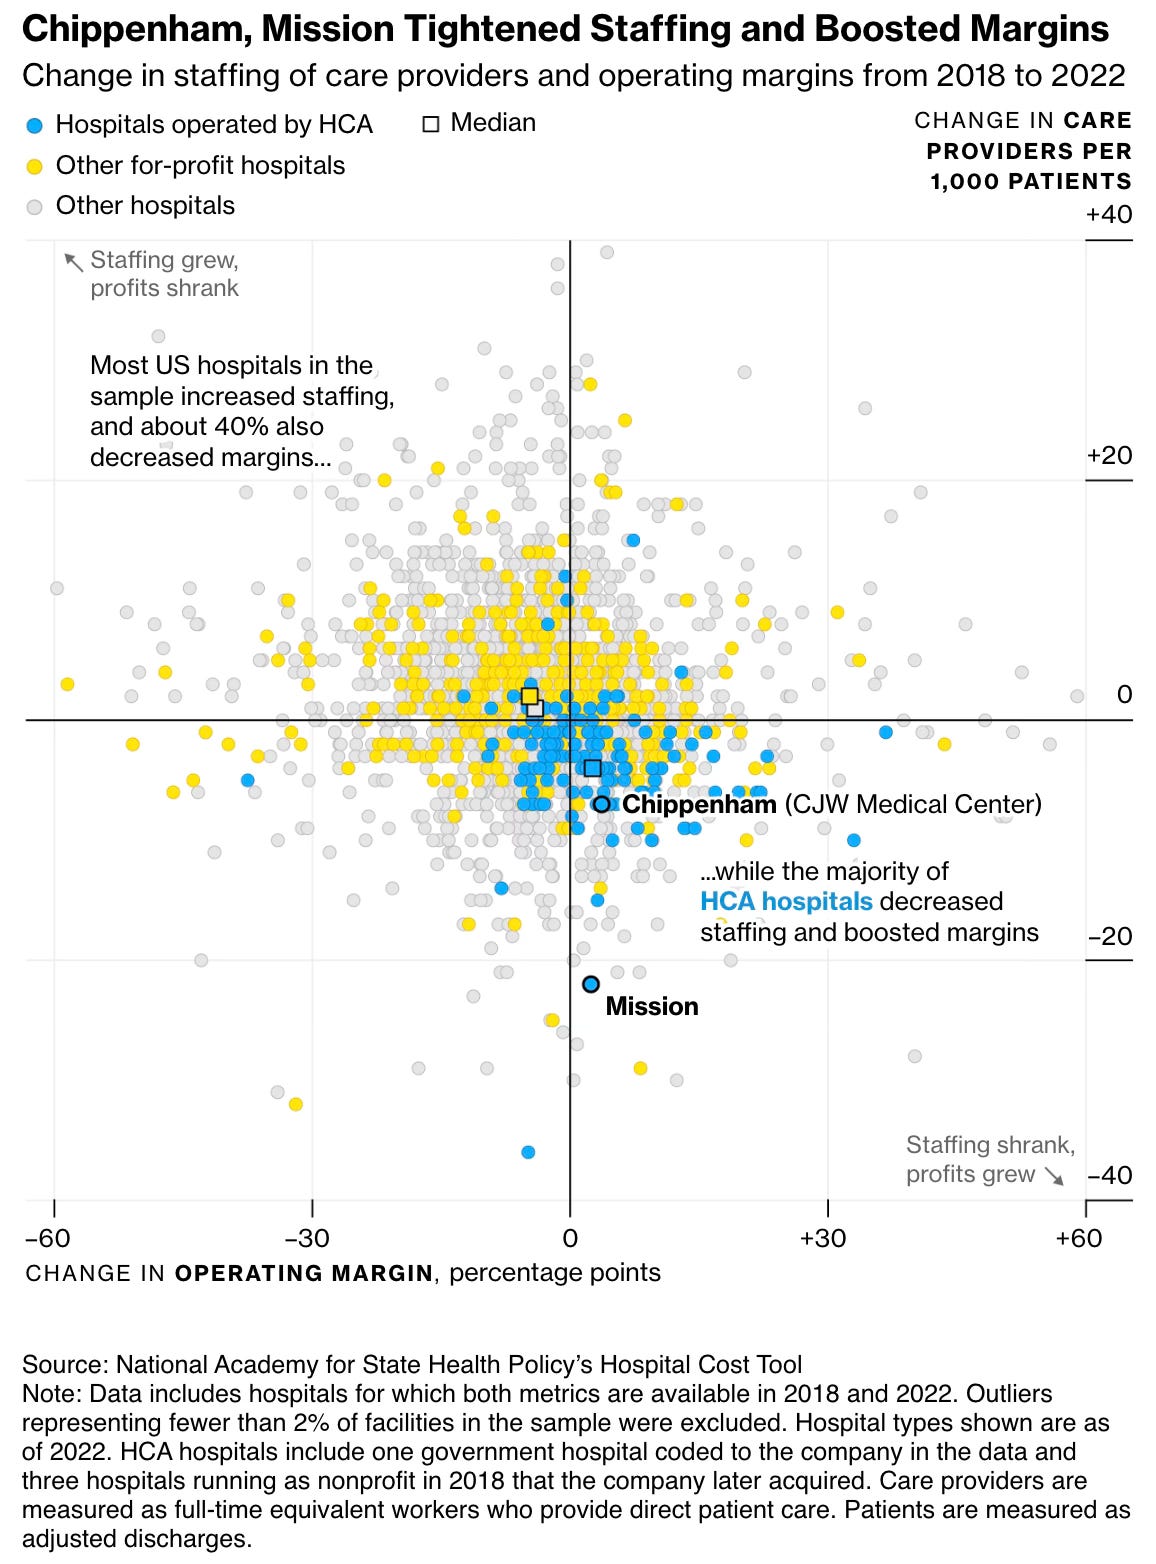
Within that portfolio, Chippenham and its affiliated facilities are a powerhouse, the company’s fifth-largest by revenue, federal data show. Closely watched from corporate headquarters, Chippenham executives have frequently been plucked for bigger roles, charged with running dozens of hospitals in HCA’s system. Big revenue doesn’t necessarily mean big resources. In Richmond, Chippenham’s emergency room has a troubling reputation. Current and former employees describe limited staffing and resources that guarantee they’ll be caring for patients in hall beds and in the waiting room on a nightly basis. Patients describe waits stretching for several hours amid blood smears and vomit bags… traveling nurses who have worked at several facilities told Businessweek that Chippenham stands out for its chaos and lack of resources and staff. Nurses in the hospital’s intensive care units describe getting “tripled” multiple times a week—being responsible for three patients at a time. The standard is two… Some of the nurses said they’d worked at nonprofit facilities that never tripled them. The problems were so well known that even some community members were wary. 

HCA’s acquisitions are good illustration of how its practices have transformed the healthcare sector for the worse (in this case dramatically worsening the quality of a highly reputed non-profit).

HCA’s makeover of Mission Health in Asheville, North Carolina, offers a vivid example of how the company’s staffing strategies can affect caregivers, patients and the company’s bottom line. In 2019, HCA paid about $1.5 billion for Mission Health, a nonprofit system with several facilities and a reputation as one of the Southeast’s premier health-care centers. HCA executives promised to preserve Mission’s quality while boosting profits by using the corporation’s size to deliver better “purchasing power and back-office efficiencies.” 

Soon, HCA began drastic staff reductions at the system’s flagship facility, Mission Hospital, and conditions deteriorated rapidly, according to a lawsuit filed by the state attorney general. Wait times in the emergency room swelled, nurse-to-patient ratios in ICUs often fell to half the state minimum, and surgeons reported they frequently lacked sterile medical instruments because of cuts to the cleaning staff, the lawsuit said. When HCA executives brushed aside complaints from Mission board members and employees, two-thirds of its physicians left, according to a research paper published by Mark Hall, director of the Health Law and Policy Program at Wake Forest University. Mission’s emergency room was so severely understaffed that it jeopardized patient safety, a federal investigation concluded…

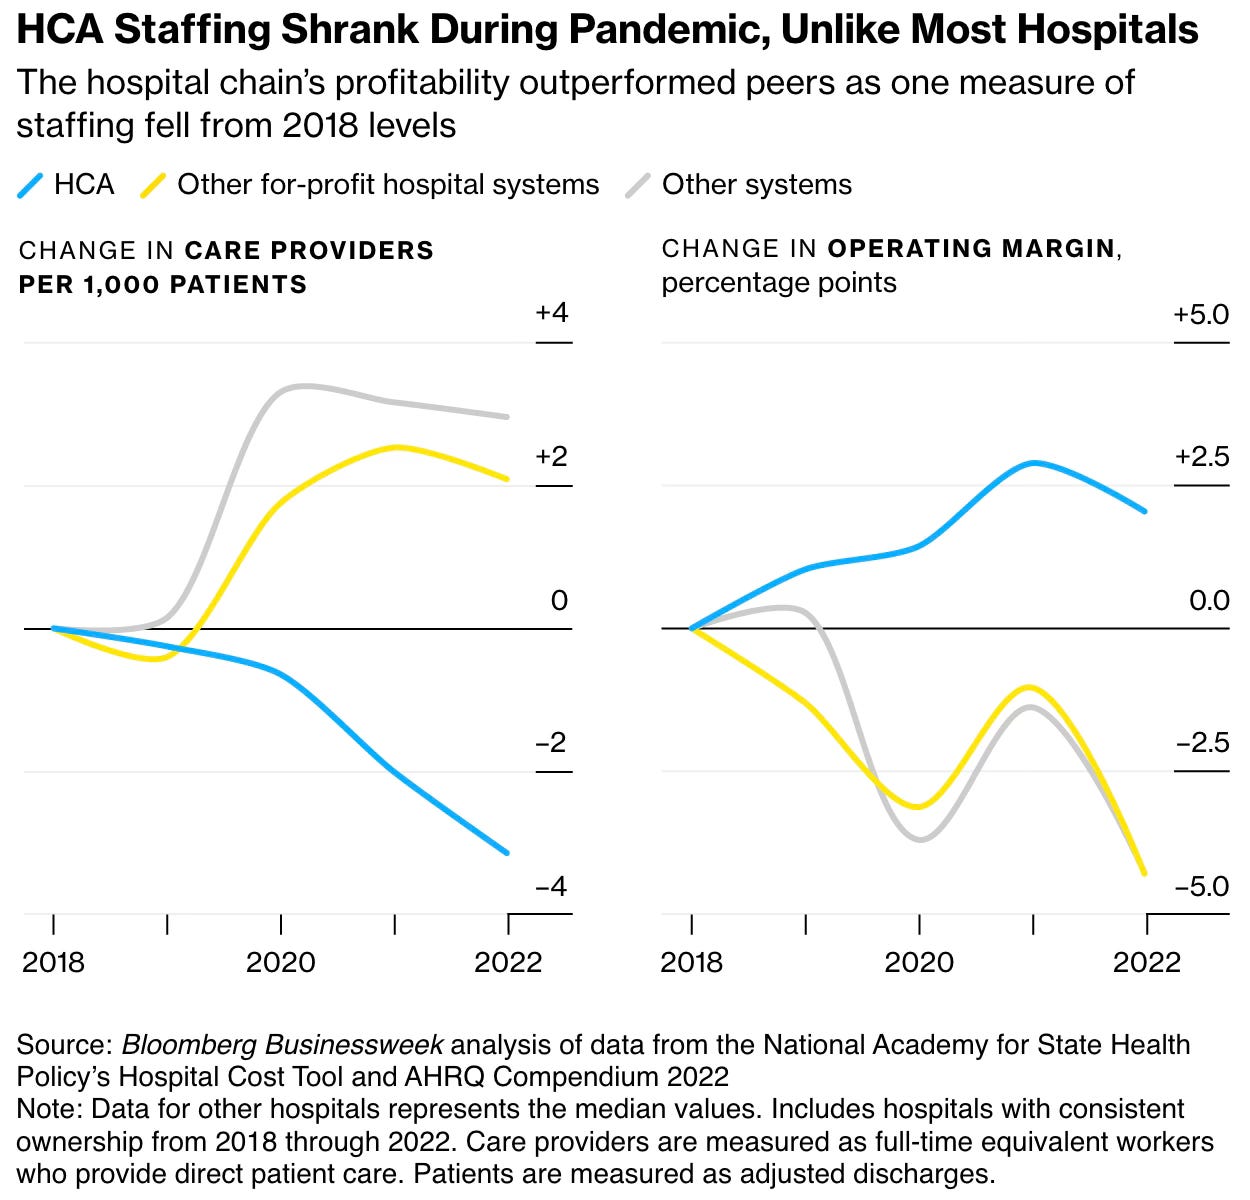
The drastic reductions in Mission’s labor costs were a boon to the hospital’s finances. In the four years before the sale, Mission earned an average of $38 million in profit from patient care. In 2022, Mission’s profit reached $96 million, driven primarily by “sharply reduced staffing for patient care under HCA,” according to Hall’s research.

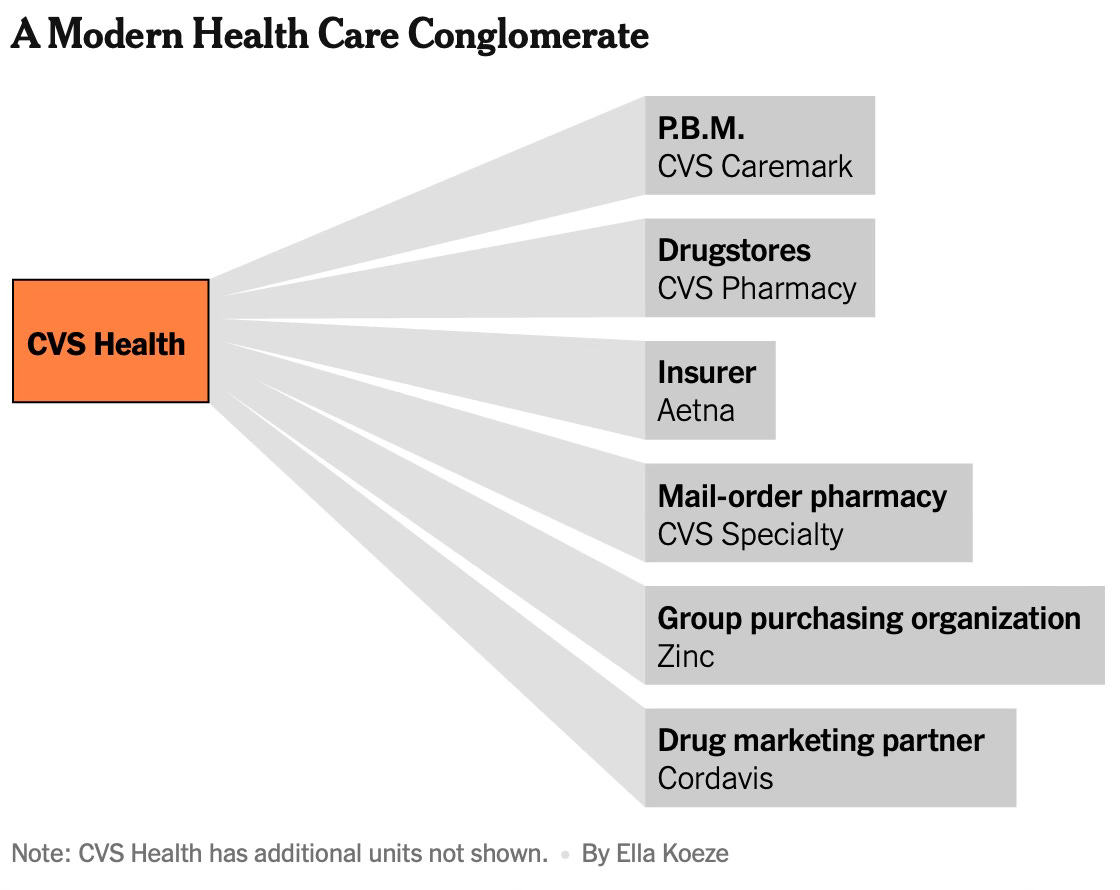
This graphic captures how HCA increased profitability across its network hospitals using these practices. 

The PBMs intermediate the insurance for prescription drugs by negotiating with drug companies, paying pharmacies, and helping decide which drugs patients can get at what price. The three largest ones - CVS Health, Cigna and UnitedHealth Group - oversee prescriptions for more than 200 million Americans and control nearly 80% of the market, up from less than 50% in 2012. 

P.B.M.s sometimes push patients toward drugs with higher out-of-pocket costs, shunning cheaper alternatives… Even when an inexpensive generic version of a drug is available, P.B.M.s sometimes have a financial reason to push patients to take a brand-name product that will cost them much more… They often charge employers and government programs like Medicare multiple times the wholesale price of a drug, keeping most of the difference for themselves. That overcharging goes far beyond the markups that pharmacies, like other retailers, typically tack on when they sell products. The largest P.B.M.s recently established subsidiaries that harvest billions of dollars in fees from drug companies, money that flows straight to their bottom line and does nothing to reduce health care costs. 

The P.B.M.s, which are responsible for paying pharmacies on behalf of employers, are driving independent drugstores out of business by not paying them enough to cover their costs. Small pharmacies have little choice but to accept these lowball rates because the largest P.B.M.s control an overwhelming majority of prescriptions. The disappearance of local pharmacies limits health care access for poorer communities but ultimately enriches the P.B.M.s’ parent companies, which own drugstores or mail-order pharmacies. P.B.M.s sometimes delay or even prevent patients from getting their prescriptions. In the worst cases, patients suffer serious health consequences… Even people who don’t take prescription drugs end up paying higher insurance premiums and taxes as a result of inflated drug costs… If they were stand-alone companies, the three biggest P.B.M.s would each rank among the top 40 U.S. companies by revenue.

This description of the evolution of PBMs is instructive.

P.B.M.s have been around since the late 1950s. They initially handled requests mailed in by pharmacies and patients seeking reimbursement for the costs of prescription drugs. Over the decades, P.B.M.s have had different owners, including drug makers and large chains of pharmacies… The modern P.B.M. emerged in 2018. The giant health insurers Aetna and Cigna were trying to achieve the growth demanded by Wall Street. They sought to merge with the P.B.M.s, whose profits were soaring. Aetna and CVS combined. Cigna bought Express Scripts. (UnitedHealth had built its own P.B.M.)

It would turn out to be a seminal moment, one that would rapidly and radically change the American health care system by further shifting power into the hands of giant conglomerates and away from employers and patients. Today, P.B.M.s feed off a system where everything is extraordinarily complicated — including how much a drug actually costs.

The PBMs have evolved business models that allow them to obsfuscate and capture a significant share of the discounts obtained from drugs manufacturers. They have set up subsidiaries to negotiate discounts with drug manufacturers.

The creation of the subsidiary, Emisar, has allowed UnitedHealth to retain billions of dollars of those savings, without having to share them with employers. Emisar and similar subsidiaries established by Express Scripts and Caremark are known as group purchasing organizations, or G.P.O.s. They were created, starting in 2018, amid growing pressure from employers to share with them more of the manufacturers’ discounts. In response, the P.B.M.s altered their business model. The new subsidiaries still received rebates from drug companies, and they passed on those rebates to the P.B.M.s, which in turn sent the savings to employers. But the G.P.O.s also began imposing new fees on drug manufacturers. 

Because those were fees, not rebates, and because the fees were technically collected by a different company, the P.B.M.s weren’t contractually obligated to share them with their clients. And the P.B.M.s could truthfully say that they were returning to employers almost all of the drug companies’ rebates. They didn’t have to mention the fees… In 2022, P.B.M.s and their G.P.O.s pocketed $7.6 billion in fees, double what they were bringing in four years earlier, according to Nephron, a consulting firm… Emisar operates mainly in Ireland, and Express Scripts’ Ascent is in Switzerland, which means their profits are taxed at much lower rates than if they were generated in the United States… When drug companies paid more in fees, they offered less in rebates… Employers… receive rebates. But they can’t see the billions of dollars in fees that the G.P.O.s take for themselves…

The conglomerates that own the big P.B.M.s also own pharmacies. CVS has thousands of drugstores. And all three operate warehouse-based pharmacies that send prescriptions to patients through the mail. The three P.B.M.s push, and sometimes force, patients to use their pharmacies, whether mail-order or, in CVS’s case, the physical drugstores. One common strategy is to not allow patients to receive 90-day supplies of drugs if they fill prescriptions at outside pharmacies… One surefire way for the P.B.M. or its in-house pharmacy to profit is to charge thousands of dollars more than what a drug costs… The steepest markups often involve generic versions of expensive medications for conditions like cancer.

This article shows how PBMs have been systematicallt underpaying small pharmacies (how much the drugstores are reimbursed for medications), driving them out of business. This, in turn, benefits the largest PBMs who also run competing pharmacies. 

In every state, The Times identified at least one example since 2022 in which an independent drugstore closed and the pharmacist blamed P.B.M.s. In some states, like Pennsylvania, such closings have become routine. They have disproportionately affected rural and low-income communities, creating so-called pharmacy deserts that make it harder for residents to get prescriptions and medical advice.

One study, paid for by a pharmacy association, found that the markup that P.B.M.s were charging on brand-name drugs was 35 times higher when the drugs were sold through their own mail-order pharmacies than when the drugs were sold by independent drugstores. Government studies have identified a similar phenomenon… The benefit managers decide which pharmacies are available to patients through their insurance. To be included, a pharmacy must agree to a contract with the P.B.M. that details the formula for how much the pharmacy will be reimbursed for drugs… Because the top P.B.M.s collectively control the overwhelming majority of prescriptions, pharmacies that forfeit their business could not survive.

The closure of small pharmacies have left communities without any drug stores.

Nearly 800 ZIP codes that had at least one pharmacy in mid-2015 now have none, according to an analysis of pharmacy data by Luke Slindee, a consultant who has been tracking pharmacy closings around the country… When small drugstores close, communities can be harmed in ways that are hard to measure. Getting your flu shot becomes less convenient. As residents grow accustomed to traveling long distances for their medications, they do more of their other shopping far away from home, draining revenue from local businesses. Relying on mail-order pharmacies deprives customers of an easy way to get advice from a trusted local pharmacist… Research has found that after pharmacies close, their older customers are less likely to consistently fill their prescriptions and end up missing doses… Even when a small pharmacy stays in business, low reimbursement from P.B.M.s can make it harder for its customers to get their medications. Many small drugstores sidestep their contracts with P.B.M.s and decline to dispense certain medications — especially high-cost brand-name products for conditions like diabetes and obesity — because they lose money on them. Customers must go elsewhere.

Some observations 

1. The evolution of PBMs from being small payment-handling intermediaries to mega-firms with interests all along the prescription drug supply chain has not only not delivered the promised benefits in terms of efficiencies and value sharing across the chain but has also left patients, employers, and insurers with higher costs. Similarly, the emergence of massive hospital networks, far from transmitting benefits across stakeholders from economies of scale, has engendered perversions like substituting away from higher-cost doctors towards lower-cost NPs, besides seriously worsening the quality of care. 

2. There’s a fundamental problem with the pure financial metrics-driven business growth strategy in sectors where quality of service delivery is critical. The exclusive and obsessive focus on financial metrics will invariably lead the management down the path of cost-cutting and revenue maximisation. In this efficiency maximisation drive, and especially in large systems and where quality of service is critical, it’s hard not to avoid skimping on things that are central to quality. 

The example of the increased use of NPs across hospital networks in the US is yet another example on the perils of such efficiency maximisation. As the articles show, the disaggregation of the doctor’s work and parcelling some parts of it out to NPs ends up seriously eroding the quality of care delivered. Besides, the sharp differential in the costs of doctors and NPs will invariably incentivise pushing the boundaries on substituting the doctor with the NP.

3. Firm size in itself (and the associated detached and impersonal management) is a problem in services where quality is critical. In such services, personalised care and engagement is a critical value proposition. No technological innovation or business structure can be a substitute. The small hospital networks and independent pharmacies bring attributes critical to the effectiveness of service quality that the large firms cannot replicate. 

4. A market dominated by a few large conglomerate firms will invariably distort incentives and engender dynamics that will hurt consumer welfare. Vertical and horizontal integration with opaque ownership and accounting disperses costs and accountability across the conglomerate. It engenders market failure and is a recipe for perversions like price gouging, cross-selling, profit maximisation etc. 

In general, the ownership and management structure of massive PBMs and hospital networks will tend to generate excessive efficiency and profit-maximisation impulses that detract from quality and consumer welfare. It’s very difficult, even impossible, to achieve the balance between shareholder and stakeholder value maximisation, and the latter invariably falls aside with time. It’s almost the inexorable logic of capitalism, one which gets exacerbated by private equity ownership. 

5. The rapid expansion of the supply side in any sector where service delivery quality is critical is fraught with problems. It resonates with the troubled examples of multiple instances when state and central governments in India have sought to rapidly increase the institutions (and seats) offering engineering, medical, nursing, and other professional courses. 

When done at scale and too quickly, blended learning and online instruction approaches are likely to struggle to meet the fidelity requirements. Baumol’s cost disease is real in sectors like education and there are hard limits to the application of technology to address the problem.

6. The example of HCA should serve as a cautionary tale for those who preach the ideology of the superiority of for-profit companies. The degeneration in the quality of service of Mission Health, a reputed non-profit hospital network, after being bought by HCA and turning for-profit is an apt case study. 

It’s an oft-repeated ideological argument in countries like India that its education system can be improved by permitting for-profit institutions. The US for-profit hospital networks and Nursing Colleges are good examples of the problems with the introduction of profit incentives to sectors like healthcare and education.
Monday, September 16, 2024

R&D expenses, productivity, and growth in the age of Big Tech

Econ 101 informs us that R&D investments spur innovation and productivity growth, which in turn lower production costs and create newer products, boost consumption, drive further investments, job creation and economic growth. In short, R&D investments and innovation trigger a virtuous loop.

Gillian Tett points to an interesting paradox that questions this conventional wisdom that R&D investments invariably result in innovation, productivity growth, and expansion of economic output. Sample some numbers.

On the one hand, American R&D has risen in recent decades, from 2.2 per cent of GDP in the 1980s to 3.4 per cent in 2021. That reflects a doubling of private sector R&D to 2.5 per cent of GDP. Meanwhile, the proportion of the population involved in patent production nearly doubled in this period. But there is a big catch. Although “conventional economic models” imply that increases in R&D spending on this scale “should have led to accelerated economic growth”, this has not occurred. Michael Peters, a Yale economist, lays out the grim news: while labour productivity rose on average by 2.3 per cent between 1947 and 2005, between 2005 and 2018 it fell to 1.3 per cent. This cost America a putative $11tn of output, he calculates.

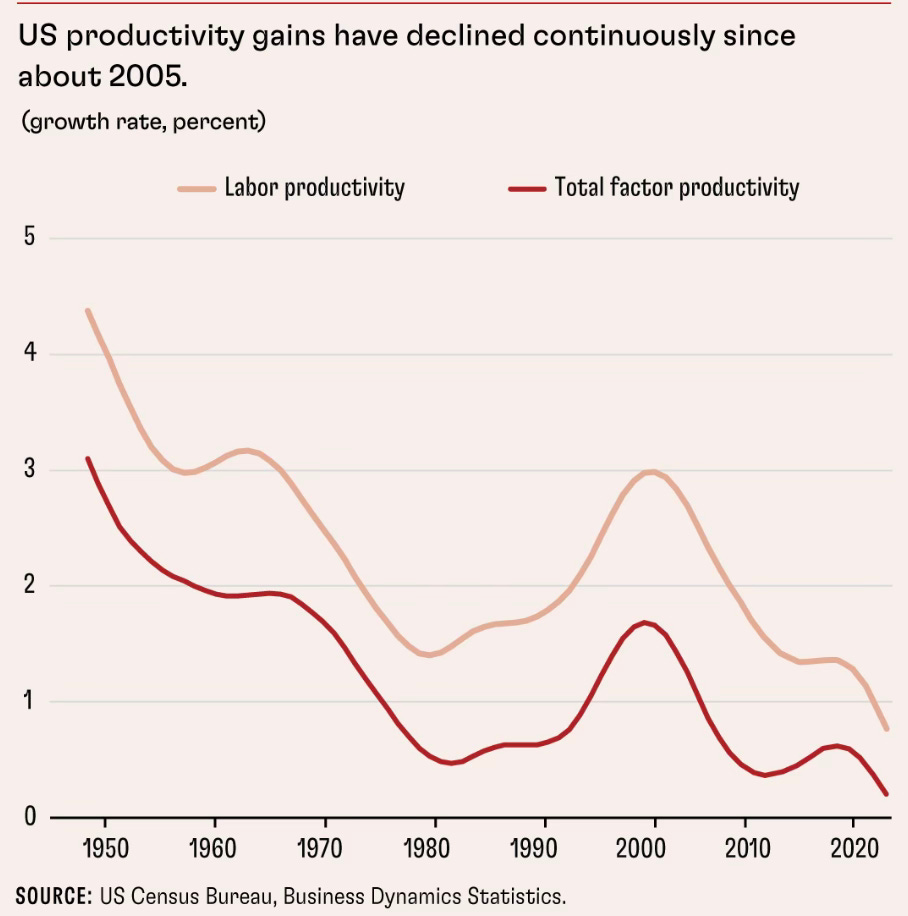
Micheal Peters in the IMF’s latest F&D magazine points to the US productivity growth being on a secular decline, that has become pronounced during the digital age since the turn of the millennium.

There is growing evidence that the US economy is not as dynamic as it used to be. A key aspect of business dynamism is new business formation. It is often measured by the entry rate, or the share of enterprises that started operating in a given year. The entry rate fell from 13 percent in 1980 to 8 percent in 2018, according to the US Census Bureau. In addition, US enterprises became substantially larger, with the average number of employees rising from 20 in 1980 to 24 by 2018. Older and bigger companies thus account for a much larger share of economic activity than they used to. These trends indicate significantly declining dynamism in the US economy over almost four decades…

First, the rise in corporate concentration has been shown to go hand in hand with expanding market power. The average markup by publicly traded US companies surged from about 20 percent in 1980 to 60 percent today. Large incumbent businesses thus seem to be shielded more and more from competition, allowing them to jack up prices and widen profit margins. A second line of research shows the flip side of rising corporate market power: the weakening of workers’ bargaining position. Since 1980, labor’s share of the US economy has fallen by about 5 percentage points. The plunge was faster in industries that experienced more concentration… Third, there has been a secular decline in business-to-business reallocation since the late 1980s, as shown in a series of papers by John Haltiwanger and other researchers. This suggests that the process of workers moving from declining to expanding businesses is not as fluid and dynamic as it once was.  

Peters also explores the possible causes for this productivity decline.

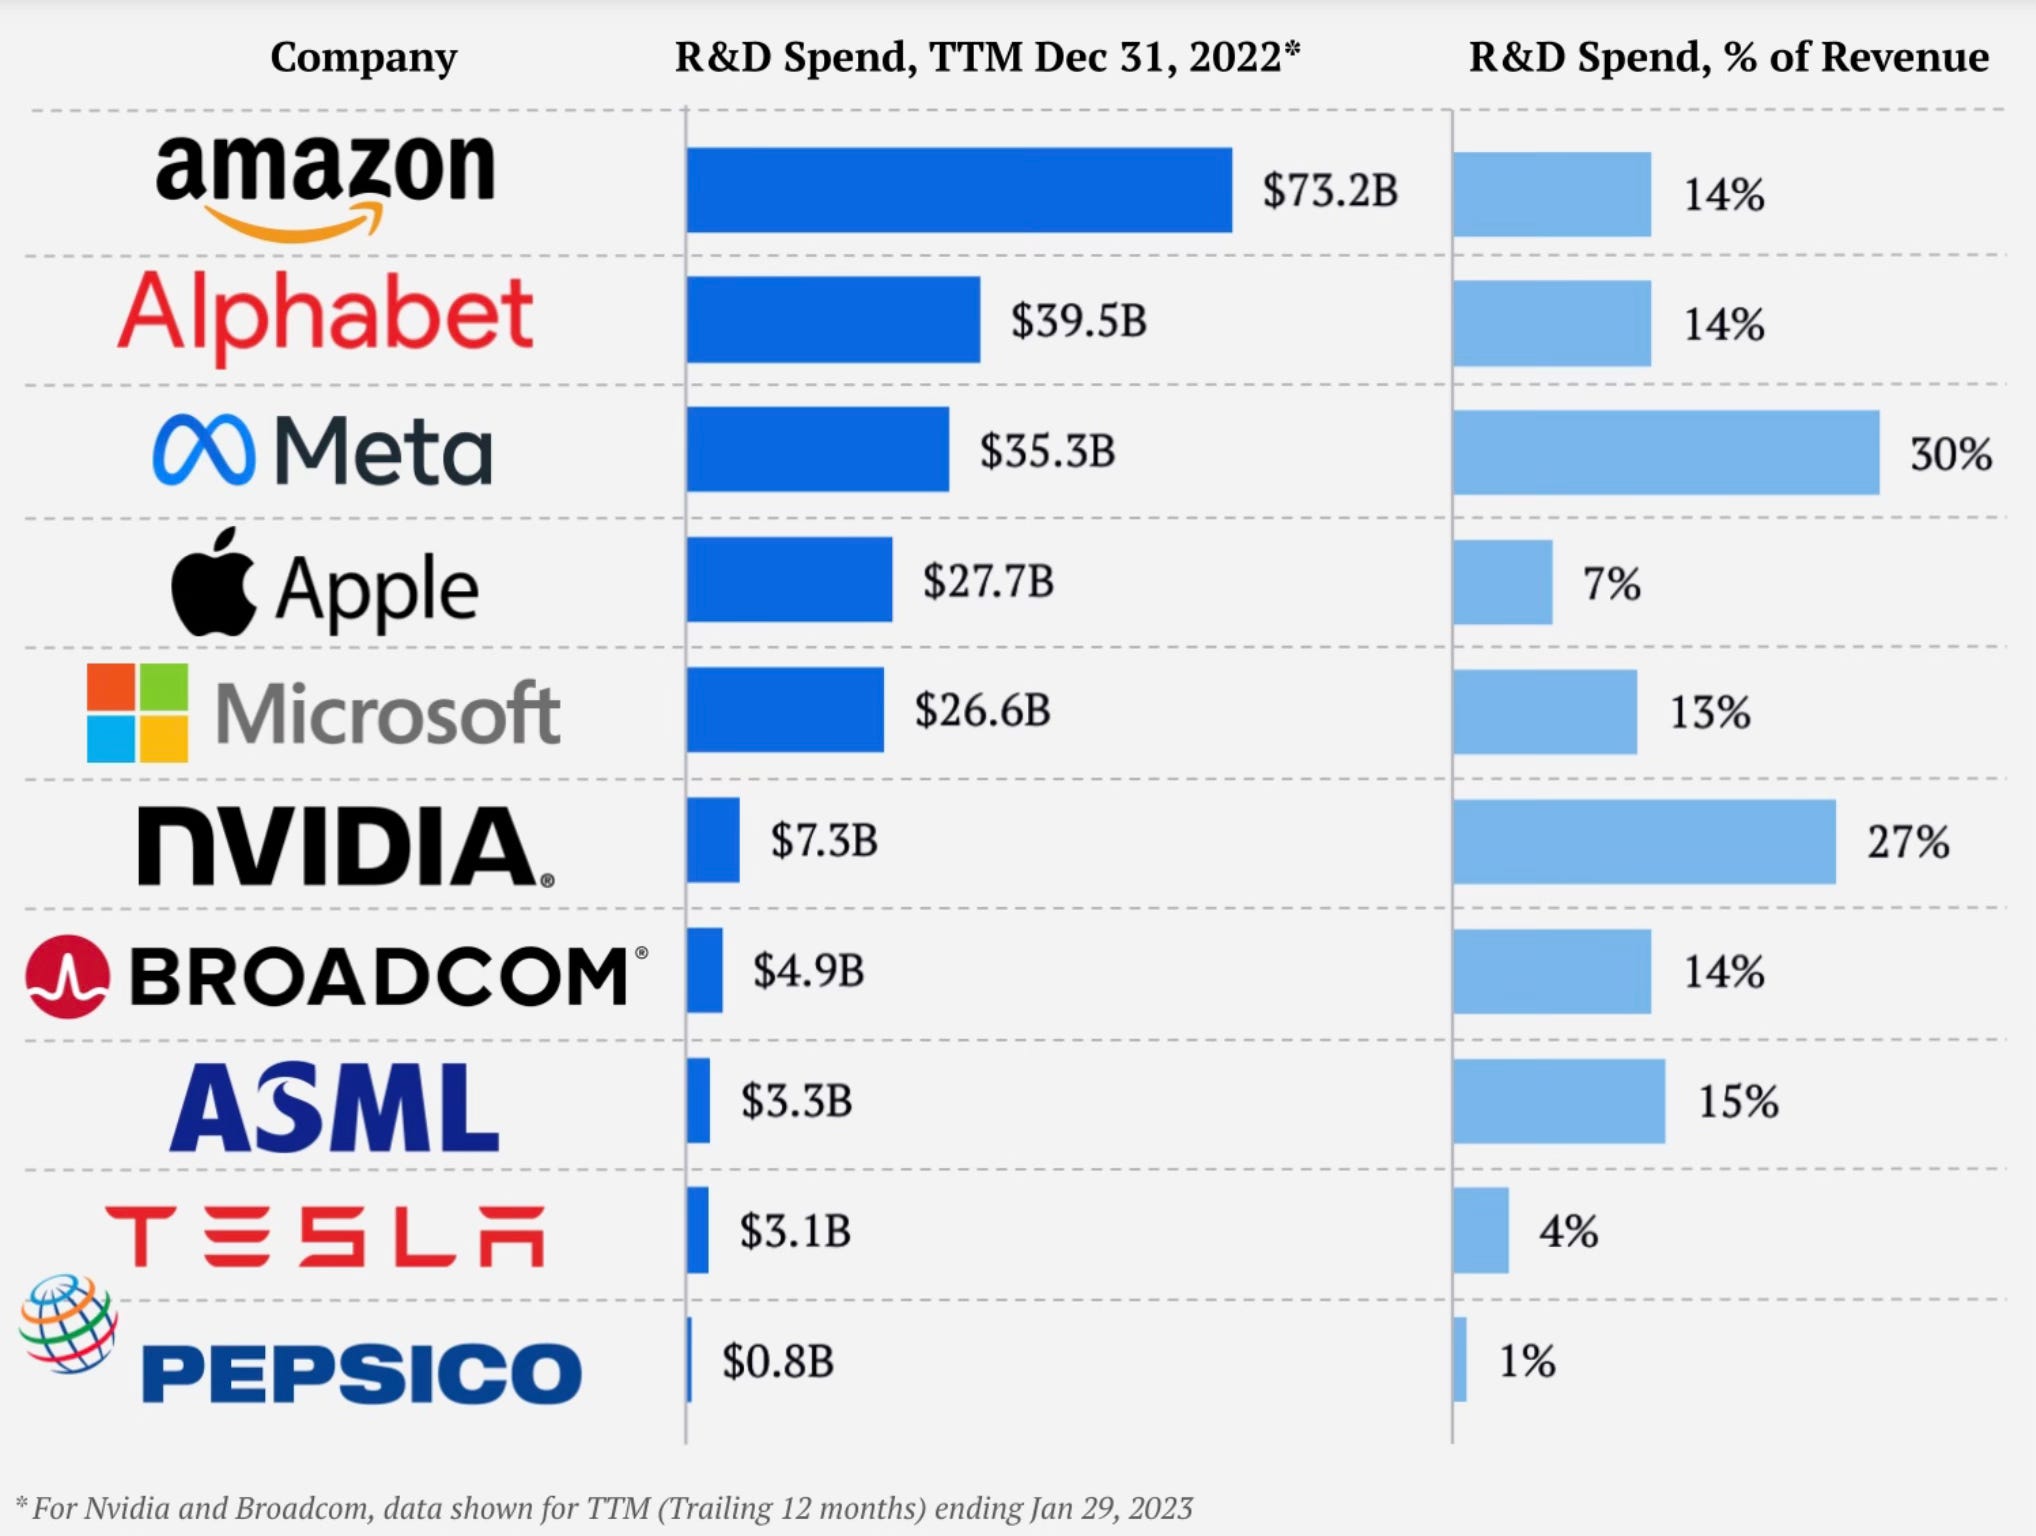
The ten biggest tech companies by capitalisation in Nasdaq spent a total of $222 bn in R&D in 2022, of which Amazon alone spent $73.2 bn. 

Remarkably, these kinds of R&D expenditures have not been accompanied by job creation. As an illustration, even as Amazon, Microsoft, and Alphabet spent a record $139.3 bn on R&D, the three laid off 40,000 workers at the beginning of 2023. 

Germán Gutiérrez and Thomas Philippon measured the evolution of dominant firms in the US since 1960 (top 20 firms by global sales and top 4 firms in each 3-digit industry) and globally since 1990 (top 100 firms by global sales in a given year and the top 20 firms in 25 industries), and found that their contribution to aggregate productivity growth has fallen by more than one-third since 2000. 

In another paper Philippon writes

I estimate that markups in the United States have increased by about 12% since 2000. Such an increase in markups implies that wages and consumption are at least 10% below their potential… increasing markups in the United States have lowered labor income by about $1.44 trillion… the stars of the digital economy—Amazon, Google, Facebook, Apple, and Microsoft (GAFAMs for short)—are not as “special” as one might think… Along all qualitative dimensions, including profit margins and productivity, the stars of today are… they are smaller than market leaders of the past, and they matter less for overall GDP growth than General Motors, IBM, or AT&T did at their peak… rising market concentration since the early 2000s has produced market inefficiencies. Dominant firms have succeeded in erecting barriers to entry, which has resulted in lower investment, higher prices, and slower productivity growth.

Given the aforementioned facts, here are some observations:

1. Joel Mokyr has made the distinction of useful knowledge as one that promotes material progress. It consists of propositional knowledge (“what”) and prescriptive knowledge (“how”), with the former consisting of people who know things (savants) and the latter of people who make things (fabricants). He uses this distinction to explain why the Industrial Revolution originated in England and not in continental Europe. On the same lines, it may be useful to make the distinction within R&D investments and categorise some as useful R&D. Ditto with innovation. 

Are R&D expenditure and innovation increasing the economic output? Is it creating jobs? Or is it being used to create moats around the markets served by the big technology companies? Given the nature of the digital technology markets, with their network effects and the advantages conferred by access to large data, are the large R&D expenditures conferring an unbridgeable advantage to the large incumbents?

There’s a case for distinguishing between defensive and productive R&D, with the latter aimed at protecting the turf/market. More on this latter in the post.

2. In the last 2-3 years, there has been a surge in AI-related R&D investments. As the graph above shows, each of the US Big Tech firms - Amazon, Alphabet, Apple, Microsoft, Meta, Nvidia etc. - have been making AI-related investments in the tens of billions of dollars every year. So much so that the entire US equity market is now riding almost entirely on the AI investment boom. However several questions are being raised about the likely value generation from these investments. The vast majority of commentators view this boom as being driven by FOMO and disconnected from any value creation. 

Is it then the case that the returns from R&D investments, or their productivity, have declined? Or is it that the technology will take time to mature and start to show its benefits? Or more generally, are large firms being inefficient in their allocation of R&D expenditures? Or a combination of all three?

Ufuk Akcigit writes in the same issue of the IMF’s F&D magazine:

In earlier research, Harvard’s William Kerr and I found that small businesses are more innovative relative to their size, suggesting they use R&D resources more efficiently. As companies grow and dominate their markets, they often shift their focus from innovation to protecting their market position. In a more recent study, Salome Baslandze, Francesca Lotti, and I showed using Italian data that larger enterprises tend to innovate less and instead engage in activities that limit competition. One such activity is hiring local politicians. As businesses climb the ranks among the largest 20 players in their industry, they hire more politicians, while their patent production declines. This highlights what we call a leadership paradox, where leading companies plow resources into maintaining dominance rather than fostering innovation… As dominant players prioritize strategic moves over genuine innovation, the economy as a whole is almost certainly missing out on potential growth opportunities.

3. Most importantly, it’ll be useful to examine where these R&D investments are going. These are astronomical sums, larger than the entire R&D expenditures of several large countries combined, including those like India. Are they actually going into research and development? Or is it some accounting trick to benefit from tax rules?

The primary reason to doubt these numbers is a palpable absence of their signatures on the products and services being delivered. Has e-commerce, social media engagement experience, and internet search got so much better in say, the last five years, to justify even a small part of these expenditures? Does building and maintaining data centres (whose buildings and operations are outsourced to PE funds and their boring infrastructure contractors) demand such levels of R&D expenditures?

It’s hard to imagine or rationalise that e-commerce, social media, and internet search (and advertising) can consume anything even remotely close to the amounts being spent on R&D. One associates with R&D in digital technologies to some equipment and software costs, and considerable manpower costs. Even at the higher end of such expenditures, $73.2 bn (and similarly high numbers in earlier years) appears mind-boggling. So where is this likely coming from (or what’s it going into)? 

A comment on a discussion thread in Hacker News nails it:

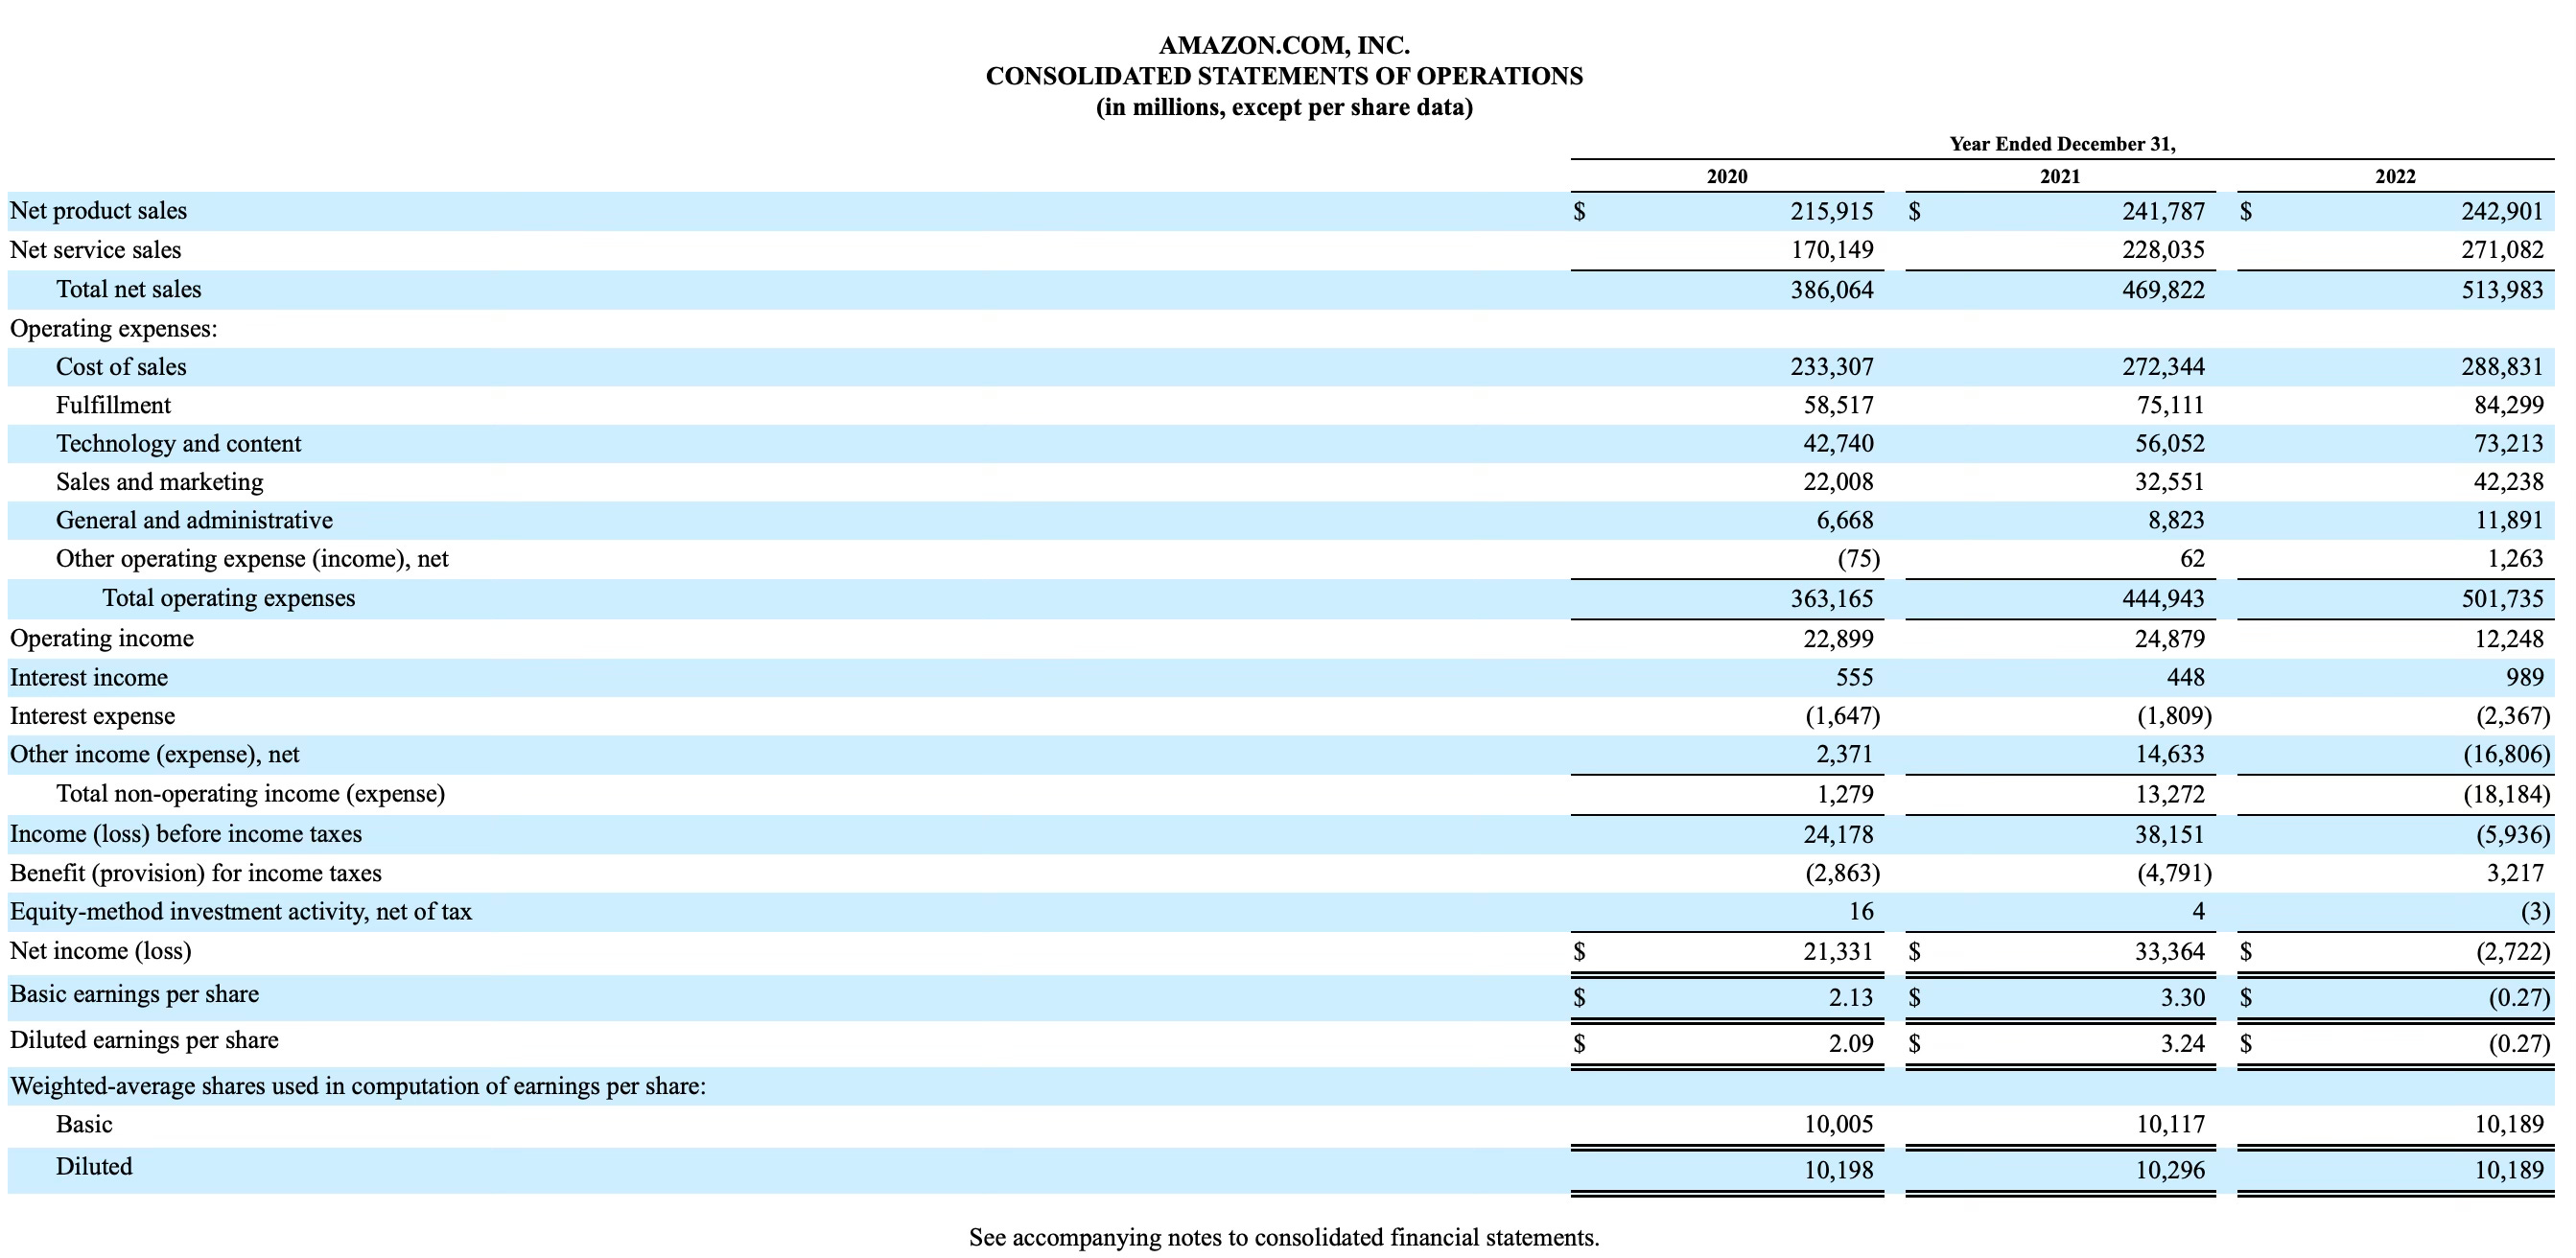
This $73.2B figure was pulled directly from their 2022 10-K filing under an operating expenses line item labeled technology and content, which includes R&D and then some. The devil in the details is buried in a footnote on p. 26:

Technology and content costs include payroll and related expenses for employees involved in the research and development of new and existing products and services, development, design, and maintenance of our stores, curation and display of products and services made available in our online stores, and infrastructure costs. Infrastructure costs include servers, networking equipment, and data center related depreciation and amortization, rent, utilities, and other expenses necessary to support AWS and other Amazon businesses.

At face value, to handwave this figure as just R&D and purport that it's directly comparable to other publicly-traded companies who report disaggregated research and development strikes me as somewhere between shotgun analysis and hoodwinking.

Read this Forbes article which says the same things, and see this. 

Here is the table indicated above.

Amazon spends large amounts on its AWS data centres. All those expenditures are lumped together into the basket of technology and content. Even its prime Video content is classified under R&D. In short, it appears that Amazon lumps all its personnel, software and hardware costs under R&D. 

Is all this disingenuous accounting motivated by tax minimisation strategies adopted by these companies? Is Amazon benefiting from the greater tax benefits accorded to R&D expenses? Akcigit again

The Federal Reserve’s Sina Ates and I examined market competition trends in the US over the past several decades. Since the early 1980s, there’s been a noticeable increase in market concentration and a decline in business dynamism… This period aligns with the 1981 introduction of the R&D tax credit, a component of President Ronald Reagan’s sweeping Economic Recovery Tax Act. The credit was intended to encourage businesses to invest in research and development. Minnesota was the first state to adopt a similar state-level R&D tax credit, in 1982, and many other states followed, expecting to promote innovation and economic growth. Which companies are most likely to take advantage of the R&D tax credit? Our research with Goldschlag shows that large businesses are much more likely to benefit than smaller ones. The policy—perhaps unintentionally—favors big companies, encouraging them to dominate in R&D spending… Our research provides direct evidence that businesses actively claiming R&D tax credits are more likely to engage in stifling hiring practices. These enterprises often offer higher salaries to inventors, and the inventors become less innovative after joining.

It’s therefore clear that all the so-called R&D expenditures are mostly about the general operational and capital expenses! So after all, real R&D expenditures might not have gone up as much as we imagine, which also explains the apparent paradox of low productivity growth. 

4. In this context, it’s also worth making the distinction between the R&D expenditures of firms in digital technology and traditional economy sectors. Technology firms like those above are constantly iterating and improving their algorithms and user interfaces (and the logistics operations in the case of Amazon and advertising engine in the case of Google) as part of their regular operations. The nature of digital technologies (for example, with digital trails that serve as fuel for data analytics and AI-algorithms) ensures such iteration and refinement. 

There’s an indistinguishable line between the R&D expenditures of technology firms and their operational expenses. It’s different from the distinct role of R&D in the traditional economy where it’s about inventing new technologies, products, and services. The likes of Amazon, Meta, Alphabet, Apple etc., have not brought out any new product, but are only marginally refining their algorithms and at best moving into emerging adjacent markets (where too they have a head start due to the nature of their platform business models). They are, for all practical purposes, one trick ponies.

This raises the need for greater clarity in the accounting of R&D expenses of digital technology firms. 

5. One of the surprisingly less discussed but widely known features of technology markets today is the stifling grip exercised by the big firms. This hold covers hiring and retaining critical personnel, patent acquisition, protection of their own patents, and even protecting themselves from being gobbled up. Big Tech (and large incumbents generally) firms employ armies of lawyers to engage in the likes of patent trolling, squatting, and hoarding to copy, steal and intimidate startups. 

More from Ufuk Akcigit

Over the past two decades, there has been a notable reallocation of innovative resources toward large, established companies, Goldschlag and I documented in 2022. At the beginning of this century, roughly 48 percent of American inventors worked for these big incumbent companies—those that are more than 20 years old and employ more than 1,000 workers. By 2015, that figure had surged to 58 percent, marking a significant shift in where the nation’s innovative talent is concentrated… research shows a concerning trend: inventors that move to large firms become less innovative compared with inventors that move to young firms.

A specific practice identified in our research is innovation-stifling hiring. This occurs when big, established enterprises hire key employees from younger competitors, often by offering higher salaries. However, instead of using these new employees to drive innovation, the big businesses may place them in roles that do not fully leverage their skills. As a result, these individuals become less innovative, and the overall innovative capacity of the economy suffers. After 2000, there was a notable increase in the wage premium offered by established companies, compared with salaries paid by younger businesses. The pay differential widened by 20 percent, prompting many innovators to switch jobs and join larger, well-established companies. However, these inventors’ innovativeness dropped by 6 percent compared with that of their peers who joined younger employers… By hiring away top talent from rivals, these companies not only weaken their competitors but also prevent these individuals from contributing to potentially disruptive innovations elsewhere. This strategy may benefit the hiring business in the short term, but it poses a long-term risk to the economy’s overall innovation and growth. 

Given all these, startups stand little or no chance of competing with large incumbents. It’s an open secret that the Big Tech firms unleash their lawyers and financiers to intimidate and squeeze any startup trying to compete with them. I don’t know whether the libertarians and tech evangelists who wax eloquent about digital utopia and lose no opportunity to argue for deregulation and getting government out of the way are being ignorant or disingenuous or plain dishonest when they overlook the egregious manner in which Big Tech firms unleash their lawyers and corporate brokers to intimidate startups. 

Why are none of the economists in the big Economics Departments silent about one of the commonest market practices which is also the biggest threat to competition in digital markets?

I have written here (and here) about how Amazon uses anti-competitive practices to copy and forcibly buyout emerging startup competitors and then kill off their technologies or adopt them itself. 

The final word to Akcigit

The evidence suggests that while the US is investing more in R&D, the concentration of resources among large businesses has led to diminishing returns in terms of productivity growth. This outcome challenges the assumption that simply expanding R&D spending will automatically lead to economic growth. Instead, it highlights the need for a more nuanced approach to industrial policy—one that not only incentivizes R&D but also encourages the effective reallocation of resources. To foster a more dynamic and innovative economy, the US needs to design policies that support not just large incumbents but also smaller businesses and start-ups, which often have a greater capacity for disruptive innovation. This could include targeted tax credits for small businesses, grants for early-stage innovation, and policies that encourage competition and reduce barriers to entry for new players.