Substack

Showing posts with label Competitiveness. Show all posts

Friday, July 24, 2026

The cost of doing business in India - land prices

I blogged here, highlighting the high cost structure that Indian businesses face. This post dives deeper and examines land cost.

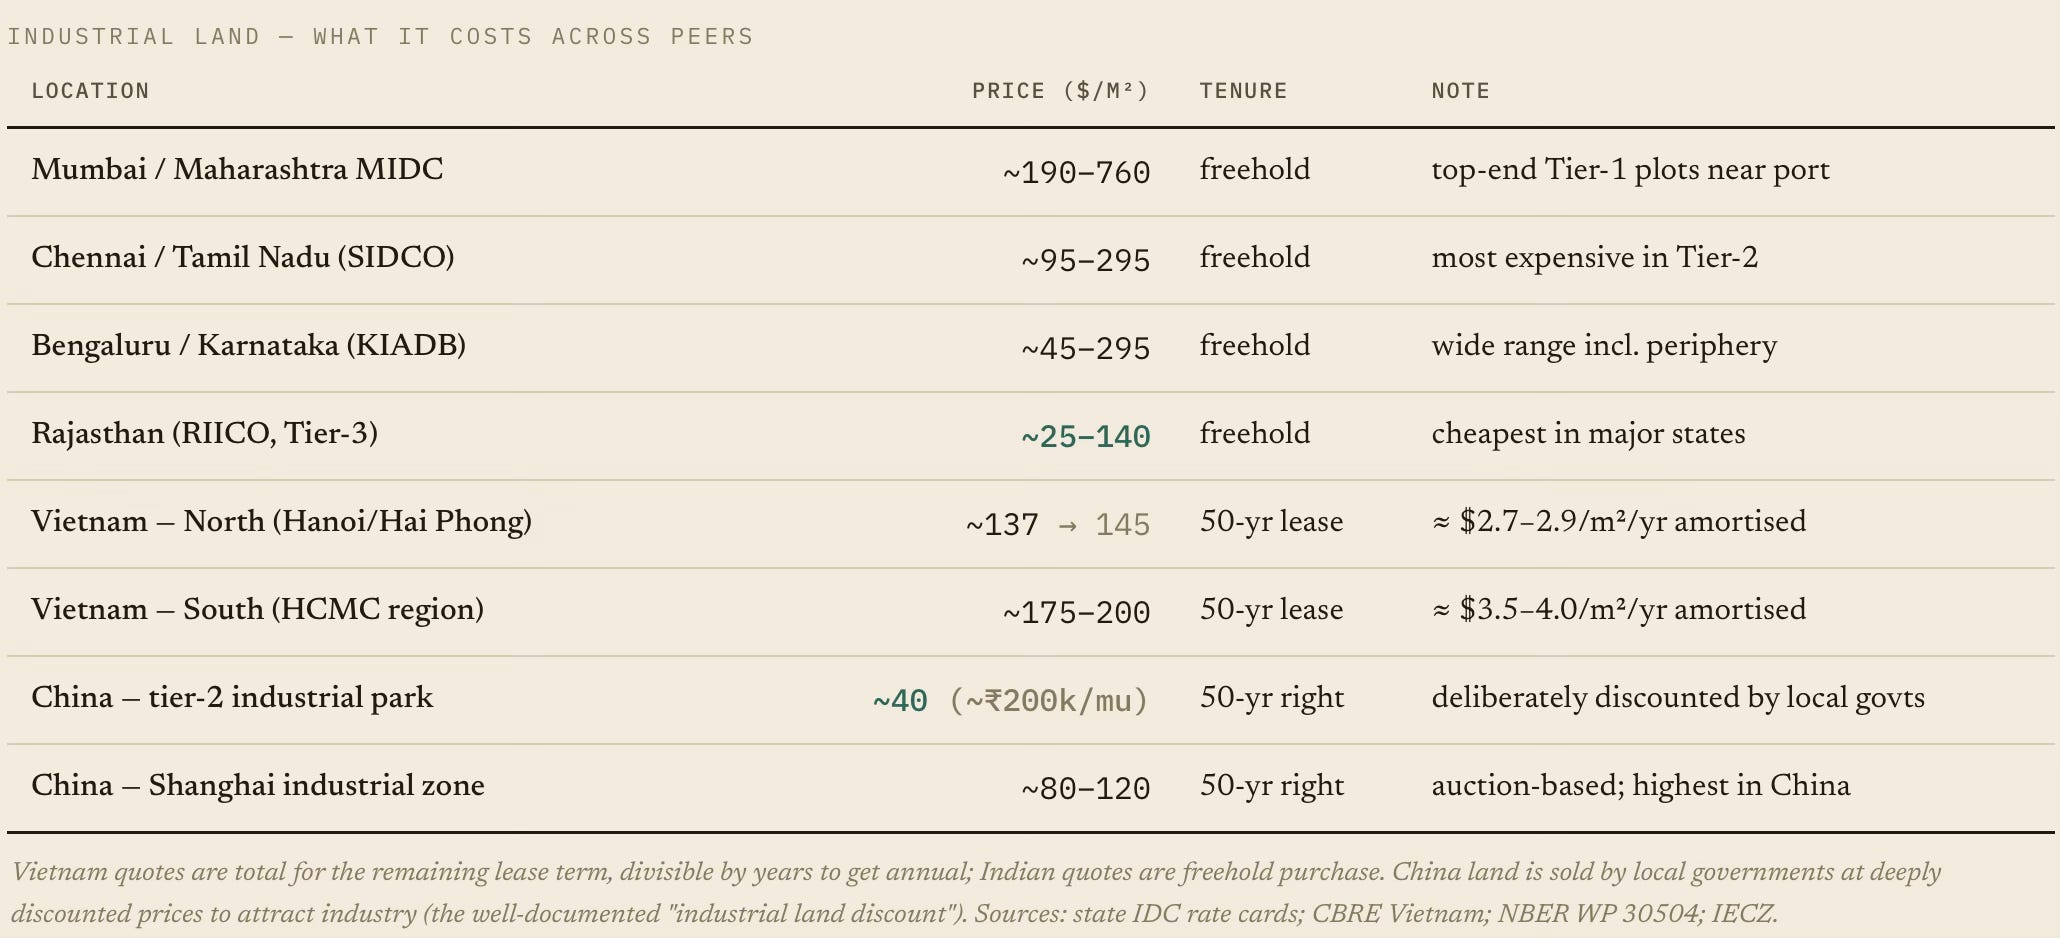
A comparison with peers shows that urban land is priced like that of a rich country and ends up hoarding the nation's savings, with 77% of the households parking their wealth in real estate. Mumbai ranks among the world's 20 most expensive prime markets. Industrial land across the major Indian cities is prohibitively expensive compared to peers.
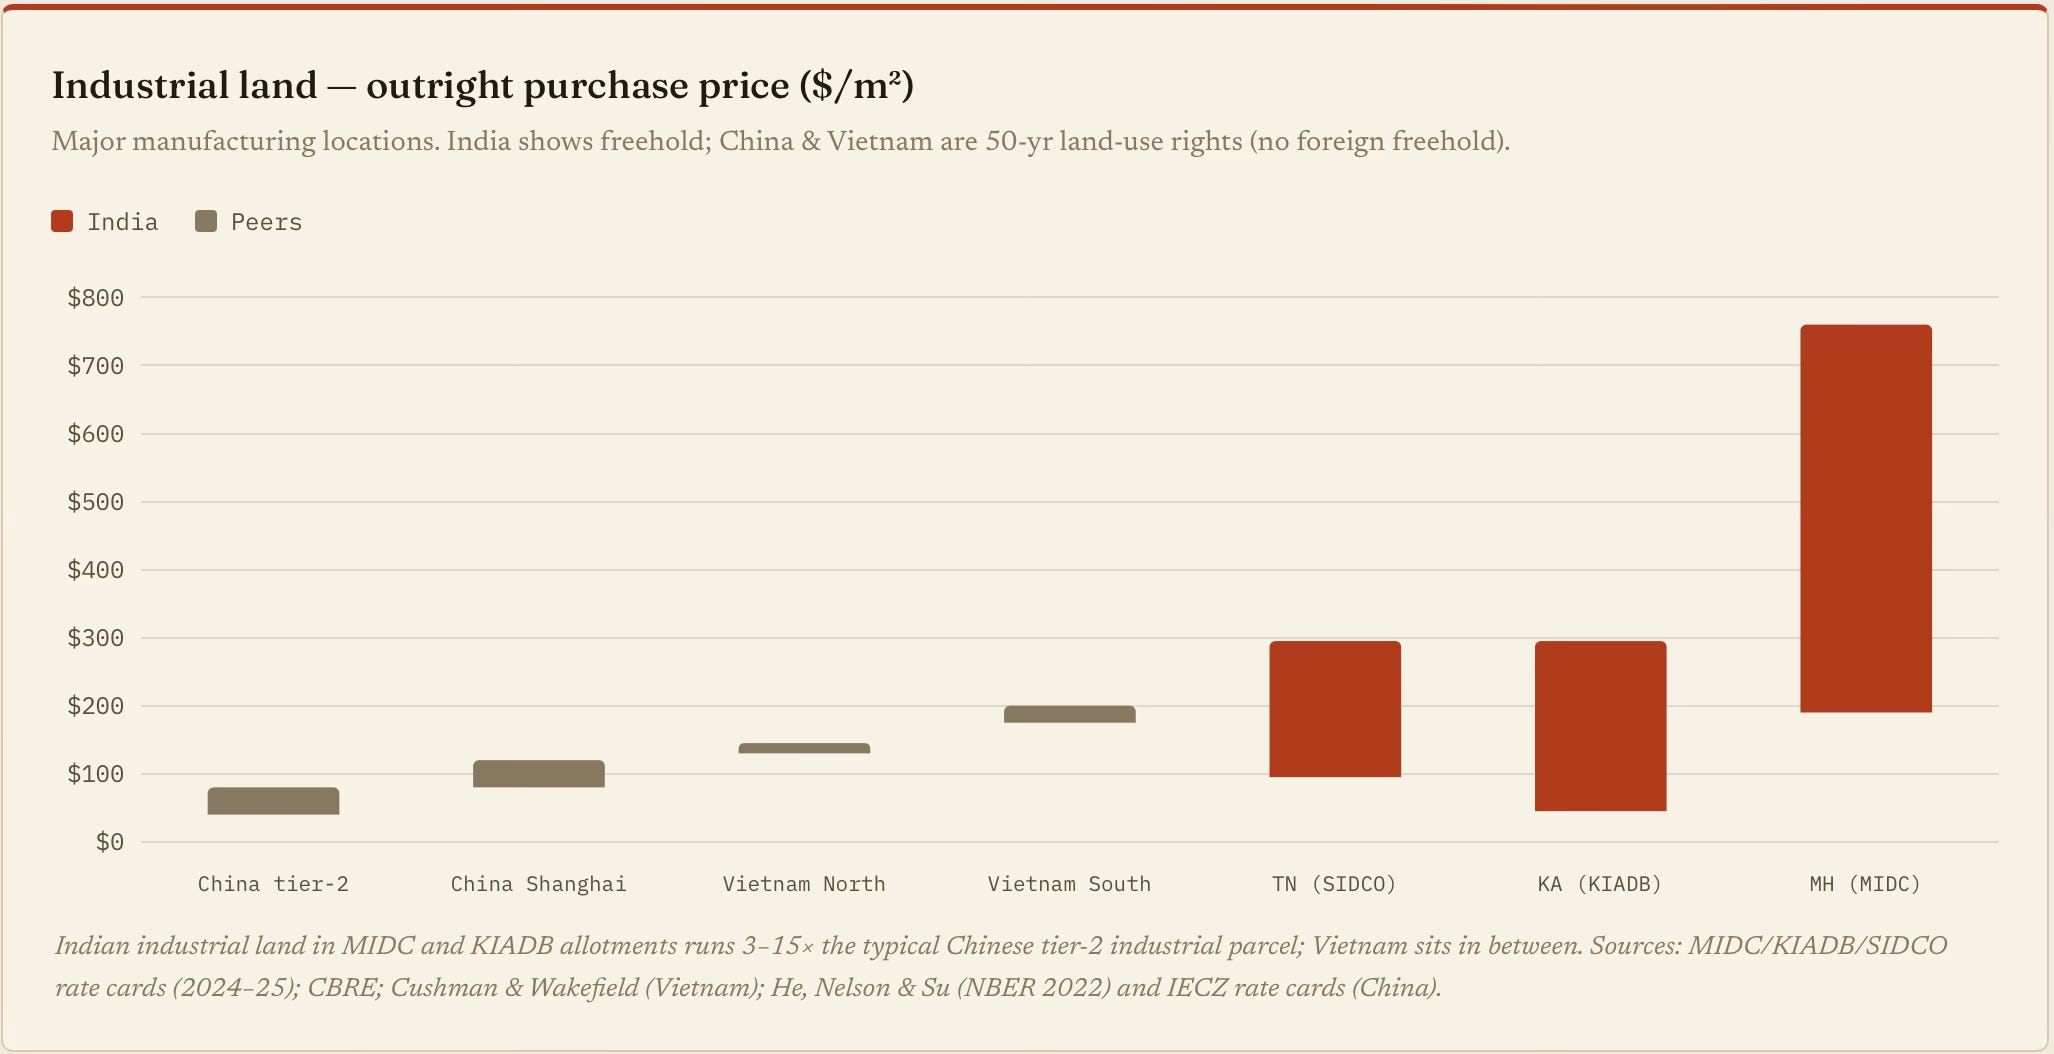
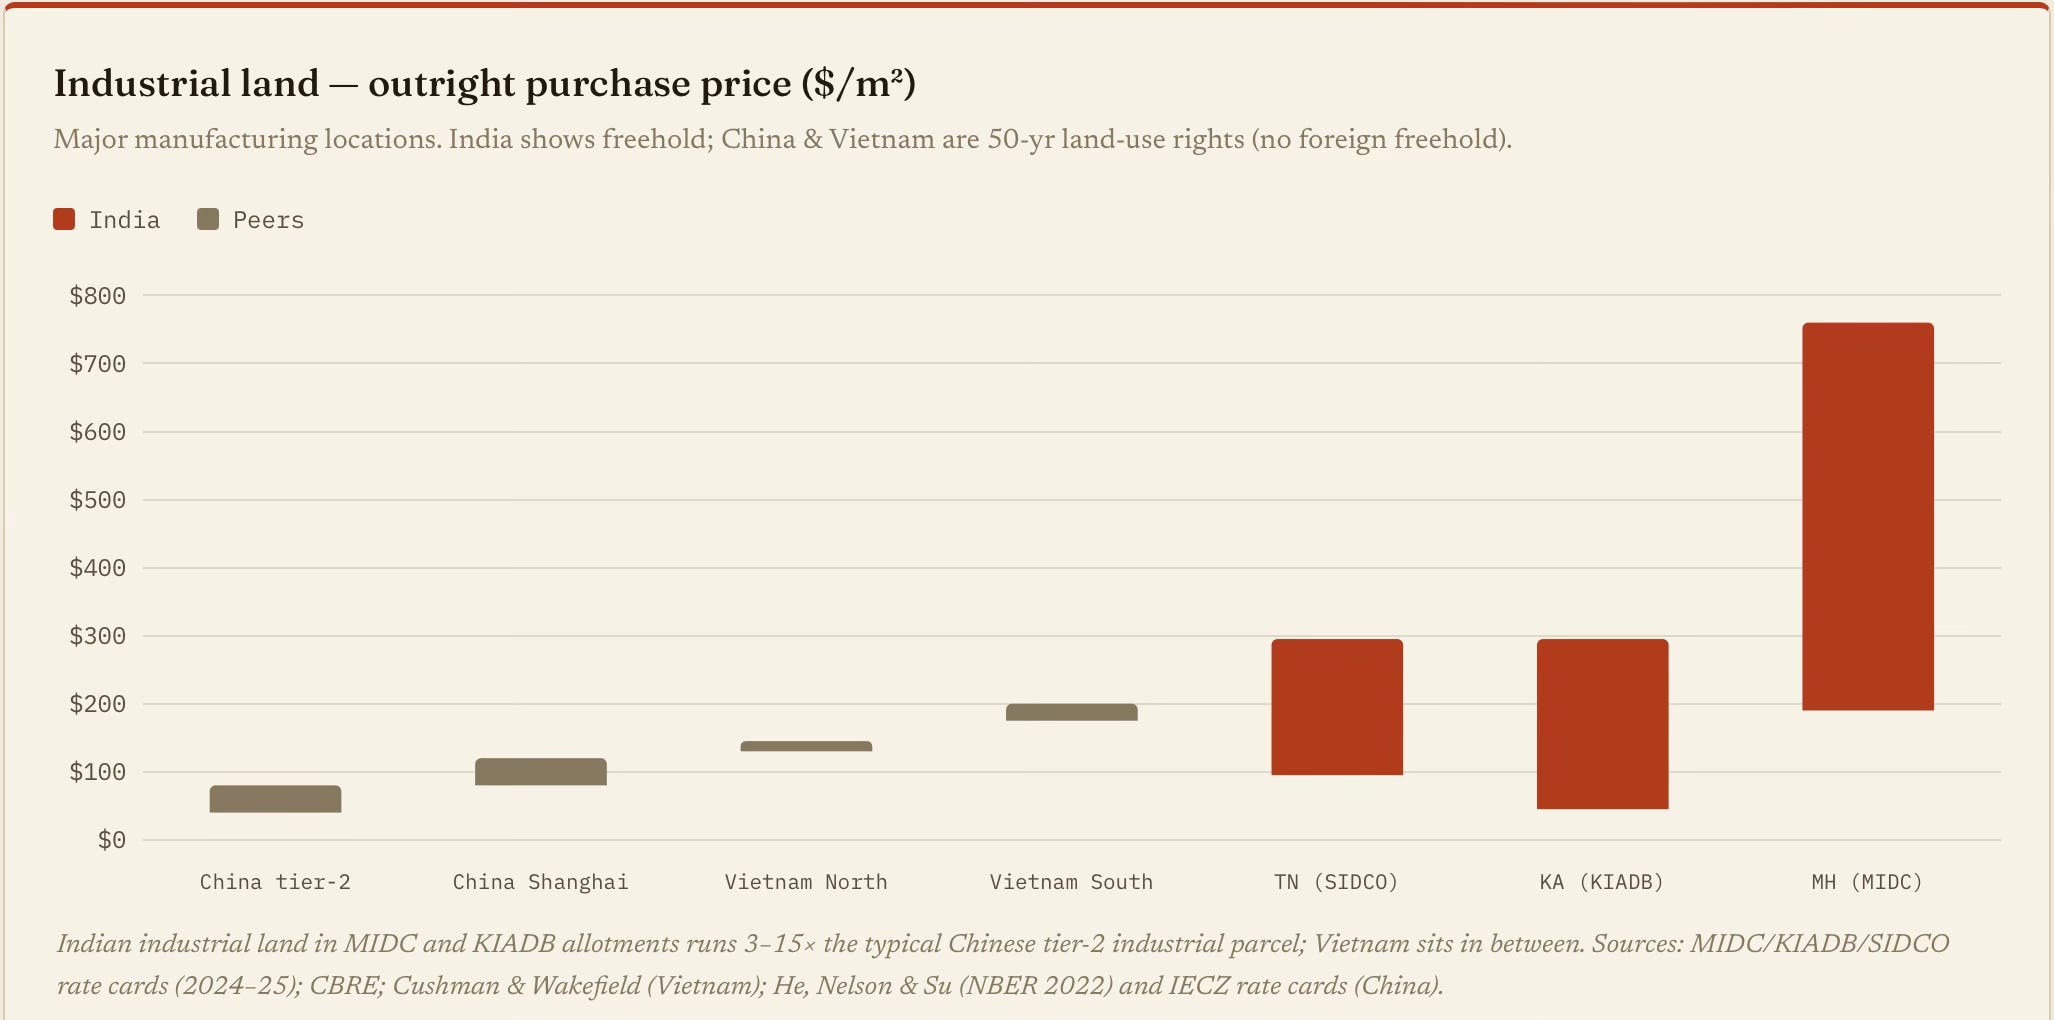
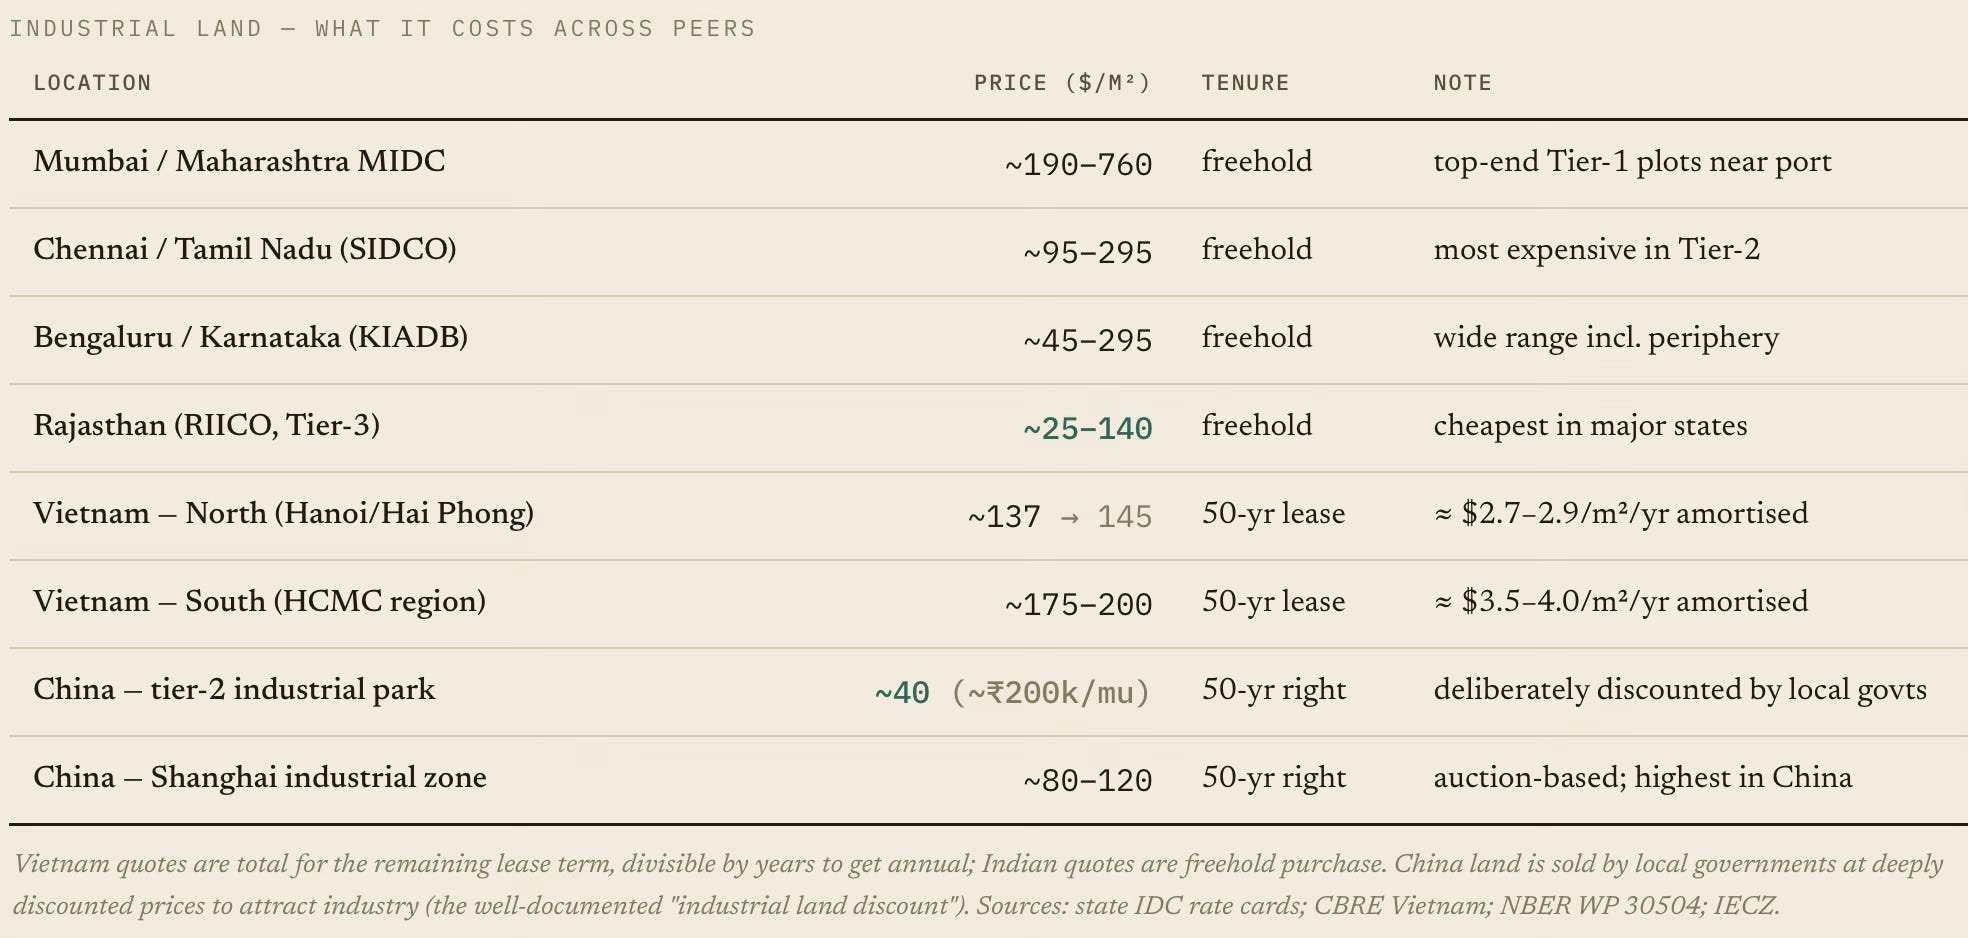
An Indian manufacturer pays roughly 5–15 times more for industrial land than a Chinese counterpart in a comparable tier-2 city and 1–4 times a Vietnamese peer. 
I used Claude to generate the graphic below on the total land transaction cost across states, combining the stamp duty and registration fees and the change of land use fees for the conversion of agricultural land. While stamp duty has converged to 6-7% of land value, the total cost varies widely across states. Interestingly, the southern states have the highest transaction rates. 
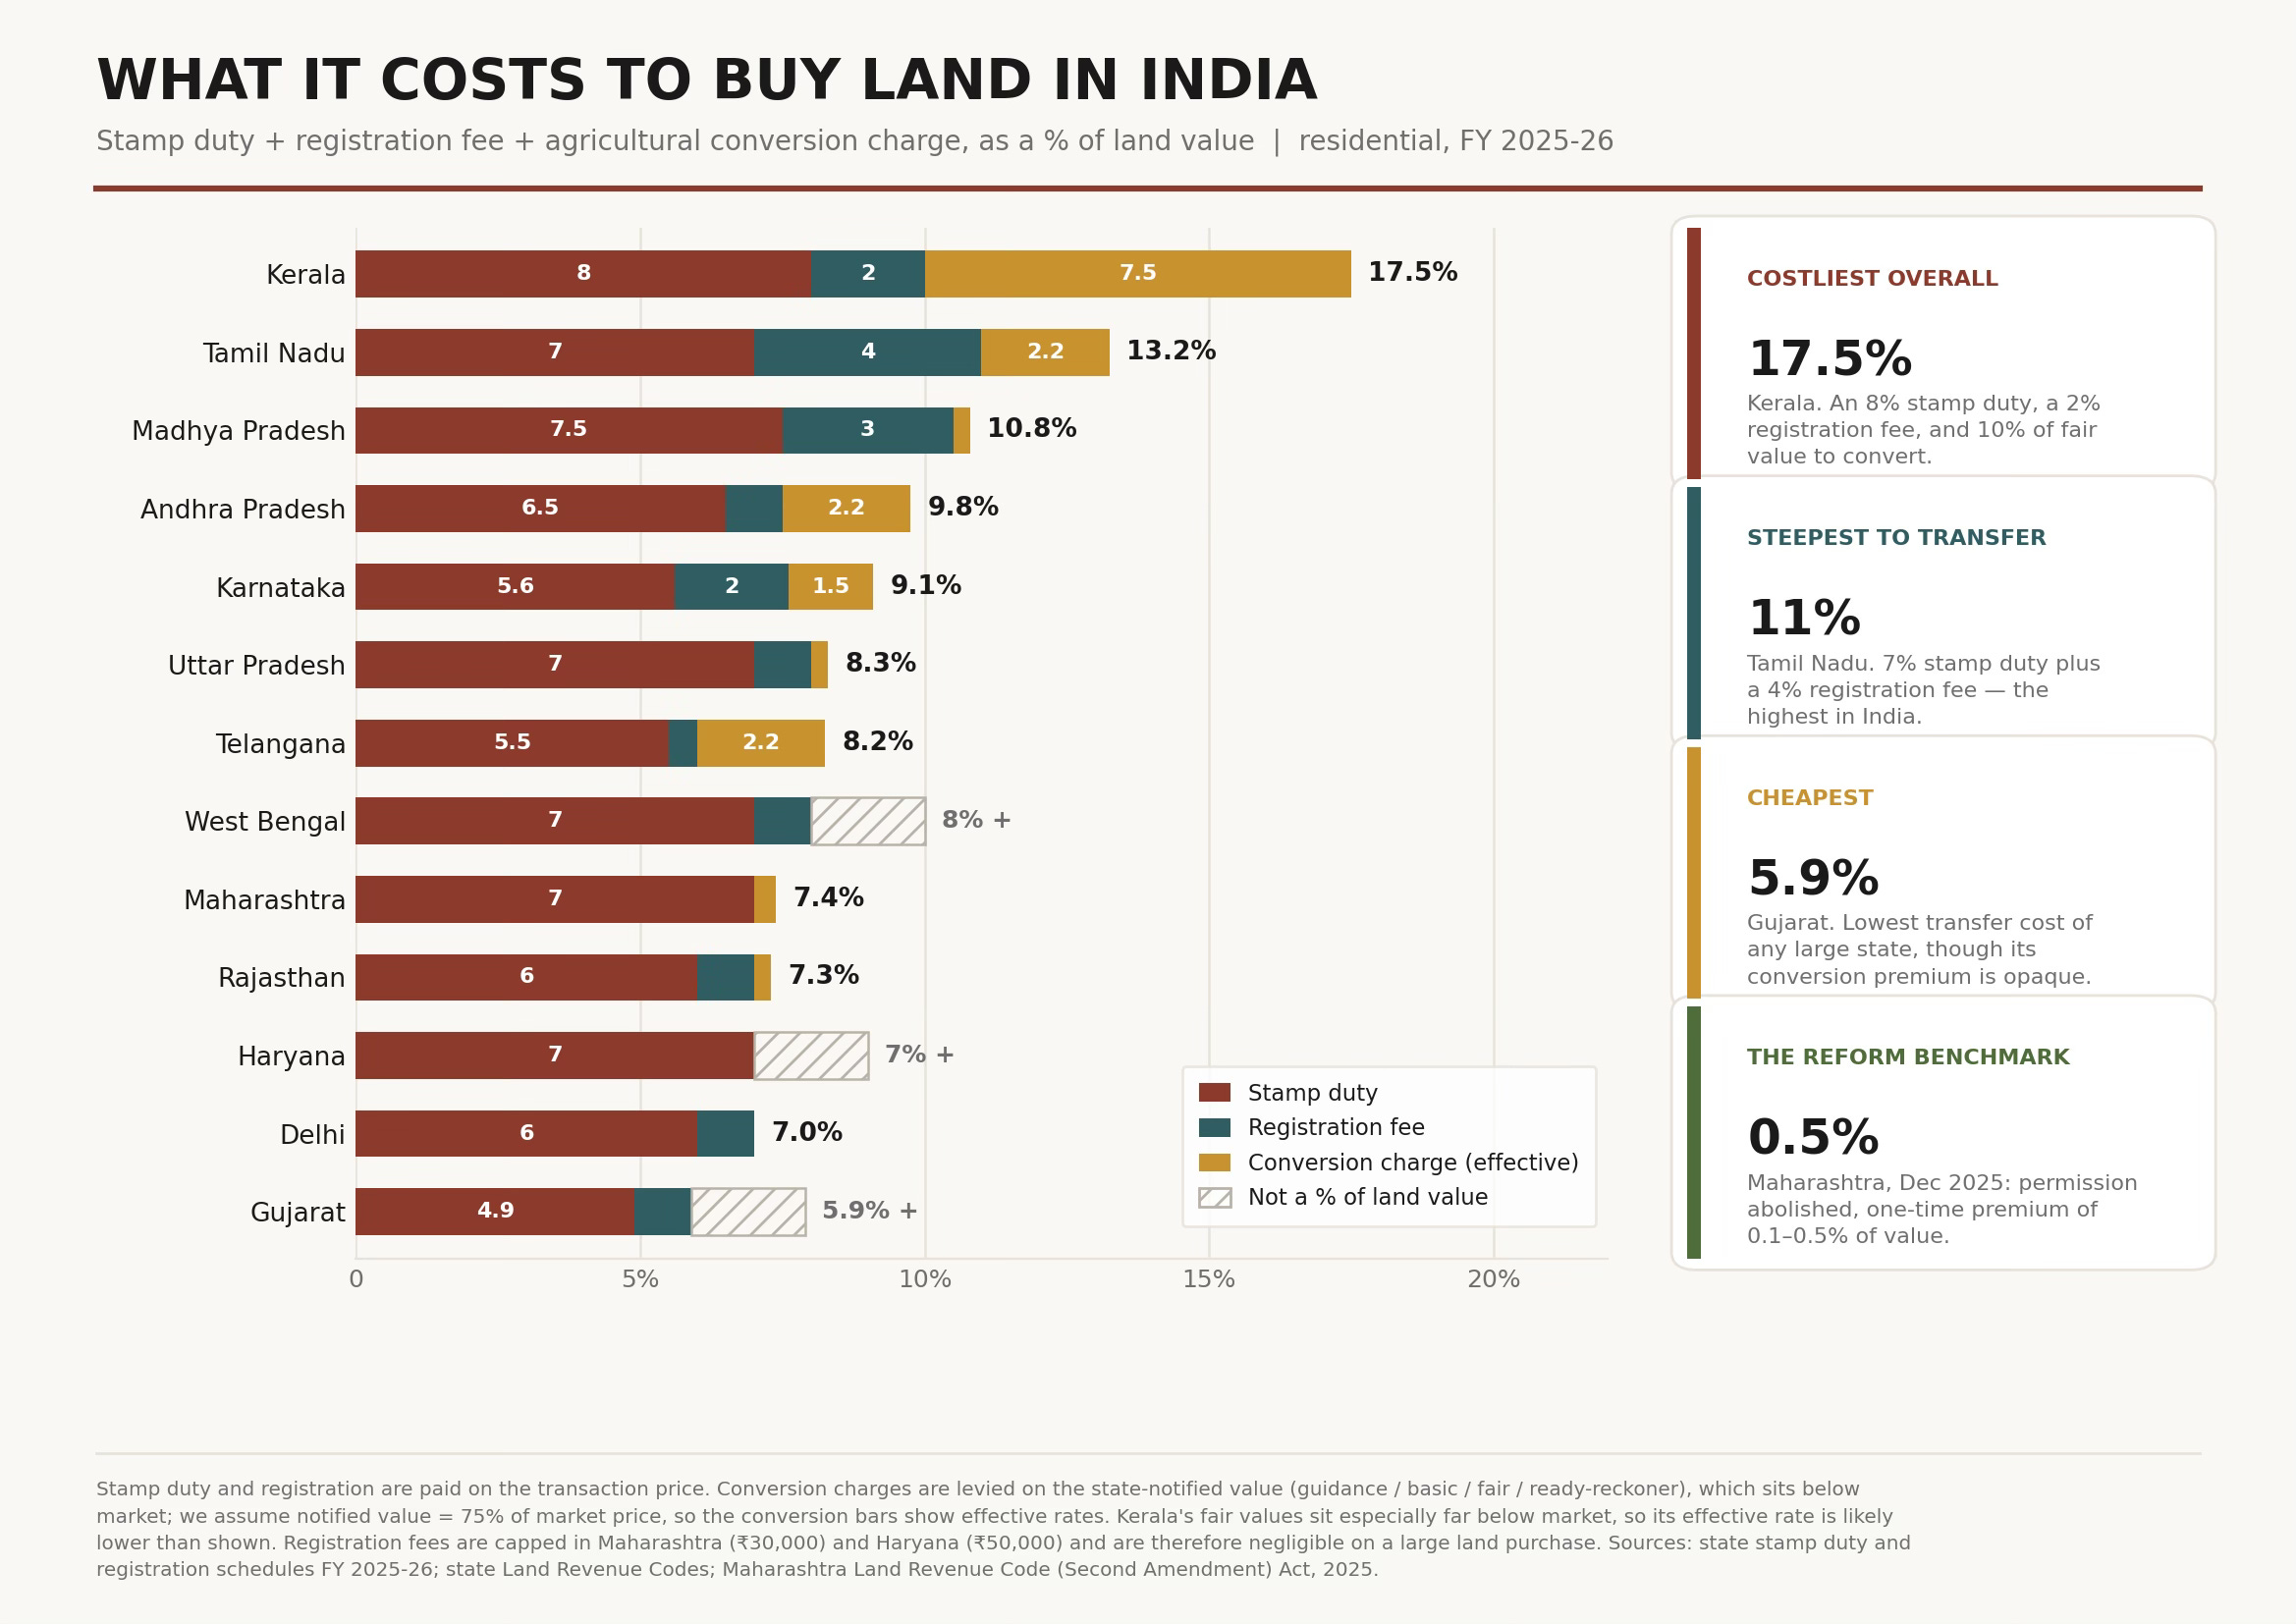
Four states can’t be reduced to a clean number - Maharashtra charges a premium of 25–100% of the ready-reckoner differential; Gujarat charges on the agri/non-agri differential; West Bengal rarely grants conversion at all; and Delhi’s urban land is already non-agricultural. For these, the combined figure shown is a floor, not a total (hence the ‘+’). Maharashtra, in particular, would likely top the chart if its premium were expressible as a share of land value.

Andhra Pradesh (deemed conversion since 2018, NALA Act now being scrapped) and Uttarakhand (permission eliminated for specified categories) are the only states that have removed conversion permission as a bureaucratic step. Assam, J&K, Odisha, Puducherry and Tripura have moved to negative lists.

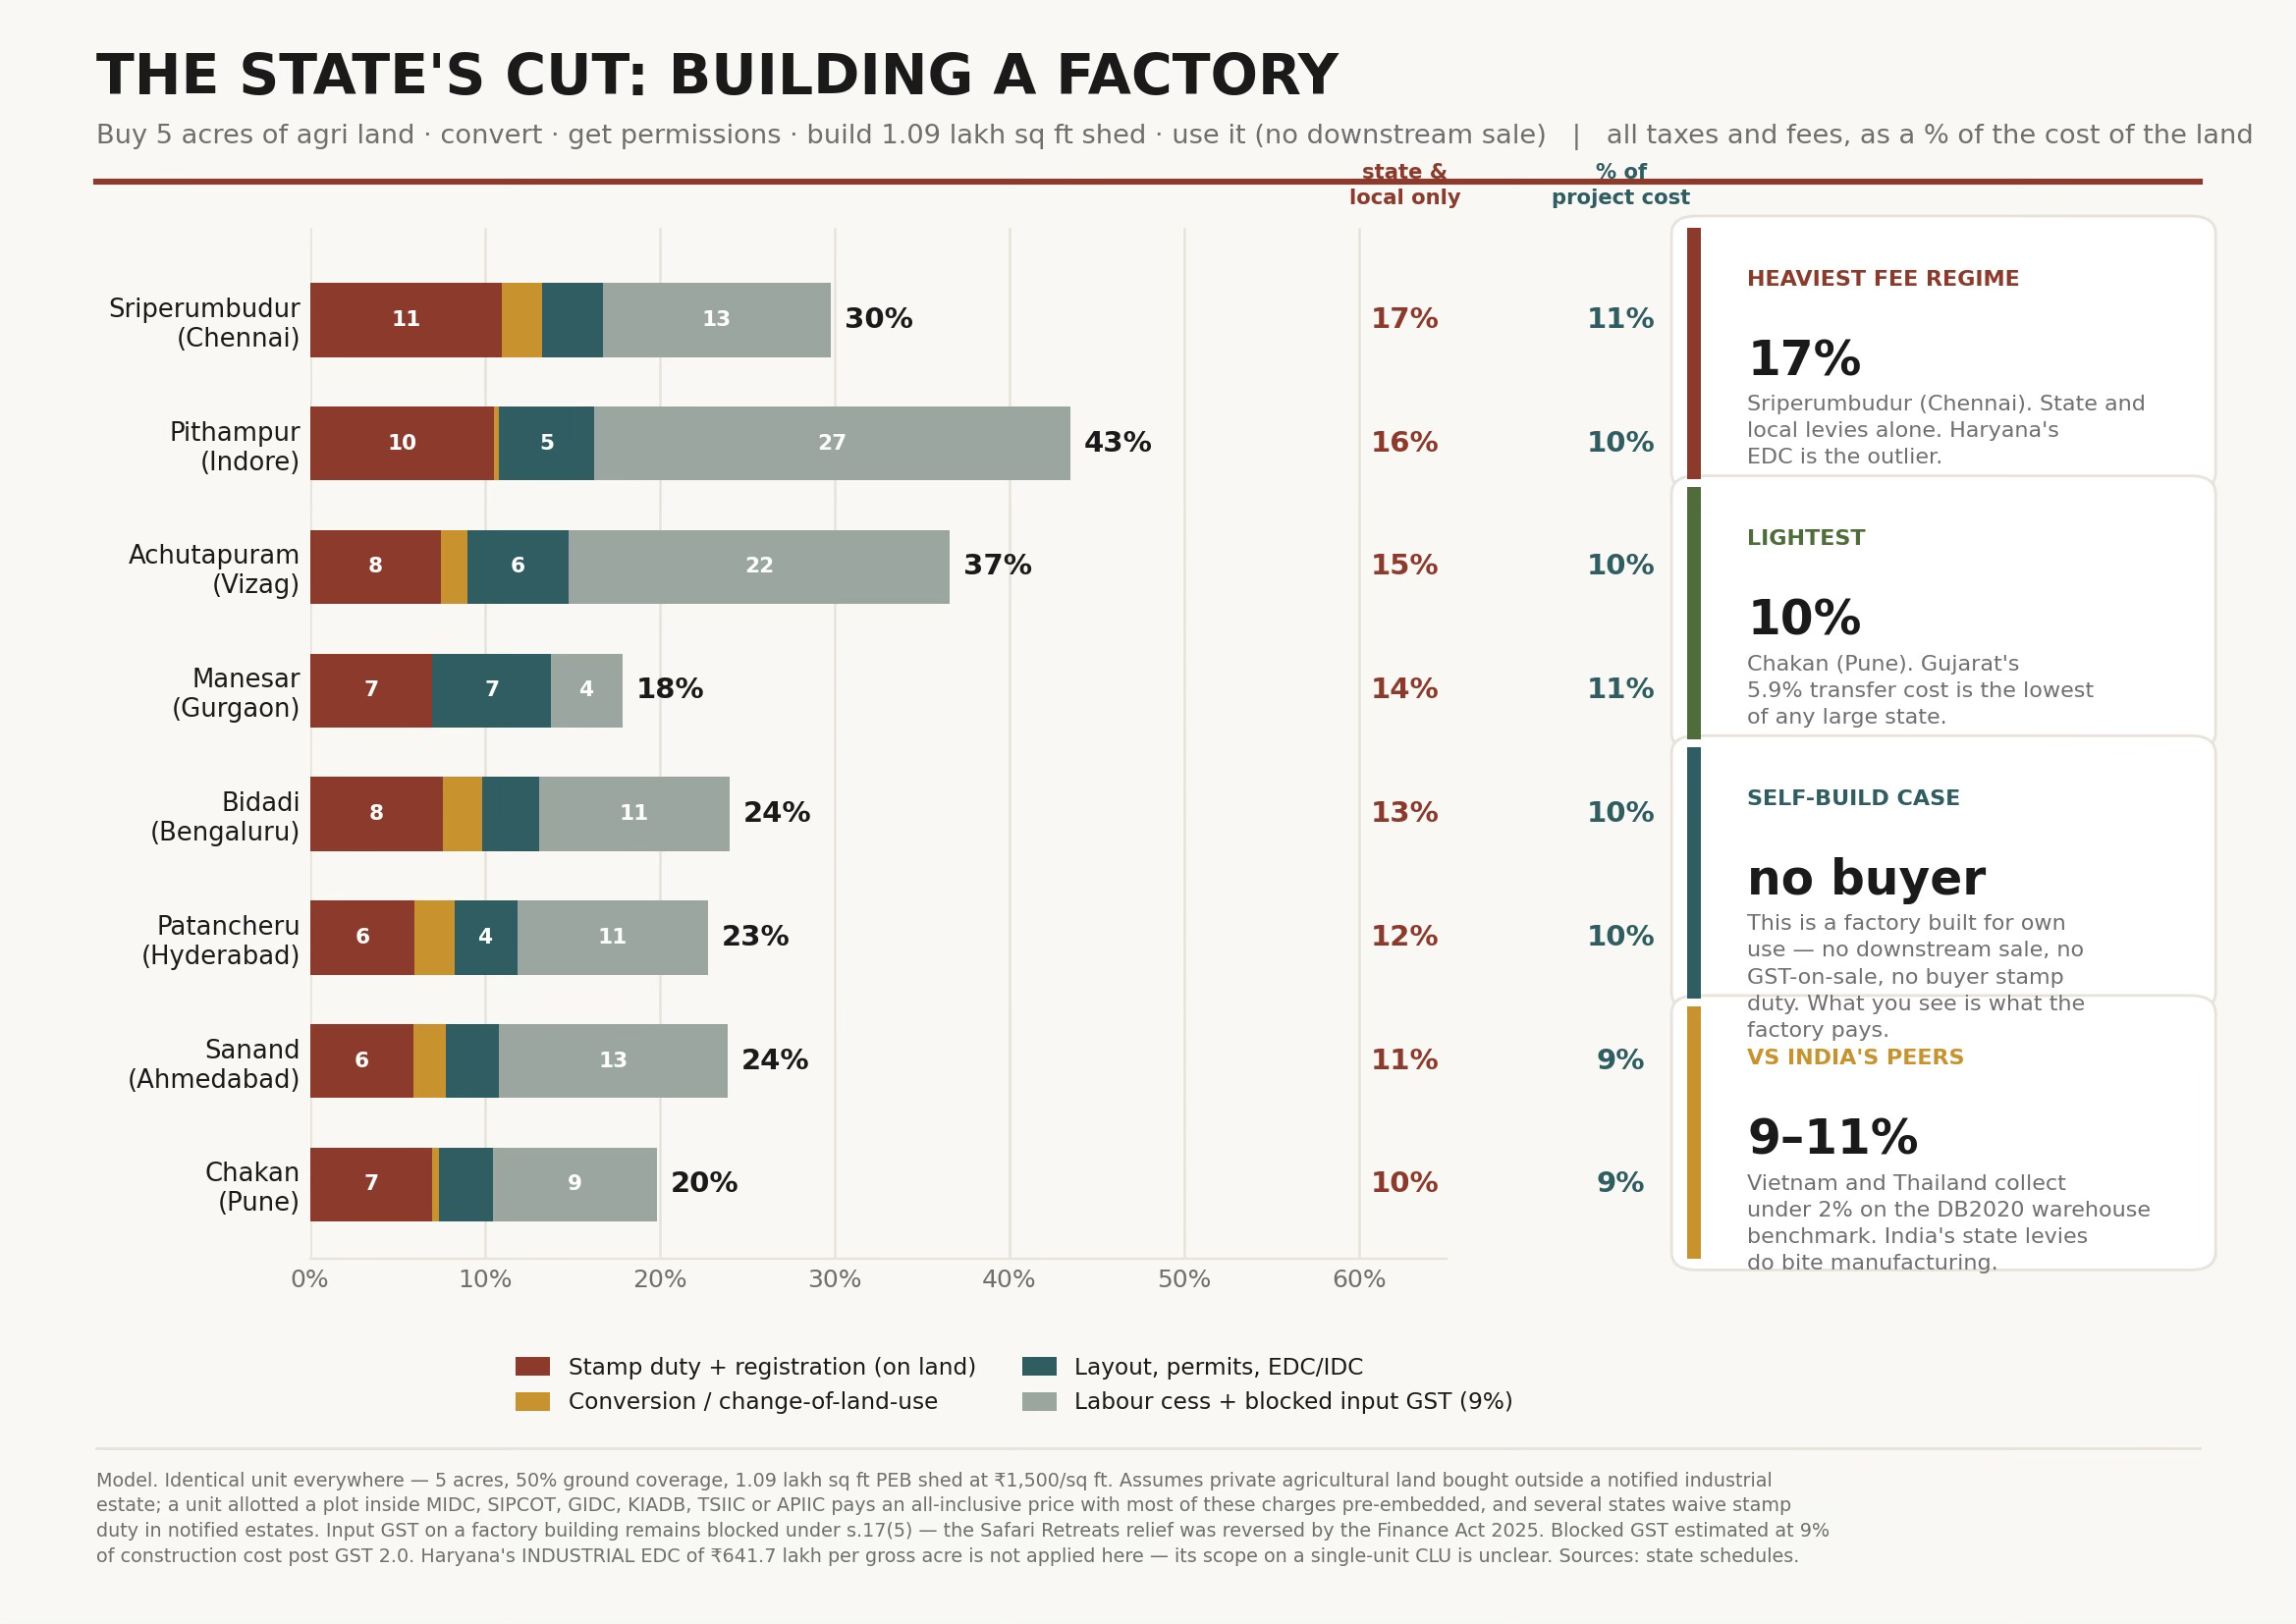
I then asked Claude to generate the typical cost of industrial land in some representative locations across India. The wide variations in the construction levies as a share of land value arise from the variations in the underlying land valuations (the % is higher in places with lower land values). While the state and local taxes make up 10-17% of the land value, all the land and building-related taxes make up a near-uniform ~10% of the industrial project cost (land, construction, taxes).
I did the same for residential land cost at representative locations in a few cities. Ignoring the Gurgaon outlier, the state and local taxes make up 16-26% of the land value, and all the land and building-related taxes make up 18-25% of the price paid by the homebuyer. In other words, the tax burden is a fifth to a quarter of what a homebuyer pays.
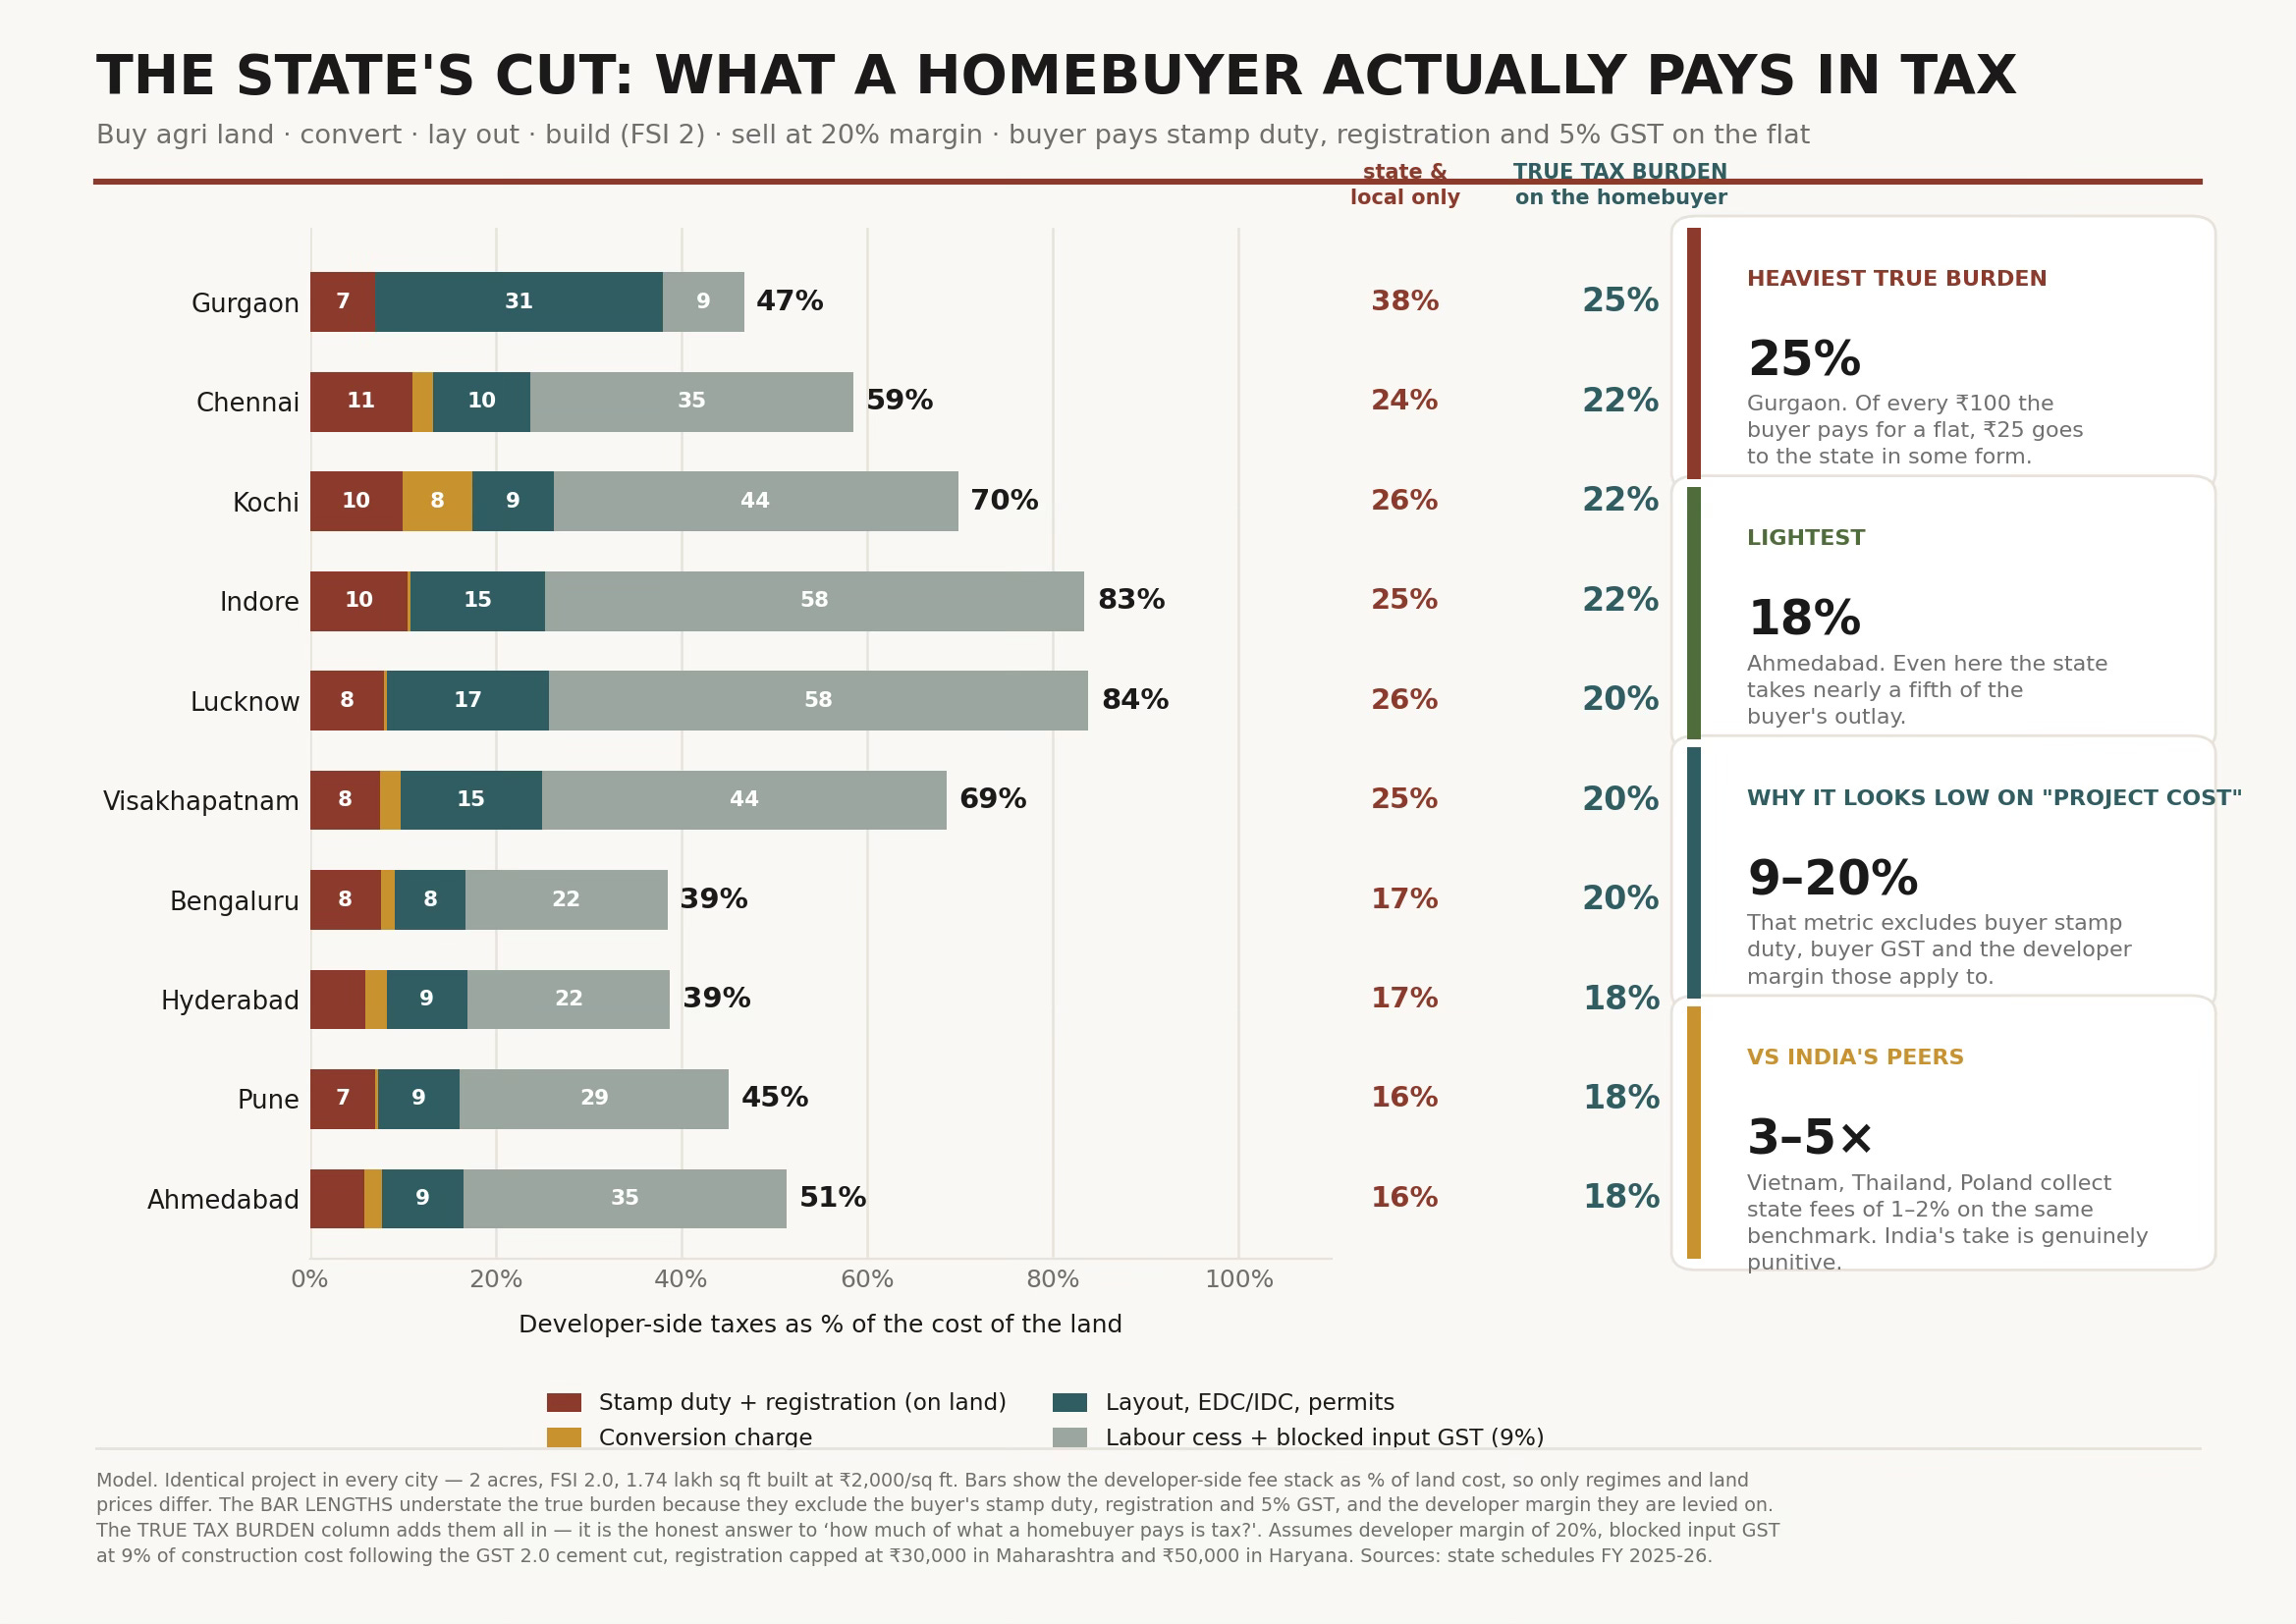
In both cases, the lower land valuations in places like Lucknow or Indore or Vizag mean that the share of the nationwide levies (GST and labour cess) is much higher. In other words, these levies bite more in the second-tier and below cities and end up eroding their comparative advantage.

A like-for-like global comparison for industrial land is difficult given the lack of data. The graphic below is a broader international comparison, using the World Bank’s last Doing Business 2020 survey, for the construction of a typical (2 storeys, 1,300 sq m, on a 929 sq m plot, valued at 50× GNI per capita) warehouse (as a % of the warehouse value) in each country’s largest business city. It measures every statutory licence, permit, inspection, utility connection, non-recurring tax and property registration fee, but importantly, excludes VAT, capital gains and the price of the land itself.
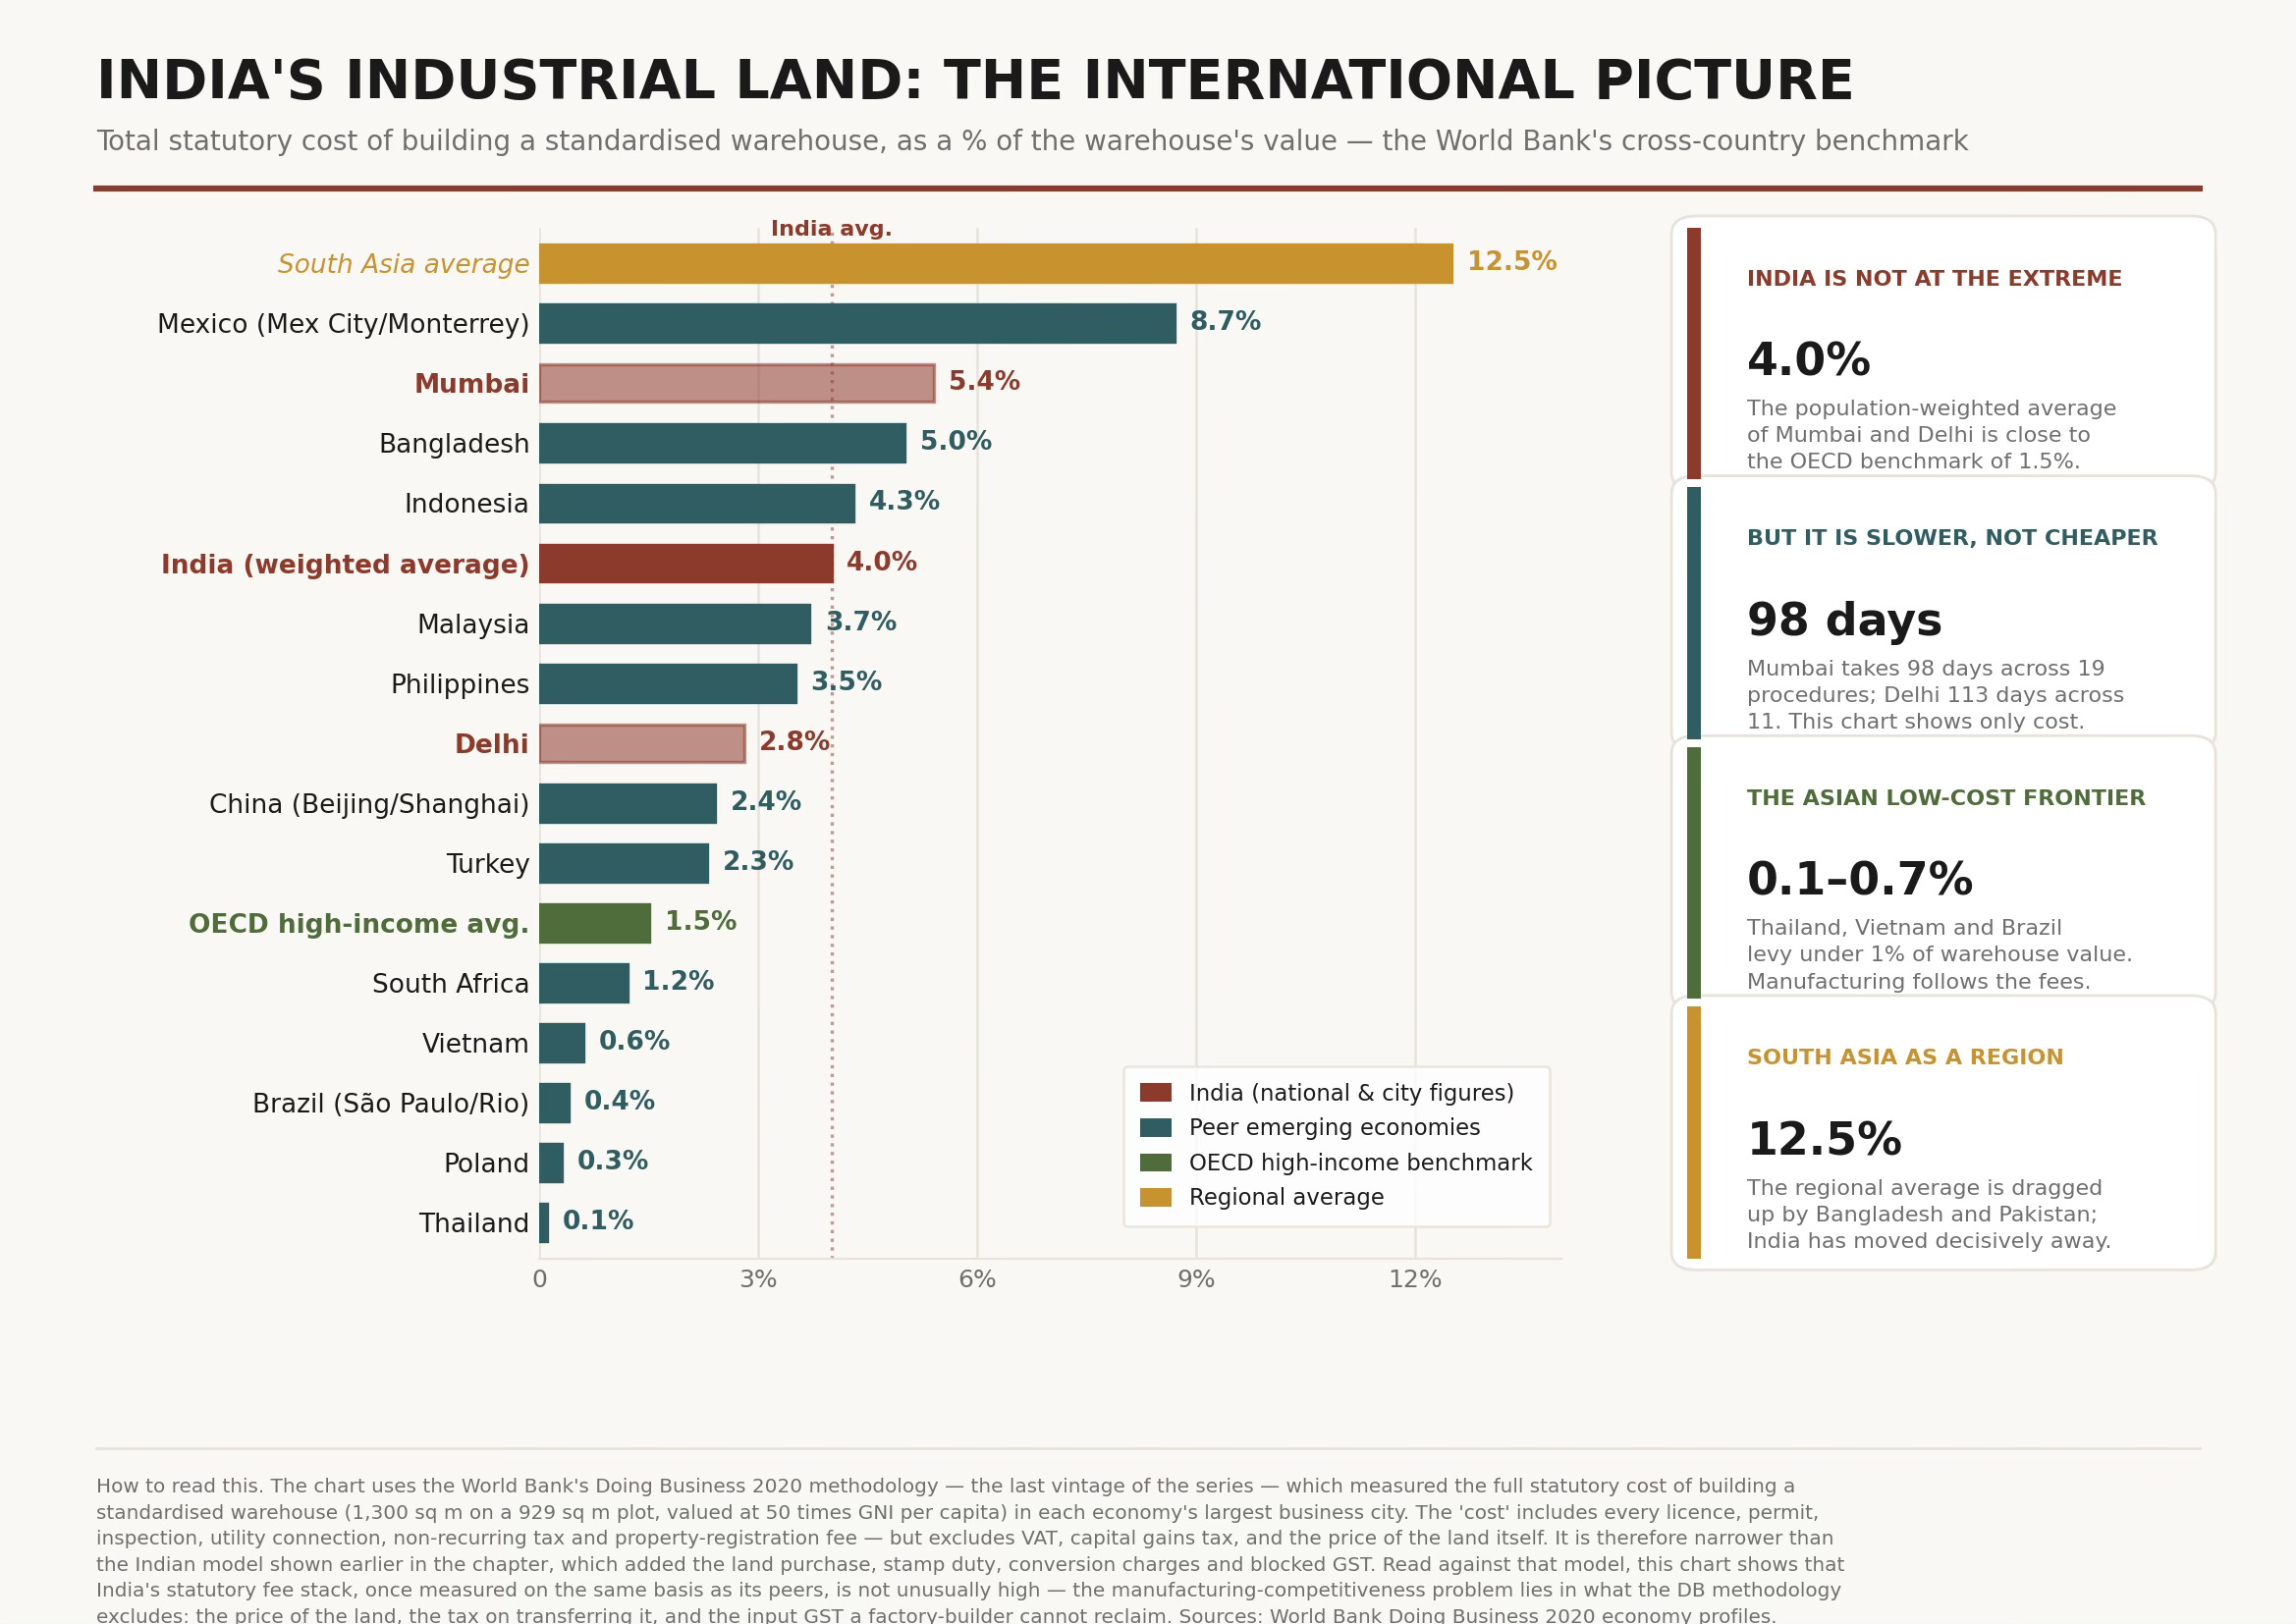
India’s statutory fee stack is middling, sitting below Mexico, Indonesia, Bangladesh, and Delhi at 2.8% is not too far from the OECD high-income benchmark of 1.5%. This questions the reasoning that Indian construction-permit fees alone make land prices uncompetitive. However, India’s manufacturing competitors like Vietnam, Thailand, Brazil, and Poland levy less than a fifth of what India does on the same measures. 

More importantly, the DB survey data excludes land price, stamp duty, conversion charges, and the GST input credit, precisely the costs that were the basis for the discussion earlier. The state’s tax share at 18-43% of industrial land cost, or 9-11% of total project cost is where the land-related competitiveness gap sits, and not in the counter fees that the WB’s DB Survey tracked.

Monday, June 29, 2026

Indian economy's cost competitiveness constraints - a graphical summary

I had blogged here, arguing that the Indian economy faces a cost-competitiveness constraint. I had written that on many inputs, domestic firms face the cost structure of a developed country. This post will examine the empirical evidence in this regard. 

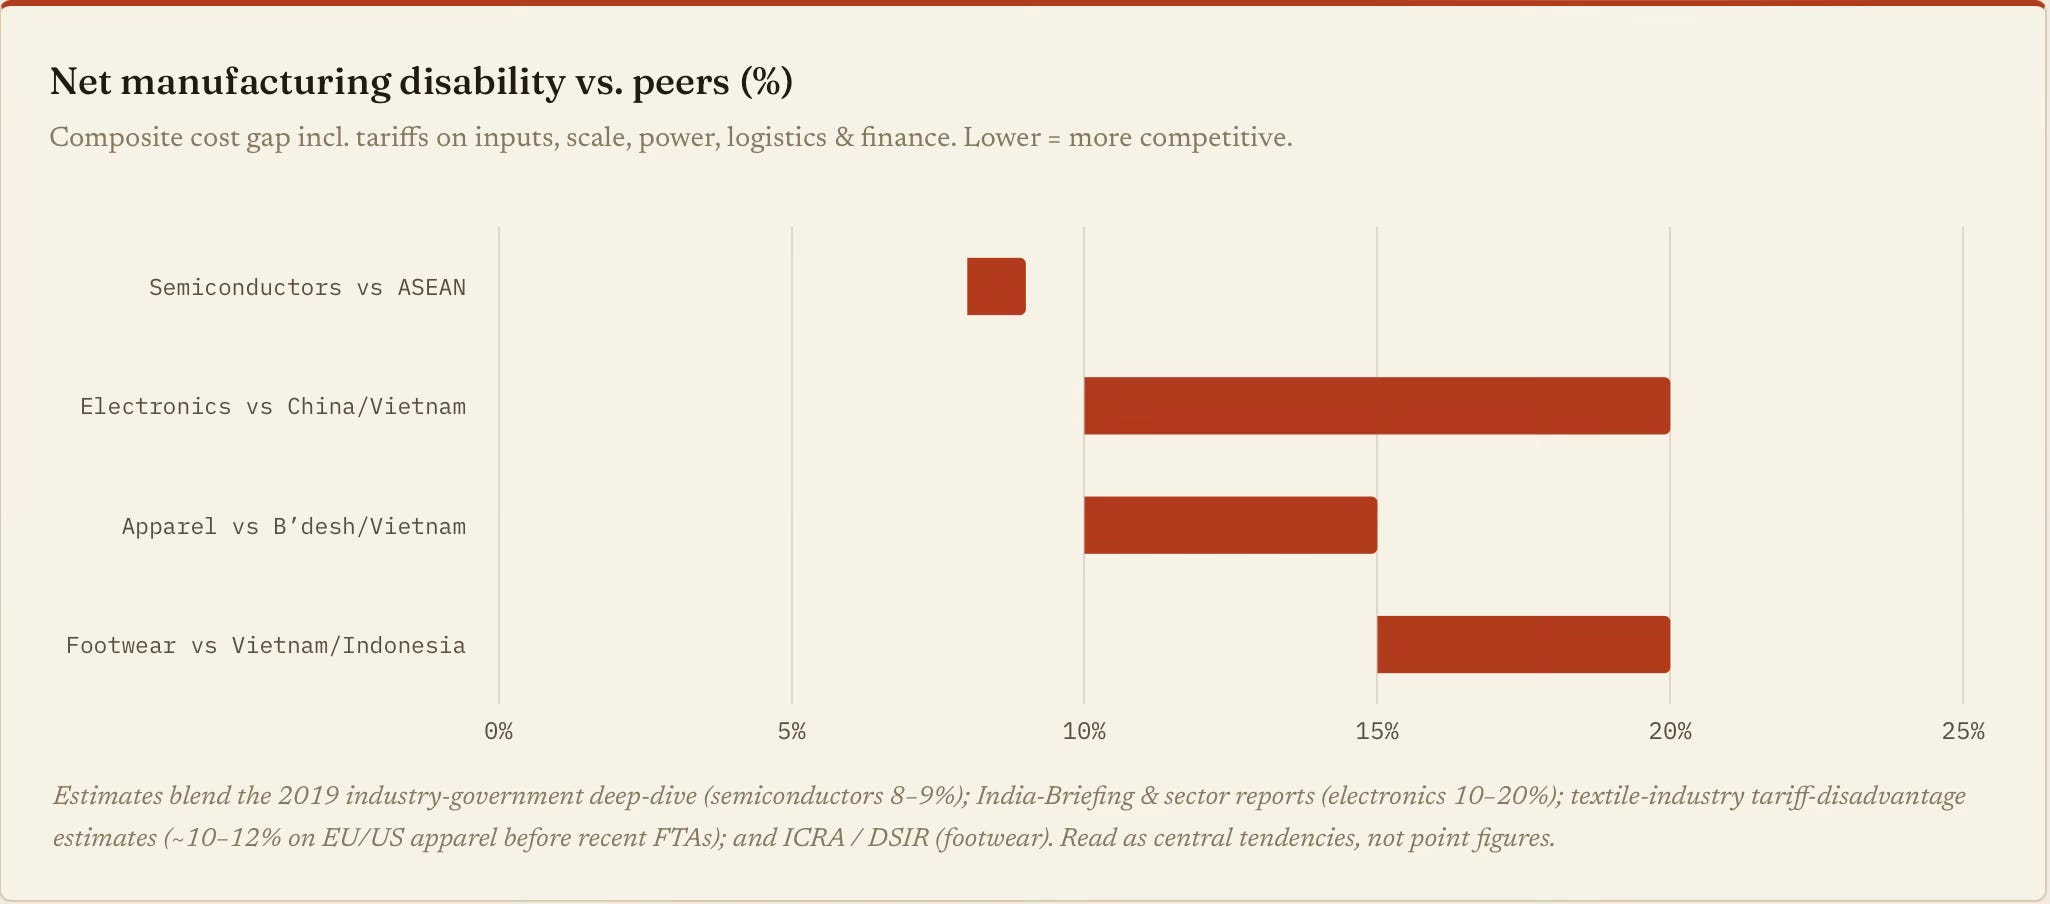
This cost structure reflects in the global competitiveness of the country’s manufacturers. India suffers from a persistent and high price disability compared to peers across manufacturing sectors. 

What are the contributors to this competitiveness wedge?

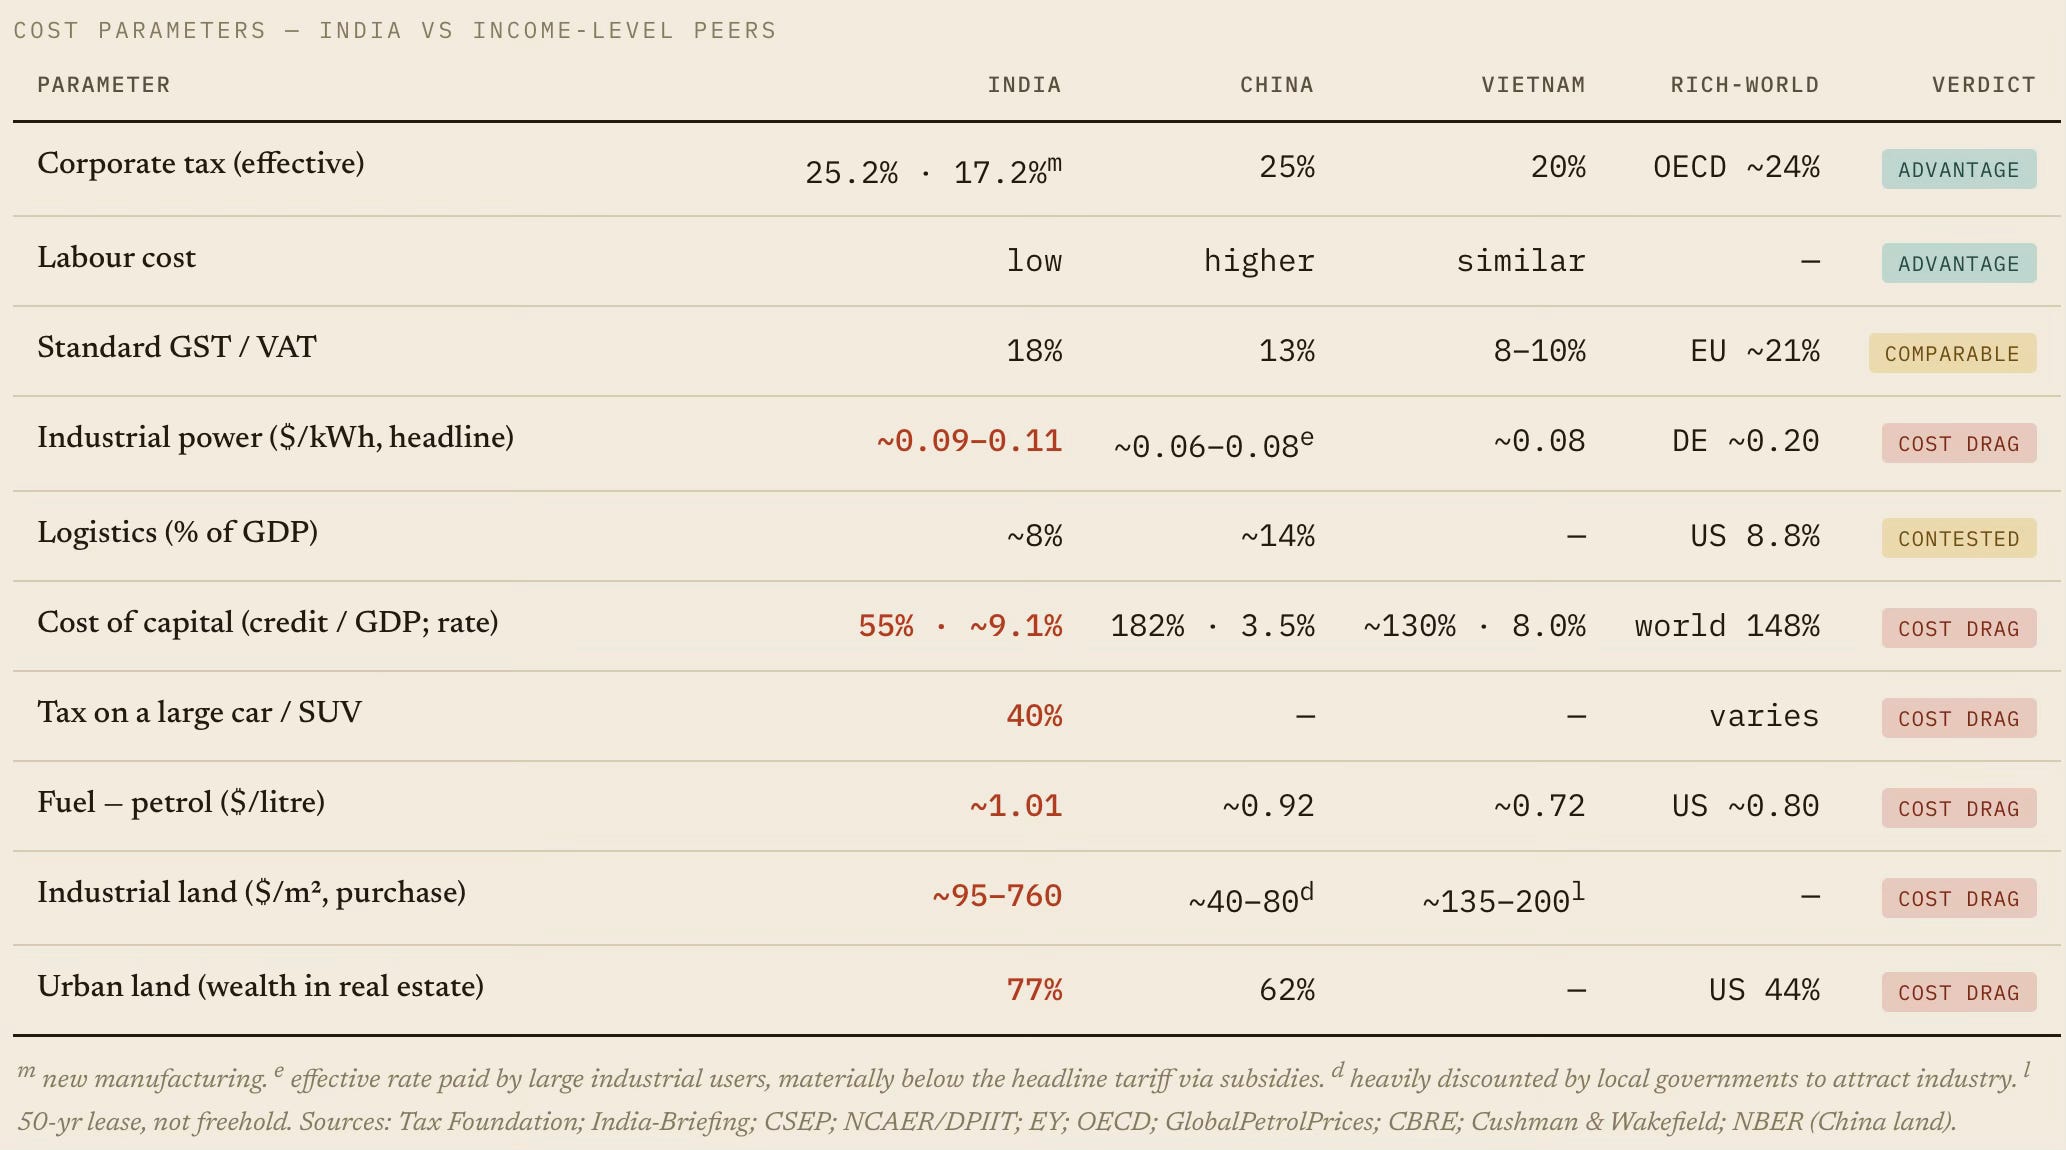
Indian factory wages (~$2.1/hour) are the lowest in Asia, about two-thirds of Vietnam's and a third of China's. Its effective corporate tax rate at 17.2% is among the lowest, its GST rates are comparable, and its logistics costs (while contested) are at least not much higher. 

So if India loses on net cost, the disability is entirely in non-wage factors: land, capital, power, fuel, scale, tariffs on inputs, and labour productivity.

Start with land, the largest cost wedge. Urban land is priced like that of a rich country, and, most problematically, hoards the nation's savings. Mumbai ranks among the world's 20 most expensive prime markets, and Indians park ~77% of household wealth in real estate. The high land valuations result in capital misallocation and squeeze out the capital that would otherwise have resulted in investment. 

In fact, high land valuations, even in the smaller cities, appear to be a big entry barrier for businesses. An Indian manufacturer pays roughly 5–15 times more for industrial land than a Chinese counterpart in a comparable tier-2 city, and 1–4 times a Vietnamese peer. That gap is policy-made. China's local governments subsidise industrial land to attract production, whereas India's restrict supply (FSI, fragmented titles, slow acquisition) and treat land as a fiscal asset to maximise revenues.

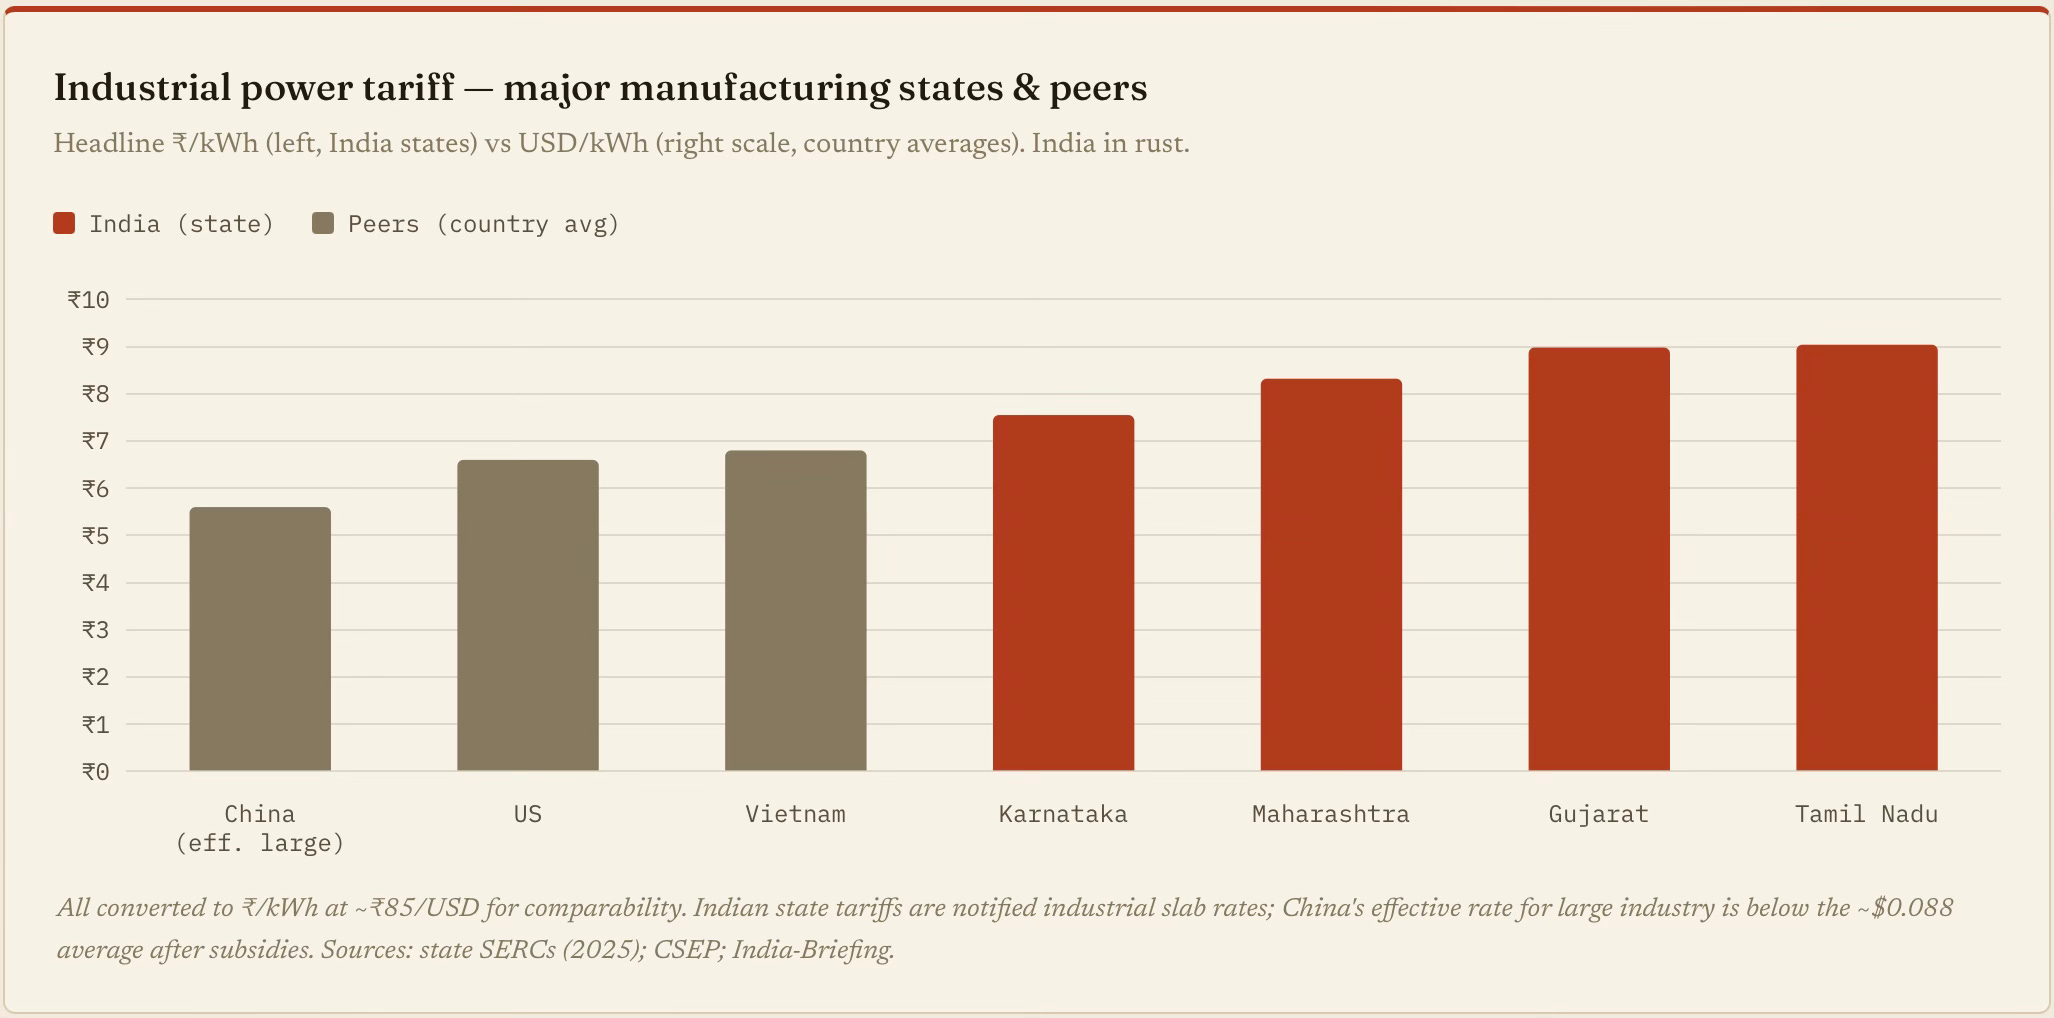
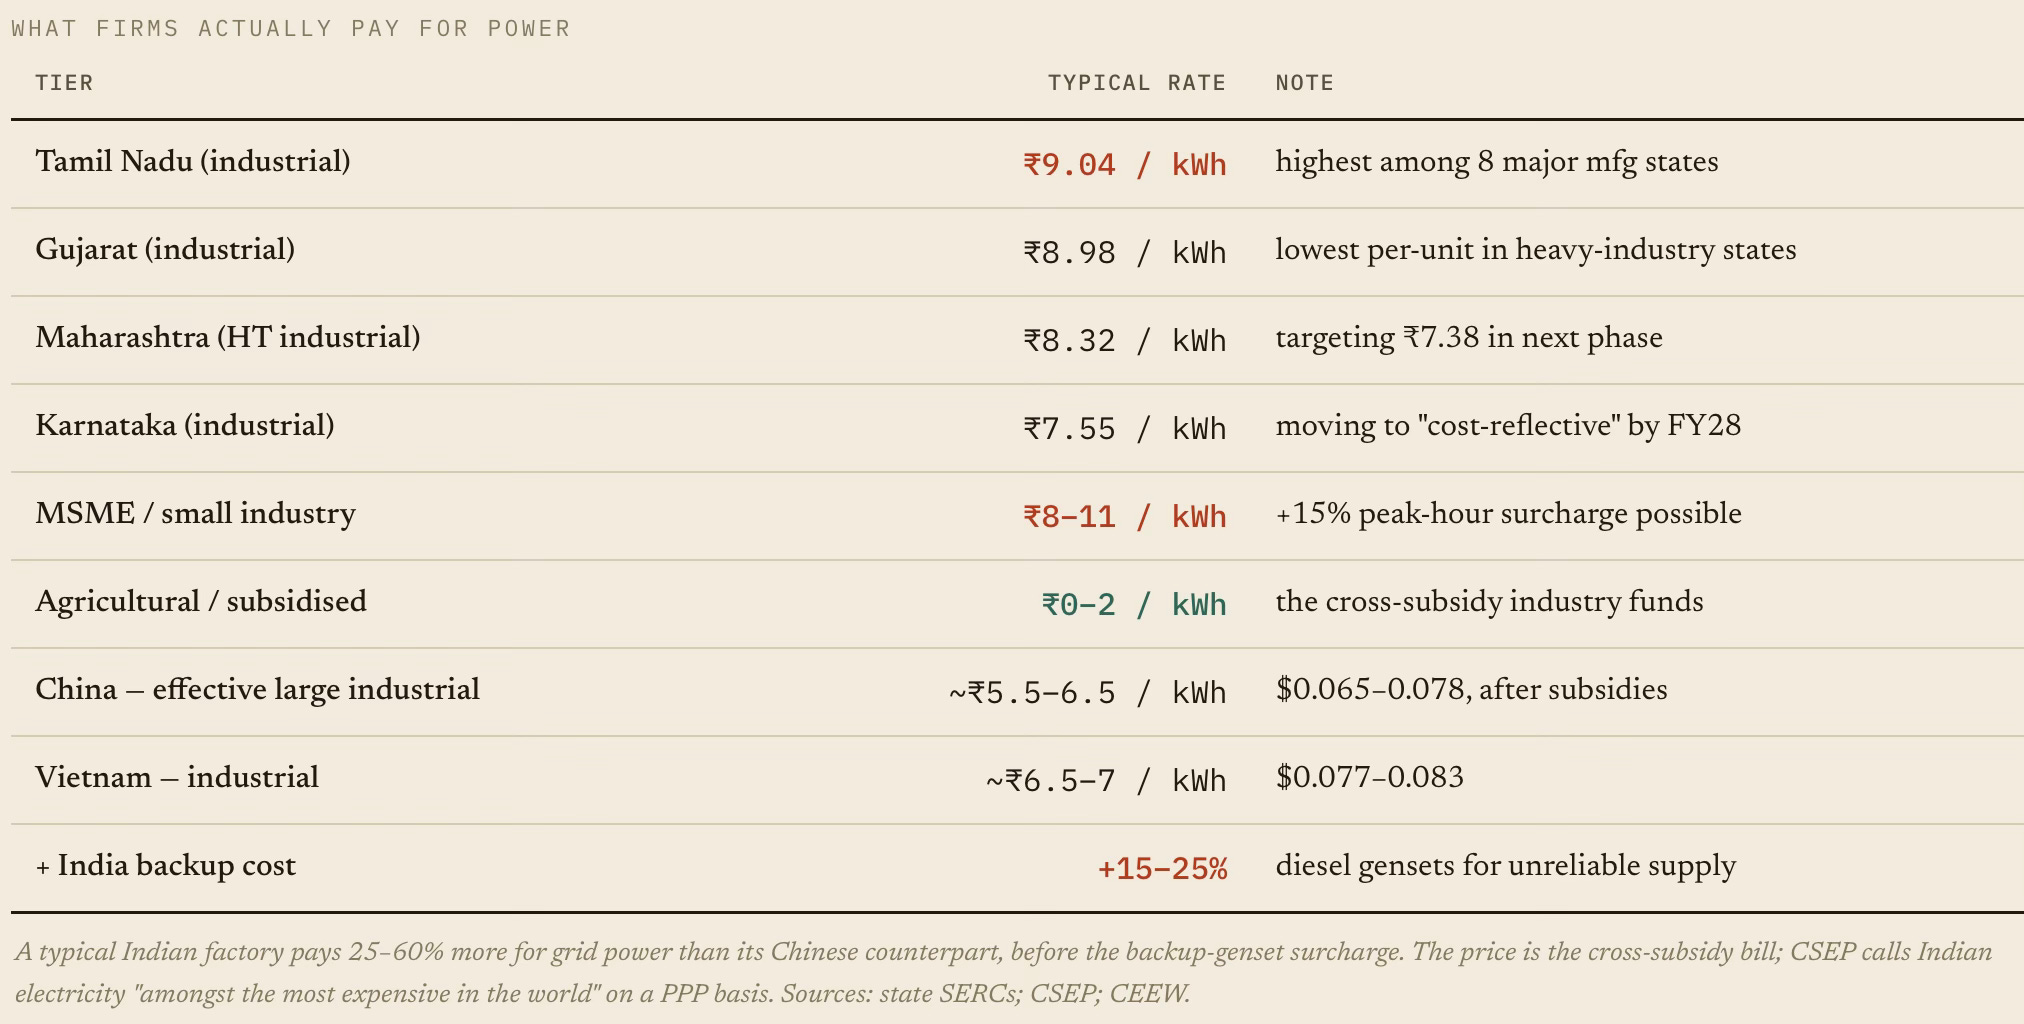
Now, come to power tariffs. Indian industrial users pay ~₹7.5–9/kWh ($0.09–0.11), materially above what comparable Asian peers' large industrial users effectively pay. Indian electricity is among the world's most expensive on a PPP basis, with one of the world's widest spreads across consumer types. 

The comparisons of electricity prices based on averages are misleading. For example, India and China have similar average electricity tariffs at $0.08/kWh. It conceals that India has one of the world's widest cross-subsidy spreads (farms near zero, industry penalised). The rate that matters for competitiveness is the industrial slab, which is materially higher. Industry overpays to cross-subsidise farms and households, again, another policy choice. To this, we must add another 15–25% for diesel backup against unreliable supply.

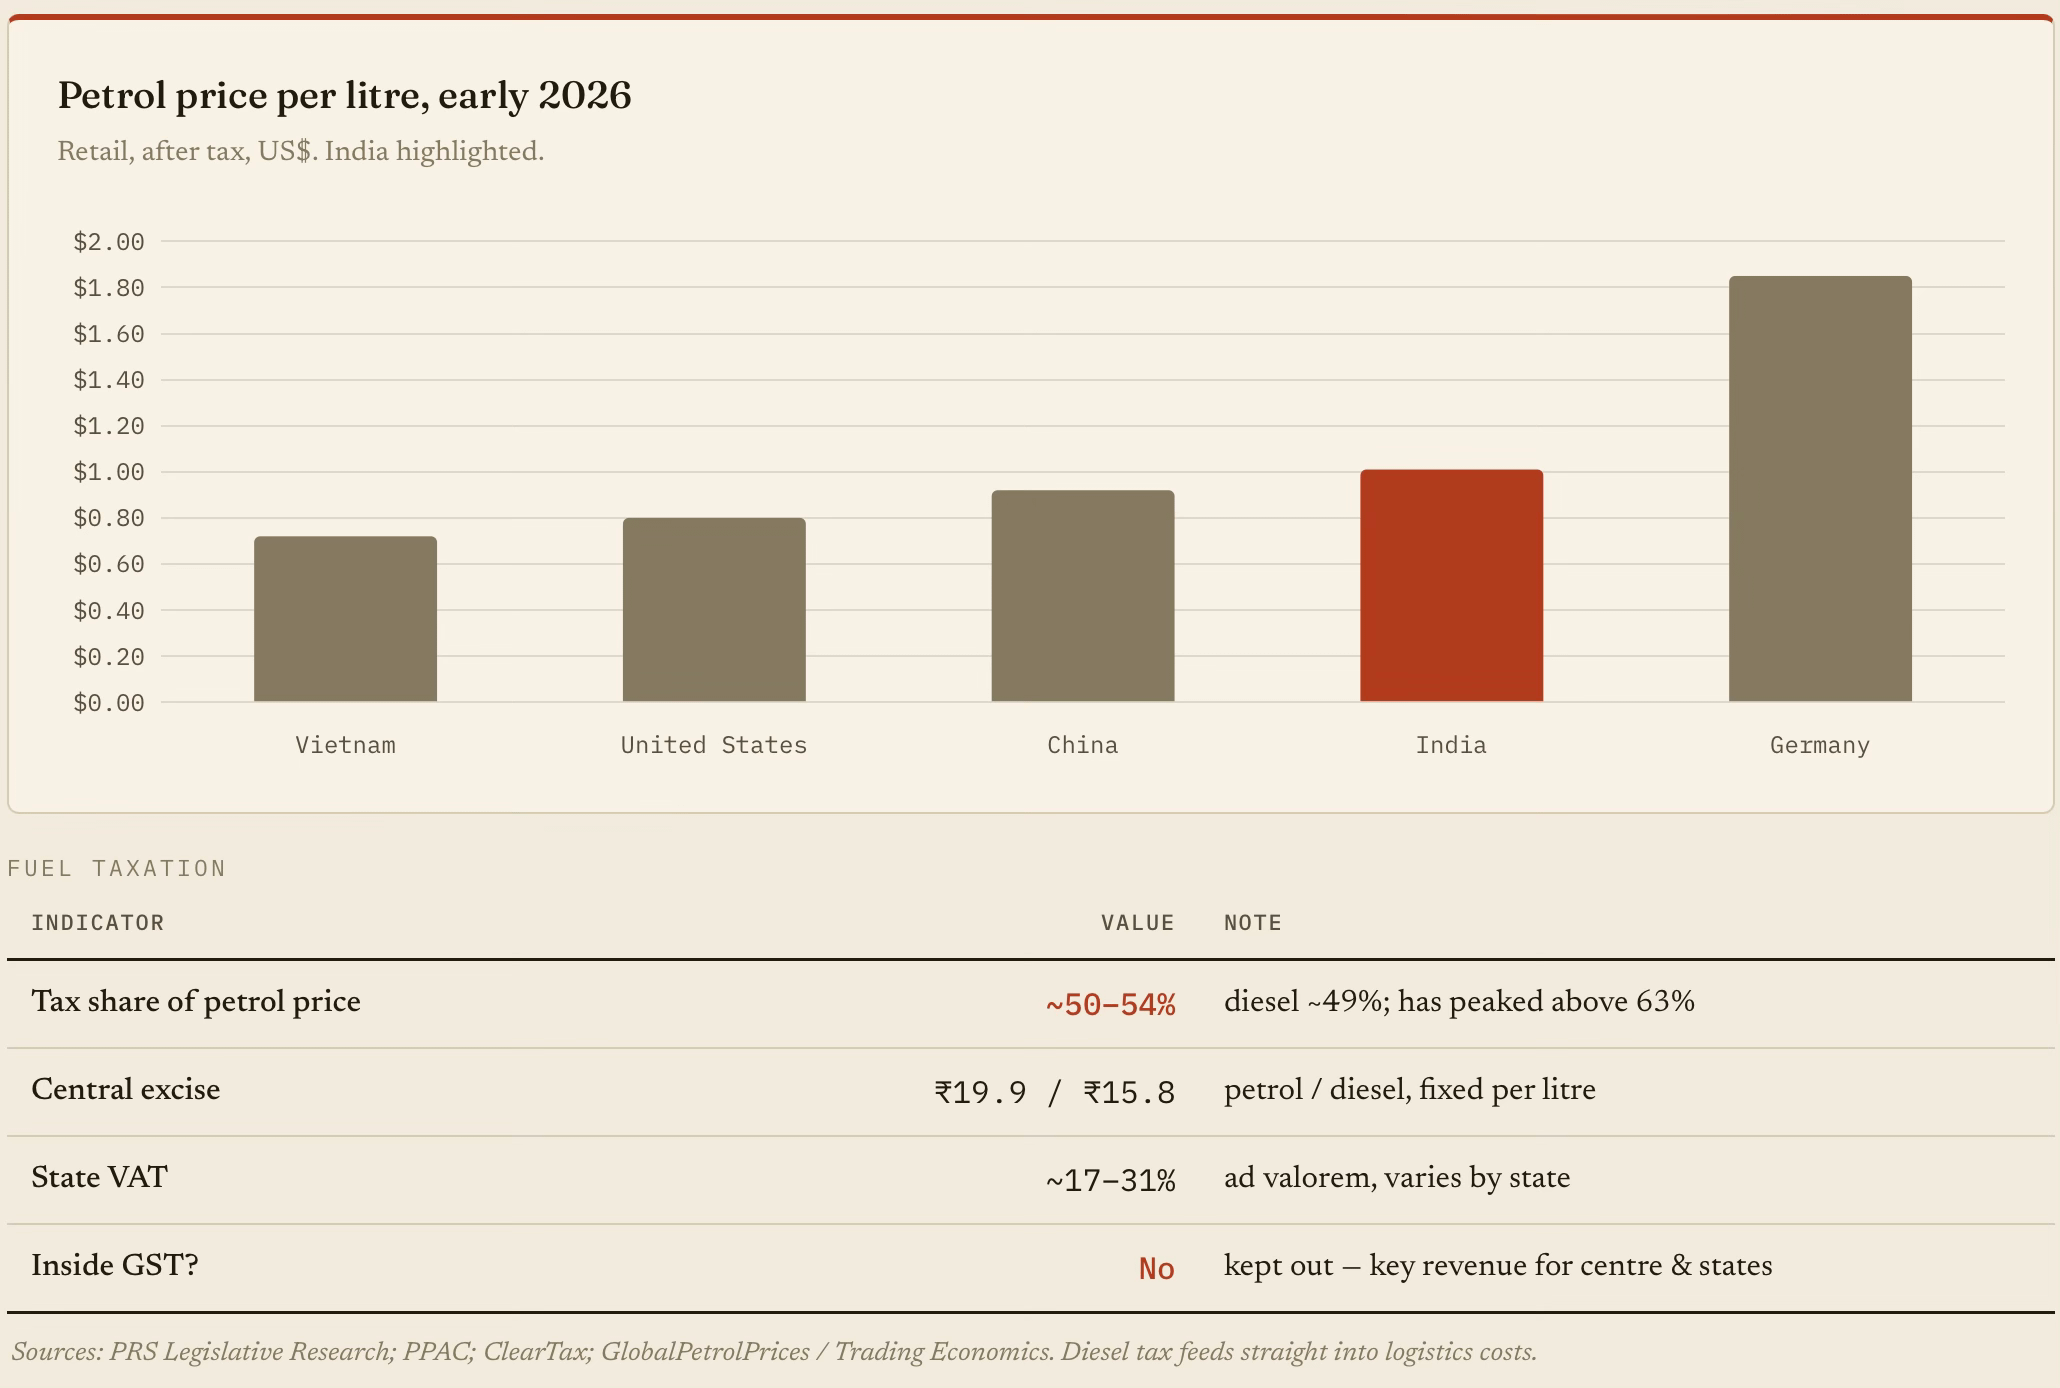
The same applies to gasoline prices. Kept outside GST as a revenue mainstay for state governments, petrol and diesel carry stacked central excise plus state VAT. Roughly half the pump price is tax. In raw dollars, India's fuel is dearer than China's, Vietnam's or America's, despite far lower incomes.

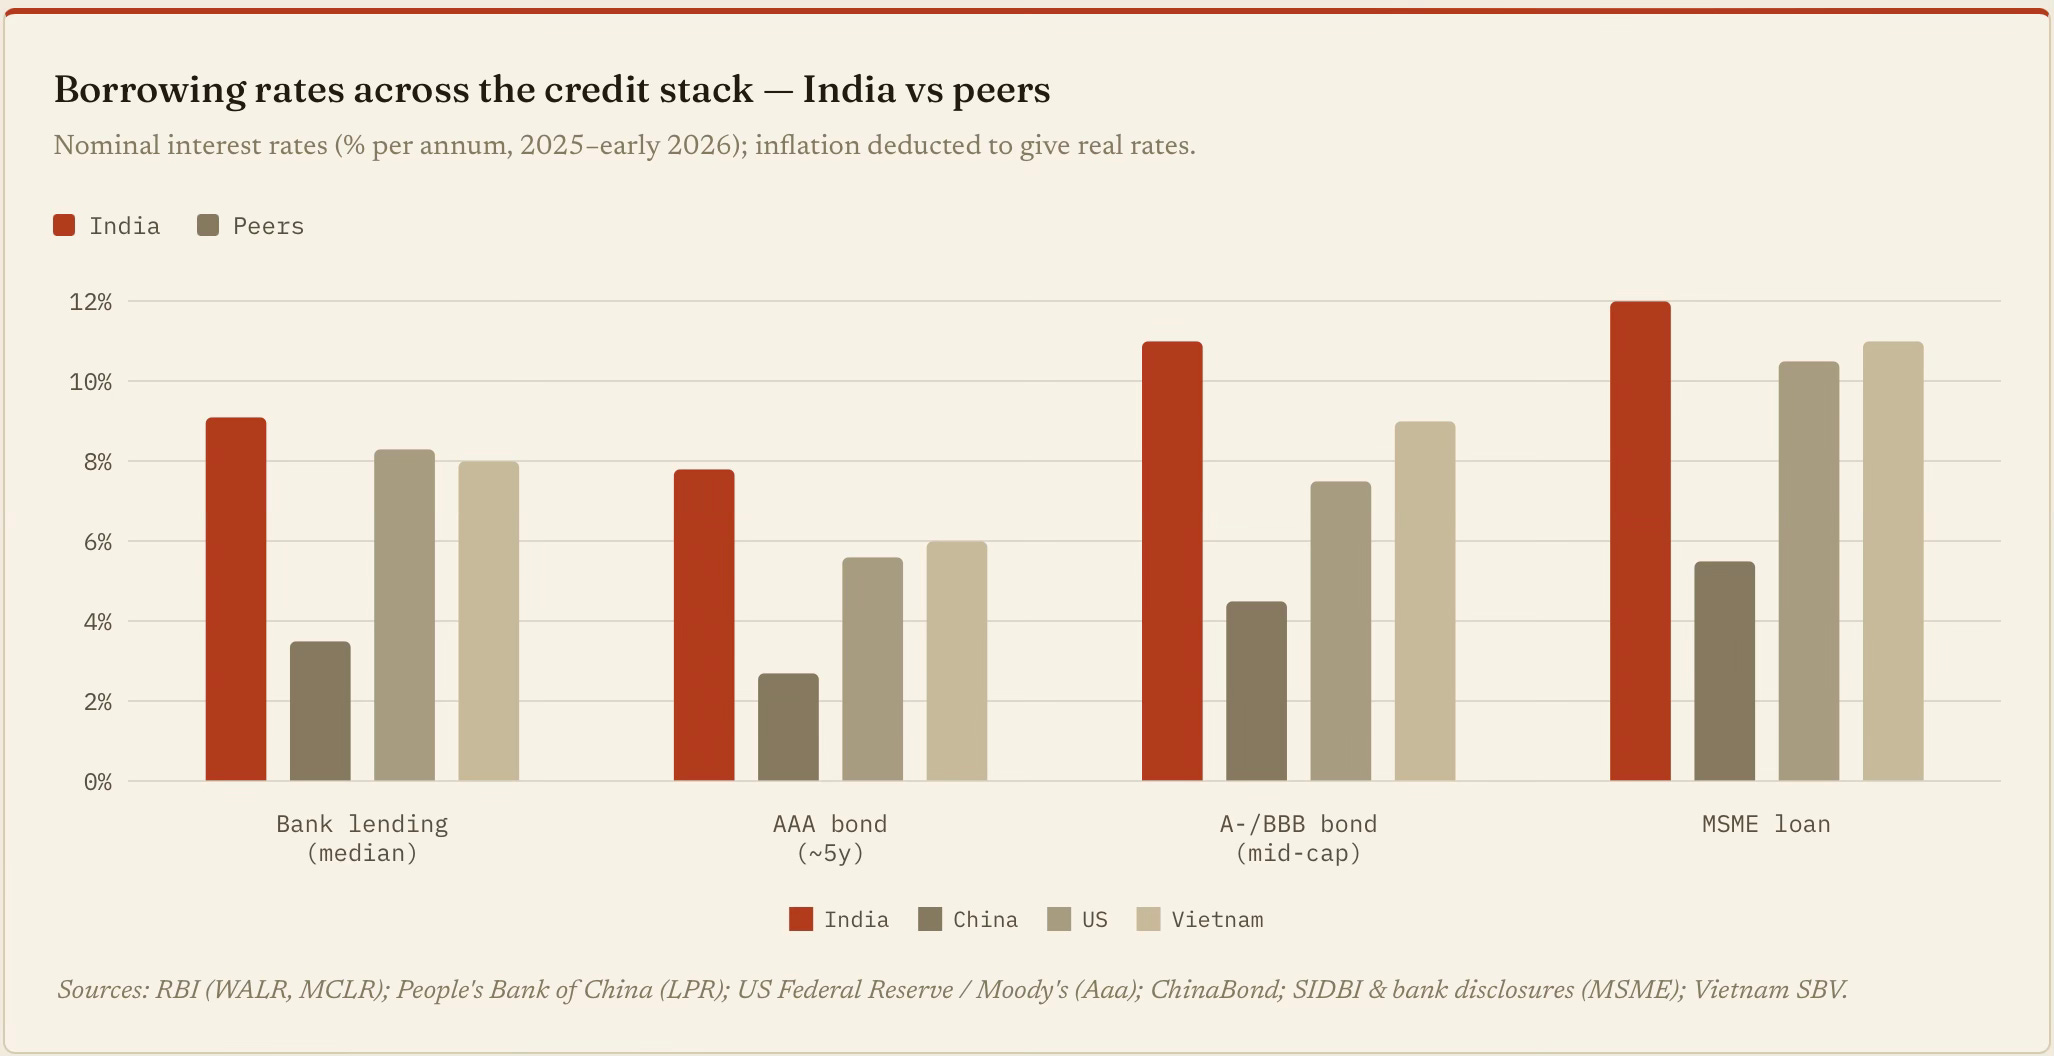
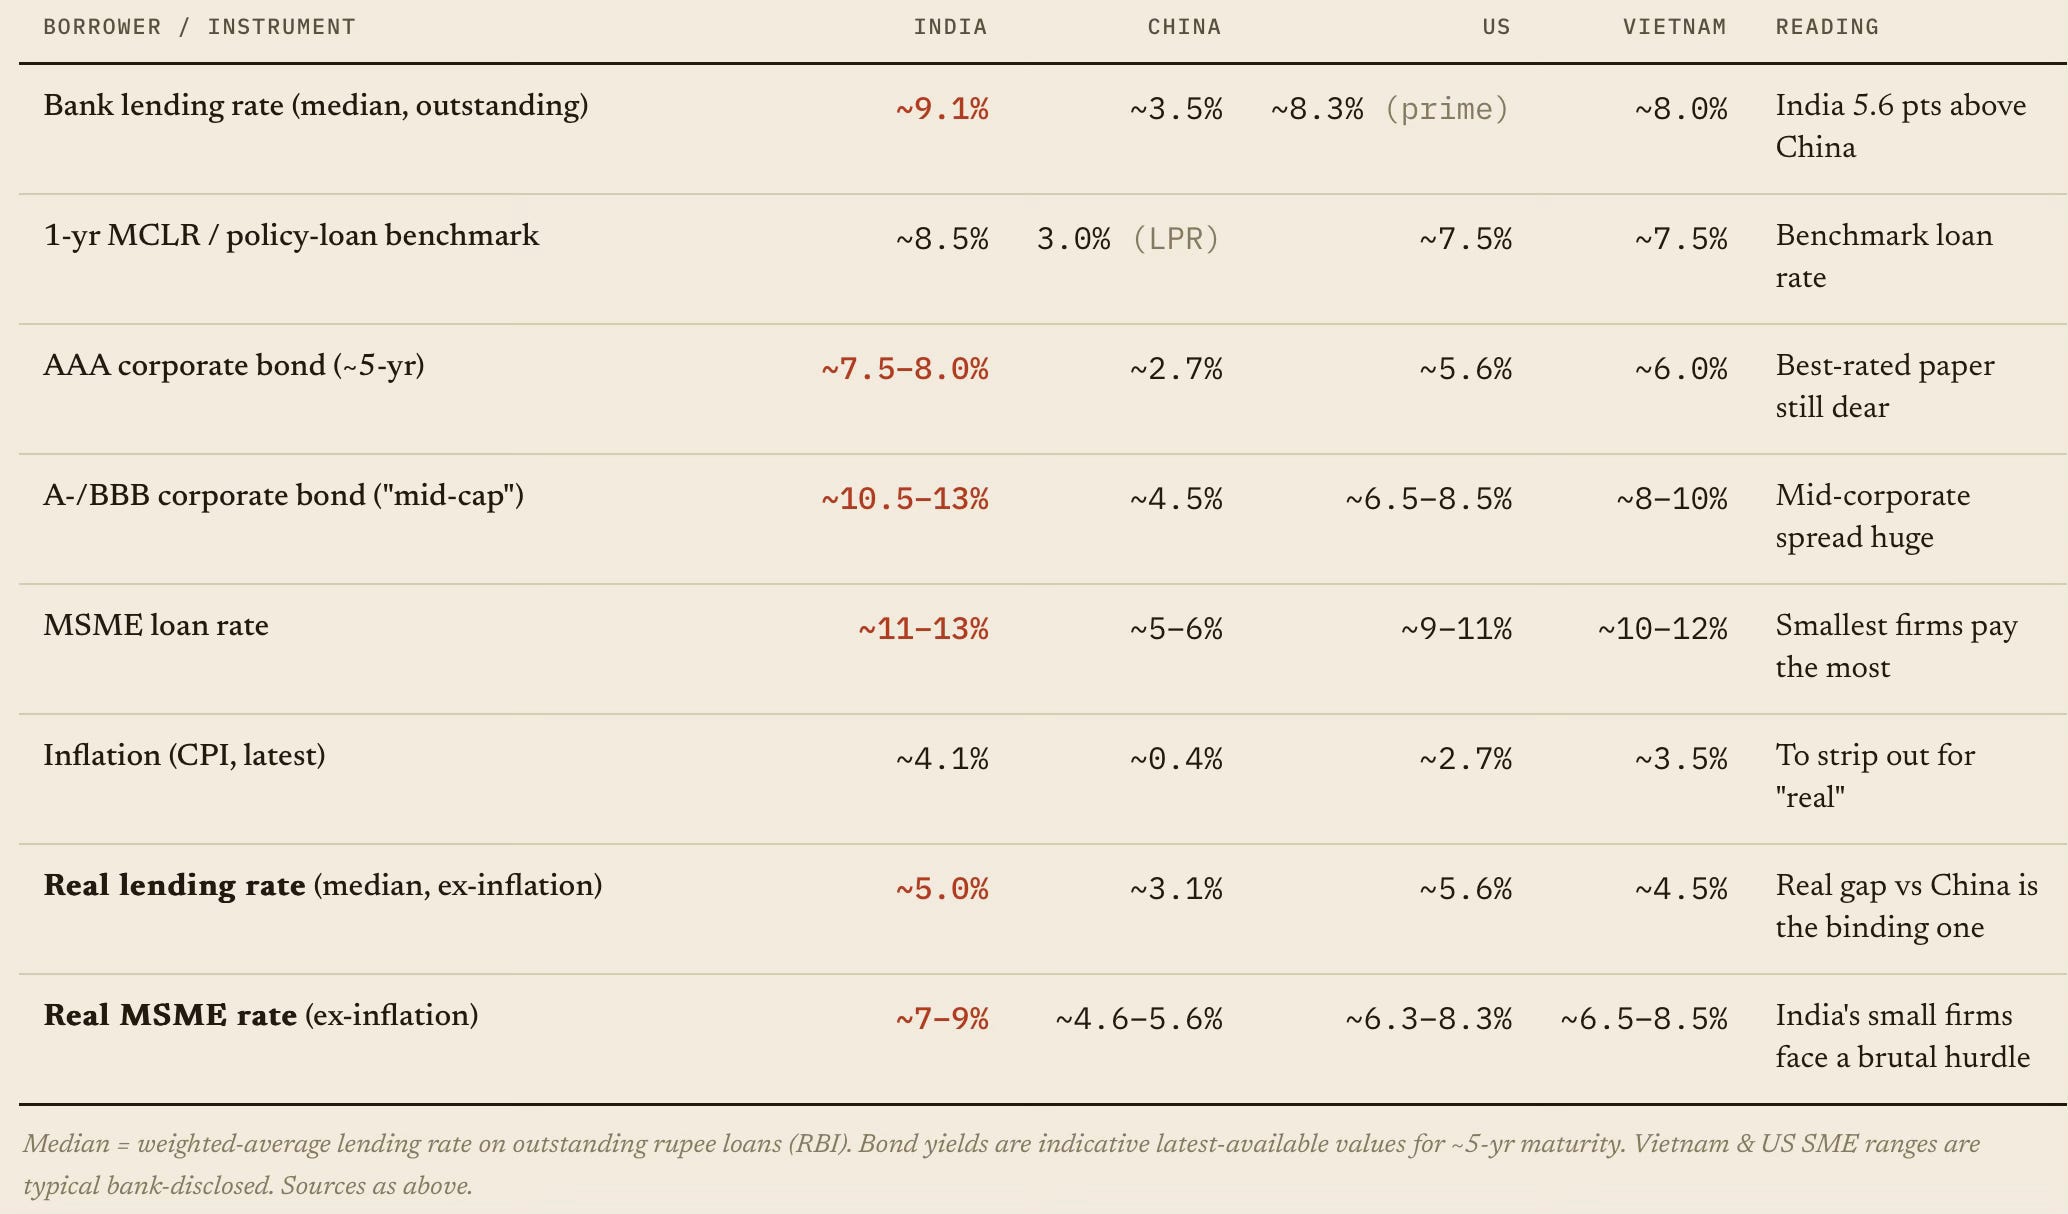
The cost of capital adds to the wedge. The credit-to-GDP ratio measures the availability of capital. The other half of the problem is the price. Indian firms pay materially more than peers - across banks, bonds and the SME segment. In fact, after stripping out inflation, the gap stays large, which is the more realistic measure of whether real investment can clear its hurdle rate.

The capital markets are no different. An Indian mid-cap pays roughly 2–3 times the bond yield a Chinese mid-cap pays and ~50% more than a US one, in nominal terms. After inflation, the gap narrows but doesn't vanish. India's real lending rate (~5%) is ~2 percentage points above China's, and the real MSME rate is among the world's highest. Combined with credit availability stuck at 55% of GDP, this means Indian firms, and especially the missing middle, face the worst combination of dear and scarce capital among large economies.

Let’s dig a bit deeper into the capital cost wedge. 

Econ 101 informed that the high cost of capital is a reflection of the demand-supply mismatch. On the demand side, as we have seen, the high land valuations are encouraging resource misallocation. What about the supply side?

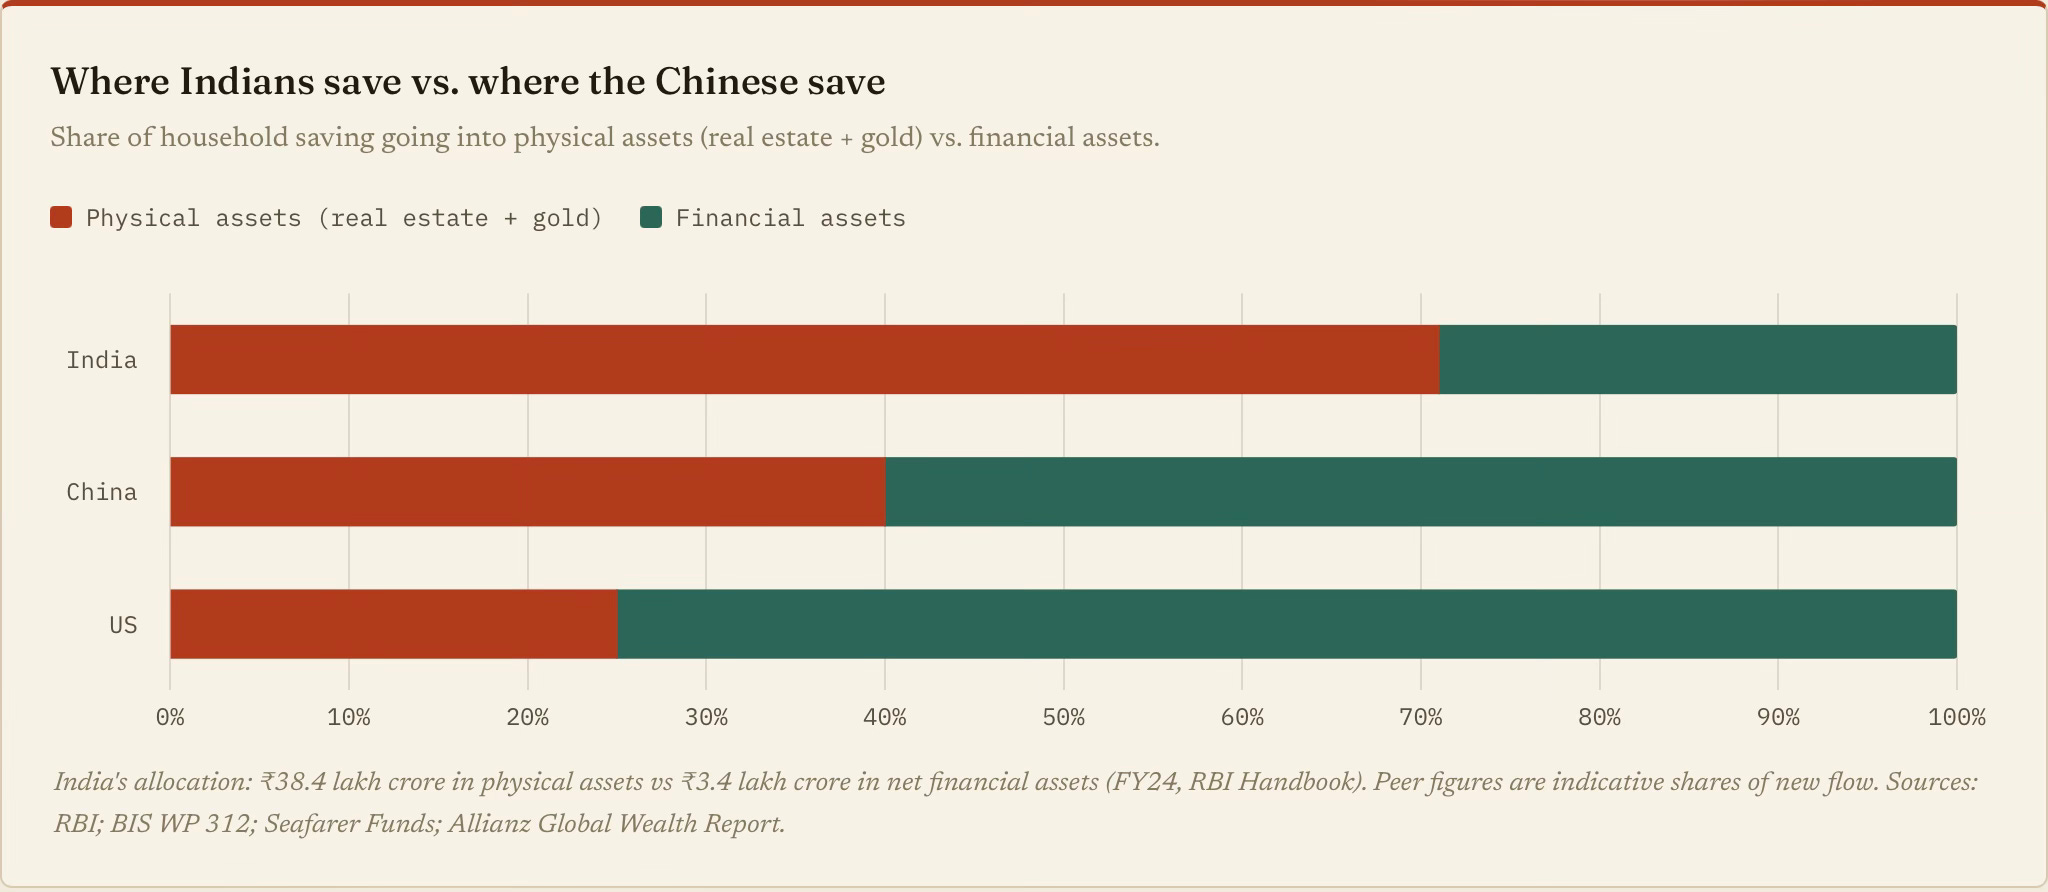
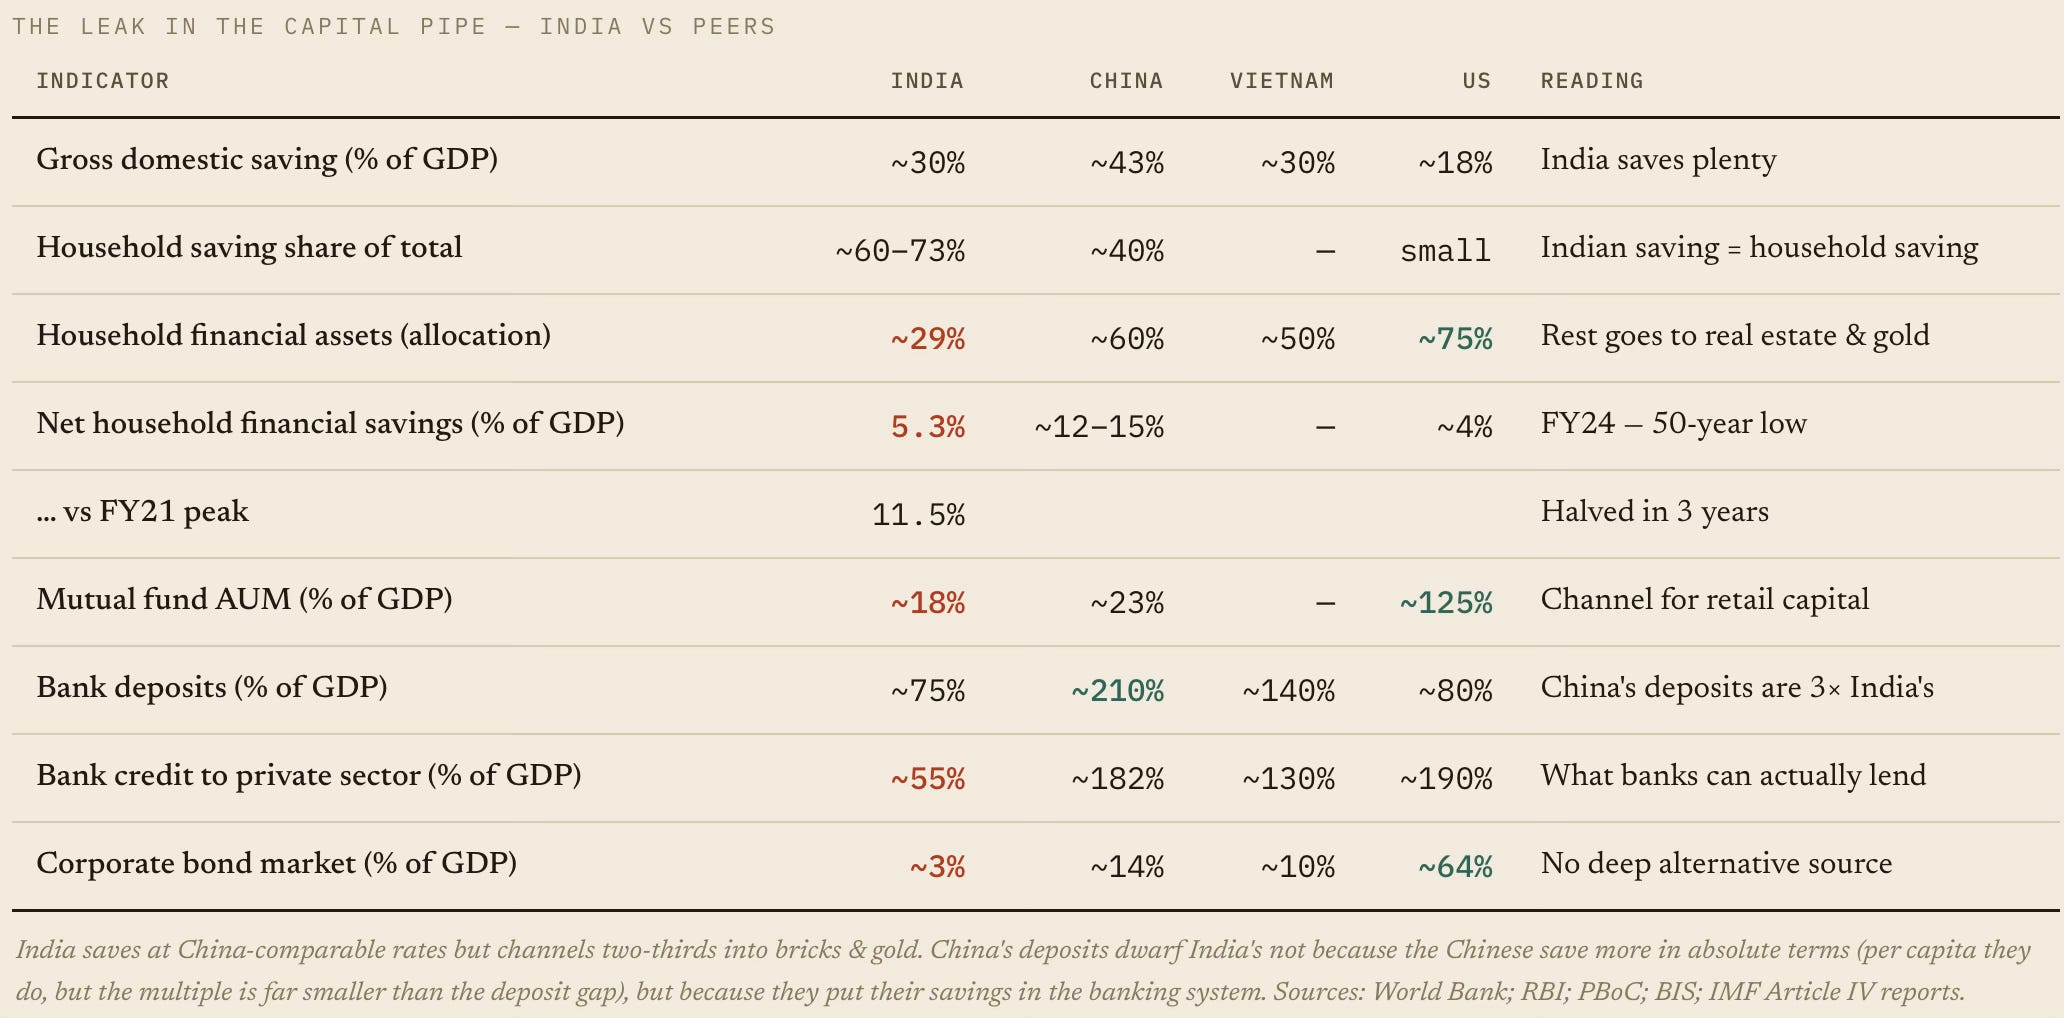
The country’s reasonable gross domestic savings rate (~30%) conceals a disproportionately high share of illiquid assets. When 77% of wealth sits in physical assets (land and gold), and only ₹40 for every ₹100 of household financial savings reaches the financial system, the banks have less to lend, the bond market stays thin, and the price of credit rises. 

In other words, there’s a link between the land and capital problems facing the economy. The causal chain goes something like this - physical-asset preference (land + gold) → low household financial savings (5.3% of GDP) → shallow bank deposits & bond market → low credit-to-GDP (55%) → dear capital (~9% vs ~3.5% in China). The same wealth-allocation pattern that raises land prices also raises the cost of capital. It is one mechanism, not two.

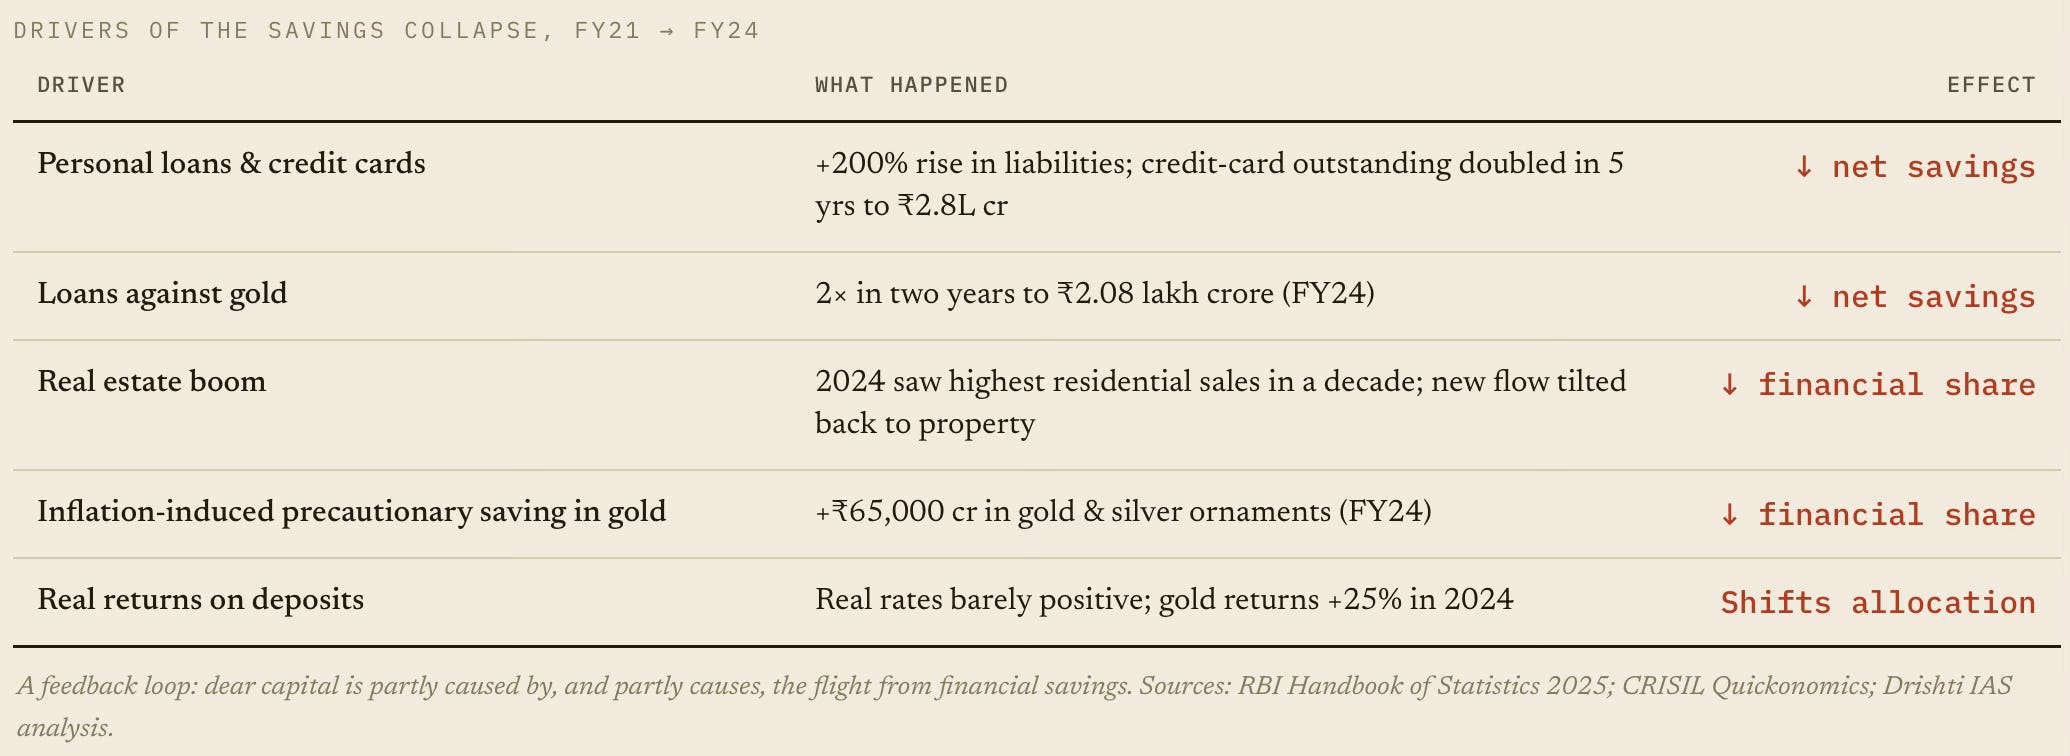
Worsening matters, the net household financial savings fell from ~11.5% of GDP in FY21 to 5.3% in FY24, a 50-year low. The table below breaks down how the cost wedge feeds itself. Households are borrowing more (against assets), and routing more new savings back into physical assets. 

The cost constraints impact the economy in two ways. One, it restrains private investment. Second, it weakens global competitiveness and hurts exports. 

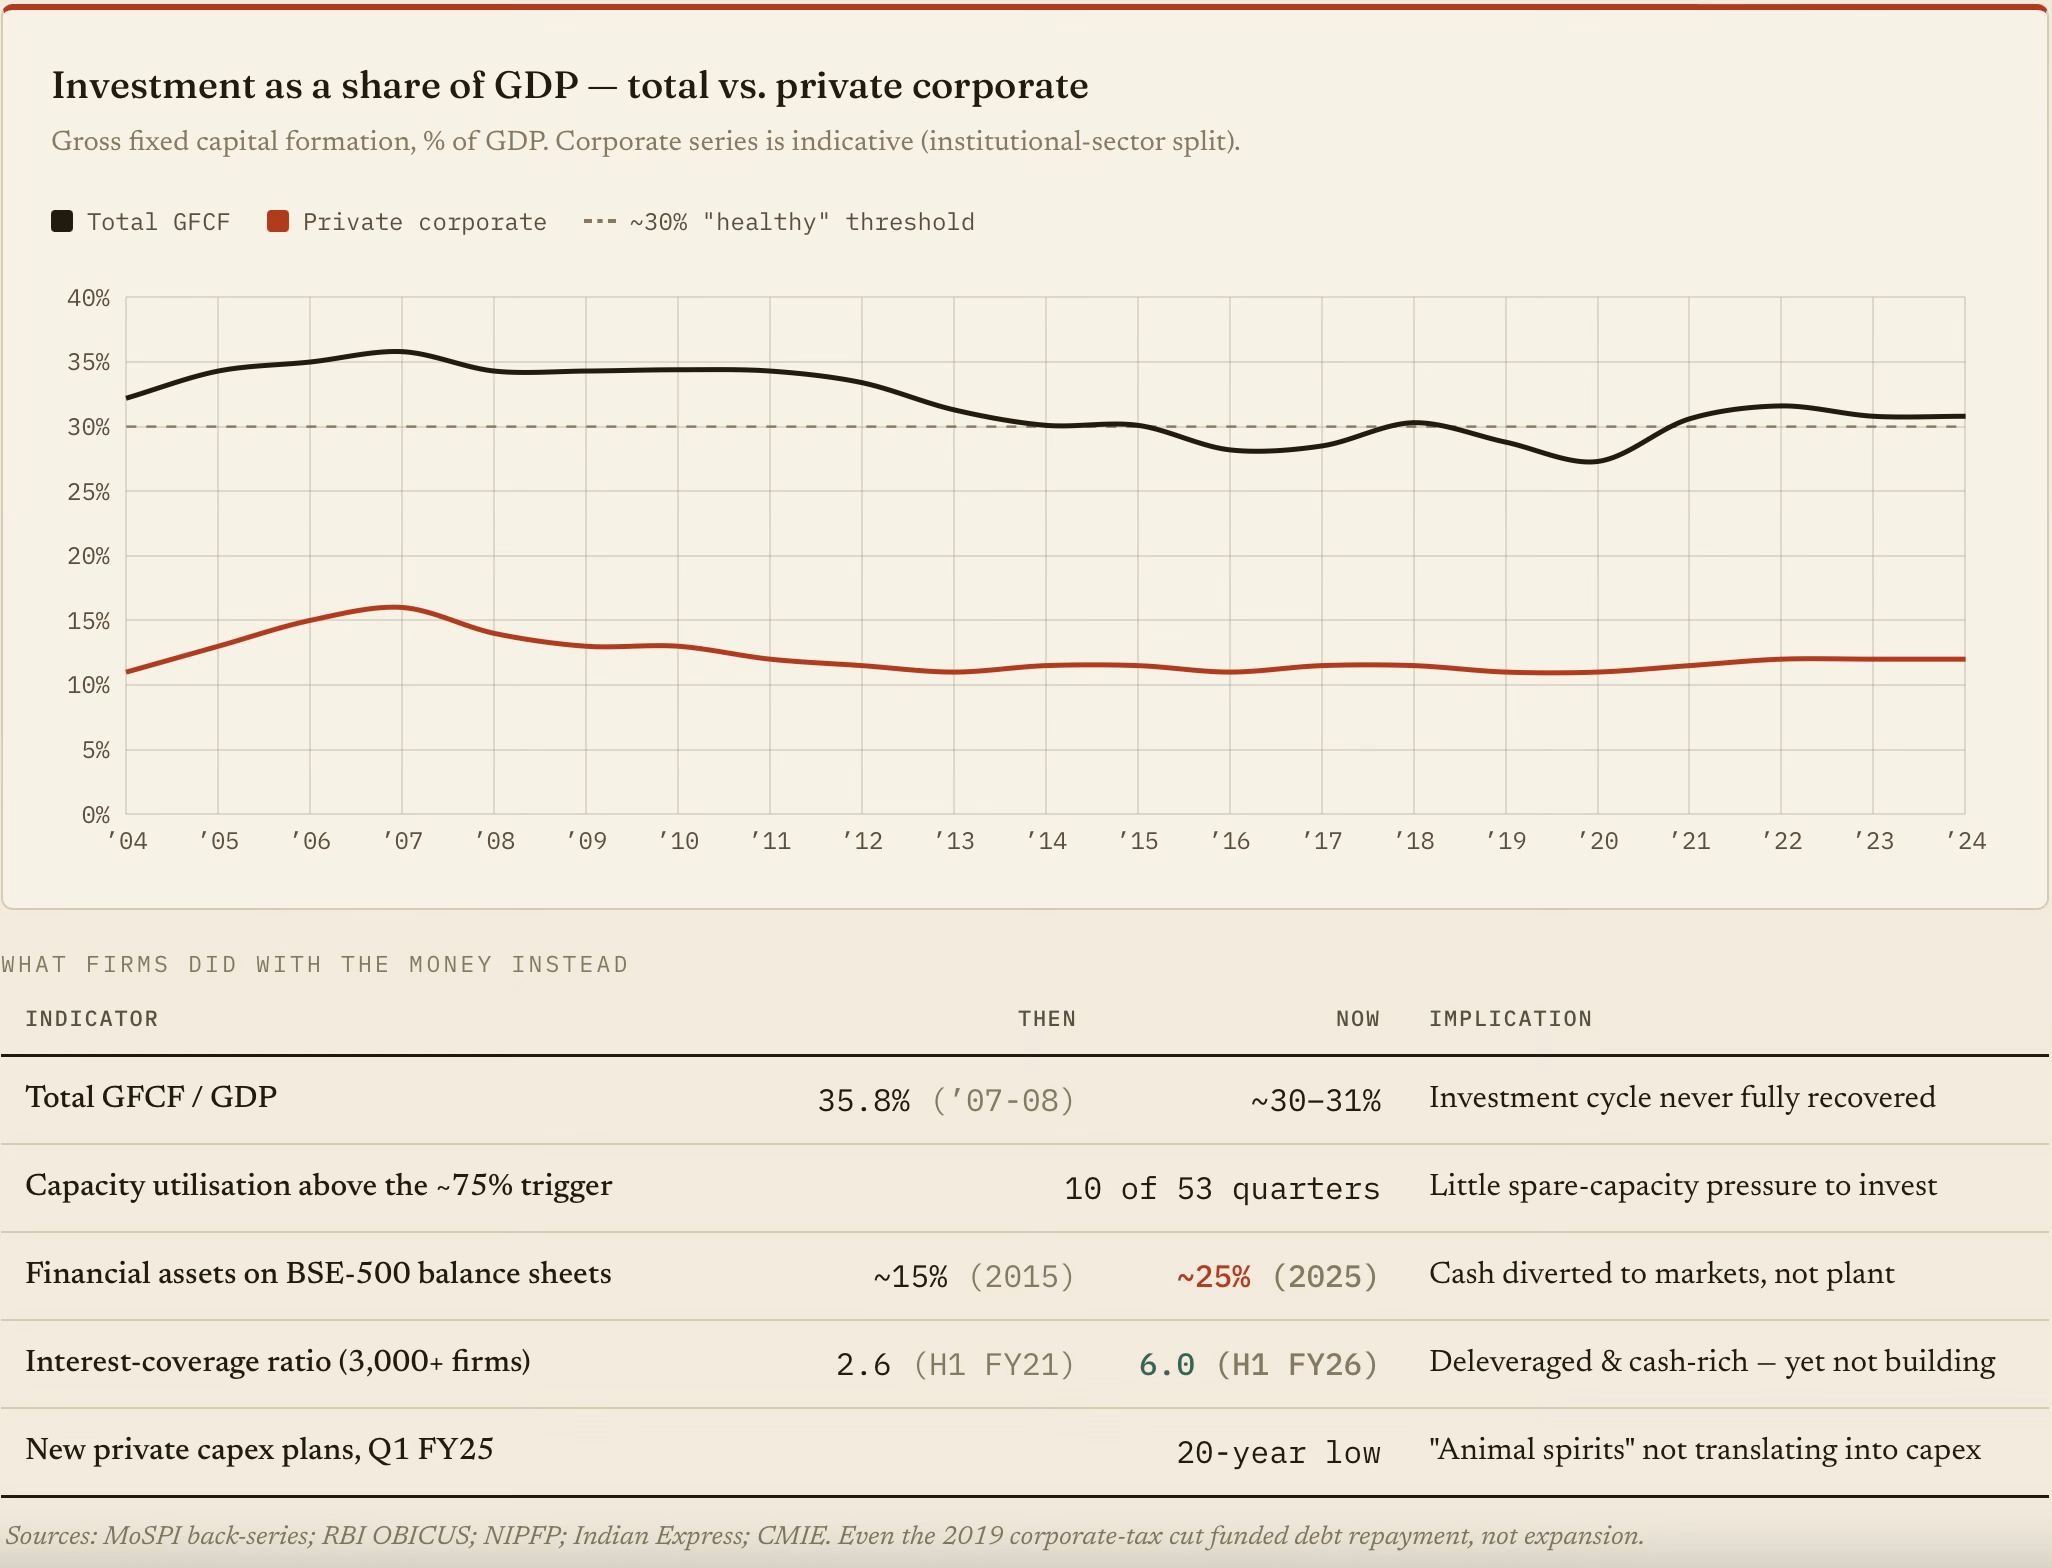
Take the first. Overall investment slid from a 35.8% peak in 2007-08. Public capex has since surged, but private corporate investment never recovered, flat near 11-12% of GDP. Flush with cash, firms deleveraged and bought financial assets instead of building capacity. I blogged here on this. 

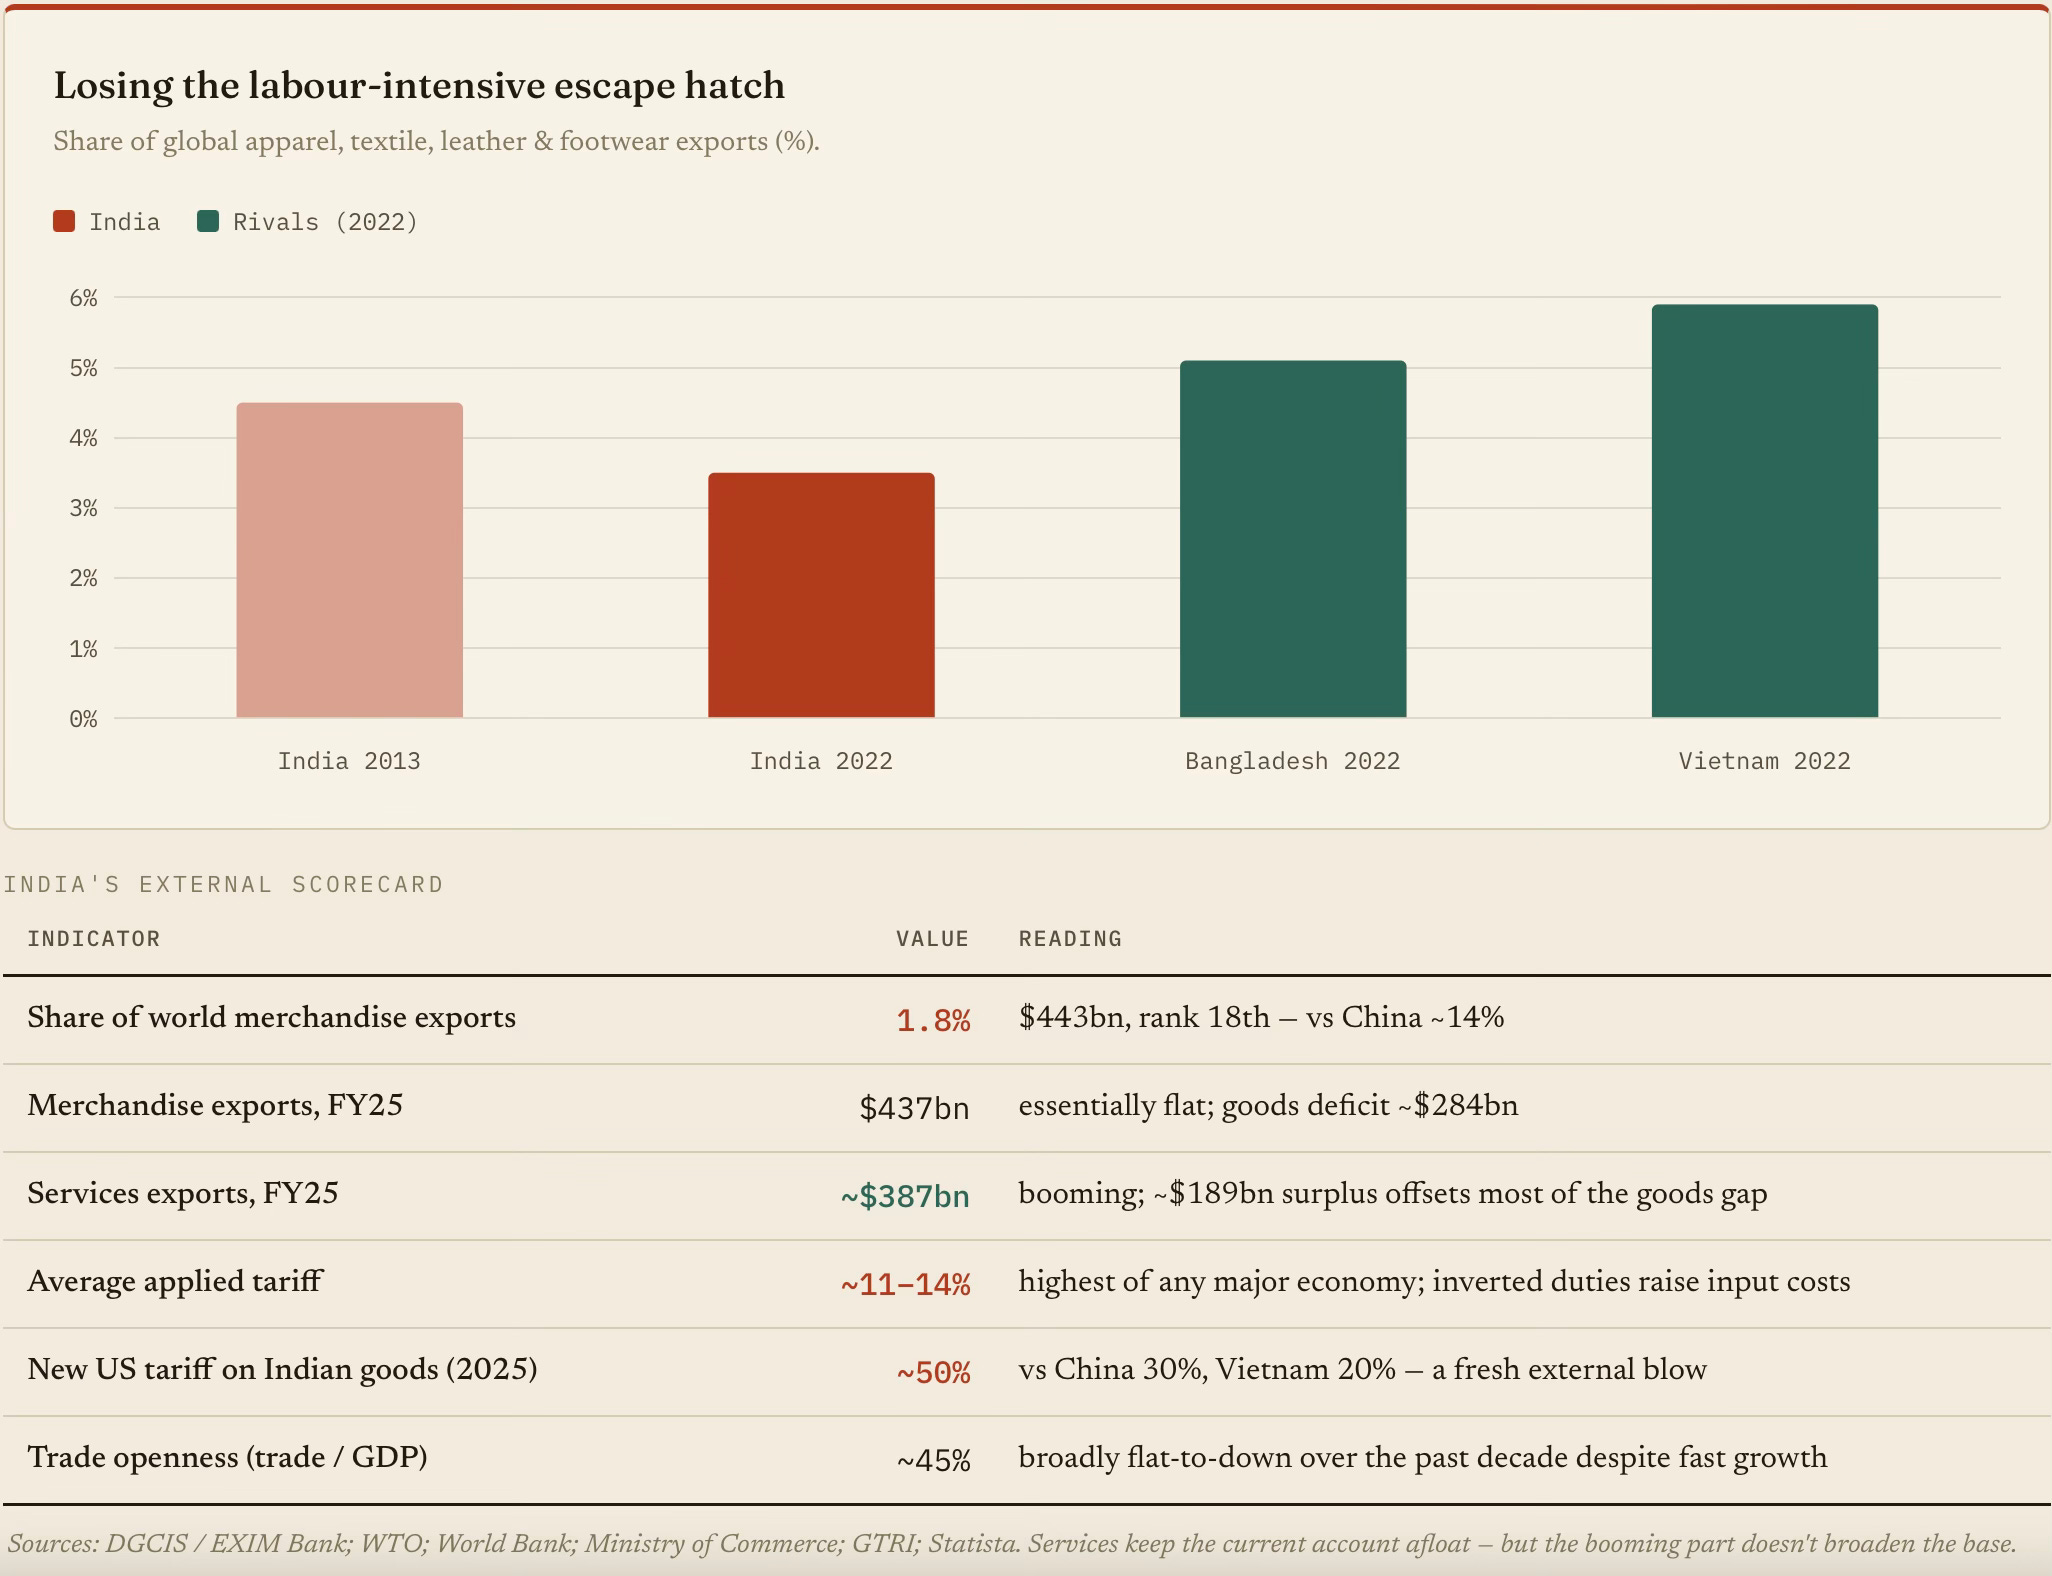
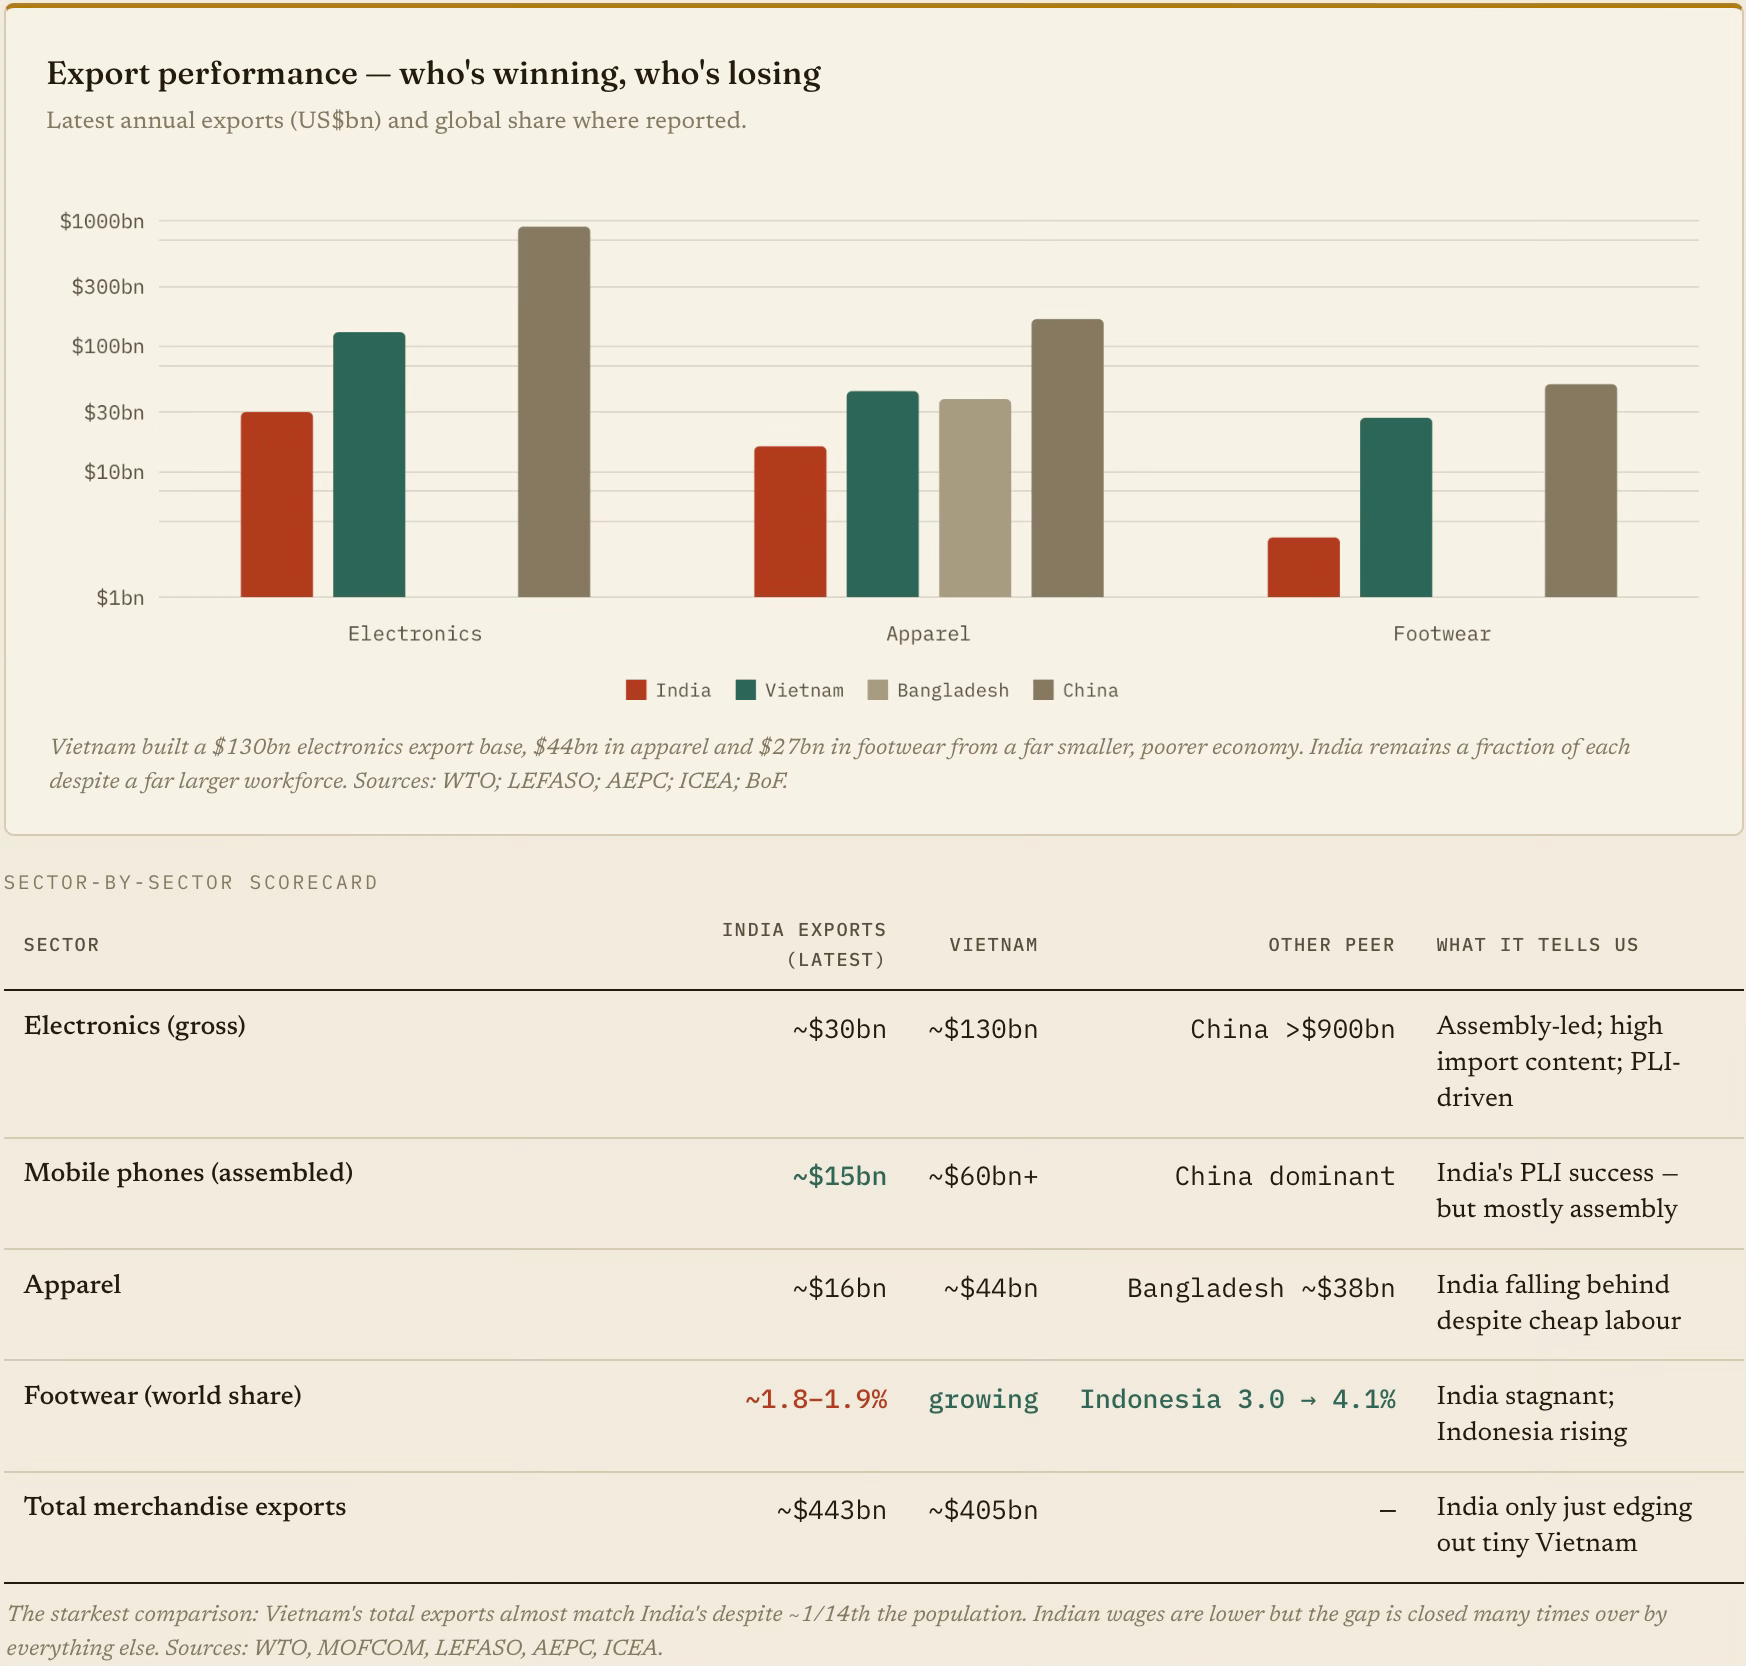
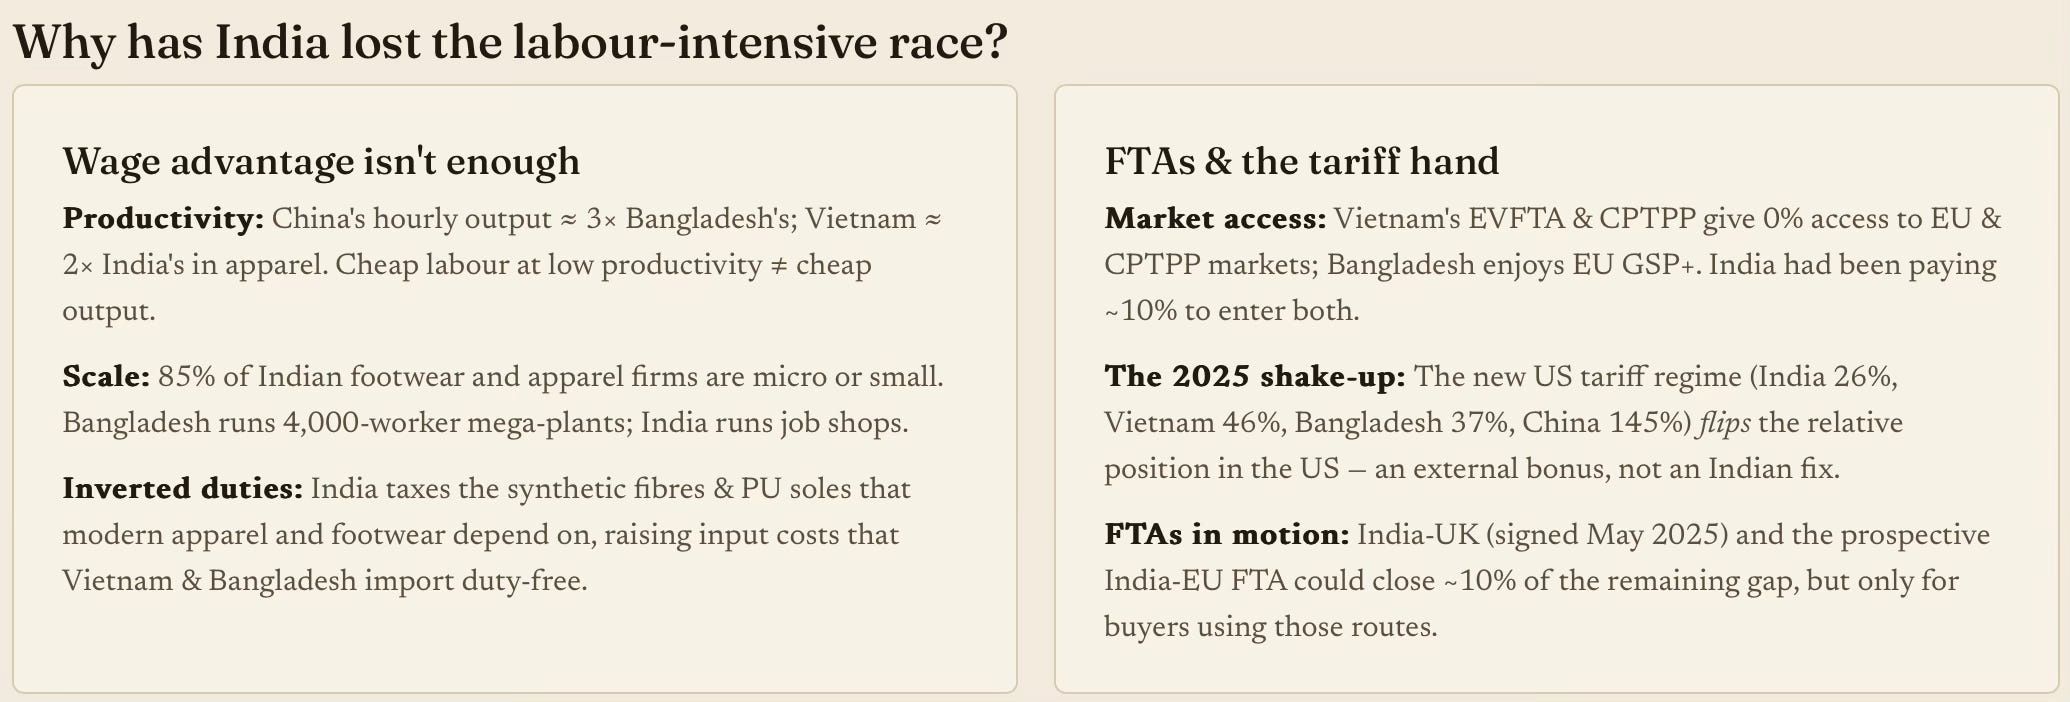
The East Asian economies found exports to rich countries as the outlet to overcome thin domestic demand and drive economic growth. Unfortunately, in India’s case, this is exactly the outlet that the cost wedge closes: dear capital, costly logistics, unreliable power and the world's highest tariff walls all erode competitiveness. The result is that India is losing its share of labour-intensive exports to Vietnam and Bangladesh , even as its overall merchandise share stalls near 1.8%.

In fact, the Economic Survey 2016-17 chapter Clothes & Shoes: Can India Reclaim Low-Skill Manufacturing? warned that the space China vacated was being taken by Bangladesh and Vietnam in apparel, and Vietnam and Indonesia in leather and footwear. A decade later, the warning could not have been more prophetic. 

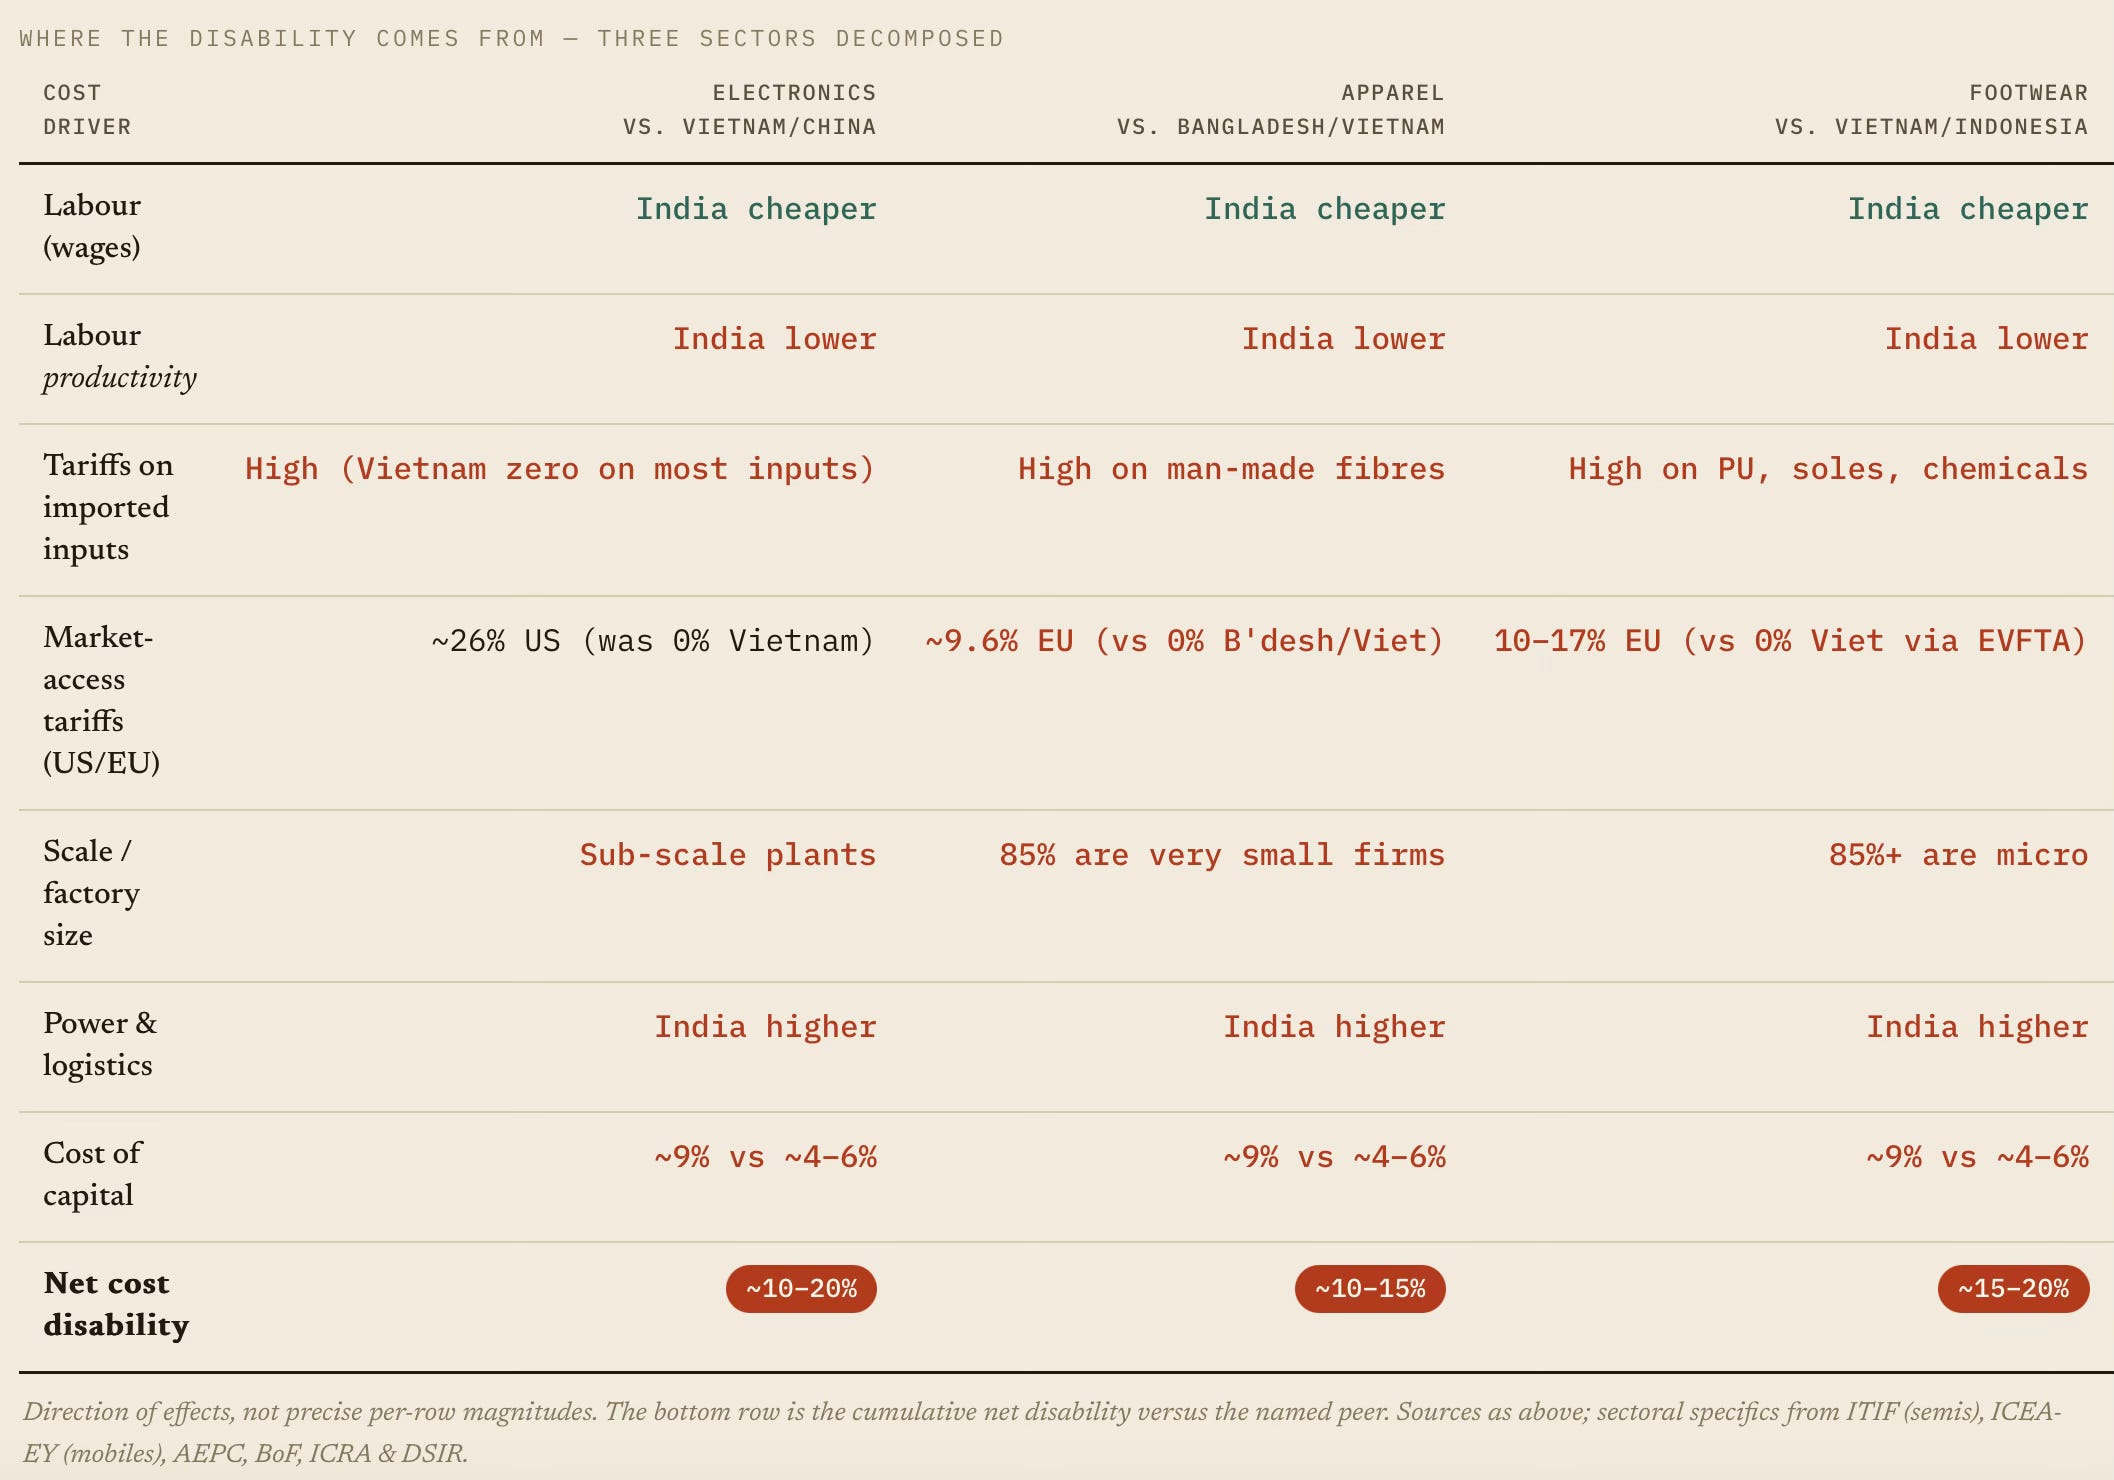
In the net, India wins on wages (~$2.1/hour) but loses on net cost. So the disability is entirely from non-wage factors: capital, power, logistics, scale, tariffs on inputs, and productivity. India has a cost structure that is comparable to that of a developed country. That's the central analytical point.

India enters every labour-intensive sector with the world's cheapest workers and exits with a 10–20% cost disability. This is proof that wages aren't the binding constraint. The wedge comes from the rest - scale, input tariffs, capital, power, logistics and productivity, in a market structure that punishes the firms that should be growing. This is why India hasn't replaced China, where Vietnam and Bangladesh have, despite the structural opportunity being identical for all three.

Indian businesses (and especially manufacturers) face a structural cost constraint. It does not have to do with taxation or wages, but with factors like land, power, fuel, cost of capital, input tariffs, labour productivity, and business size/scale. A disproportionate attention and effort go into taxation reforms instead of these more important structural limiting factors.  

Friday, February 13, 2026

The emerging dilemmas of the new wave of industrial policy

Industrial policy measures are taking shape in all forms across Europe and the US. And they are creating challenges and incentive distortion risks. 

The European Commission is in the process of finalising its industrial policy strategy to prioritise domestic manufacturing in public contracts and to access public subsidies across sectors. 

The Industrial Accelerator Act will set targets for the amount of European-made parts that specific strategic technologies, including renewables, batteries and cars, must have to benefit from government subsidies — a vast redirection of the bloc’s €2tn worth of public procurement towards its own industry. It will also establish conditions for foreign direct investors to transfer intellectual property and employ local workers. Proponents of these Buy European rules argue that they are the only way to prevent the steady erosion of the EU’s €2.58tn manufacturing industry amid high energy prices, competition from cheap Chinese and south Asian products and US President Donald Trump’s volatile trade agenda…

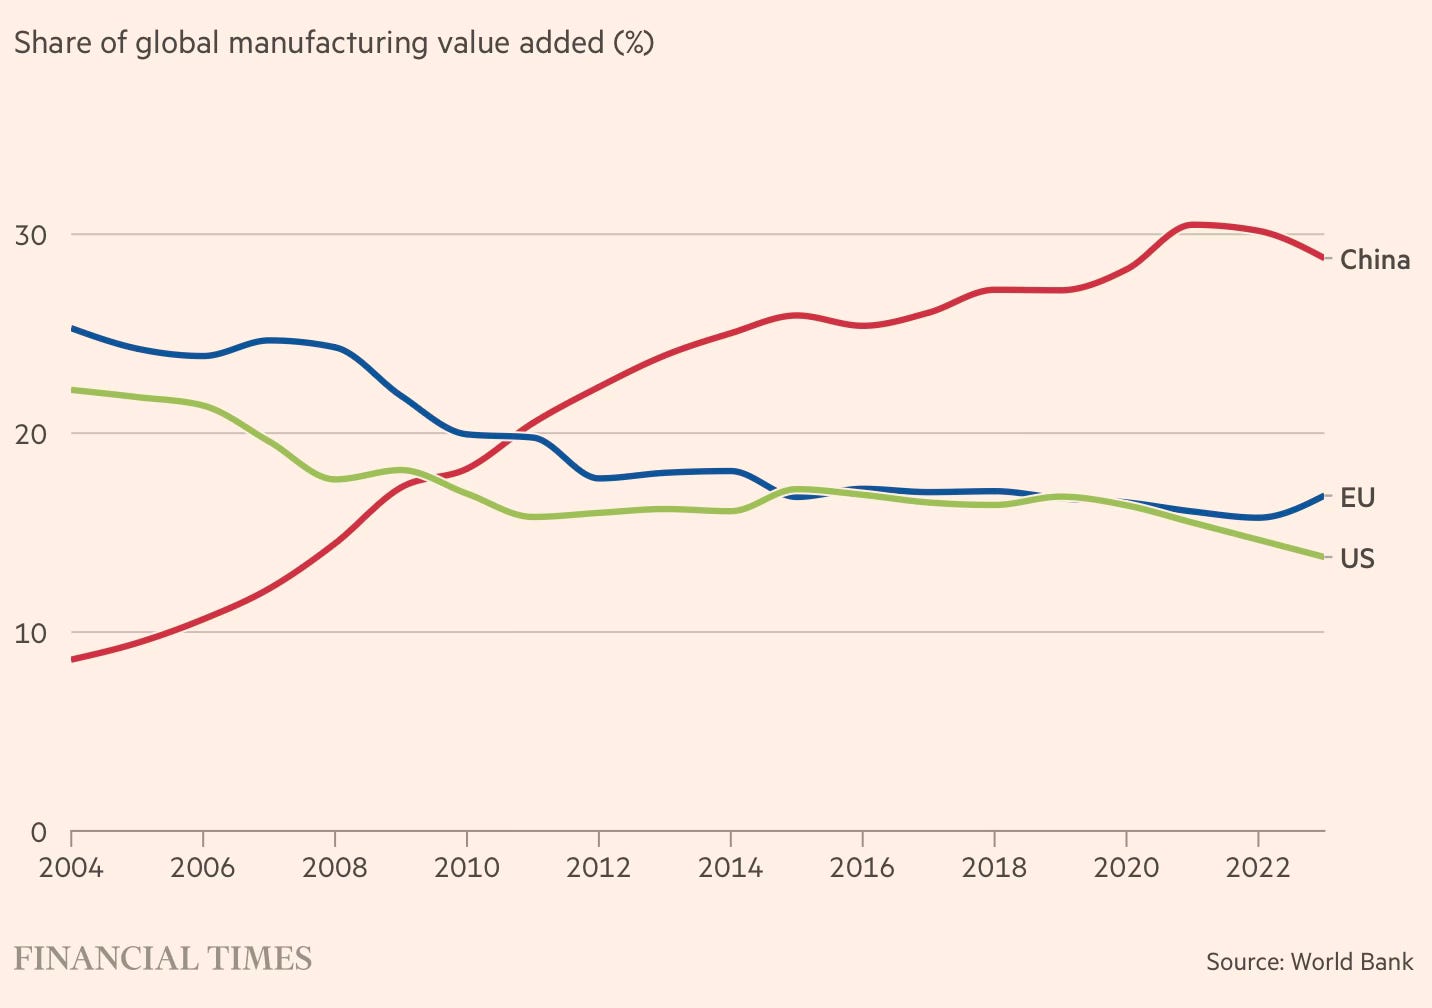
The aim of the act is to ensure that the EU’s manufacturing industry accounts for at least 20 per cent of its industrial output by 2030, according to a recent leaked draft, up from about 16 per cent today. Some officials say the policy bears some resemblance to China’s industrial policies “Made in China 2025” and “China Standards 2035”, which aimed to boost China’s self-sufficiency in strategic sectors and pushed foreign companies towards joint ventures with Chinese businesses to access its market.

The policy has triggered intense debates between supporters, led by France, and those, especially in Germany, who prefer freer trade. 

The debate centres on what “Made in” and “Europe” really mean — whether certain sectors should be prioritised, what countries should be included in its definition and how to avoid pushing costs up too high… The idea of “buy European” clauses to boost domestic industries has percolated in France for more than a decade. In contrast to Germany’s more export-oriented industry, French companies have traditionally relied far more heavily on domestic demand, driven by its sizeable public sector. A “Buy European Act” announced in 2012 by then French president Nicolas Sarkozy never materialised… 

The Commission’s outwardly focused departments such as trade and economy and international development have also been pushing back hard against the most radical plans, fearing that rigid rules would alienate partners and stymie investment… There are also signs of a geographical rift emerging. A person close to discussions on the subject within BusinessEurope, the bloc’s largest business group, describes a “very clear difference of views” with companies from France, Spain, Italy and the Netherlands backing more European preference and those in Germany, Sweden and Denmark pushing back.

Critics have argued that far from promoting domestic industry, excessively restrictive local content requirements will handicap the growth of European manufacturers. They point to the globalised supply chains in sectors like electronics and automobiles, where many critical inputs are dispersed globally, and all of them cannot be competitively produced in any one country. There’s also the fear that such measures will provoke retaliatory measures by others, especially the US, and also conflict with the spate of Free Trade Agreements signed by the EU in recent times. 

Supporters point to the risks of not responding to the market dominance and domestic manufacturing base erosion threat posed by China.

“The way things are now, in eight to 10 years we could be totally reliant on China for EVs,” William Todts, director of the NGO Transport & Environment, says, adding: “If you think you can compete with China without intervention you’re wrong”… There is no doubt, even among supporters of the policy, that it could raise costs. Clément Beaune, Macron’s Europe adviser between 2017 and 2020, says that European companies are “producing in a more expensive and constrained way because we have more rules around environment, climate and social standards”. Europe cannot both protect its industry and compete with Asia on price, he warns. “You have to choose and you have to be explicit.” 

Figures from the International Energy Agency suggest that the cost of manufacturing a battery in Europe could be as much as 60 per cent more than in China, yet the difference to the sticker price of the end product may not always be so great. A study by Deloitte in September shows that… low carbon steel increases the price of the end product, for example a mid-sized Toyota, by 0.7 per cent... Elvire Fabry, director of trade and economic security at the Jacques Delors Institute think-tank, warns that if the Made in Europe provisions are not targeted “it would be not only short term and high cost but also mean a loss of competitiveness”. Georg Riekeles, associate director at the European Policy Centre and a former Commission official working on the internal market, argues that with Chinese overcapacity reaching unprecedented levels, Europe must be bold. If not, it risks introducing more protection of its market too late.

China has displaced the EU as the world’s leading industrial producer. 

The imperative to respond swiftly and strongly to the decline in Europe’s manufacturing prowess also owes to recent geopolitical and other developments.

Russia’s 2022 invasion of Ukraine catalysed the shift in Europe’s trade-oriented mindset. The reliance of the bloc on Russian gas exposed Europe’s dependencies at the same time as the rapid development of Chinese industry underscored the continent’s vulnerabilities. The combination of rocketing energy prices and fierce competition plunged much of its industrial sector into crisis. Covid-19 has also contributed, officials say. EU governments realised they were dependent on imports for everything from drug ingredients to rubber gloves. Brussels proposed last year a Critical Medicines Act to incentivise domestic drug production and mandate stockpiling. The return to the White House of Trump, who has repeatedly threatened the EU with higher tariffs for not bending to his will… and castigated the bloc for its lack of defence spending, has intensified calls for Europe to revive its industry and support its own autonomy.

These measures are nothing new, and only part of a rising trend of raising barriers to trade. In October 2025, the EC announced a decision to halve steep import quotas and impose a 50% tariff on steel imports above a quota set at 2013 levels.

In a novel measure, the US announced this week that it plans tariff carve-outs to chip makers like TSMC that make investments in the US.

The size of the potential rebate programme would be linked to the recent US-Taiwan trade agreement. The White House has agreed to slash tariffs on imports from the island to 15 per cent in exchange for a $250bn investment in the chip industry in the US. Under the deal, Taiwanese companies including TSMC that invest in the US will be exempt from the forthcoming tariffs in proportion to their planned US capacity. The White House said it would allow Taiwanese companies building semiconductor plants in the US to import 2.5 times the new facilities’ planned capacity tariff-free during the construction period, according to an outline of the trade deal released by the commerce department. Taiwanese companies that have already built plants in the US will be allowed to import 1.5 times their capacity. TSMC would be able to allocate the exemptions it earns under the trade deal to its Big Tech clients in the US, allowing them to import chips from the company tariff-free. The size and scope of the rebates for US hyperscalers depend on the production capacity that TSMC forecasts it can reach in the US in coming years.

As part of efforts to in-shore processing and refining activities in critical minerals, the US has unveiled several extraordinary measures, including investments in rare earth processing firms and long-term advance market commitments, and development of strategic reserves on a public-private partnership model. 

Early this year, the US government announced a $1.6 billion investment in USA Rare Earth, a listed Oklahoma-based miner that controls significant US deposits of heavy rare earths.

One person said the government would get 16.1m shares in USA Rare Earth and warrants for another 17.6m, both at a price of $17.17. The government agreed to pay $277mn for the equity, giving it an implied gain of $490mn for the equity and warrants based on the current share price of $24.77. USA Rare Earth will also receive $1.3bn in senior secured debt financing at market rates from the government. The money will come from a finance facility created for the commerce department as part of the CHIPS and Science Act passed in 2022... A condition of the government investment in USA Rare Earth was that the company raise at least an additional $500mn from investors. It is on track to raise more than $1bn because of high demand for the financing deal, which uses a mechanism known as a private investment into a public equity, often called a “Pipe”...

USA Rare Earth, which has a market value of $3.7bn, is developing a huge mine in Sierra Blanca, Texas that it says contains 15 of the 17 rare earth elements underpinning production of cell phones, missiles and fighter jets. It also plans to open a magnet production facility in Stillwater, Oklahoma... Last year, the Trump administration invested in at least six minerals companies, including MP Materials, Trilogy Metals and Lithium Americas. Some of the investments overlapped with the financial interests of people associated with the administration. The government did a funding deal with Vulcan Elements, a rare earths start-up three months after the president’s son Donald Trump Jr’s venture capital group invested in the company... USA Rare Earth has separately tapped Cantor Fitzgerald, the Wall Street firm previously owned by commerce secretary Howard Lutnick and now run by his sons, to raise more than $1bn in fresh equity financing, the people said.

It also announced Project Vault, a $12 bn US program to procure and develop a reserve of critical minerals for civilian and other purposes through a public-private partnership involving the US federal government and US companies.

Project Vault is a public-private partnership that will buy and store critical minerals and rare earth elements. These include gallium and cobalt, which are essential for modern technology and defence equipment. It will combine $1.67 billion in private seed funding with another $10 billion from the US government’s Export-Import Bank... Companies will make an initial commitment to buy materials later at a fixed inventory price. They will also pay some upfront fees. Based on these commitments, companies can give Project Vault a list of the materials they need. The project will then purchase and store those materials. Manufacturers will pay a carrying cost that covers loan interest and storage expenses.

The widening gap with China, the weaponisation of trade, and the growing geopolitical tensions necessitate active and expansive industrial policy measures. In the months and years ahead, the toolkit of industrial policy is likely to continue to expand with ever more novel (and invasive) measures. They will include both domestic market making and (especially in the case of the US) measures that leverage trade to drive foreign investment, a feature of all the trade deals signed by the Trump administration. Sample this with Japan

Proposed projects are screened for “strategic and legal considerations” by a committee of US and Japanese members, according to a joint MOU and a document prepared by Japanese officials. Projects are then sent to an investment committee headed by US commerce secretary Howard Lutnick, who chooses which proposals to send to the US president for approval. Donald Trump has the final say on which projects are “deemed to advance economic and national security interests”. Japan and its state-backed bank can delay or refuse to proceed but face potential penalties, including higher tariffs. Funds for approved projects — from JBIC or with guarantees from Japan’s insurance corporation — then flow into an SPV alongside “the provision of land, water, power, energy, offtake agreements, regulatory support, etc” from the US. Free cash generated by projects will be split equally until the Japanese loans are paid back, according to officials. After that, the US will receive 90 per cent... The way the agreement with the US is structured also means that if Japan delays or refuses to fund a project recommended by Trump, it could be liable for “catch-up” payments or an increase in tariff rates.

All these measures invariably run the risk of capture by vested interests and a gradual slide into protectionism and autarky, not to mention economy-wide distortion of incentives. However, inefficiencies and capture by vested interests are unavoidable to some extent with even the best designed and managed industrial policy. The challenge is to manage the trade-offs and limit such risks while pursuing the primary objective of building domestic manufacturing capabilities. 

These endeavours raise several trade-offs and related policy questions. How do we balance the trade-offs between domestic content requirements and ensuring quality in public procurements? How do we balance the trade-offs between promoting domestic content and autarkic capture by domestic vested interests? How do we balance the trade-offs between the pursuit of self-reliance and resilience with competitiveness and quality? More broadly, how can policy signal definitively that building domestic manufacturing capabilities is not equivalent to protectionism?

How do we signal to foreign businesses and investors the policy objective of building and expanding the domestic manufacturing industry, but at world-class competitiveness and quality? How can large multinational firms get the confidence to undertake gradual technology transfers and commit to going up the value chain? How can governments signal policy predictability and stability that are required for firms to commit large investments? 

A simple answer lies in Joe Studwell’s classic How Asia Works. Tightly managed export competition was central to the difference between the industrial policy measures of the countries of North East Asia and South East Asia. Fundamentally, to avoid capture and distortions, any policy should pass the test of competition. And to shape expectations for investors and firms, it should have clear forward guidance on the policy trajectory going forward.