Substack

Showing posts with label Metro Rail. Show all posts

Wednesday, October 14, 2026

Mass transit and land use planning drives economic clusters

Large urban agglomerations are engines of national economic growth. The fuels that power these engines are the transportation infrastructure and mass transit, supported with enabling land use and development control regulations, value capture and revenue sharing, and institutional architecture. This is the topic of the post.

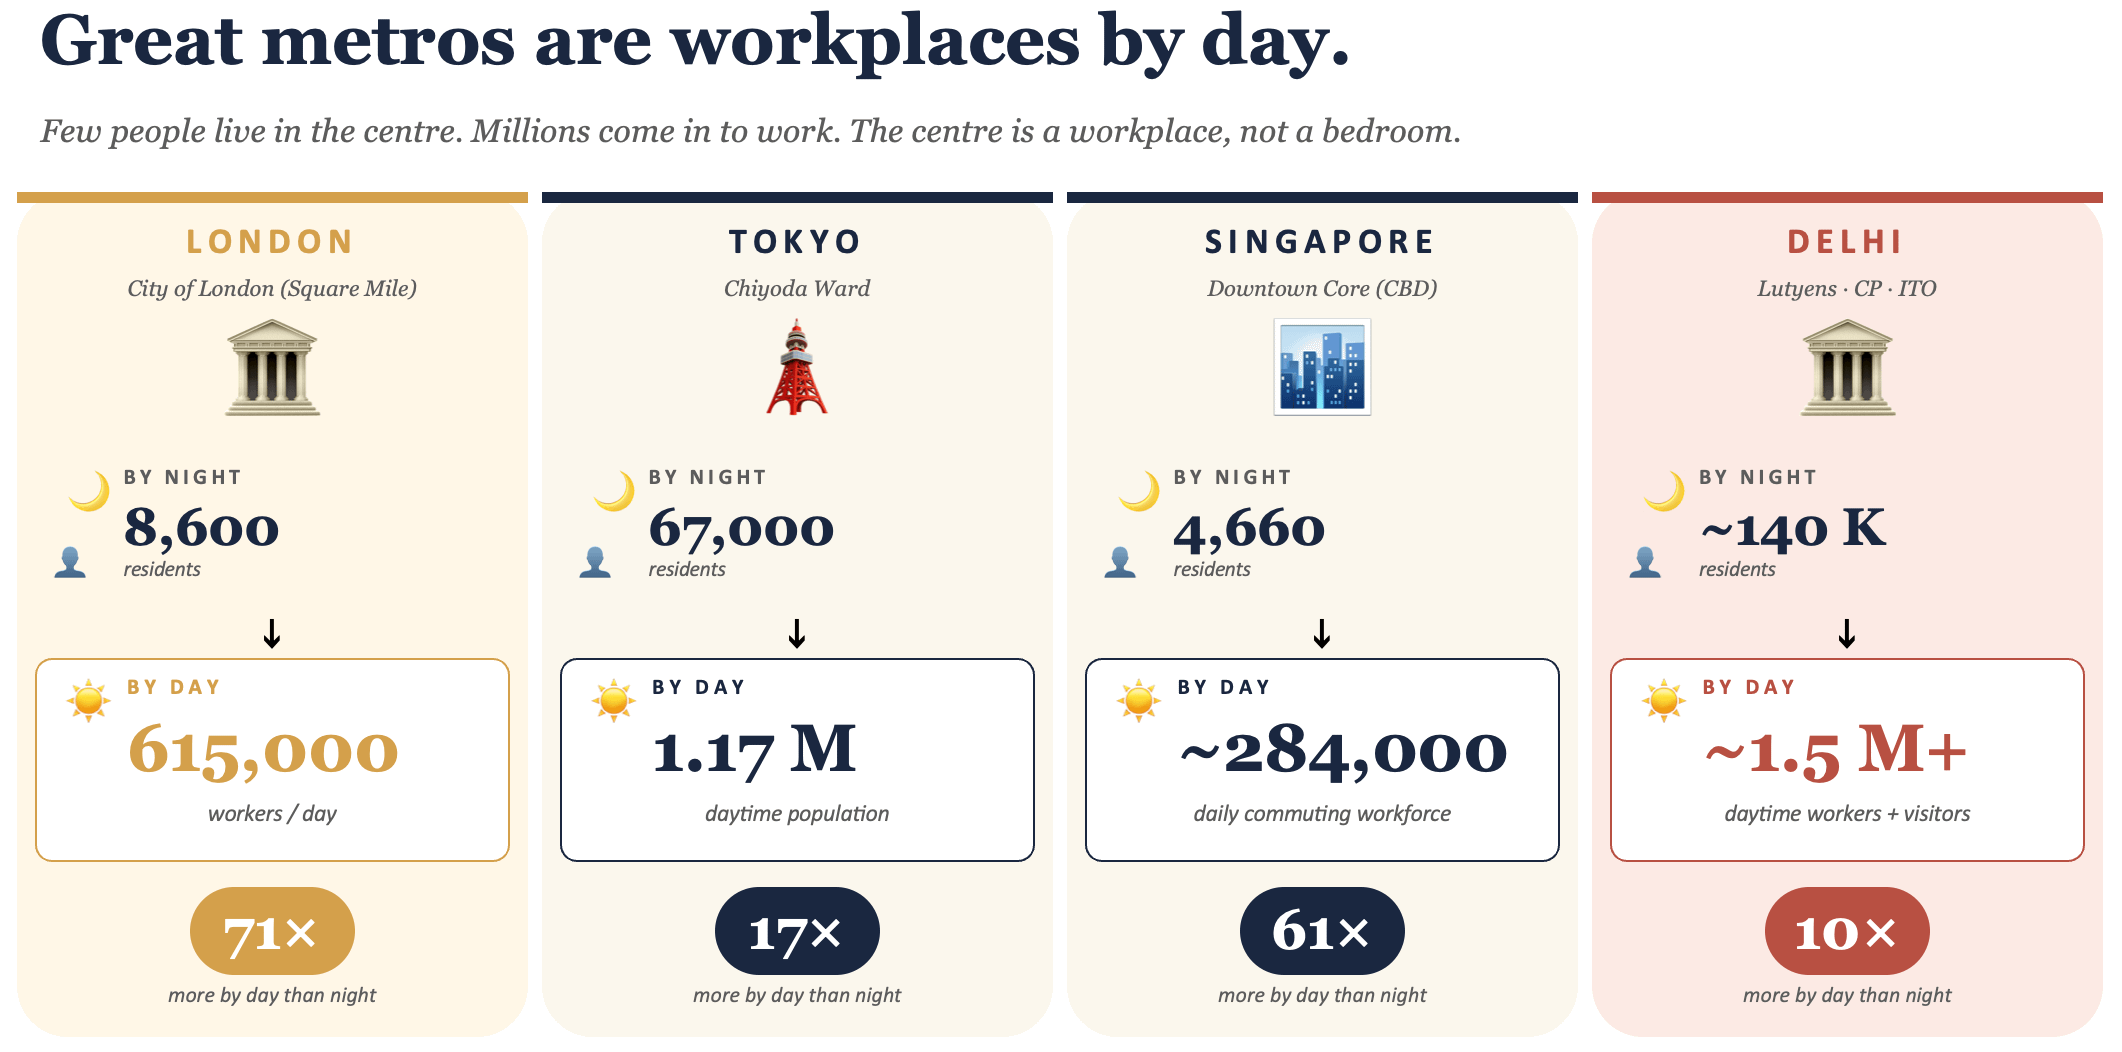
Such urban agglomerations are characterised by clusters of dense, specialised nodes of employment connected to residential nodes by commuter networks. This is the classic model of metropolitan downtowns connected with densified suburban satellite towns that coordinates agglomeration economies at the centre for high productivity job creation.

Accordingly, the central parts of major metropolitan cities of the world are predominantly workplaces, with people commuting to work from suburban areas on commuter railway systems. Mumbai, London, and New York are great examples. This is in keeping with the economic logic of ensuring the most productive use of the highest value lands in the city.

It also unlocks affordable housing supply by locating them predominantly in those areas with lower land prices, thereby relaxing the biggest constraint to affordable housing.

The ingredient that binds the nodes together and creates a dynamic regional cluster is a well-connected mass transit network. In cities globally, commuter and metro railway systems have played this role.

High-volume mass transit systems connect the nodes and bring people closer to jobs. They reshape the geography of what an hour reaches. This trip-shortening effect — making longer distance commutes faster than shorter car trips — is especially powerful in India, where the spatial mismatch between jobs in metropolitan cores and job-seekers in the hinterland has been found to be unusually large. They shrink the distances, thereby increasing the pool of jobs available for people in the hinterland, and expanding the talent accessible for employers in the core.

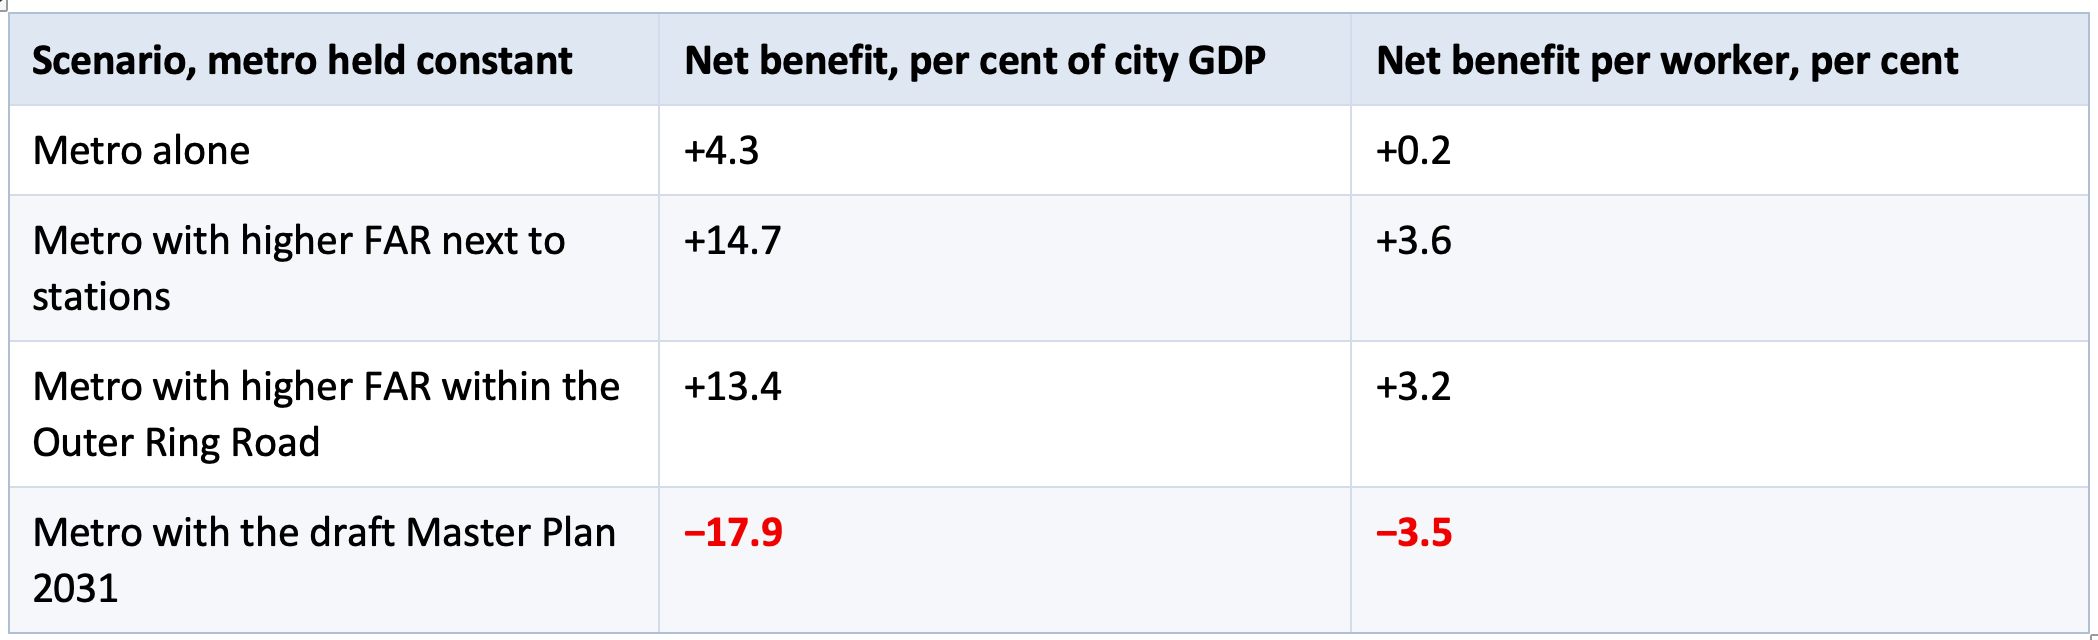
But evidence also informs us that merely laying the mass transit network is not sufficient. This study by Rana Hasan et albuilt a spatial model of Bengaluru and run the metro against alternative land-use policies and came up with the following quantified impacts. 

Holding the metro investment identical, the difference in net benefits between the best and worst land-use plans is roughly 32 percentage points of city GDP. In other words, the land-use plan determines whether the transit investment creates value or destroys it.

The requirement is to locate sufficient density of homes and workplaces within conveniently accessible distance from the stations, either through walk or feeder services. This is transit oriented development (TOD).

TOD is about commuting using mass transit by walking to/from station (to/from home and workplace) or feeder services. A big collateral benefit from TOD is that it avoids the use of cars, thereby decreasing traffic congestion, reducing productivity losses from long commutes, and lowering air pollution.

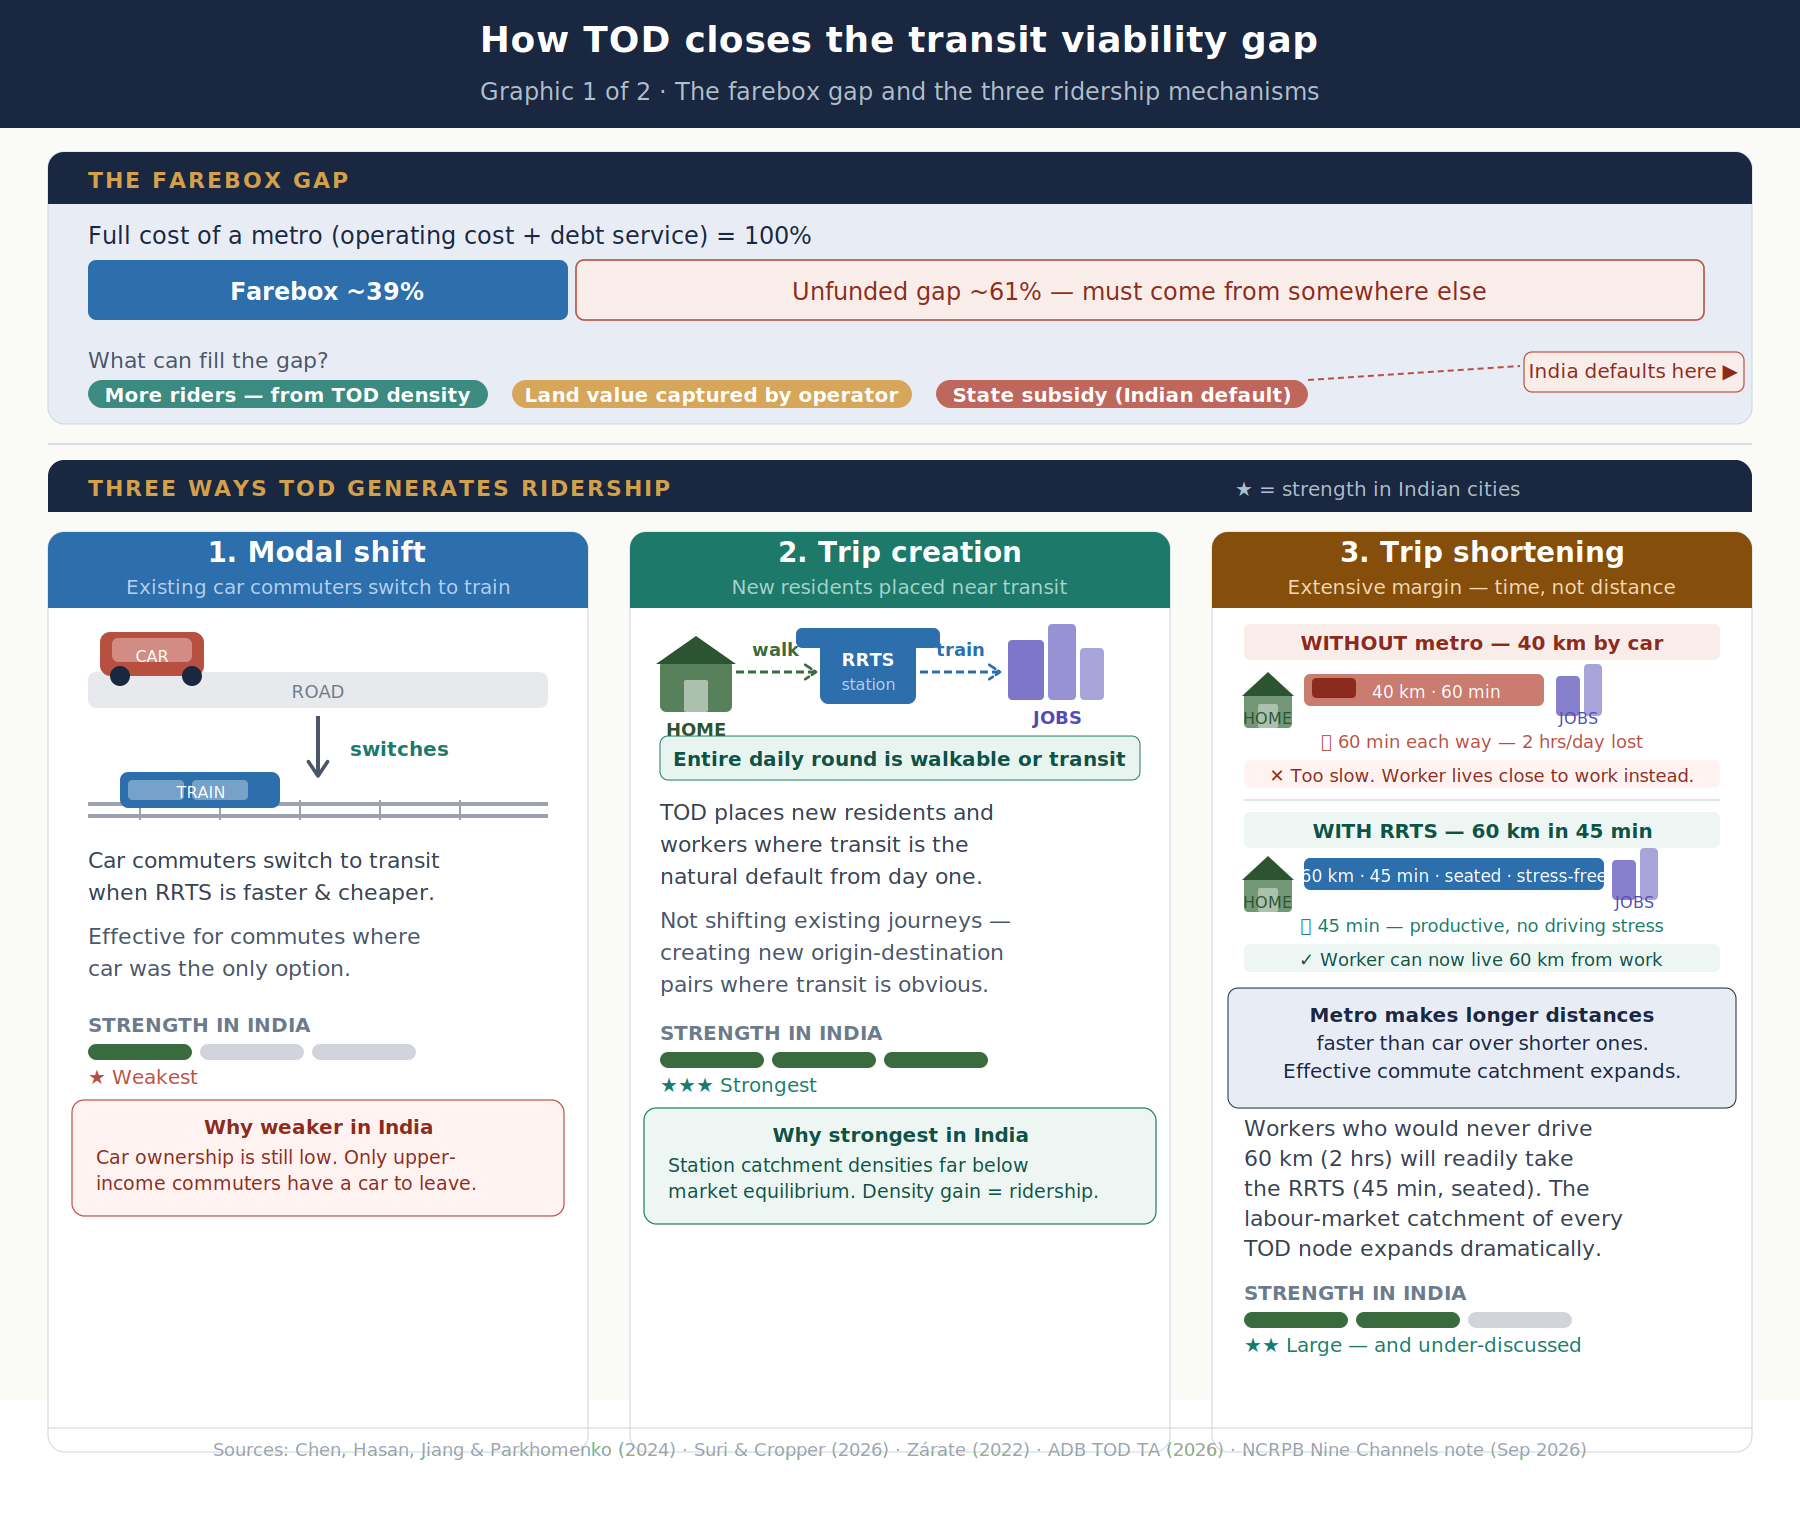
As I blogged here, TOD also increases the commercial viability of the massive investments made in mass transit systems (~ Rs 8 lakh Cr and counting, with 20-30% ridership realised, and massive debt repayment fiscal burden looming). It induces traffic by creating new trips (by locating more people within the transit zone influence area), shortening trip distances (thereby expanding the effective commute catchment), and mode shifts (from cars to mass transit).

Effective implementation of TOD requires addressing three constraints. One, relaxing development control regulations to make it attractive to build density in the vicinity of the stations, and creating the complementary pedestrian infrastructure. It also requires appropriate mixed land-use planning that allows the market to respond in the most efficient manner to order commute patterns and shape spatial growth. 

Two, funding of the mass transit capex, especially by enabling with the right kind of value capture instruments, with the right sequencing, and also the appropriate revenue sharing between the rail company and the local government/UDA. Try to capture value too quickly, before value gets created, and the cluster remains still born.

Three, an institutional architecture that aligns the incentives between those constructing the transit system (and repaying the debt mobilised) and those responsible for the land use and other decisions that determine the commercial viability of the system. This could, for example, entail the radical change of making the urban development authorities the owner of metro railway systems in metropolitan areas.

Wednesday, September 30, 2026

TOD is critical for the commercial viability of Indian metros

I have blogged here making the case for doing Transit-Oriented Development (TOD) around mass transit stations in India, here about the challenges with TOD implementation, and here about the low traffic realisation problems facing metro railway systems in India and the ₹1.07 lakh crore (undiscounted) fiscal burden. 

This post will argue that TOD is the critical requirement for the commercial viability of India’s regional and metro railway systems. TOD is a combination of densified, mixed-use development (supply-side), and walkable streets andintegrated feeder services (demand-side) around mass transit stations. 

In other words, regional and metro railway systems in India can become commercially viable only if they can induce ridership, and this shift would require adoption of TOD at both ends of the commute. 

But India’s regional and metro railway systems are encumbered by structural problems compounded by bad design.

For a start, unlike the successful global mass transit systems which precede real estate development and emerge from an integrated land use and transit plan, Indian railway systems follow it. They try to retrofit into the built-up city and suburbs. Second, as I wrote here, Indian regional and metro rail systems unfairly put the burden of capex on the operating entities without endowing them with the real estate that can be monetised to finance capex. Third, the railway construction entity does not control land use decisions, and those making them do not bear the consequences if their decisions erode the financial viability of the mass transit systems. Finally, making matters worse, they are primarily railway construction corporations, for whom urban planning integration and real estate development are afterthoughts. This is unlike in Japanand other East Asian cities where the metro operators are primarily real estate developers who also build and operate railway networks. 

Given the circumstances of India’s mass transit journey, the best that can now be done is to create conditions to induce ridership and improve commercial viability of metro and regional railway systems. And, as aforesaid, TOD is central to this objective. 

The first order requirement is to induce ridership. This can come from two directions. At the intensive margin, ridership can be induced by shifting existing car users to mass transit. At the extensive margin, it would involve locating commuters within walkable distance of the station and expanding geographical access through feeder services, and shortening the transit trip. 

The intensive margin relies on modal shift among people whose destination and origin are fixed, whereas the extensive margin creates new origin-destination pairs of which mass transit is the obvious mode from the outset. An important, but less discussed, mechanism of the extensive margin is that of trip shortening. The regional or metro rail shortens the commute time to distant places (besides also eliminating the hassle of car-based trips) and brings workplaces closer (in time) to homes and thereby expands its potential users. This trip-shortening effect is typically larger than the modal-shift effect, and second only to ridership induced by locating people inside the TOD zone.

However, while convenience (of avoiding road traffic and walkability at both ends) can induce some mode shifts, getting people who would otherwise not prefer living near a station at all to relocate entails going beyond convenience and also making the place itself liveable and financially attractive. Further, the inducement is significantly likely only if there is a workplace within walkable distance at the other end of the commute.

In the case of metros, it is about densified developments (at both home and work sides) around stations with walkable streets, supplemented with feeder services. In the case of regional railway systems, this is the classic downtown-satellite town mode of development. However, in India, since the satellite towns are already well-developed towns and cities, the station vicinity requirements are similar to the metros.

The walkability part is critical, and one completely overlooked. Densification alone without the ease of walkability at both ends will not induce ridership. Walkability and street connectivity are central to expanding the pool of users. If a commuter who lives 800 metres from a regional railway station still needs to find an auto or shared vehicle because the intervening streets are not well connected, unwalkable, and unsafe, the catchment effective radius collapses to perhaps 200 metres, and the ridership projection drops accordingly.

The demand side (walkability) and the supply side (density) are complements, not substitutes. Building one without the other produces either pleasant low-rise neighbourhoods that don’t fill the trains, or towers in traffic that people can’t walk through. Further, the walkability (and associated liveability), in addition to the mass transit commute convenience, are perhaps critical for also incentivising people to trade-off living in a cheaper and larger housing unit distant from the zone with a pricier and smaller one inside the TOD zone. 

Finally, the mixed-use part is also important. For one, it should provide market participants the flexibility to determine the demand responsive and commercially viable nature of development around the nodes. Further, a node that densifies the area around a station but retains single-use zoning (apartments that connect to the city’s existing car-commute grid) will produce less additional ridership than a node that places offices, retail, and housing within walking distance of each other and of the station. The ridership gain from the second type of node comes not only from the peak commute trip but from the off-peak trips that only a genuinely mixed-use, walkable neighbourhood generates. The former will end up creating a mass transit system that is used only in the 3-4 hours of peak commute times. Mixed-use is therefore critical to generating two-way, all-day ridership.

In other words, ridership of a transit system is determined predominantly by the land use in its catchment — how many people live, work, shop, and study within a walkable distance of its stations, and whether those people can get to and from the station without a car. Building the station but leaving the land use unchanged will not change much. It will produce the infrastructure, but underproduce the demand. This has been India’s metro reality. 

All this means that densified, mixed-use, walkable zones around the station, with convenient feeder services, or TOD, is an essential requirement to achieve significant inducement of ridership. 

The case for TOD is likely more relevant and its impacts greater for Indian cities than counterparts in developed countries. For one, the spatial mismatch between job availability (in the city centres) and affordable housing (in the periphery) is very large. A system that closes this gap generates much greater welfare gain, and therefore much greater demand, than the same system operating in a less mismatched city. 

Further, given India’s low car ownership base, the marginal ridership gain from TOD does not come mainly from convincing existing car users to take the train, but from improving trip quality for those already transit-dependent, and from expanding the pool of riders. Finally, India has a low-hanging fruit to harvest in terms of its low FAR baseline, which allows for significant densification and location of potential transit riders. Relaxing FAR therefore would have an unusually high ridership yield per unit of policy change in Indian cities.

The summary from the Indian context is that the inducement from modal shift is likely marginal, and confined to only those whose commute is already partly walkable and partly by car, or whose car commutes are very long. The larger and more structurally significant opportunity is at the extensive margin from locating new workers and from bringing the workplace closer to homes. TOD is therefore the primary demand generation mechanism for a rail transit system. 

Unfortunately, India’s TOD policies have consistently focused on the supply side (FAR uplift), and that too inadequately, while under-specifying the demand side (street design, parking, block structure). Getting both right is the institutional challenge. It is also something that the argument for TOD-for-viability of metros implicitly assumes but rarely makes explicit.

Saturday, August 29, 2026

Weekend reading links

1. Good long read in the Indian Express about the ridership deficit facing metro railway systems in India. This is a good website for network maps.
Radhika Shenoy, 28, a working professional in Hyderabad’s Secunderabad, points out that last-mile connectivity is a major challenge when she uses the Metro. “Neither my house nor my office is close to a Metro station. So, taking public transport becomes more expensive than using my own scooter or hiring a cab or auto,” she says... Manvika Shivhare, a 29-year-old lawyer based in Lucknow, says most people she knows never use the 23-km-long city Metro to get round the city, preferring to travel in an auto or two-wheeler instead. “The Metro is useful for going to the Airport, for which it would cost Rs 70, while the auto would take Rs 400. But none of us uses it for our daily commutes, since Lucknow is such a small city.” Shivhare says this won’t change even with the upcoming 11-km-long Line-2, connecting Charbagh Railway Station and Vasant Kunj in Lucknow.

2. India's crude oil imports from Russia rise to more than 2.6 million barrels per day in June and July.

For decades, South Korea’s brightest students gravitated towards medicine, and private tutors focused on helping students gain admission to elite universities. Now, some semiconductor departments sponsored by Samsung and SK Hynix — which guarantee employment after graduation — are attracting growing interest, and cram schools are catering to job seekers pursuing lucrative chipmaking careers. In the 2026 admissions cycle, SK Hynix-linked semiconductor programmes at several leading universities recorded higher application rates than medical schools, whose applicant numbers fell by nearly a third to a five-year low. 

Kwon Seok-joon, an engineering professor at Sungkyunkwan University, said generous chipmaker bonuses had altered how students viewed the trade. “For 20 years, medicine was the only path that guaranteed both wealth and prestige in Korea,” he said. “The Hynix bonus broke that monopoly. For the first time, chip engineers are in the same league as doctors when families discuss a safer future.”... In May, Samsung reached a landmark profit-sharing agreement with its 78,000 semiconductor employees, with average payouts expected to approach $400,000 in the memory chip division. Rival SK Hynix agreed last year to distribute 10 per cent of operating profits to workers over the next decade, implying average bonuses of about $500,000 this year based on projected earnings.

4. More evidence of lagging salary growth amidst rising sales growth.

Growth in net sales of 3,057 non-finance companies in the June quarter was 22.18 per cent year-on-year, according to a Business Standard analysis of the numbers from the Centre for Monitoring Indian Economy... Salaries in the June quarter went up at less than half the pace at which sales have grown — at less than 9 per cent... The starkest contrast was in the mining sector, where sales grew 40.83 per cent and salaries and wages 1.04 per cent. Lower growth in wages has likely he­lped operational profits, where margins had come under pressure because of higher costs of raw materials.

5. Labour market expectations from the PLFS 2023 survey data.

Our job seekers expect up to 40 per cent higher salary than actual earnings reported in the PLFS for the same occupation. Male job seekers, in particular, show greater over-optimism in salary expectations relative to women, expecting almost Rs 8,000 more per month than the actual average earnings for these jobs and Rs 8,500 more per month for salaried jobs. Altogether, salary expectations diverge from reality by more than 30 per cent. When we assess the job aspirations and expectations of job seekers who are below 25 years of age in our sample, we find that expectations are even more skewed – again, more so for young men than young women... 

So we set out to inform and expose a random subset of our 3,000 job seekers to the real world and re-surveyed both the informed and the non-informed a year later. Twelve months after receiving information, we find that providing accurate information about job opportunities significantly dampened job seekers’ labour-market expectations of landing their ideal job relative to those who were not informed. Men, in particular, were less likely to report that they were on their ideal career path. This disillusionment is accompanied by a decline in men’s job-search intensity. Thus, as preferred job offers fail to materialise, job seekers adjust their expectations downwards and either remain in the same jobs or drop out of the labour market and enrol at educational institutions.

6. Is fusion energy, the process that energises stars and sun, about to become a reality?

Privately held fusion companies raised $4.5bn over the past year alone, according to the Fusion Industry 2026 report. There are now more than 50 such companies. Last month, General Fusion, a Canadian outfit backed by Jeff Bezos, became the first publicly listed fusion company. These signals hint at an important shift: fusion energy is gradually being perceived less as a scientific challenge and more as an economic one.

7. Made in Switzerland.

Switzerland, where manufacturing still accounts for almost 19 per cent of GDP, twice the contribution from its celebrated financial services industry. The white cross on a red background, emblazoned on products from Heule precision tools to Caran D’Ache pencils, is both a guarantee of quality that is understood worldwide, and a valuable marketing device for Swiss manufacturers... Switzerland has the highest proportion of high-tech manufacturing of any of the OECD’s 38 member countries...
A landlocked country of 9mn people, with few natural resources and some of the world’s highest wages, is not an obvious starting point for a manufacturing success story. But the Swiss made it work. Companies responded to high wages and an appreciating currency by becoming more productive, more specialised, more sophisticated and more expensive, while focusing on global markets rather than their small pool of domestic consumers. “Swiss Made” became shorthand for the result: watches, machinery and precision tools good enough that customers around the world would pay extra for them. One of the results is an economy unusually rich in relatively small companies that dominate particular niches. A study published this summer identified 100 such Swiss businesses, together generating more than SFr40bn in annual revenues. They range from VAT, a maker of vacuum valves used in semiconductor production, to Burckhardt Compression and specialist manufacturers such as Rondo, whose machines shape dough into pastries in bakeries around the world...
That strength is underpinned by an unusually deep apprenticeship system. About two-thirds of young Swiss pursue vocational education and training, most learning partly inside companies — supplying manufacturers with generations of machinists, technicians and other skilled workers. Bern pushed its commitment to open markets still further in January 2024 when it unilaterally abolished all tariffs on imports of industrial goods. The government argued that such protection had become counter-productive: cheaper imported components would reduce costs for Swiss factories embedded in global supply chains... at least 60 per cent of manufacturing costs must generally be incurred in Switzerland and an essential manufacturing step must take place there for the product to qualify as “Swiss Made”.  

But protectionism and the appreciating franc are denting the country's competitiveness and manufacturing base. 

8. The changing face of economics research. First, the dominant fields of research are changing.
Second, it is reaching out to other disciplines.
A research paper by Tom Harris, an economics PhD student at the London School of Economics, bears this out. Aggregating the literature published in 24 leading economic journals between 2000 and 2025 and NBER working papers between 2021 and 2025, he found the share of papers written by teams spanning different fields had jumped 16 points to 35 per cent between 2000 and 2025, while solo-authored papers fell as a proportion of the literature from 34 per cent to 15 per cent.
Third, economics research is becoming more empirical.
Research from Prashant Garg, a postdoctoral researcher at Bocconi University, and Thiemo Fetzer, economics professor at Warwick University, finds causal claims in economics have jumped. In 1990, 7.7 per cent of claims made in the literature were causal. In 2023, that hit 32.6 per cent. Additionally, papers with more causal claims are more likely to receive citations and wind up in top five journals, the research suggests.
And this turn to empiricism has had not so good consequences.
Results derived from real-world data and experiments are hard to replicate under the same conditions and methodology, with research suggesting that up to 70 per cent of recently examined economics papers contain some results that cannot be reproduced. Sometimes this is simply because the data is broken or otherwise unavailable to other researchers, although other theories abound: pressure to publish, data manipulation, patterns of funding and structural incentives in the academy, for instance. There are also cynical explanations, such as questionable research practices or fabricated data sets.
9. Israel's economic squeeze on Palestine is less reported but adds one more dimension to the genocide.
Israel quickly canceled permits for tens of thousands of Palestinian laborers to reach their workplaces in Israel... Since the start of the Gaza war, unemployment in the West Bank has skyrocketed to 28 percent, more than double the rate before the conflict... Then, in May 2025, Israel started confiscating hundreds of millions of dollars per month in import taxes that it collects on the Palestinian Authority’s behalf. This revenue stream accounts for about two-thirds of the West Bank government’s budget for 2026 of about $6 billion, according to Palestinian officials. That deficit has forced the Palestinian Authority to lower the salaries of 140,000 civil servants and security officers, shorten school weeks to three days and accumulate billions of dollars in debt... 

Israel has also erected new roadblocks across the West Bank, stifling the movement of goods within the territory... Israel has also limited the amount of shekels that Palestinian banks are allowed to send to Israeli banks, a crucial process that helps enable Palestinian merchants to buy goods from Israel and the rest of the world. The Netanyahu government permits quarterly transfers of about $1.5 billion from Palestinian to Israeli banks — far less than previous administrations allowed. The restrictions have resulted in about $5.7 billion languishing in bank vaults in the West Bank, according to Palestinian government and banking officials.

10. The public sector dependency in the UK

In Britain 50-60 per cent of the electorate works in the public sector or gets benefits or a state pension, suggesting a tipping point has been hit.

11. India's labour market facts of the week.

A new NITI Aayog report notes that about 87 million people aged 15-29 are outside education, employment or training, while only 8.25 per cent of graduates are employed in jobs aligned with their qualifications.

12. The Economist has an excellent article that points to research about the impact of AI on students. David Stromberg of Stockholm University and Victor Lei and Wu Yanhui of the University of Hong Kong tracked 27,000 pupils aged 12-18 in China, where AI adoption has been fast. Around 80% reported using models such as Doubao and DeepSeek, and the other 20% formed the control group.  

After six months, pupils using AI saw their average homework score rise by 18% across all subjects. The time they took to complete each assignment fell from an average of 64 minutes to 45. But come exam time, the same students scored 20% below their classmates who had not called on AI’s help. Homework scores once predicted exam performance; now those who score highest are, perversely, more likely to do worse in exams.
The drop in exam scores was concentrated among students who rushed their homework. Those who used AI but spent as long on assignments as non-users paid little penalty. What matters, then, is how pupils use the technology. Those whose exam results remained strong were not simply copying and pasting answers to save time. More likely they used the chatbots as a personal tutor, perhaps to explain difficult concepts or help solve specific problems.
John Burn-Murdoch says this finding underlines the importance of conscientiousness (or self-discipline) in this modern digital age with all its distractions and access to shortcuts. 

Thursday, July 30, 2026

Some thoughts on metro railway systems in India

This post will analyse metro railway projects in India, highlight their failings and make some suggestions.

There are three reasons why metro projects globally struggle to be sustainable, even on the Opex. One, the original traffic projections were on the higher side, making the revenue forecasts a non-starter. In other words, the metro should never have been built. Second, the ticket prices were kept too high, resulting in less demand. Third, there is limited induced ridership due to the lack of TOD, parking facilities, and modal integration. 

The first is a common factor associated with projects globally (optimistic forecasts to justify otherwise unviable projects). The second is a tricky problem insofar as lowering it further risks significantly worsening the financials of the metro. Besides, there is enough evidence that metro ticket prices are reasonable across cities. And the real problem is less the fare level than the generalised cost of the trip, or the fare plus the last-mile penalty (arising from the need to change modes, and the lack of any modal integration).

The last one is especially important since the metro is a large investment that is made to shape the city's growth, specifically by densifying the walkable vicinity of its stations and thereby inducing captive ridership. This is the biggest source of sustainable passenger ridership for the metro. Thin station catchments may well be the binding constraint to the operational viability of India’s metro systems. 

India's experience with TOD has been disappointing. None of its 900-odd metro stations is a TOD (densified residential and/or office spaces, which enable walkability from the station to house/workplace). This is unsurprising since the TOD policies generally suffer from poor design. There is also the reality that very few metro projects globally can recover even opex with the farebox collections and rely on real estate and other commercial revenue streams. More on it later. 

In addition to the three demand or revenue-side challenges, there is also a cost-side problem. They include the wrong mode selection - choosing an underground full metro when light rail or bus rapid transit system would have sufficed. The low-cost foreign loan is deceptive since a depreciating rupee inflates the cost (though the Yen, the major source of metro debt, has been depreciating or holding steady against the rupee). Further, the linear stunted network topology, as against a connected grid, limits ridership. Most Indian systems are linear stubs, so they sit permanently below the ridership threshold at which farebox economics turn. As an illustration, Chennai’s finances turned around dramatically once Phase 1 closed the loop, with ridership surging from 13% of projection at CAG FY20 to now ~60%. 

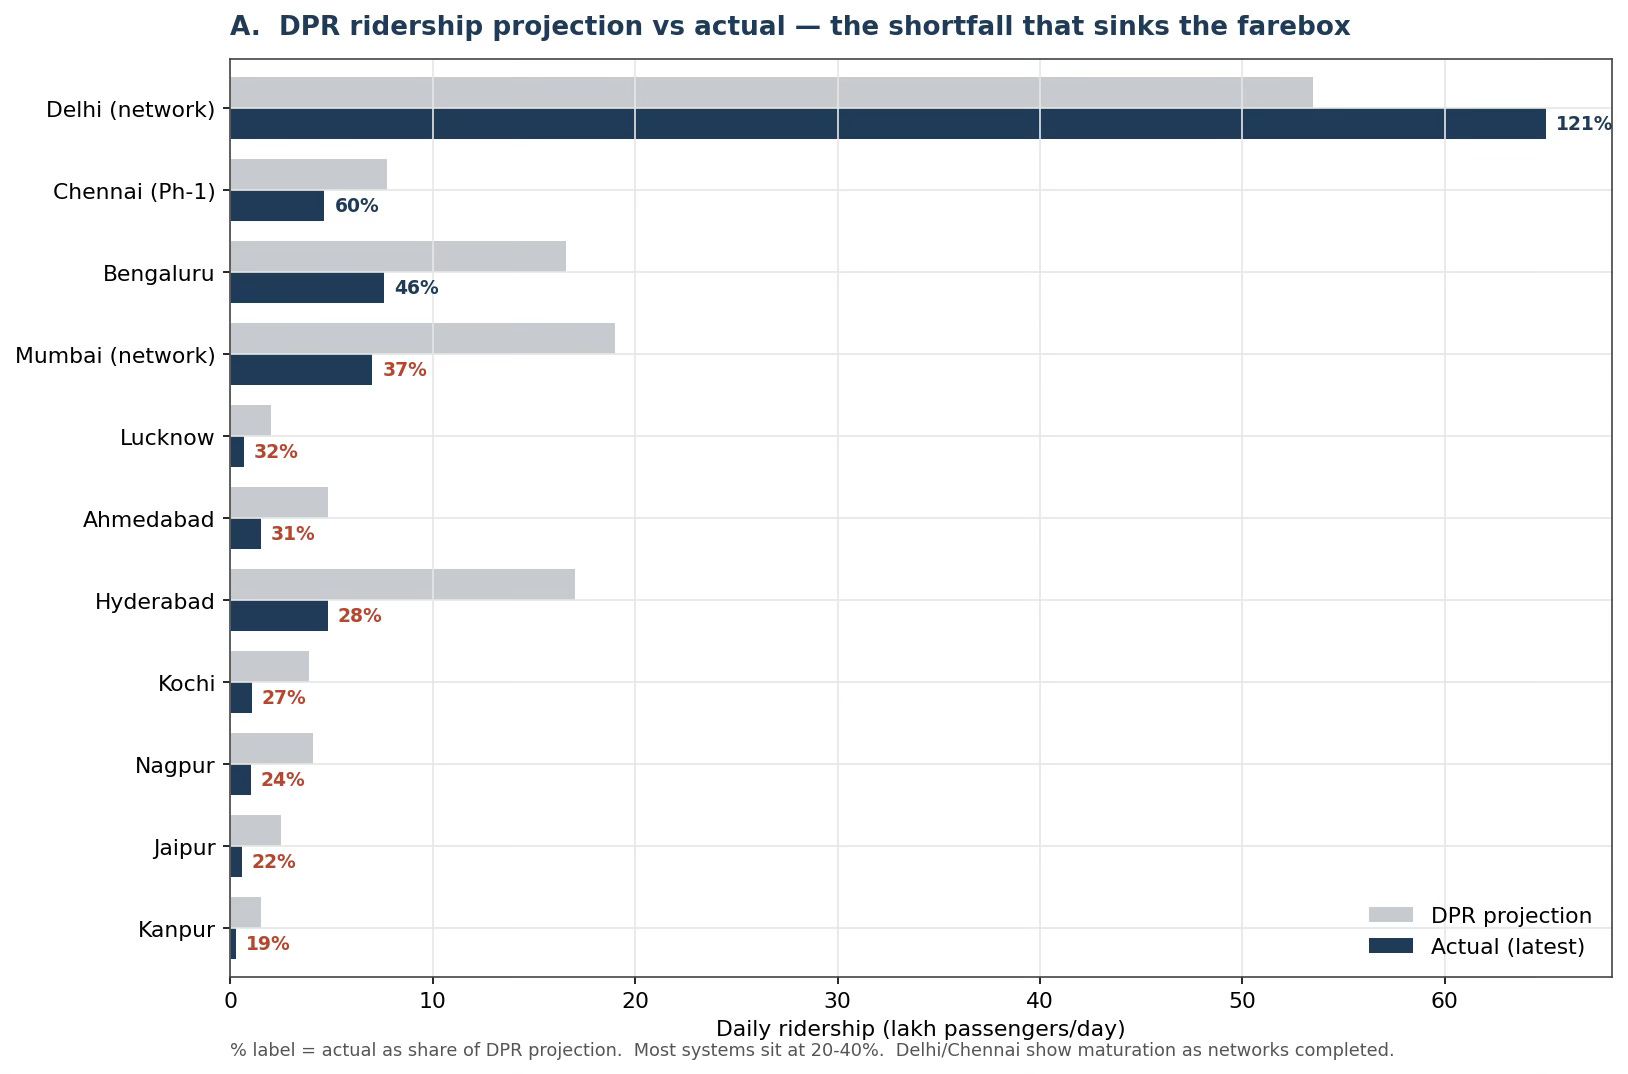
I asked Claude to generate certain parameters for the leading Indian metros. First, the difference between the DPR ridership projection and the actual realised ridership points to strategic misrepresentation with inflated estimates to secure project approval. As can be seen, apart from Delhi, the shortfall is very high, with the majority not even able to generate a third of the estimated ridership. This points to clear strategic misrepresentation to get the project sanctioned by exaggerating the ridership estimates. 

Delhi is now above its old 2019-20 target after Phase-III/IV and post-COVID recovery. This points to the fact that maturation and network completion, and not fare tweaks, are likely to move the needle.

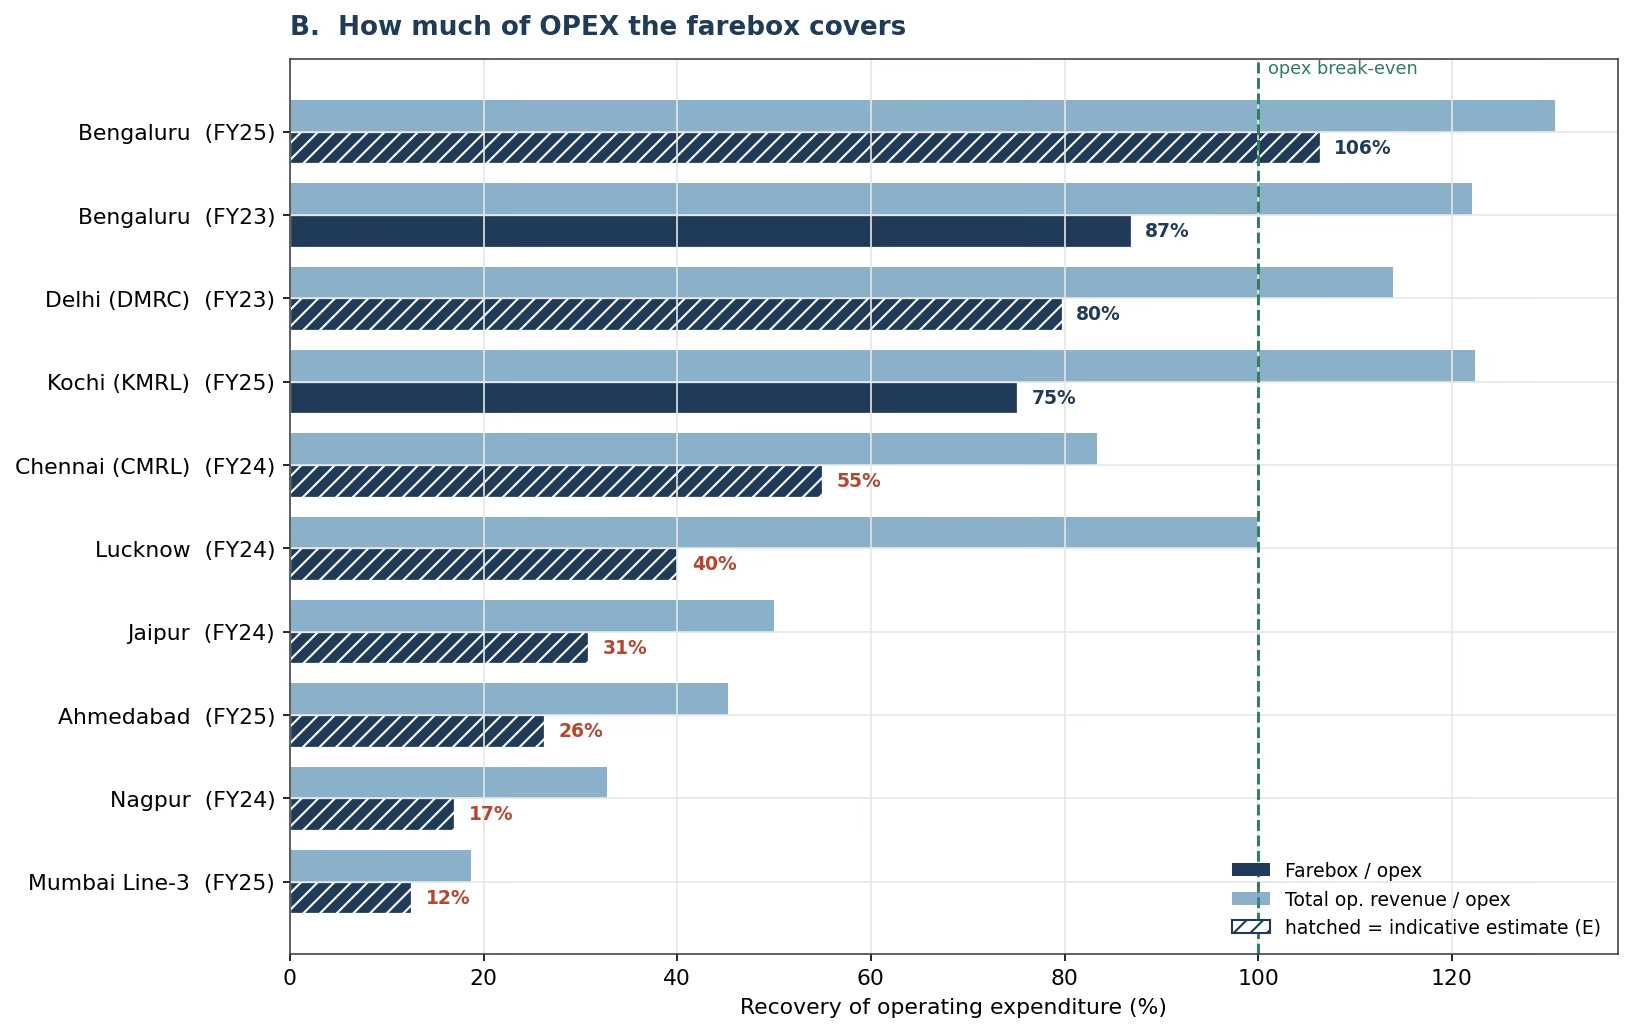
In terms of the percentage of just the opex covered by farebox revenues (or ticketing), it is very low in many metros. However, when combined with the other revenues, five metros are able to cover the opex.

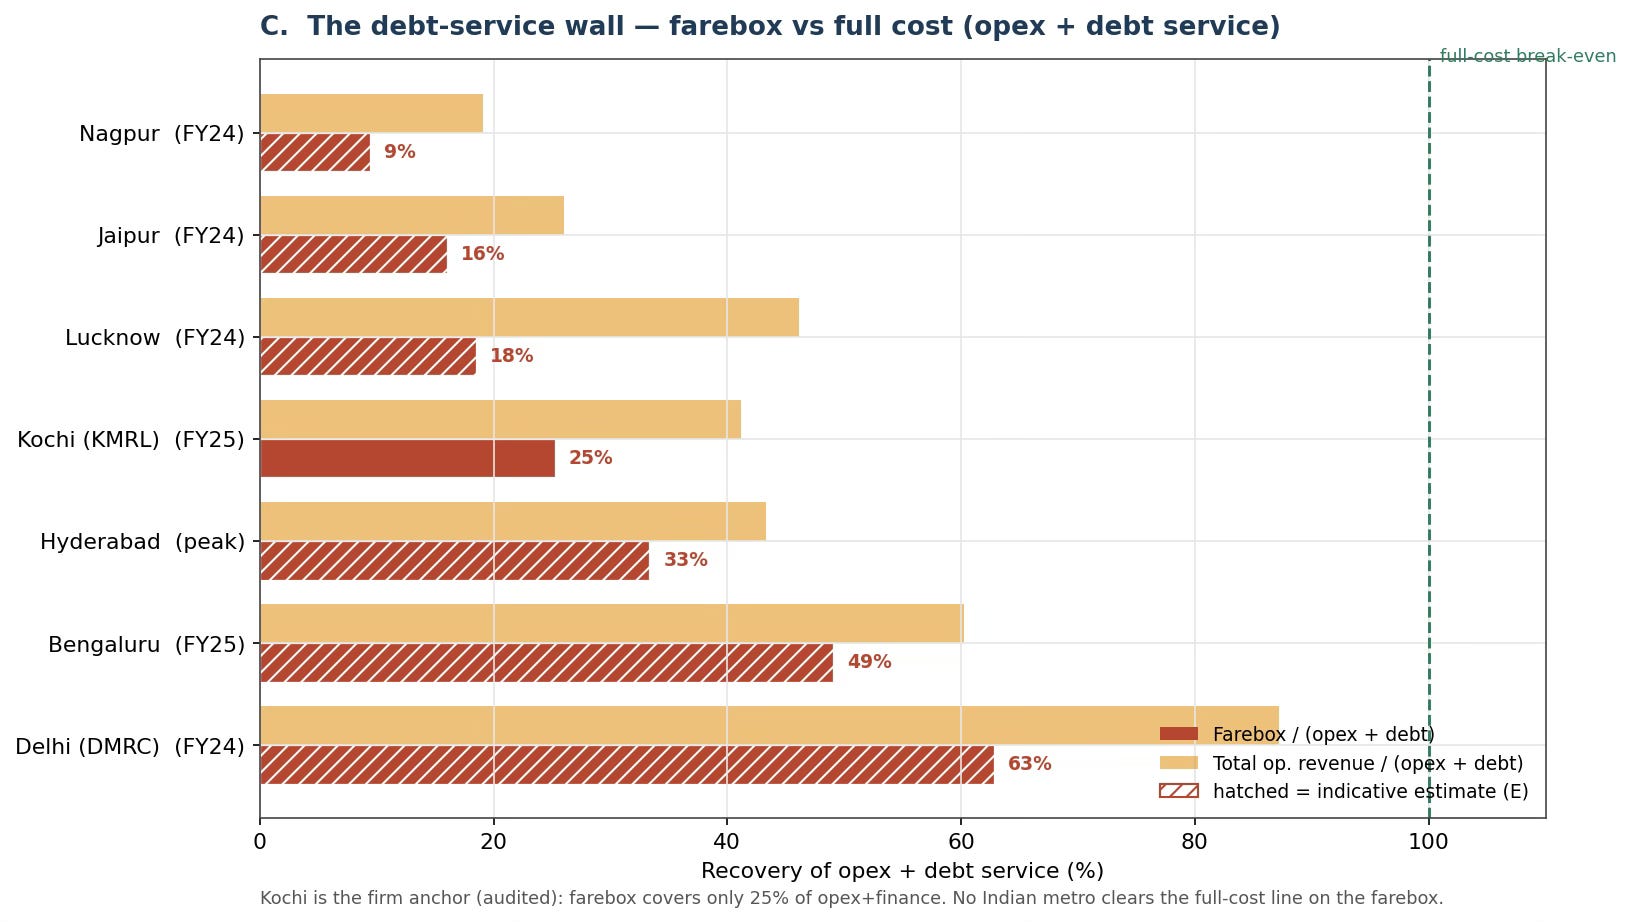
But if we include debt-service, the picture becomes extremely bleak. Most Indian metros are deeply in the red. 

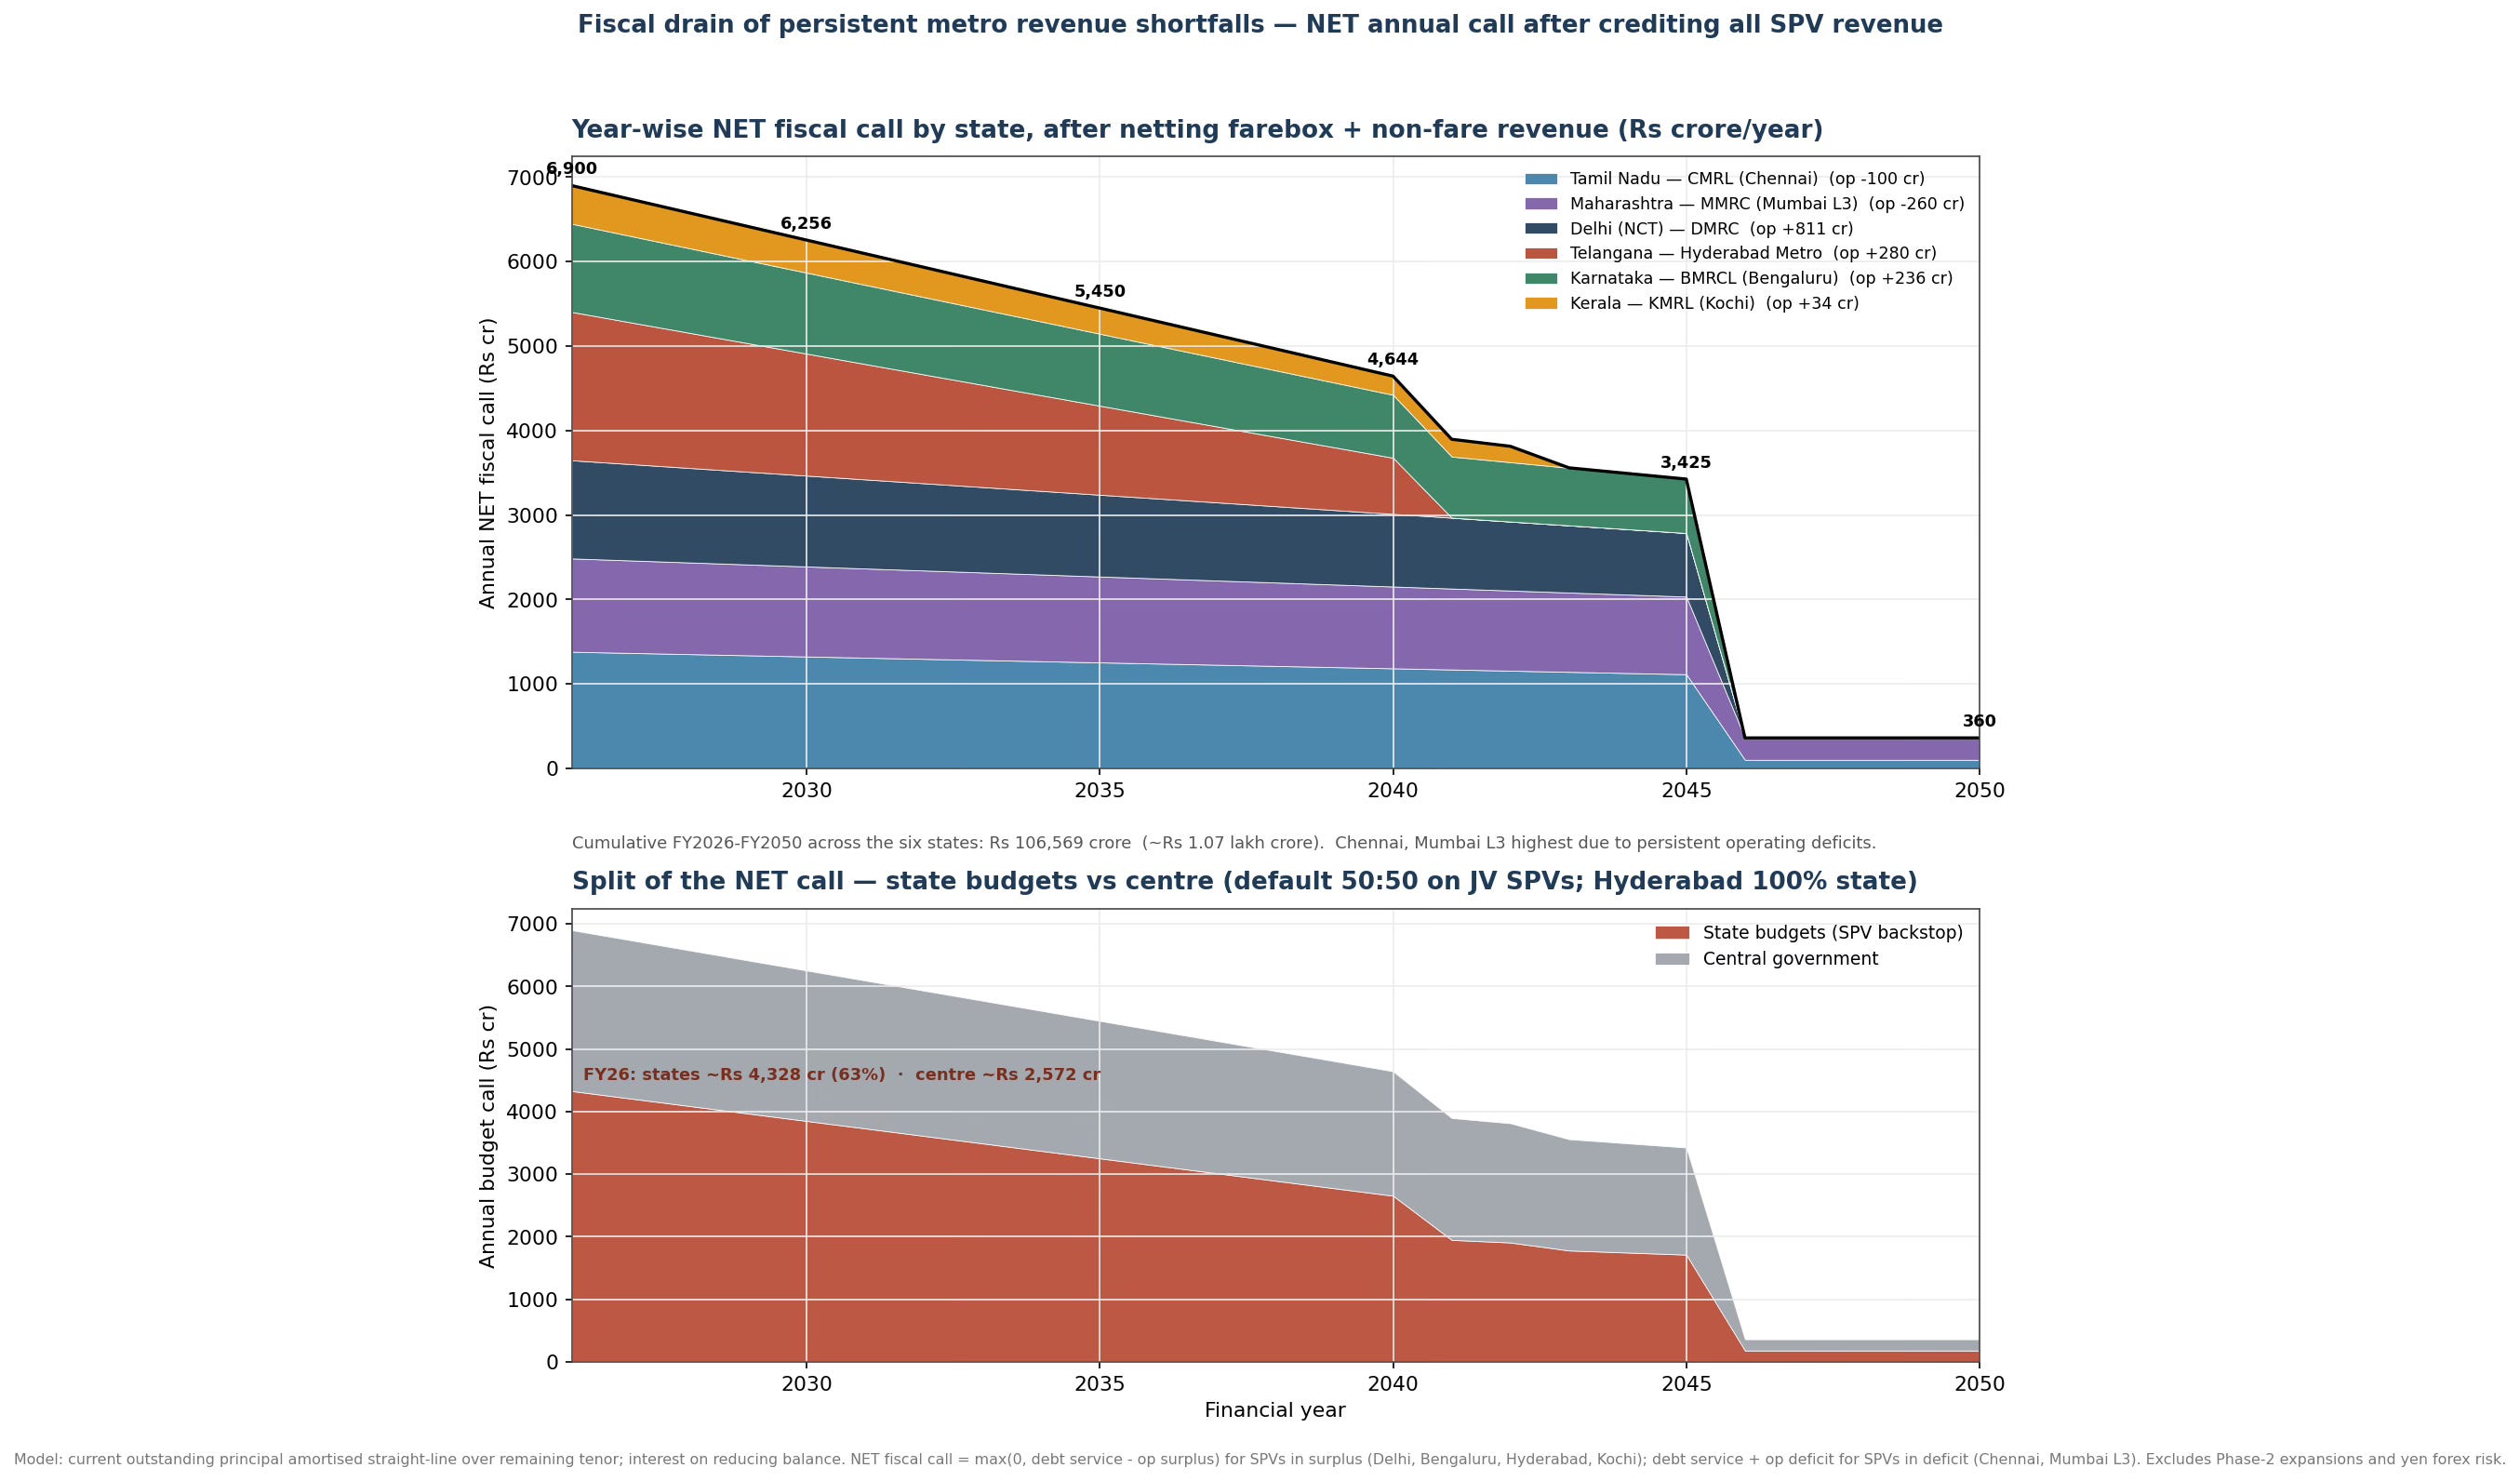
This has important fiscal implications. I took six major states, and assumed their current ridership trajectory and fare growth to calculate the gap between their total revenues (farebox and non-farebox) and total opex and debt service. This assumption overlooks that ridership trajectory may improve over time. In any case, this analysis points to an undiscounted 25-year total gap of ₹1,06,569 cr, or NPV of ₹64,423 cr when discounted at 7%. The state share is around 60% or ₹38,582 cr, and the central share is ₹25,840 cr, amounting to a total annual budget requirement of ₹6,900 cr for FY26 to ₹6,256 Cr for FY30. 

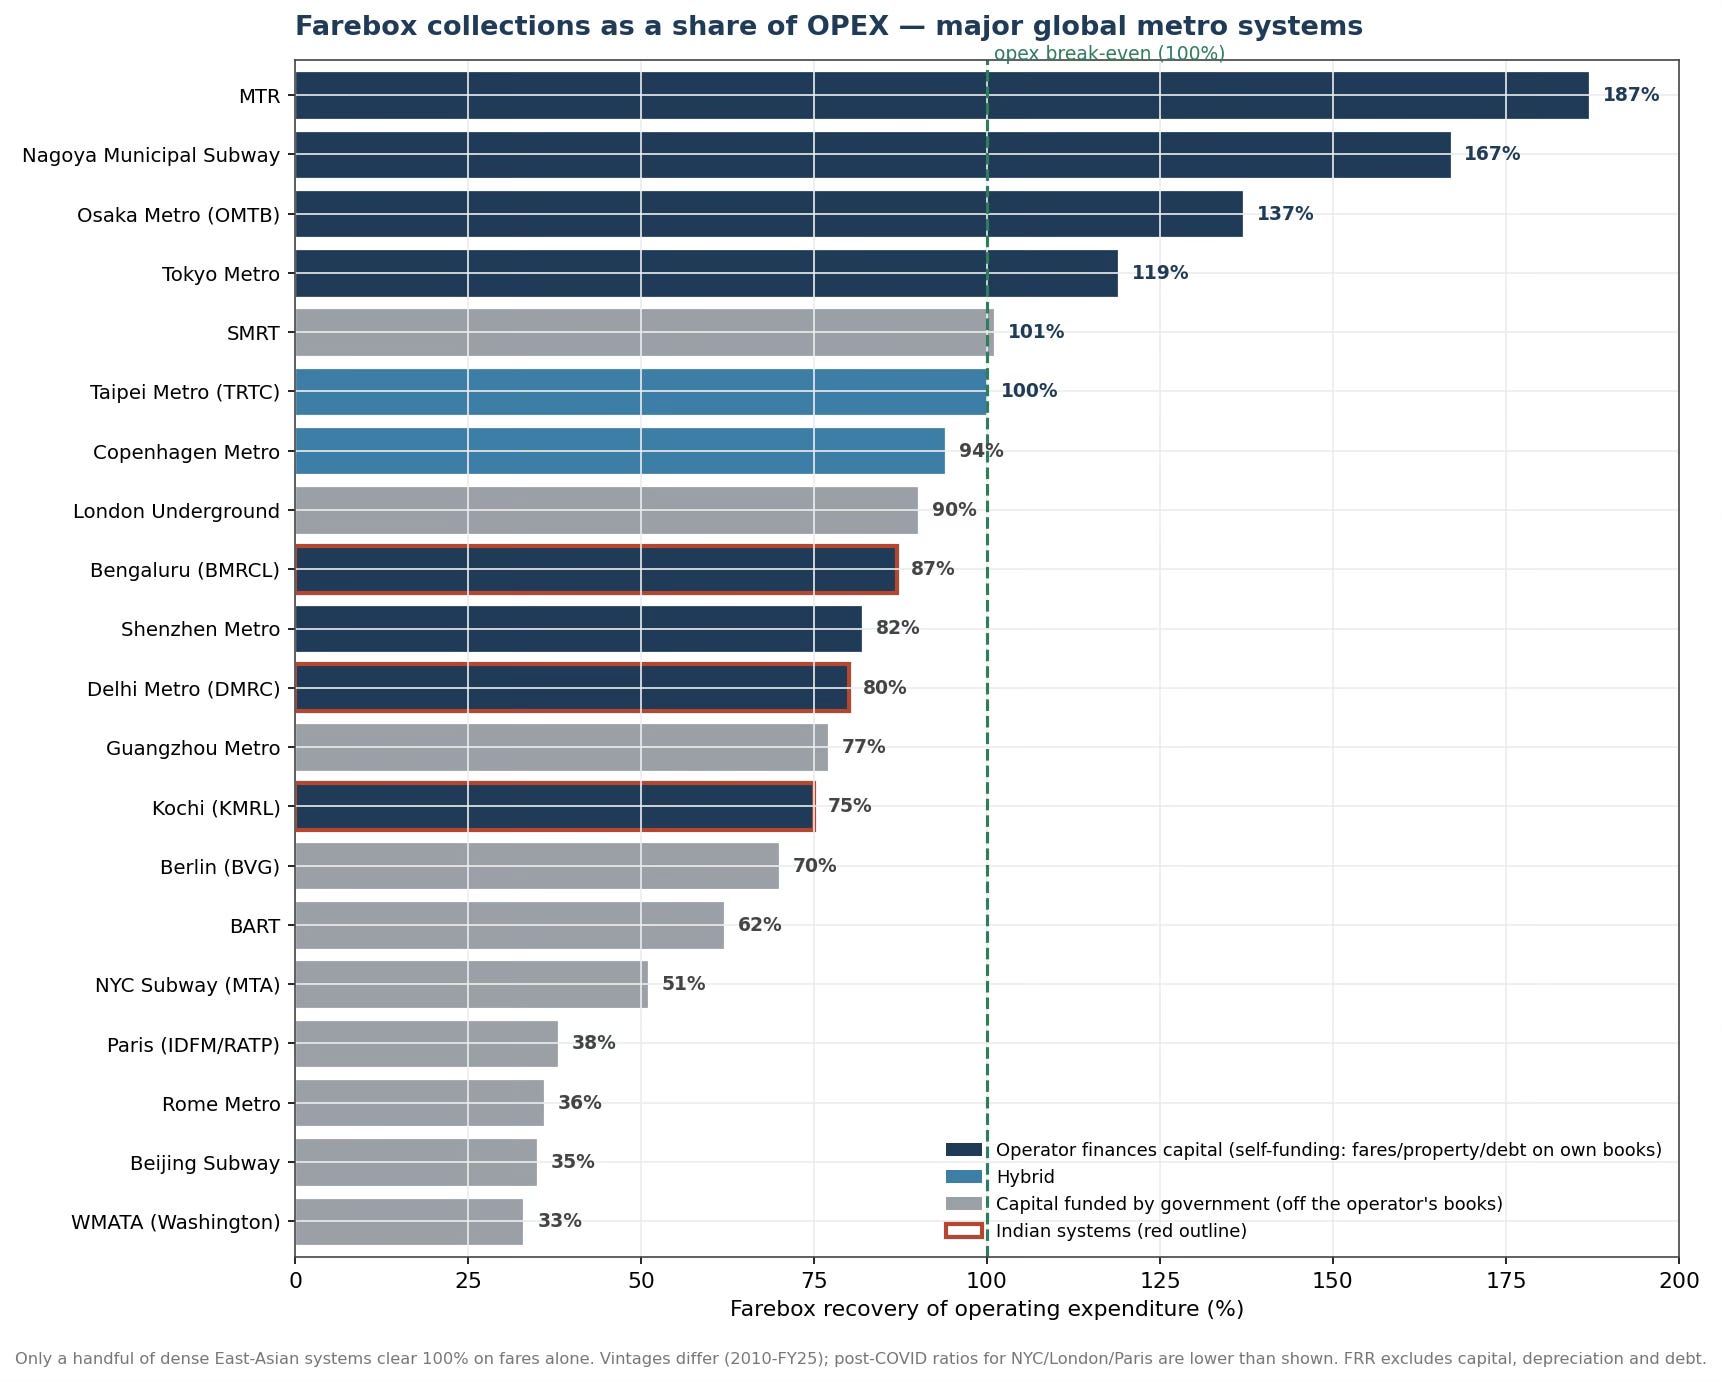
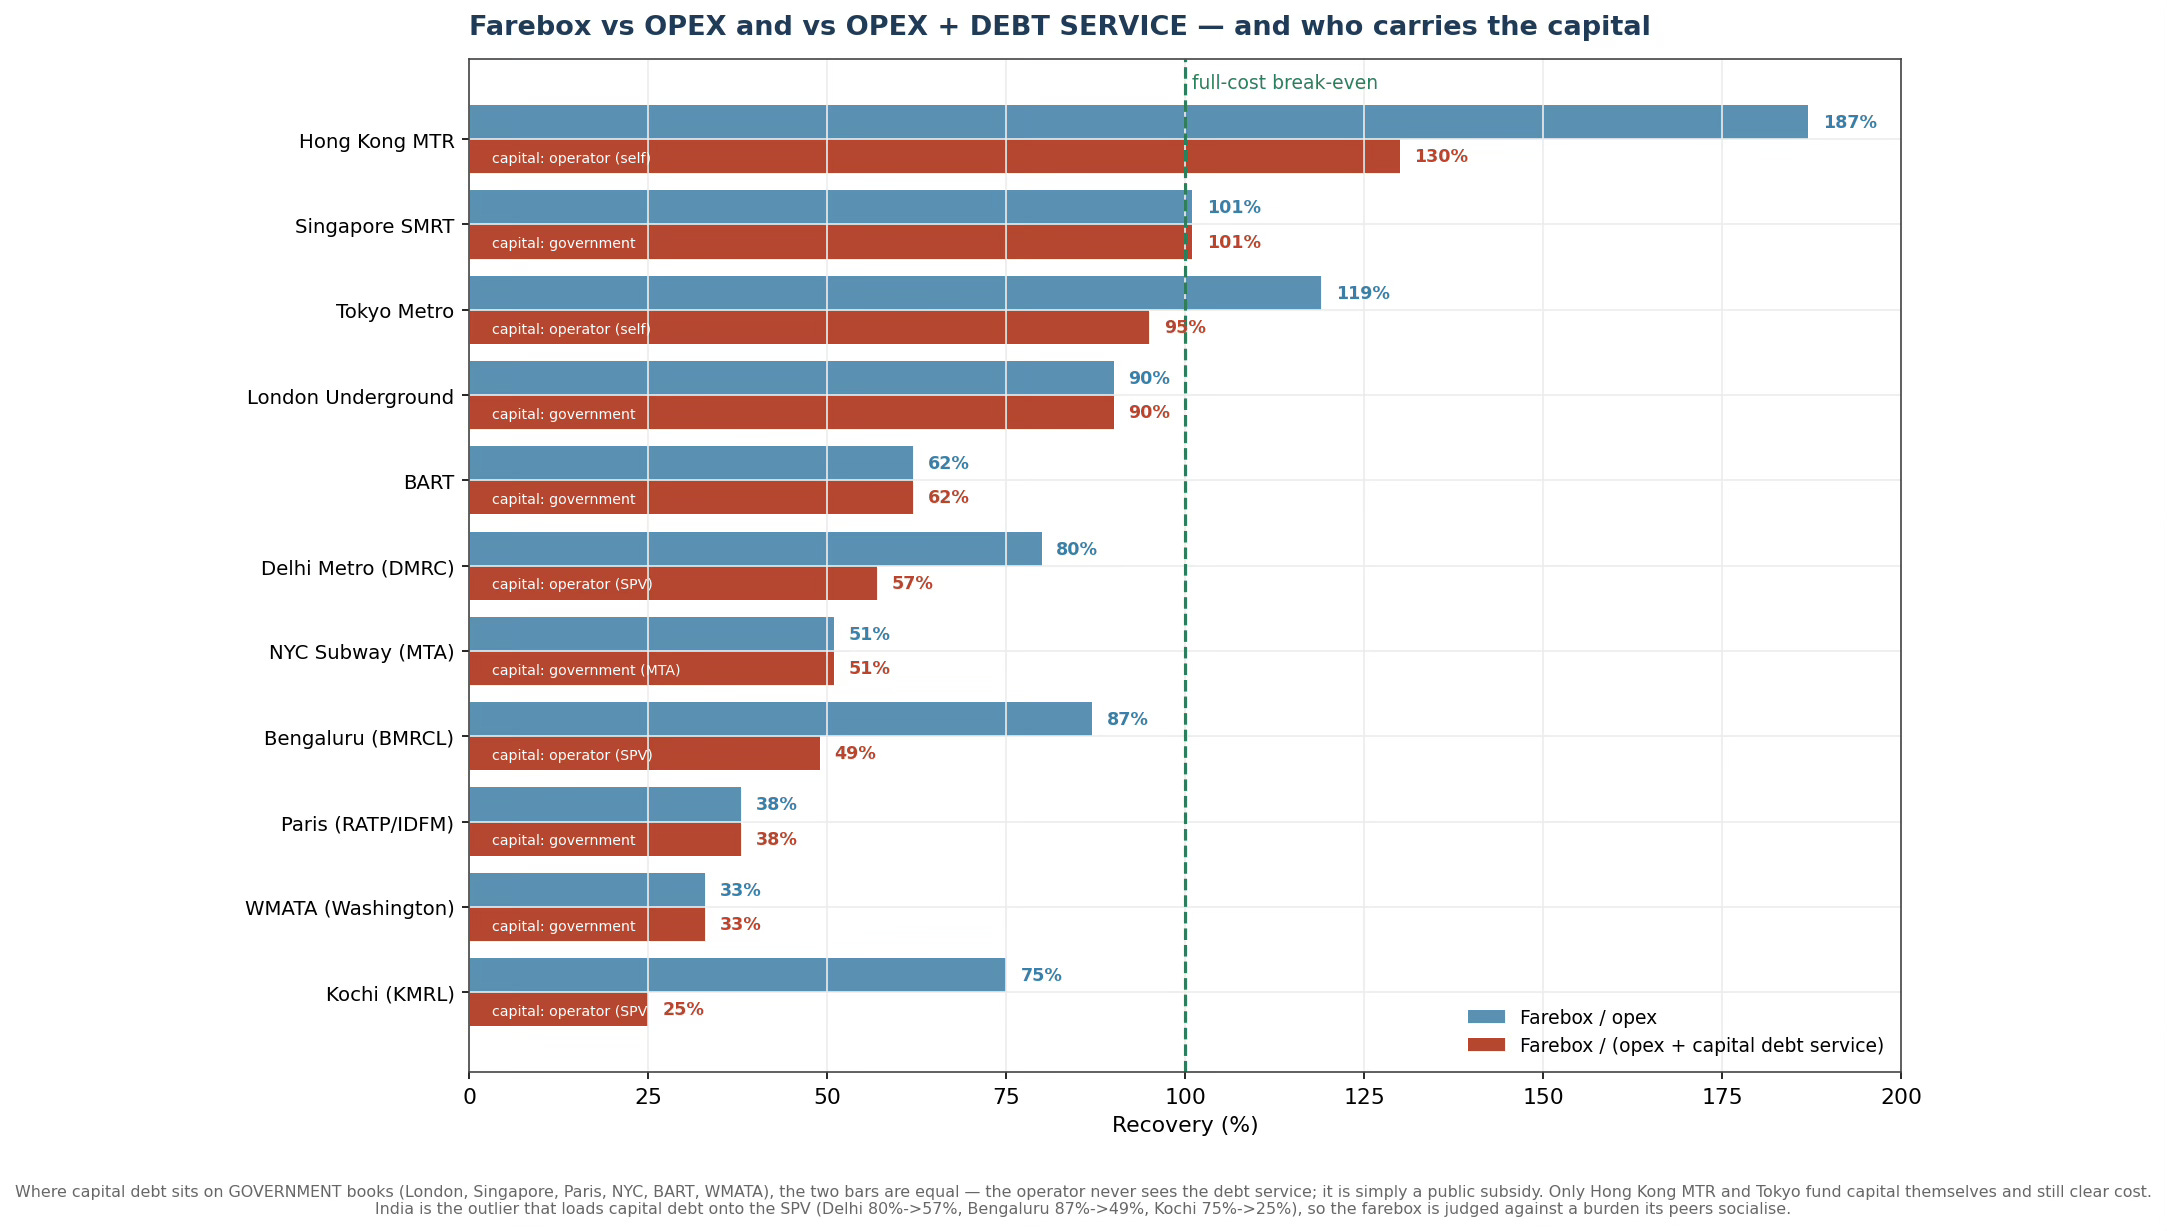
A global comparison yields interesting results. Apart from Northeast Asia, generally, metro railway systems struggle to cover even Opex through farebox collections. 

In all western cities, their governments funded the infrastructure (versement mobilité in Paris, LTA asset ownership in Singapore, TfL/Treasury grant in London, MTA authority-level bonds backed by dedicated taxes in New York). The operator, therefore, never sees the debt service, which has been socialised as a public subsidy up front. Only Hong Kong MTR and Tokyo make the operator carry capital and still clear cost, and they do it through property and ancillary income, not fares.

India is a structural outlier in loading the capital debt onto the SPV's own balance sheet. The Indian farebox is being judged against a burden every comparable peer either socialises to the budget or funds from property. The sustainable systems didn't find a magic farebox - they either kept capital off the operator (the European/American subsidy model) or monetised the land (the Hong Kong/Tokyo model). India did neither.

So what can be done?

A systemic reform requirement is to orient the design and implementation of metro railway systems away from being primarily a railway construction project to an urban planning initiative. This would entail tight integration of the planning of metro rail projects by the municipal authorities. 

The TOD influence zone (TIZ) around each station should be seen as a genuine opportunity for redevelopment and densification. The planning regulations applicable to the TIZ should make it significantly more attractive to build insidecompared to outside - 3-4 times higher FAR, remove parking minimum, TDR-driven land assembly, TDRs brought in with higher multiples, etc. Equally important, the regulations should make it attractive to redevelop the built-up areas (and not be like this). Instead of being prescriptive on land use, it should be left to market forces to determine the appropriate shares of different types of uses in each zone. It would also allow the markets to crowd in the right kinds of commercial amenities, such as groceries, retail, restaurants and cafes, and services, into the zone, depending on its broader land-use mix. 

An important reason for the failure of TOD is the lack of attention given to its public realm elements, specifically the street configuration for connectivity and walkability, and public amenities. This is a bad omission given that walkability (from/to commute and for amenities) is the primary objective of TOD zones. An area without these elements contradicts TOD. Unfortunately, in built-up areas (which form the major part of TIZ), these elements don’t emerge overnight. They require master plans that are configured to enable walkable street connectivity, higher density, and mixed-use developments. Once the master plan is in place, its implementation should be facilitated proactively through the development control regulations and building bye-laws that allow for TIZ preferences and incentives, and instruments like the Town Planning Schemes. These are 10- to 15-year agendas.

The TIZ preferences should be complemented with feeder buses, multi-modal fare integration, and e-rickshaw access so as to extend the catchment beyond the TIZ. Further, as the Chennai example shows, metro lines should complete the loop or connect the grid, and not remain as linear stubs. 

For financial sustainability, the TIZ should deploy appropriate value capture finance instruments. I blogged about it here. They would include betterment levies (brownfield areas) and impact fees (greenfield areas), station-area commercial development, air-rights leasing, and purchaseable FAR. However, care should be taken to ensure that these levies do not detract from the commercial attractiveness of building inside the TIZ. These revenues should be assigned to the SPV balance sheet. This is how HK MTR earned 65% of its 2024 profit from property, not fares. 

These urban planning and other policy requirements should be tightly incorporated into the approvals given for these projects. Every new metro DPR must include statutory master plan amendments, FAR densification for station catchments, mixed-use zoning, land assembly strategy, and the land-value-capture financing plan. They should be preconditions, not annexures. The rail alignment should be a subset of the urban plan. 

There should be no sanction without station-area FAR increases, TDR-driven consolidation, betterment-levy design, and air-rights leasing, all routed to the SPV. TDR can pre-fund land assembly before construction starts. These should become an approval veto. Further, any ongoing support from the Government of India must be made contingent on compliance in letter and spirit with these requirements to pre-empt backsliding and subversion by the states. 

The planning elements discussed above would have to go against the conventional wisdom on urban planning held close to heart by town planners across India and the vested interests of builders and others. It would therefore require strong resolve at the highest political and bureaucratic levels to overrule objections and enforce them. 

For new projects, central funding should become conditional on a corridor-density threshold, independently audited ridership models, and ex-post accountability. There should be an end to the practice of a self-certified 14% IRR. Anything below the threshold should qualify only for a MetroLite / MetroNeo / BRT.

In conclusion, the urban metro should be used as an opportunity to redraw the metro as an urban plan by densifying station catchments, capturing the value, and servicing the construction capital.

Tuesday, July 21, 2026

Lessons from Spain for urban planning

Football is not the only area where we can learn from Spain. Energy transition, infrastructure construction and urban planning are some others. This one is about urban planning. 

An essay in Works in Progress examined how traditional apartments have declined across Europe, except in Spain, and the role played by late development and public policy. It also underlines how Spain uniquely got all the basics of urban planning right - land readjustment, infrastructure development, mixed-use, densification, connected street network, walkability, mass transit, and low car usage. 

This is a good description of mixed-use density in Spanish cities that promote walkability and mass transit commutes, and limit sprawl and carbon emissions. 

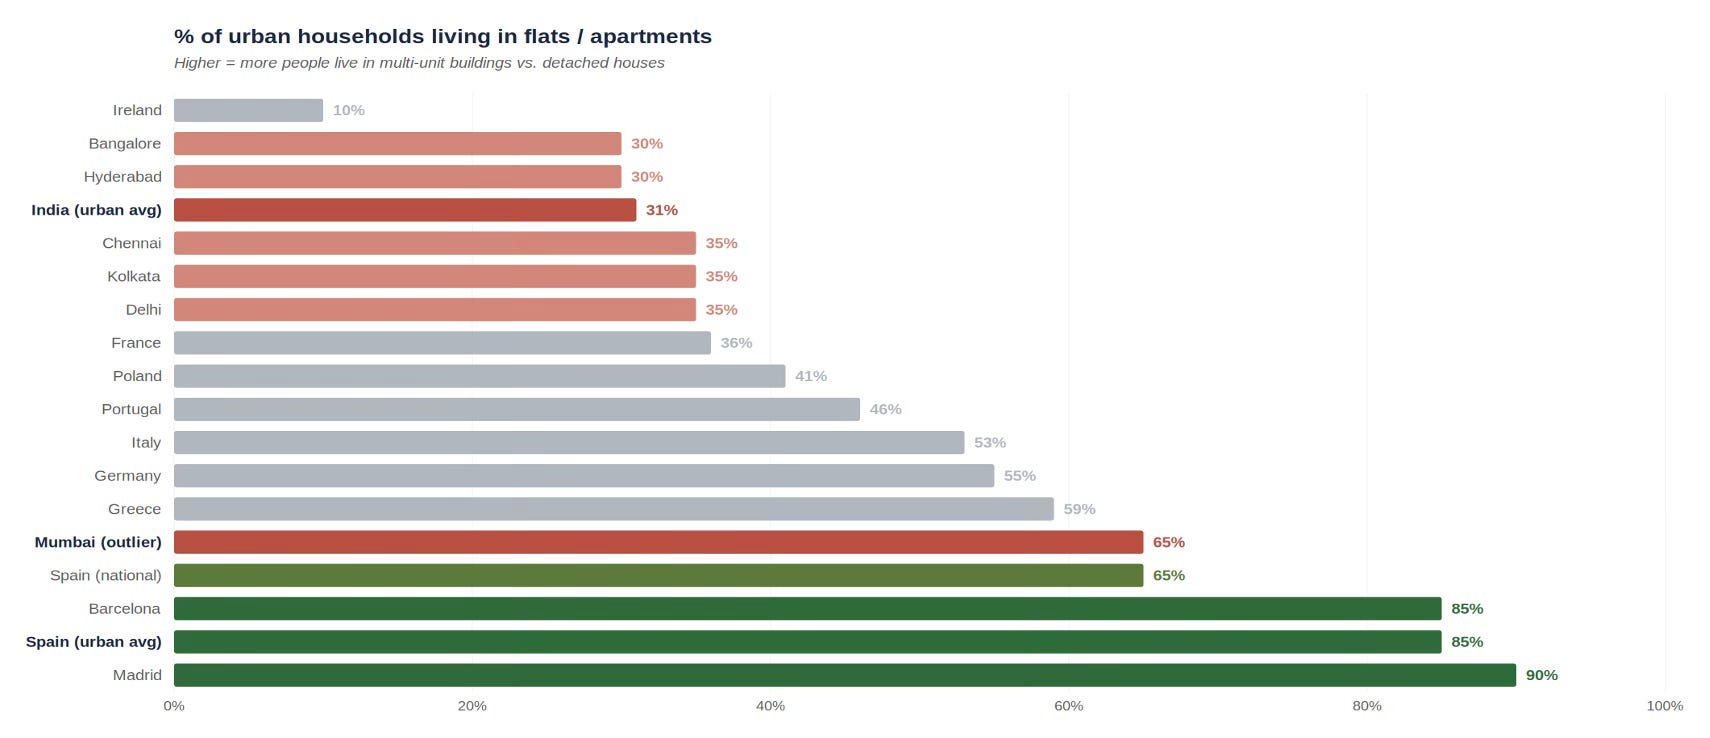
Spain’s cities are unusual. They are much denser, tighter, and more deliberate than other European cities, let alone North American ones. They reject picket fence for apartment block and choose balcony over front lawn. Two thirds of Spaniards live in flats, against 41 percent of Poles, 36 percent of the French, and just 10 percent of the Irish. Of the remaining third, most live in terraced rowhouses. In Spain’s cities, over four fifths of people live in an apartment. At the edge of Madrid or Valencia, dense mid-rise blocks stand beside open countryside without sprawl in between, something that has almost never happened in an English-speaking country, and that has been rare in France or Germany for a century… Spain’s settlements have some of Europe’s lowest per capita transport emissions, in part because about 70 percent of trips in Madrid and Barcelona are made on foot, tram, or metro. Almost every neighborhood is mixed use; almost all urban Spaniards live in the ‘fifteen-minute cities’ that seem like remote ideals in most affluent societies.

This is a good comparison with other Southern European cities, and even here, Spain stands out. 

Spain is not alone in Europe in having become wealthy only recently: most Southern European countries have a similar economic history. And Portugal, Italy, and Greece do share the distinctive features of Spanish urbanism to some extent, with relatively dense cities and relatively high shares of people living in apartments (46 percent in Portugal, 53 percent in Italy and 59 percent in Greece compared to 65 percent in Spain). In other ways, however, Spain is distinctive in Southern Europe. The cities of Portugal, Greece, and Southern or Central Italy are generally surrounded by ragged fringes of unplanned suburban development: their urban cores are dense in the same way as Spain’s, but their peripheries are a chaotic mixture. The transport situation is also dramatically different. About half of journeys in Lisbon and Athens are by car; in Rome, the figure is two thirds, with another substantial share on mopeds; in Nicosia, it is 85 percent, the highest of any European capital. In Madrid, the modal share of cars is below 30 percent. Cities tend to be dense all over Southern Europe, but they have not all achieved the transport outcomes that urbanists associate with density: in this respect, Spain is the outstanding model.

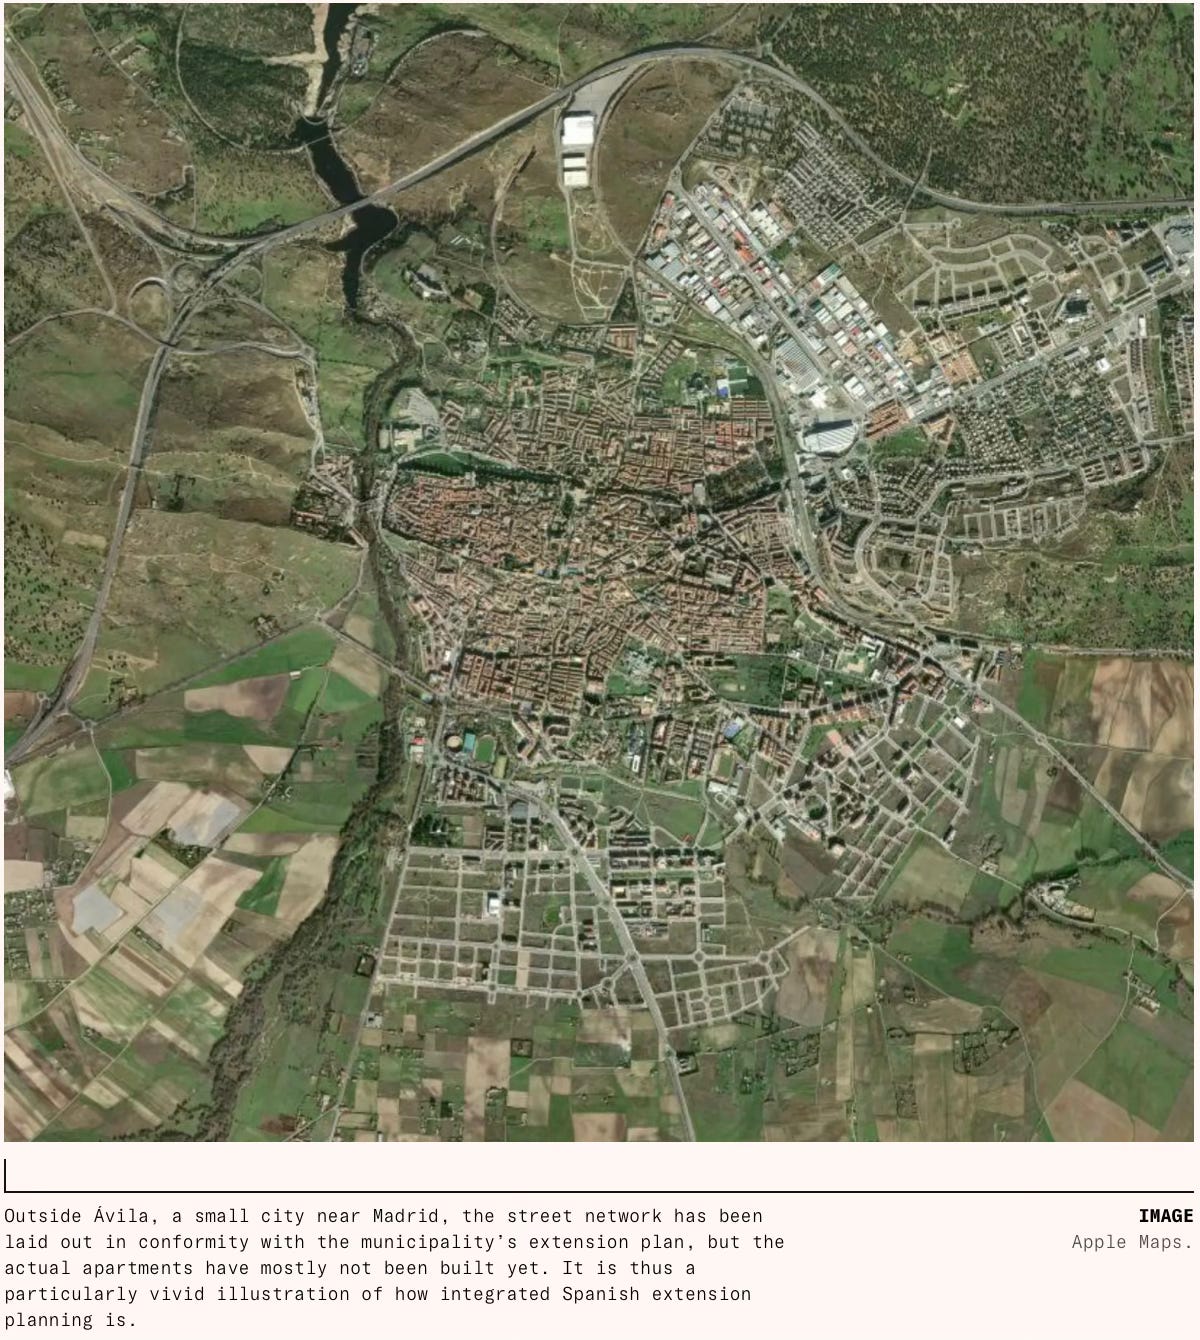
Public policy has played an important role in making this difference. In Britain and the US, the government develops the main arterial roads and allows development that follows the development control regulations, which results in fragmented urban forms (in terms of plot sizes and types of development). In Spain, the authorities undertake land re-adjustments like the Town Planning Schemes of Gujarat and thereby lay down clear boundaries and forms of development. 

This also means a high level of infrastructure development with a high density of roads, based on plans that connect streets and localities to promote pedestrians and cyclists.

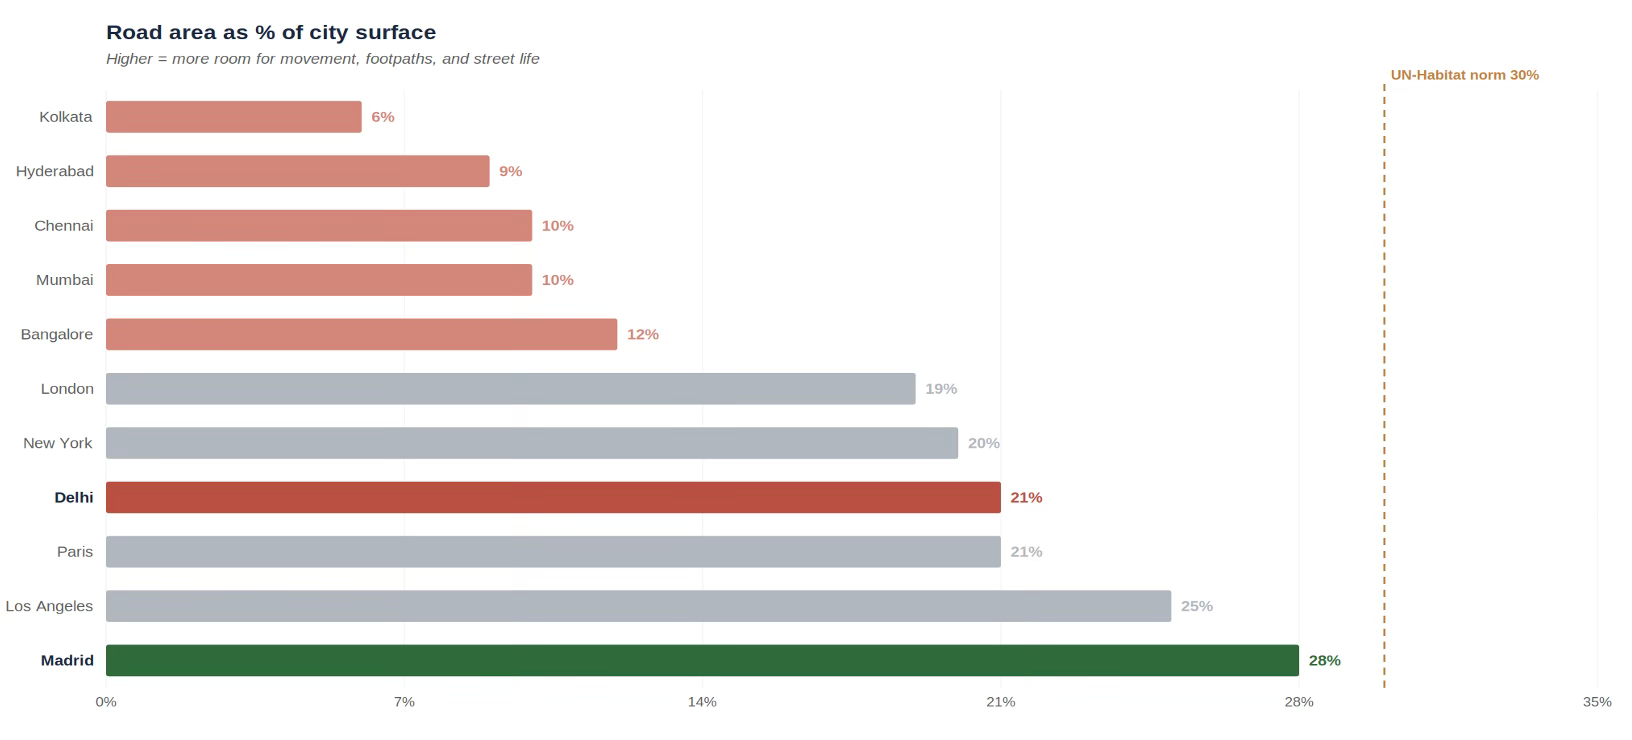
This has yielded cities with exceptionally good infrastructure. About 28 percent of Madrid’s surface area is taken up by roads, almost exactly the 30 percent recommended by UN specialists. This compares to 21 percent in Paris, 19 percent in London and 20 percent in New York. Even Los Angeles, a famously road-heavy city, uses only 25 percent for roads. As we have seen, these roads are also more skilfully interconnected, which is indispensable for pedestrians and cyclists. 

A large road network has not detracted from policy focus on public transport. 

Despite having far superior road infrastructure, Spanish cities also have high public transport use. Around 60 percent of trips in the Madrid metropolitan area and over 70 percent of trips in the Barcelona metropolitan area are made through public or active travel, similar to other major European cities and far higher than American, Canadian, or Australian cities, which typically fall below 30 percent. In other words, Spanish cities have Los Angeles-tier road infrastructure and Paris-tier public transport access. This is paired with some of the continent’s best intercity transport. Spain has significantly more motorways than any other European country: 17,228 kilometers, versus 13,183 in Germany and 11,671 in France. It has the second-longest high-speed rail network in the world, after China.

In fact, public policy played perhaps an even more important role by keeping infrastructure construction costs low and ensuring construction was done within budget and without delays. It was able to utilise something like €200 billion in cohesion funding received from the EU between the late 1980s and 2020. 

More importantly, Spain kept costs low… Spain, combined with its non-EU injections, built 4,000 kilometers of high-speed rail, 10,000 kilometers of motorway, and numerous metros, trams, ring roads, and radial arterials, because it kept costs extremely low. It did this by maintaining good practice: flexible environmental rules (although these have since become more problematic), top-tier in-house capacity in engineering and contracting, a commitment to a steady pipeline of projects over decades, and, above all, rapid decision-making, avoiding the costly delays and redesigns common elsewhere. Another part of this was giving small areas the power to decide on and fund infrastructure, like the Madrid Metro, avoiding the ping pong between authorities seen in some high-cost countries. 

Together, this has allowed it to build metros more than 20 times cheaper than in New York City. For the price of one mile of the New York’s Second Avenue Subway extension, Spanish builders covered the entire 35-mile 1995–1999 expansion of the Madrid Metro. As a result, Spanish transport infrastructure is both abundant and cheap. Madrid’s metro underwent one of the fastest growth spurts in the worldbetween 1995 and 2007, adding around 203 kilometers of new lines to its already impressive footprint​. Barcelona has been continuously expanding its metro network since the Second World War: in a period of astonishing activity between 1990 and 2010 there were 18 separate extensions, and seven more since.

Cities including Valencia, Bilbao, Seville, and Málaga all built metro or light rail systems in the 1990s and 2000s. Madrid and Barcelona have both joined their old suburban rail lines up into Cercanías/Rodalies systems, similar to London’s Crossrail scheme but far more comprehensive (though not always well run). The upshot of this is that, despite having some of the world’s best road infrastructure, Spain still has relatively low levels of car use and ownership: the modal share of driving is low not because driving is a bad option, but because other options are so good.

Since the late 2000s, changes in laws placing a series of restrictions on buildings have adversely impacted Spanish urban planning. For example, before 2007, Spanish land was buildable by default; the same was inverted to allow housing construction only if specifically zoned by the local council. Today, in an emulation of the planning practices followed in the US and Europe, building in Spain has become extremely restrictive. 

Planning a major Spanish urban extension now depends on agreement from the municipality, the community (the regional government), the landowners, and, individually, each of the environmental, water, roads, electricity, public transportation, and social housing authorities. The result is that creating new city plans now takes an enormously long time. Creating the plan takes between six to eight years, while designing the streets and plots takes another three to seven… This is leading to high prices. Madrid asking prices are now nearly €6,000 per square meter, and Barcelona over €5,000, above Hamburg, Berlin, Frankfurt, Brussels, Milan, and Rome… But Spanish wages are low… This has left leading Spanish cities with some of the worst house price to income ratios in Europe.

Spain offers important lessons for cities in developing countries like India. Spain’s late development means that its experience has even greater relevance for us. 

Spain's cities are unusual not on any single dimension but on the combination - density, mixed use, mid-rise (not high-rise) apartments, walkability, cheap and abundant transit, high car ownership but low car use, infrastructure preceding development, and municipally planned street grids. Spain is unique in getting all the dimensions right. 

Indian cities, from metros to the lower-tier ones, are characterised by a far lower share of multi-tenement units, rigid land-use restrictions, high setbacks, poorly maintained or absent footpaths, infrastructure coming well after habitations emerge, and sorely deficient mass transit facilities (especially bus networks). 

In India, exclusive land-use zoning is the norm, with mixed-use permitted only beyond generally 15-18 m roads and above, which are present in a very small proportion of the localities. In the older areas, commercial facilities in residential areas have emerged informally over time, whereas in the planned colonies and new developments, mixed use is restricted. 

Indian cities have among the lowest share of urban households living in multi-tenement units, with Spanish cities being at the other extreme. Only 31% of urban Indian households live in flats (NSS 2018) compared to about 80% in Spanish cities, with Mumbai being the exception. The India NSS “flat” includes chawls, single-storey shared tenements, and informal walk-ups - so Indian numbers overstate what a Spaniard would recognise as a flat.

Similarly, Indian cities have among the lowest share of road network, not even a third of the UN Habitat norm. Most Indian metros are 6–12%, with only Delhi, the only Indian city with municipally planned extension, getting close.

I can think of at least a few big takeaways. Foremost, there’s no alternative to mixed-use, densified development for both greenfield and brownfield areas. 

Given its high share of detached housing, Indian cities have a great opportunity to reinvent themselves. This can be done by increasing FAR, and more importantly, doing it in a manner that allows upzoning adjacent to 9 m and 12 m roads. As I blogged here, the current upzoning deregulation, confined to plots with road width greater than 18 m, is largely superfluous. 

This must be coupled with planning norms like allowing for relaxations of setbacks, even dispensing with them and encouraging row housing, multi-tenement units, and mixed-use in terms of encouraging commercial amenities. The latter is about ensuring that people living in a locality should be able to buy their regular groceries and other household items and services from within there. Further, the local government fee and property tax regimes must consider lowering the layout development charges, building permission fees, and property taxes to encourage the realisation of these objectives. 

These policies and instruments must be deployed with a long-term perspective (as against expectations of immediate results). The objective should be that they would shape incentives and enable the gradual redevelopment of brownfield areas as densified communities. 

Second, we must use urban planning to lay down street network configurations that enable connectivity and walkability. Master plans and their development plans should keep this in mind. Minimising or even eliminating setbacks would be one step to enable such street networks. The prioritisation of walkability requires the infrastructure of footpaths and street connectivity to be able to walk, and the supply in terms of mixed-use amenities to create the demand. And all this must be combined with local campaigns to promote the culture of keeping footpaths free of encroachments. 

Third, the current dominant trend across Indian cities of the emergence of gated communities in the suburbs must be examined. These communities, while attractive for their residents and developers, go against all principles of sustainable urban development. These are largely monocultures of upper-middle and higher-income housing (the maids and drivers, and others, commute from distant places), with exclusive residential zoning, limited or no mass transit connectivity, exclusively car-based, and very poor external street connectivity (large gated enclaves with one or two entry/exit points). They impose massive negative externalities on the city and locality, while appropriating all the benefits. 

Fourth, mass transit must be at the core of all developments. All greenfield areas, in particular, must be planned around mass transit, in the form of transit-oriented development (TOD). This post discusses some principles for TOD in Indian cities, and this post outlines some of the challenges. This would require going beyond the current norm of merely giving higher FAR and offering significant incentives on fees and taxes to make it more attractive for developers to build inside the TOD zones. 

Like in Spain, the challenge is to get the combination more or less right. The good thing is that all of them lie with the states and mostly with the cities themselves. It is only required for 2-3 cities to take the lead and strike out on their own in following these principles and reinventing themselves. They can be the lighthouses that guide urban development in India.