Substack

Showing posts with label Indian Economy. Show all posts

Saturday, October 31, 2026

Weekend reading links

The state boasts an extensive network of 11 national highways and 83 state highways. Yet, on the ground, these vital arteries remain choked, narrow two-lane bottlenecks. Traversing the 650-km expanse of National Highway 66 takes an agonizing 14 to 16 hours—double the time required to cover a similar distance between Delhi and Prayagraj in Uttar Pradesh. While the rest of the country races ahead with multi-lane, access-controlled expressways, Keralam is only now pushing through its first six-lane upgrade along National Highway 66—a delayed ₹66,000-crore project that experts note is arriving very late... To test the state of Keralam’s road connectivity and infrastructure—critical for the growth and investment it seeks—I decide to drive from Vizhinjam, near the southern tip, to the state’s border with Karnataka in the north. The distance of 769 km will take 21 gruelling hours. The average speed across the entire journey? A sluggish 33 km per hour.

2. Kerala takes to an ageing society with innovative policy responses like day care cenres and timebanks to address problems of loneliness among the elderly.  

Started in 2021, the Kunduparambu Pakalveedu was the first daycare centre for senior citizens set up by the Kozhikode Corporation. In 2025, it won the best ‘Pakalveedu’ award among the 150 that are operational in Keralam today... Fun trips are arranged periodically... The seven fully funded Pakalveedu facilities the Kozhikode Corporation runs are just one part of its efforts in elderly care. The corporation spends 10% of its ₹132 crore annual outlay on the welfare of senior citizens, who account for 17% of the city’s population... According to a study jointly conducted by the Population Foundation of India (PFI) and International Institute of Migration and Development (IIMD) in 2025, 18.6% of Keralam’s population is today aged 60 years and above as against the India average of 10.8%... By 2051, almost one in three people in Keralam will be a senior citizen. The PFI-IIMD study puts the number at 30.6%. In comparison, the India average will be 20.4%.
The state has steadily strengthened its social safety net for the elderly. The previous Left Democratic Front government pioneered an ‘elderly budget’ to track interdepartmental spending and established a quasi-judicial elderly commission to safeguard senior rights. Backing these policies with substantial resources, the state ramped up its commitment in the 2026–27 budget, allocating 19% of its total outlay exclusively to senior citizens. The new United Democratic Front (UDF) government led by Satheesan is formulating policies to take these efforts forward. It has set up a separate department for elderly welfare... The new Keralam government has adopted an ‘aging in place’ model that allows elderly citizens to live in their neighborhood and social environment rather than shift to an institutional facility or an oldage home. It is the Japanese model and Keralam is studying it closely...
Keralam is just 1.5 children per woman, as against the replacement level (the average number of children per woman needed for a population to replace itself from one generation to the next) of 2.1 children. Life expectancy is also higher at 75.1 years compared to the India average of around 72 years. What complicates the process for Keralam is its high level of migration, especially among the younger population. As per the 2023 Kerala Migration Survey, 2.2 million people have migrated to other countries and another 0.5 million have done so to other parts of India. This means senior citizens are left behind.

3. Good long read on the Rs 2 trillion (initially estimated at Rs 1.08 trillion in 2017) Mumbai-Ahmedabad high speed rail. 

4. Make in India update.

Under the Electronics Components Manufacturing Scheme, or ECMS, ₹69,000 crore of investment has come in, exceeding the scheme’s original investment target by ₹10,000 crore. The government has approved 106 projects, to make speakers, microphones, camera modules, displays, relays, coils, rare earth magnets and so on... Domestic manufacturing now meets India’s requirement for some products, such as plastic enclosures, anode materials, optical transceivers and relays. Local factories meet 60% of lithium-ion-cell demand, 80% of laminate demand and 75% of connector demand. Some components, including networking equipment, relays, LED lighting parts and automotive electronics are beginning to be exported to China, Vietnam, Singapore, Italy, The Netherlands and other countries... But for all the gleaming new production lines, local value addition in India remains modest, at 15–18%, versus 40% in China. Critical chips continue to be imported. Printed circuit boards, sensors, and specialized materials are only beginning to be produced locally at scale. Precision components that go into earbuds, hearables, wearables, smartphones et al. depend on imports... Plastics, heat sinks, shielding covers, battery packs, chargers and cables are already increasingly local. The next round includes PCBs, display modules, camera modules, passive electronic components and semiconductor packaging.
5. It is hard to displace America as the pre-eminent economic power. Sample this, even amidst all the dysfunction.
One Trumpian key performance indicator is what you might call the national cash flow statement. Gross payments entering America of all kinds hit a huge 30 per cent of GDP in the second quarter. Reflecting the aim of monetisation, not autarky, America is more globalised than at almost any point in history other than the prelude to the 2007-09 crisis. Energy exports have exploded. Weapons sales overseas are rising at a double-digit rate. Tech and financial firms are printing money abroad. Capital inflows, mainly from portfolios, loans and firms, are staggering, although exceeded as a share of GDP by the pre-2007 mania. While America is now spending almost as much on AI chips and tech hardware imports as on defence, the current account deficit has eased to 3 per cent of GDP. The payments of all kinds leaving the US must balance those entering, but investment outflows are often orchestrated by Wall Street, boosting the US’s role as the world epicentre of capital allocation.

6. The always excellent Simon Kuper is spot on about French politics.

The French tend to talk radical but act conservative. This is a country where 57 per cent are homeowners, and many people spend their lives looking forward to retirement. They rely on the state. They want it to function. Revolutionary language is in part just a bow to French heritage. Even many of the voters who backed radicals in past elections quietly wanted an overeducated technocrat to win. Then they could spend five years protesting against him. The 1968 “revolution” culminated in the election of centre-rightist Georges Pompidou, product of the École Normale Supérieure. But last Saturday was a dramatisation of a new French political alignment, in which technocrats, with Emmanuel Macron as their final incarnation, risk being chased from the stage...

Macron has governed as a high-handed leader — “Jupiterian”, in his own description — who rarely consults. “Macron’s Achilles heel is that he’s not good at dealing with negotiation,” Philippe Aghion, the French economist who won last year’s economics Nobel, told me. “They don’t know how to deal with social movements. Or they don’t have the patience.” This is a Macronian flaw, but it’s also baked into France’s “vertical” political system, says the philosopher Gaspard Koenig. He pulls out his copy of Tocqueville’s Recollections, about the 1848 revolution, and reads: “But there is one institution that cannot be destroyed: centralisation.” Koenig says that demonstrators typically aspire only to replace France’s mighty leader with a different mighty leader.

And this is a problem for governments across the world, as electorates are unwilling to accommodate.

France’s deficits are becoming a slow-burn crisis. Public debt of 120 per cent of GDP would be manageable if parliament could agree to start cutting the deficit. Jean Tirole of the Toulouse School of Economics, the economics Nobel laureate for 2014, says: “I think what financial markets are worried about is the fact that nothing is happening.” He contrasts France with Greece during its 2010s’ debt crisis: “The Greeks at some point realised that things were very bad. I’m afraid we are not at this stage.” Popular support for balanced budgets appears weak. Government spending is 57.3 per cent of GDP, joint highest in the western world with Finland, and Tirole notes that even with deficits of 5 per cent, many accuse Macron of “austerity”.

7. The shortening of US debt tenors.

US Treasury secretary Scott Bessent appears to be reducing the average weighted maturities of Treasuries. These currently stand under six years (compared to 13 years in the UK, or around eight years in Germany, France and Japan)... One reason, Treasury officials tell me, is that — unlike with credit cards — short-term rates are currently lower than long-term ones. Another is that recent structural shifts in finance are boosting demand for short-term debt. The fast-expanding stablecoin sector, for example, is gobbling up short-term dollar debt — and now holds more Treasuries than Saudi Arabia and Germany combined. The maturity of debt bought and held by the Federal Reserve is also declining. And foreign investors are tilting short-term too, either because they are wary of making long-term bets on the US or because of foreign hedge fund trading strategies. Indeed, Fed research shows that hedge funds doubled their US debt holdings between 2023 and 2025, and now control about 8.5 per cent of the market — more than the official holdings of Japanese, Chinese and Saudi Arabian investors combined.

8. China's battery competitiveness in numbers. 

China's battery manufacturers -- CATL, BYD, Gotion, CALB and Sungrow -- are able to build a gigafactory — the industry term for the plants making cells used in EVs, AI data storage centres and power grid backup systems — in China for about a third of the cost and three times faster than building the same type of facility in Europe.

9. Indian states are paying exorbitant subsidies to attract data centres.

And the investment is all coming from foreign firms. 

10. Rama Bijapurkar points to an important aspect of the battle at Tata Sons and raises pertinent questions.
That a CEO with no shareholding backing, along with board members who do not represent chunks of shareholding, can challenge a promoter with a 66 per cent holding and pressure it to dilute its stake, and not have sway over decisions is a first-time challenge to power structures — which have stood the test of time, tradition, convention, and culture, rightly or wrongly. It brings a fresh round of calibration, especially by promoters, of their terms of endearment and engagement with professional CEOs, not to mention boards. More so, if their shareholding is well below 51 per cent... Given the promoter-friendly, promoter-respectful and promoter-on-top ethos of corporate governance that has existed and continues to exist in India, this departure from the norm against none other than the venerated, iconic Tata promoter group with its track record of trusteeship and larger good over personal gain has rocked the comfort boat all around.
The ripples it will cause are yet to become clear — will promoters be nervous seeing such a coup by the professional hire? How will they respond? Will they pick boards like in the old days, based on loyalty and narrow subject-matter expertise? Especially as the law of the land and the market regulator push more power and accountability in the hands of independent directors? Will boards be now placed under more pressure from external directives on which way to vote, getting trapped between the rock and the hard place of the promoter and the proverbial hand of God? Will CEOs have less freedom to operate and more fetters? And does this add to the bad rap that India has been getting of late as a safe, stable place to invest in for the long term? Probably yes to all.

11. Akash Prakash provides some home truths on India's equity markets.

Since the Indian market’s peak in September 2024, we have seen $65 billion in net outflows by foreign portfolio investors (FPIs). Over the last decade, India has received zero net-foreign flows. The stock of Indian equities owned by foreigners has fallen from $930 billion to about $675 billion, and foreign ownership as a percentage of the market is now at a 15-year low. India is now a consensus underweight for all global investors and our weighting itself has shrunk from 21 per cent in September 2024 to about 10 per cent today (MSCI Emerging Market index). One company, TSMC, has a benchmark weight 50 per cent higher than that of all of India! The three EM heavyweights — TSMC, Samsung Electronics, and SK Hynix — together account for 30 per cent of the index, but have almost three times India’s weighting...
Since the peak in September 2024, Indian equities are down about 25 per cent in dollar terms, even as the EM indices are up about 50 per cent. We have, therefore, underperformed by 7,500 basis points (75 percentage points) in the last two years alone. I have never in my career seen this quantum of underperformance in this short a period. It has destroyed careers and blown up funds. There are numerous funds that have destroyed 10-year track records in the last 24 months by simply being overweight India... for the first time I am now being asked about the need for an India-dedicated allocation. Many allocators no longer think India is important enough to warrant dedicated exposure.

12. India's battery energy storage systems (BESS) capacity is surging. 

On 3 September this year, the CEA proposed mandating two-hour battery energy storage systems (BESS), with capacity equivalent to at least 10% of installed capacity, for all new solar and onshore wind projects commissioned after 1 July 2027. These systems can store solar and wind energy when it is generated for use later. India currently has only 8.6 gigawatt hour (GWh) of BESS capacity. Another 42.53 GWh is under construction, 38.42 GWh has been awarded, and 65.57 GWh is in the tendering process. That amounts to 155.12 GWh of existing and planned BESS capacity, while the CEA projects a requirement of 236 GWh by 2032.
The boom in solar generation is now creating problems like excess supply and the need for curtailment during day times. 
According to Ember, a Norway-based think tank focused on energy transition, transmission constraints led to the loss of 300 GWh of clean electricity in India in the first quarter of 2026 (January–March), particularly at grid pooling stations in the northern and western regions. On 30 March alone, India lost 34 GWh of clean generation, equivalent to the daily electricity use of about 5 million urban middle-class households, Ember said in a report in May. The analysis also found that total renewable energy curtailment in Q1 2026 reached around 470 GWh, of which 300 GWh stemmed directly from transmission constraints. The northern region accounted for 178 GWh and the western region for 122 GWh. The southern region recorded none, reflecting better synchronisation between generation and grid expansion...

Inadequate transmission capacity has left about 40GW of power purchase agreements (PPAs) and power sale agreements (PSAs) unsigned, according to the Ember report... Inadequate energy storage has also led to an oversupply of solar power, primarily between 11 am and 3.30 pm, forcing discoms into distress sales on power exchanges, according to executives with power developers. Power prices fell below ₹0.05 per unit 31 times in the first quarter of FY27, hitting zero on 1 May, according to data from the Indian Energy Exchange. In the year-earlier first quarter, power prices had dropped below ₹0.05 per unit six times... The bulk of India’s electricity is sold under long-term power purchase agreements at fixed schedules outside the exchange. Only about 13% of the country’s power is traded on the market.

13. Weight loss drugs are impacting the economy in unexpected ways.

As of June, roughly 38mn people in the US were actively using them, according to pollster Gallup. In the UK... People on weight-loss drugs are changing what they eat, do and buy, distorting traditional patterns of consumer spending. For certain sectors, such as gyms and healthcare supplements, GLP-1s are creating new customers and opportunities for expansion... Brands from restaurant chains to alcohol are trying to protect their margins by selling less of their product for the same price — or higher... In the UK, GLP-1s have cut grocery spending by an estimated £780mn per year at current uptake rates, according to Worldpanel by Numerator, a research group... Weight-loss drugs are part of what now looks like a broader, permanent shift in consumer behaviour, analysts say, as people fixate on health — on eating protein, taking supplements and tracking nutrition and exercise, while cutting back on alcohol.

And this

A 10 per cent average weight reduction among the 178 passengers on a Boeing 737 Max 8 would shave 2 per cent from the aircraft’s take-off weight, she found. For the four large US carriers combined, these savings could equate to about $580mn per year... The Magnum Ice Cream Company is focusing on bite-size and small portions and ice cream enriched with protein, which users are advised to eat more of to offset the muscle loss associated with the drugs.

14. The evolution of India's capital gains taxation regime for equities.

And STT in various countries.
15. Immigration in Spain under the Socialist Prime Minister Pedro Sanchez.
Between 2019 — the prime minister’s first full year in power — and 2026, the number of foreign-born residents in Spain surged by 3.5mn to 10mn, taking the country’s population to almost 50mn, according to the national statistics agency. Sánchez says immigrants have helped make Spain the rich world’s fastest-growing big economy, although growth in GDP per capita has been less impressive.

Wednesday, October 21, 2026

A framework for deregulation in the Indian bureaucracy

I have blogged on the issue of deregulation as an organisational culture earlier. This post is an attempt to provide a framework for thinking about the bias within the Indian bureaucracy towards the prevention of inclusion errors and process abuse. 

Two features of India’s bureaucracy are of relevance. 

One, a welfare policy to support the needy and a promotional policy to incentivise something, comes filled with access barriers. Two, a regulatory policy to permit or regulate something comes tightly prescribed. 

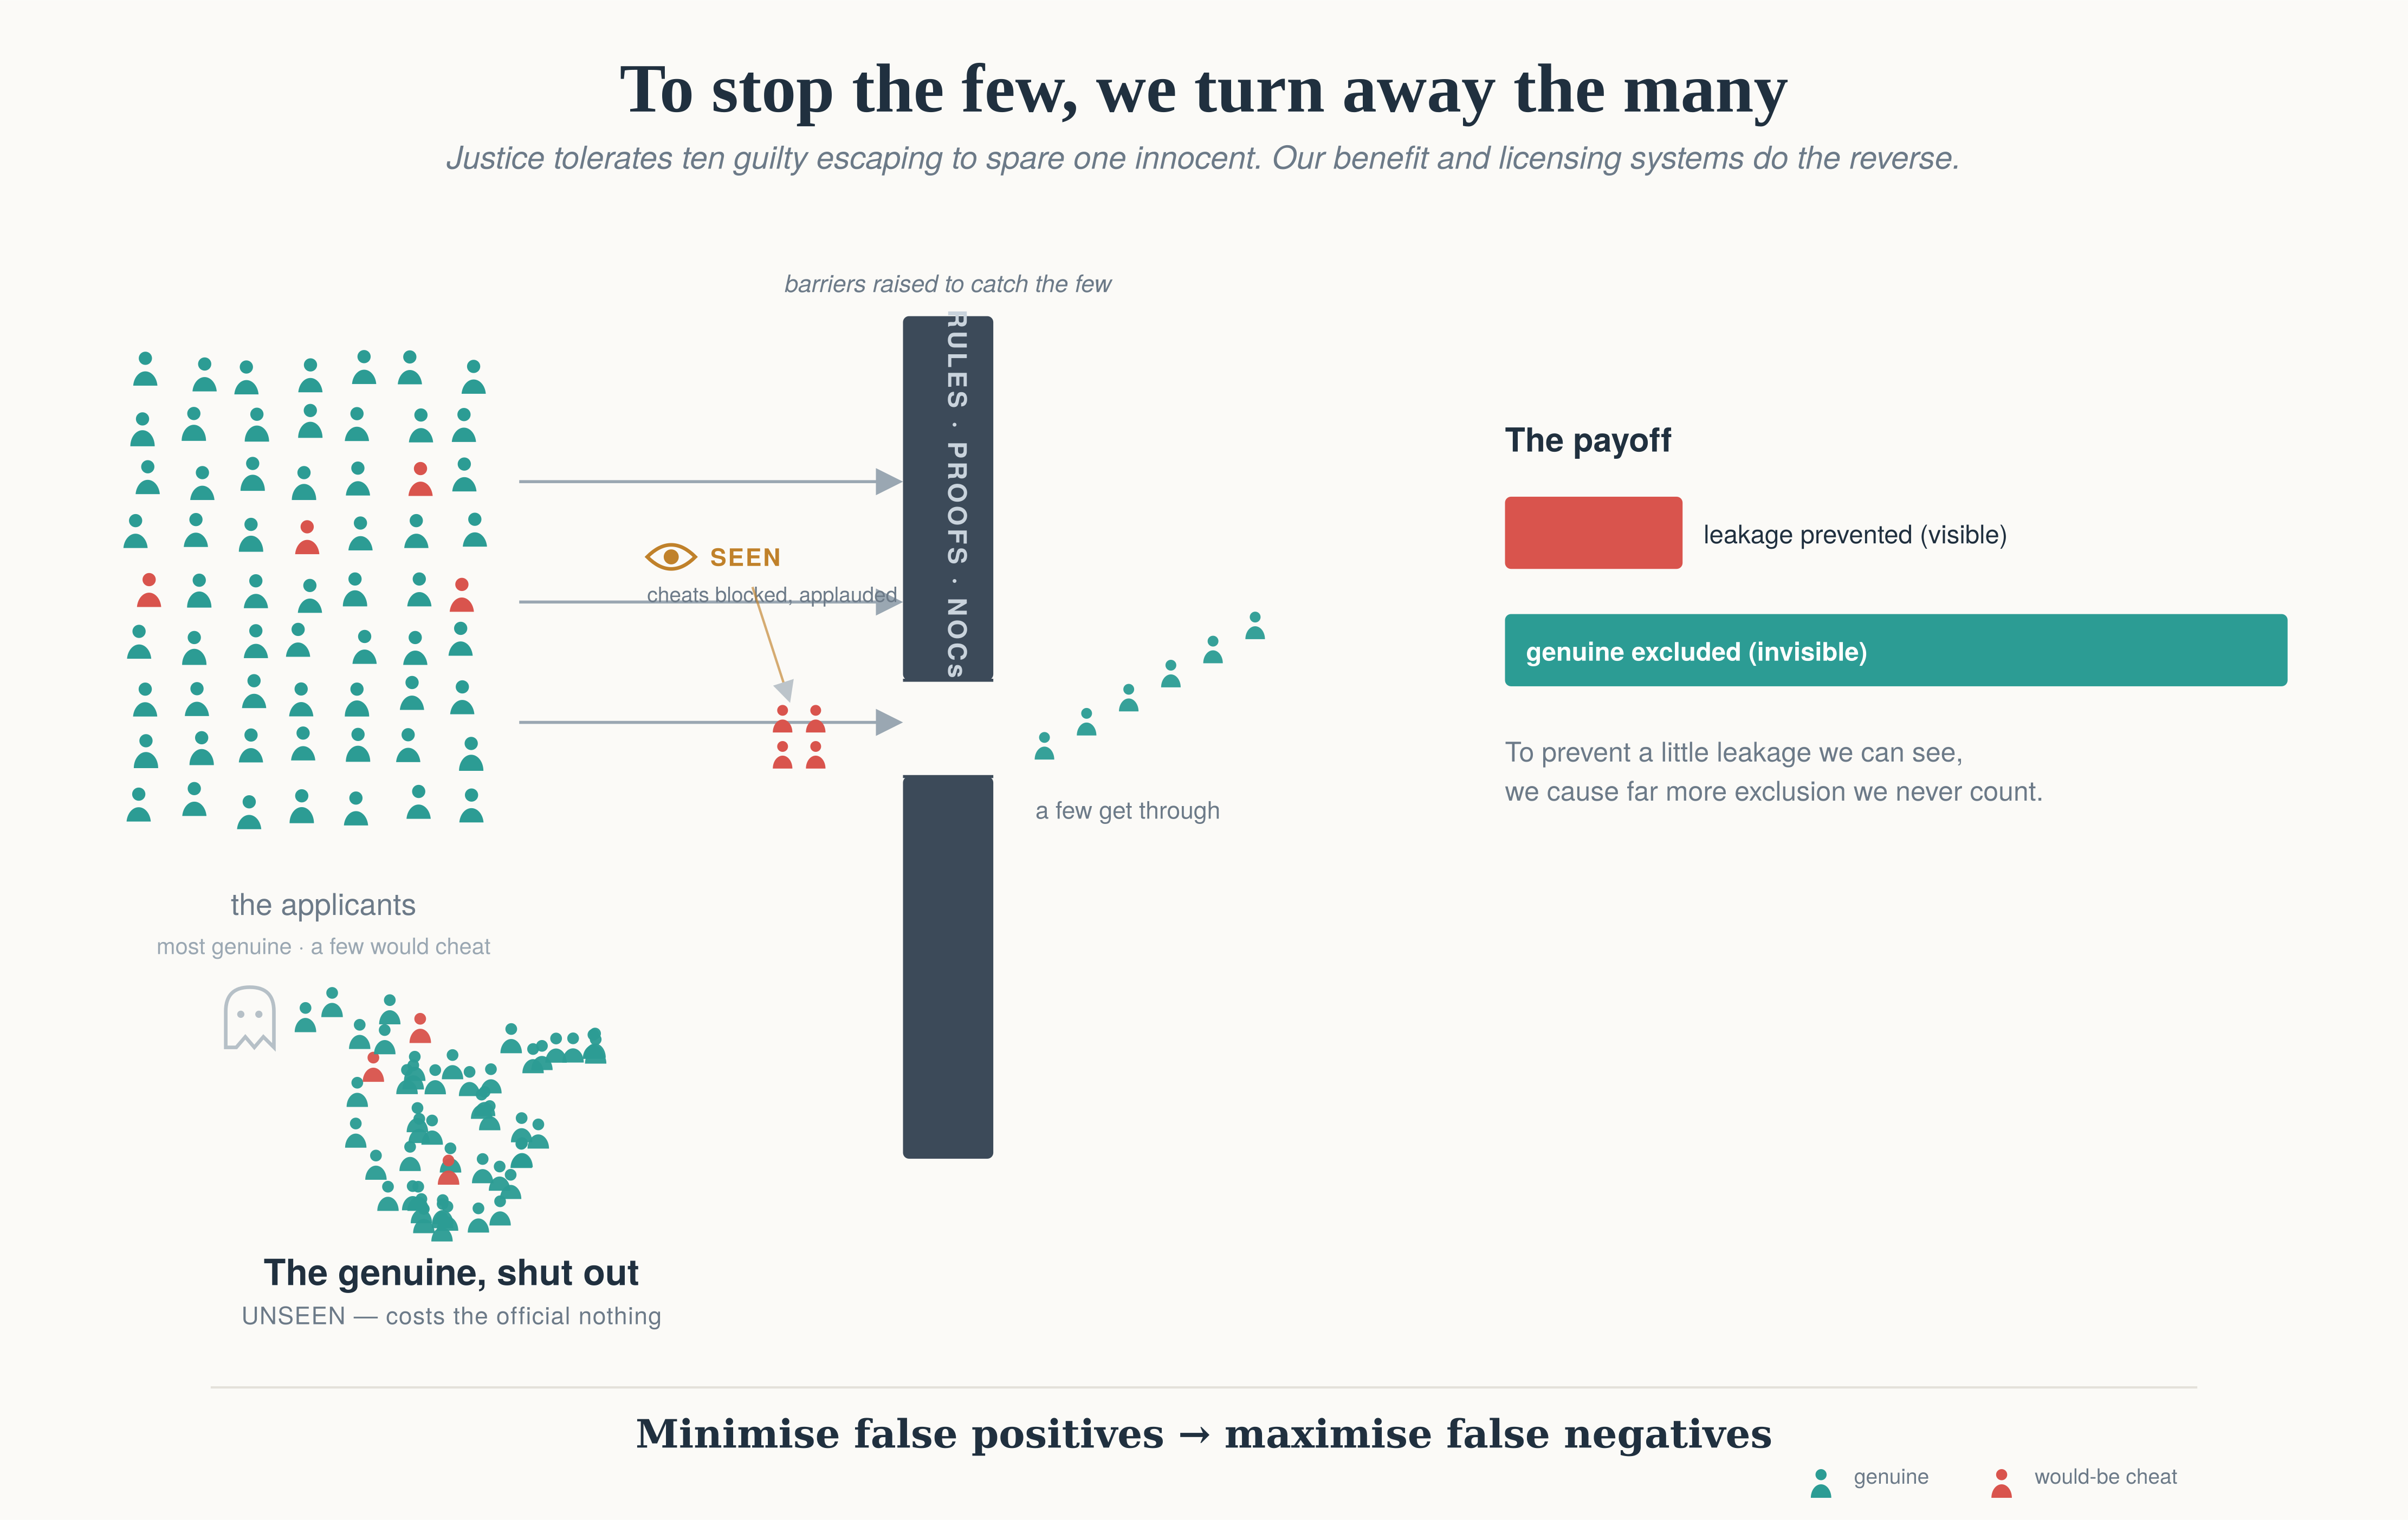
In the former, there is a reflex within the bureaucracy to prioritise waste/leak/abuse avoidance over inclusion, whereas in the latter, there is a tendency to over-prescribe so as to limit abuse even if it inconveniences genuine applicants. This is the rational choice arising from the institutional incentives. 

In both cases, the precautionary effort detracts from the realisation of the primary objective. The pursuit of the ineligible (the false positive or the Type I error) comes at the exclusion or harassment of the eligible (the false negative or the Type II error). 

All bureaucracies are prone to this precautionary bias. The clearest exemplar of this bureaucratic bias is cited in the oft-cited paper on regulatory economics concerning the invisible graveyard in the US FDA’s drug approvals process. The works of Sam Peltzman, Henry Miller, and Alex Tabarrok have shown that a drug regulator treats approving a harmful drug (visible deaths, Congressional hearings) as catastrophic and not approving a beneficial drug (invisible deaths among those who never got it) as costless, so it errs massively toward over-caution. Studies have estimated the ratio of Type II (delay) cost to Type I (bad-approval) cost in the thousands to one.

However, there are compelling reasons to argue that this bias is excessive in the Indian bureaucracy. 

Root cause reforms aimed at deregulation should target this bias and not be confined tojust one-off changes to existing regulations. I blogged here and here on this issue. 

There is an important contrast on this with the judiciary. There, the norm of the Blackstone ratio deliberately and explicitly instills that it is better to let ten guilty escape than allow one to suffer. The bureaucracy needs its equivalent norm. 

As a conceptual framework to understand it, there are perhaps three drivers within the Indian bureaucracy of this bias.

1. The false positive is salient when detected, whereas the false negative is always a silent counterfactual. Even the oversight mechanisms focus on detecting and pursuing the false positives, while invariably staying silent on the false negatives. In public debates, too, media stories play up the false positives while largely overlooking the false negatives. 

2. The bureaucrat gets personally hauled up in the case of a false positive that comes to light. Even if honest mistakes are safeguarded now, and they are finally exonerated, the public scrutiny and process harassment is a worse punishment.

3. The bureaucratic approvals process, especially the finance department concurrence (and also legal and personnel department concurrences), focuses far more on the false negative and mitigating them than on the efficiency and effectiveness of the achievement of its objectives. 

These three drivers must be seen against the backdrop of a system with a very high level of trust deficit between the government and the beneficiaries (in the case of welfare and promotional policies) and the regulated (in the case of regulatory policies). In the Douglass-North sense, there is a low-trust institutional equilibrium inherited from the colonial control-state, which has hardened into a shared prior (“the applicant is a cheat”) and a norm (“process compliance is safety”). 

There is also the historical inheritance of the colonial guardian bureaucracy built to maintain order and extract revenue, standing above and apart from the governed, and which elevates procedural purity over substantive correctness. At a social and political level, there is a stigmatisation of private benefit and a valorisation of public gain, which often views the two in binary zero-sum game terms. There is a widespread chalta hai (it’s alright) attitude that condones such delays, hassles, and exclusions, and does not provide credible enough channels to provide feedback and redress them. Finally, I am not sure whether ease of doing business and ease of living are yet the kind of electoral goods that generally force real, actual changes. 

In contrast, the development trajectories of today’s advanced countries and China involved deliberate trade-offs that erred on the side of inclusion and lowering transaction costs. The regulatory excess in the US (captured in the so-called “everything bagel liberalism”) and the precautionary principles in the EU are more modern trends that emerged well after these countries reached their developed country status. 

In contrast, the development trajectories of today’s advanced countries and China involve deliberate trade-offs that straddle a fine line between enabling and abuse. The regulatory excess in the US (captured in the discourse of everything bagel liberalism) and the precautionary principles in the EU are more modern trends that emerged well after these countries reached their developed country status. 

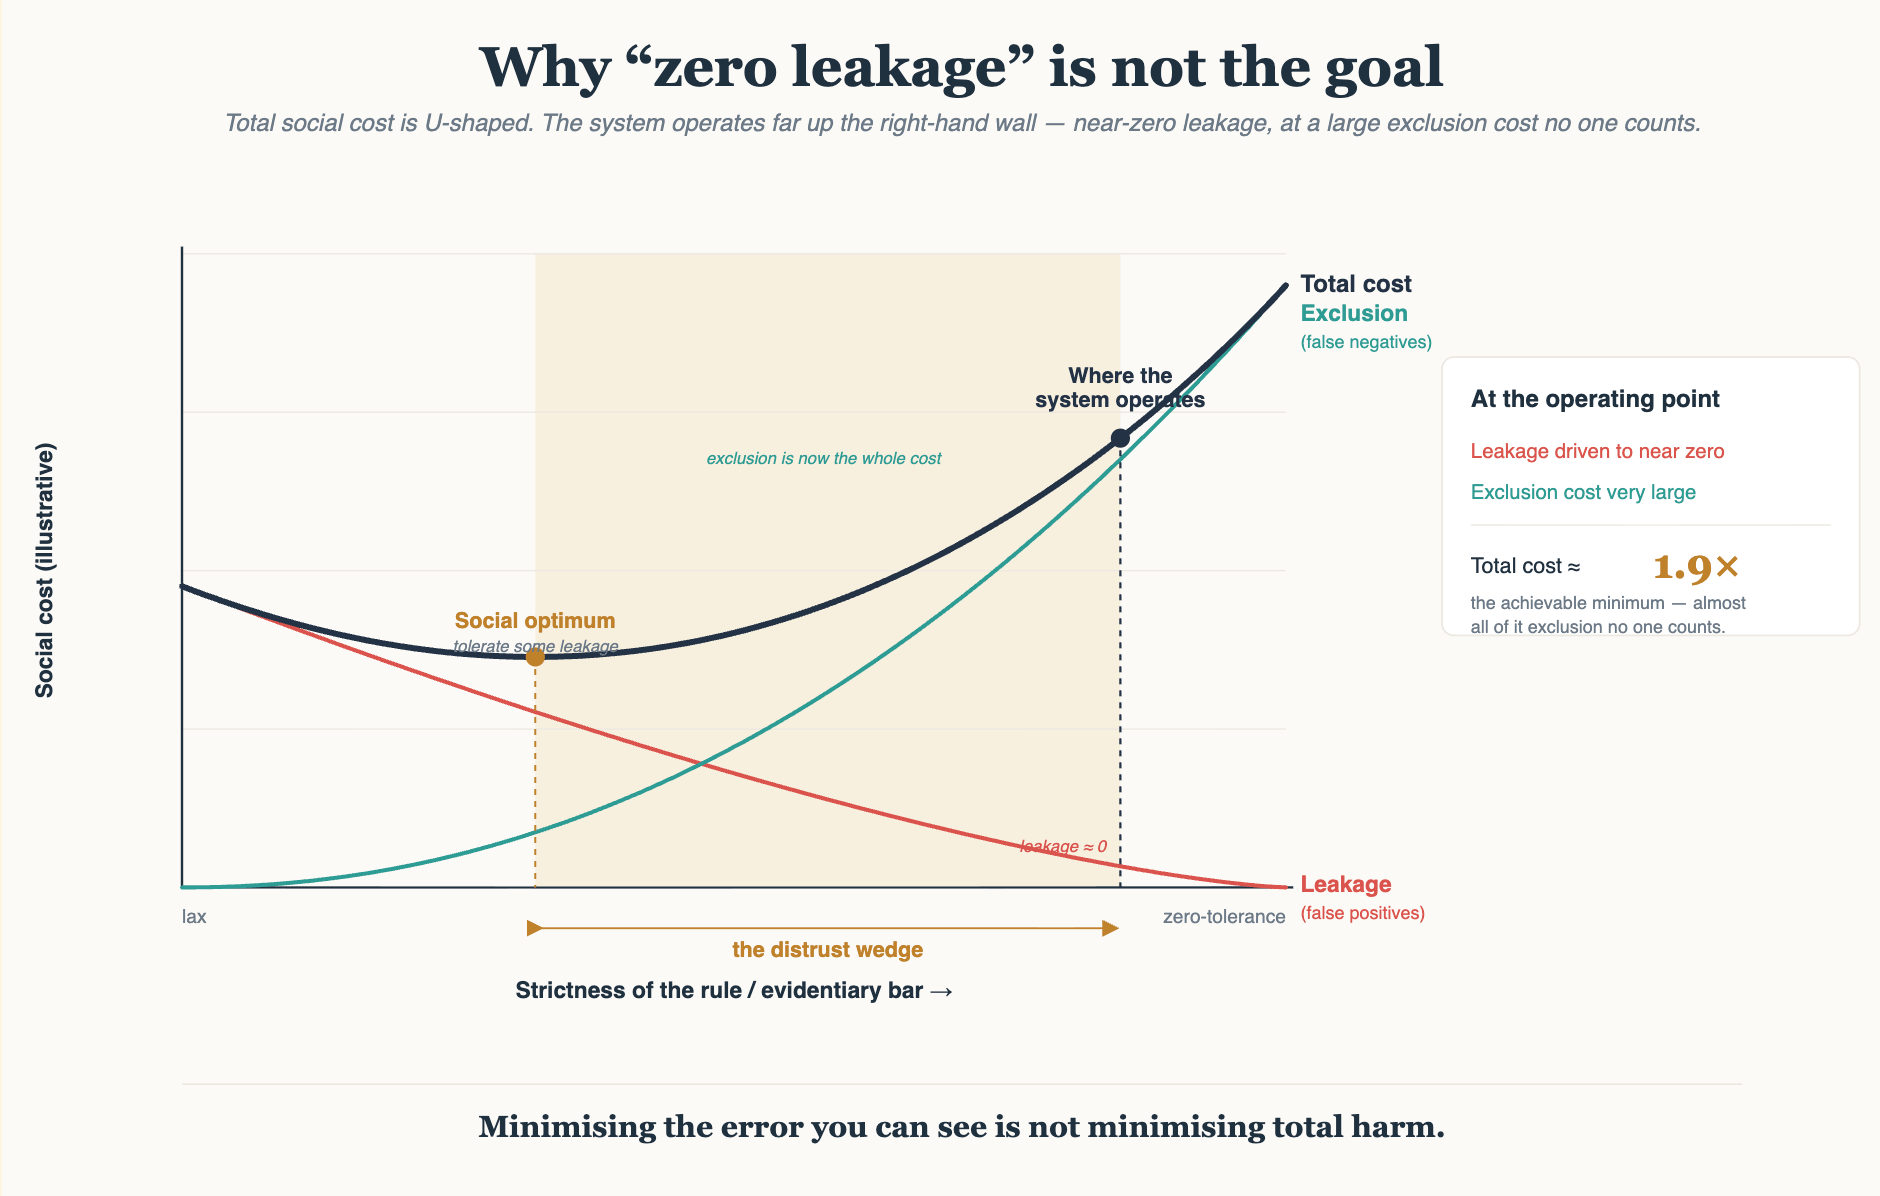
As an analytical framework, the public loss function is to minimise social welfare loss by minimising inclusion and exclusion errors and compliance costs. The social optimum is when the marginal reduction in leakages and abuse is equal to the marginal increase in inclusion or convenience. Since abuse is generally rare and genuine cases are the overwhelming majority, the social optimum requires tolerating some leakage. 

However, this public loss function comes up against the official’s private loss function. The aforesaid reasons amplify an accountability multiplier that forces his/her private loss function to minimise inclusions and abuse, even at the cost of exclusions and compliance costs. 

The asymmetricity or gap between the two loss functions is the distrust wedge, the gap between the procedural strictness that the society would choose and the strictness that the incentive structure would produce. 

Any remedy to address the root cause of the problem should revolve around shrinking the wedge, either by lowering the accountability multiplier (stop over-punishing honest false positives), making exclusion and compliance costs visible and costly, or lowering the compliance costs. 

It is about internalising the implied shadow price of avoiding abuse or leakage. How many units of genuine exclusion or compliance cost is the system willing to incur to prevent one unit of abuse or leakage? This is the marginal trade-off that serious deregulation policy must target. There must be an institutional ownership (and bearing of the associated costs) of the cost of exclusion and harassment. 

So, in terms of possible solutions, here are a few suggestions.

Efforts to change deeply entrenched norms and behaviours are complex endeavours. They are collective social and political choices that get adopted by the bureaucracy as strong and salient organisational narratives. They are best and most effectively done when they are done directly to change beliefs, norms, and behaviours. 

The Indian state has generally struggled when it comes to instilling values to change collective behaviours. 

It does better with specific interventions. But there is a risk in reducing such efforts to technical measures. The Ease of Doing Business ranking is a salutary example of the form taking over the substance and subverting the objective. 

Nevertheless, the three-point conceptual framework articulated earlier can be the baseline for reforms. 

The single highest-value and genuine root-cause fix to the problem is to make exclusion visible and costly. It is useful to have an institution, ideally within the Department (even with all the flaws or conflicts of interest), or one like the NITI Aayog, entrusted with the task of capturing/quantifying and updating the exclusion and compliance costs (the false negatives). This would include the publication of exclusion/rejection/non-uptake rates and median clearance times for every benefit and licence, by geography and office, as standard MIS. To also provide perspective, these metrics can be posted against some desirable benchmarks. This may be done for a prioritised set of activities for certain departments. 

This may be an essential requirement to foster a culture that evaluates public services also in terms of their false negatives and compliance costs. 

The first step is to quantify and make the costs salient and institutionally aware. An apprenticeship, a scholarship, or a credit-linked subsidy scheme should be evaluated primarily on its uptake. A welfare benefit should also be evaluated on the cost of access and the extent of its exclusions. The compliance cost of sectoral regulatory regimes (environment, development control regulations, building byelaws, land, labour, cyber security, etc.) should be quantified, as also those for various kinds of registrations and licensing (shops, schools, restaurants, clinics, visas, land, etc.). 

This could be supplemented with an explicit articulation, for internal circulation, of an exclusion or compliance impact statement with every policy or regulation. This would provide policymakers and regulators the institutional freedom to account for convenience, access, and implementation flexibility, and avoid being exclusively hooked on loss prevention. 

Auditors and oversight entities must explicitly incorporate this dimension in their audits, assessments, and investigations that tend to focus only on the false positives. This would offer the combination of deliberative process protection, the vigilance-intake filter that separates the honest error from corruption, and the avoidance of the ex-ante (not hindsight) audit standard. 

Finally, the approval process should incorporate these principles across the gates. The financial, legal, and personnel concurrence/vetting should be circumscribed to ensure that the precautions and safeguards that are proposed don’t detract from the objectives. 

There is a high risk of these efforts spawning more bureaucracy. So it must be done thoughtfully and not in a checklist-filling manner, as was done in the case of EoDB rankings.

Further, given that most policies and regulations are administered digitally, a low-hanging fruit would be extensive adoption of data analytics. The digital trails of administrative and transactional data could be analysed to detect abuses and address them. The emergence of AI-enabled applications equips us with the tools to do this easily and effectively. The challenge in each activity should be to define the likely problems and analyse to identify signatures of abuse. 

To conclude, the stock of policies and rules with a precautionary bias is an output whose generator is the distrust wedge, or the asymmetric loss functions. The revision of rules one at a time merely empties the reservoir that the generator keeps replenishing. Therefore, the durable reform is to do a root cause analysis and recalibrate the generator with some of the aforesaid measures. This can shift the precautionary bias that is the current individual rational choice within the Indian bureaucracy. 

Friday, October 16, 2026

GCCs and the reshaping of India’s IT services industry

Much before the AI revolution threatened to disrupt India’s IT outsourcing firms, the proliferation of Global Capability Centres (GCCs) of global multinational corporations were already impacting them. For at first glance, GCCs involve in-sourcing and off-shoring of those activities previously performed by these IT firms. 

This post will examine three questions. What is likely to be the impact of GCCs on the IT firms? What is the likely net impact of GCCs on the Indian economy? How would the GCCs be viewed politically in the era of protectionism and reshoring?

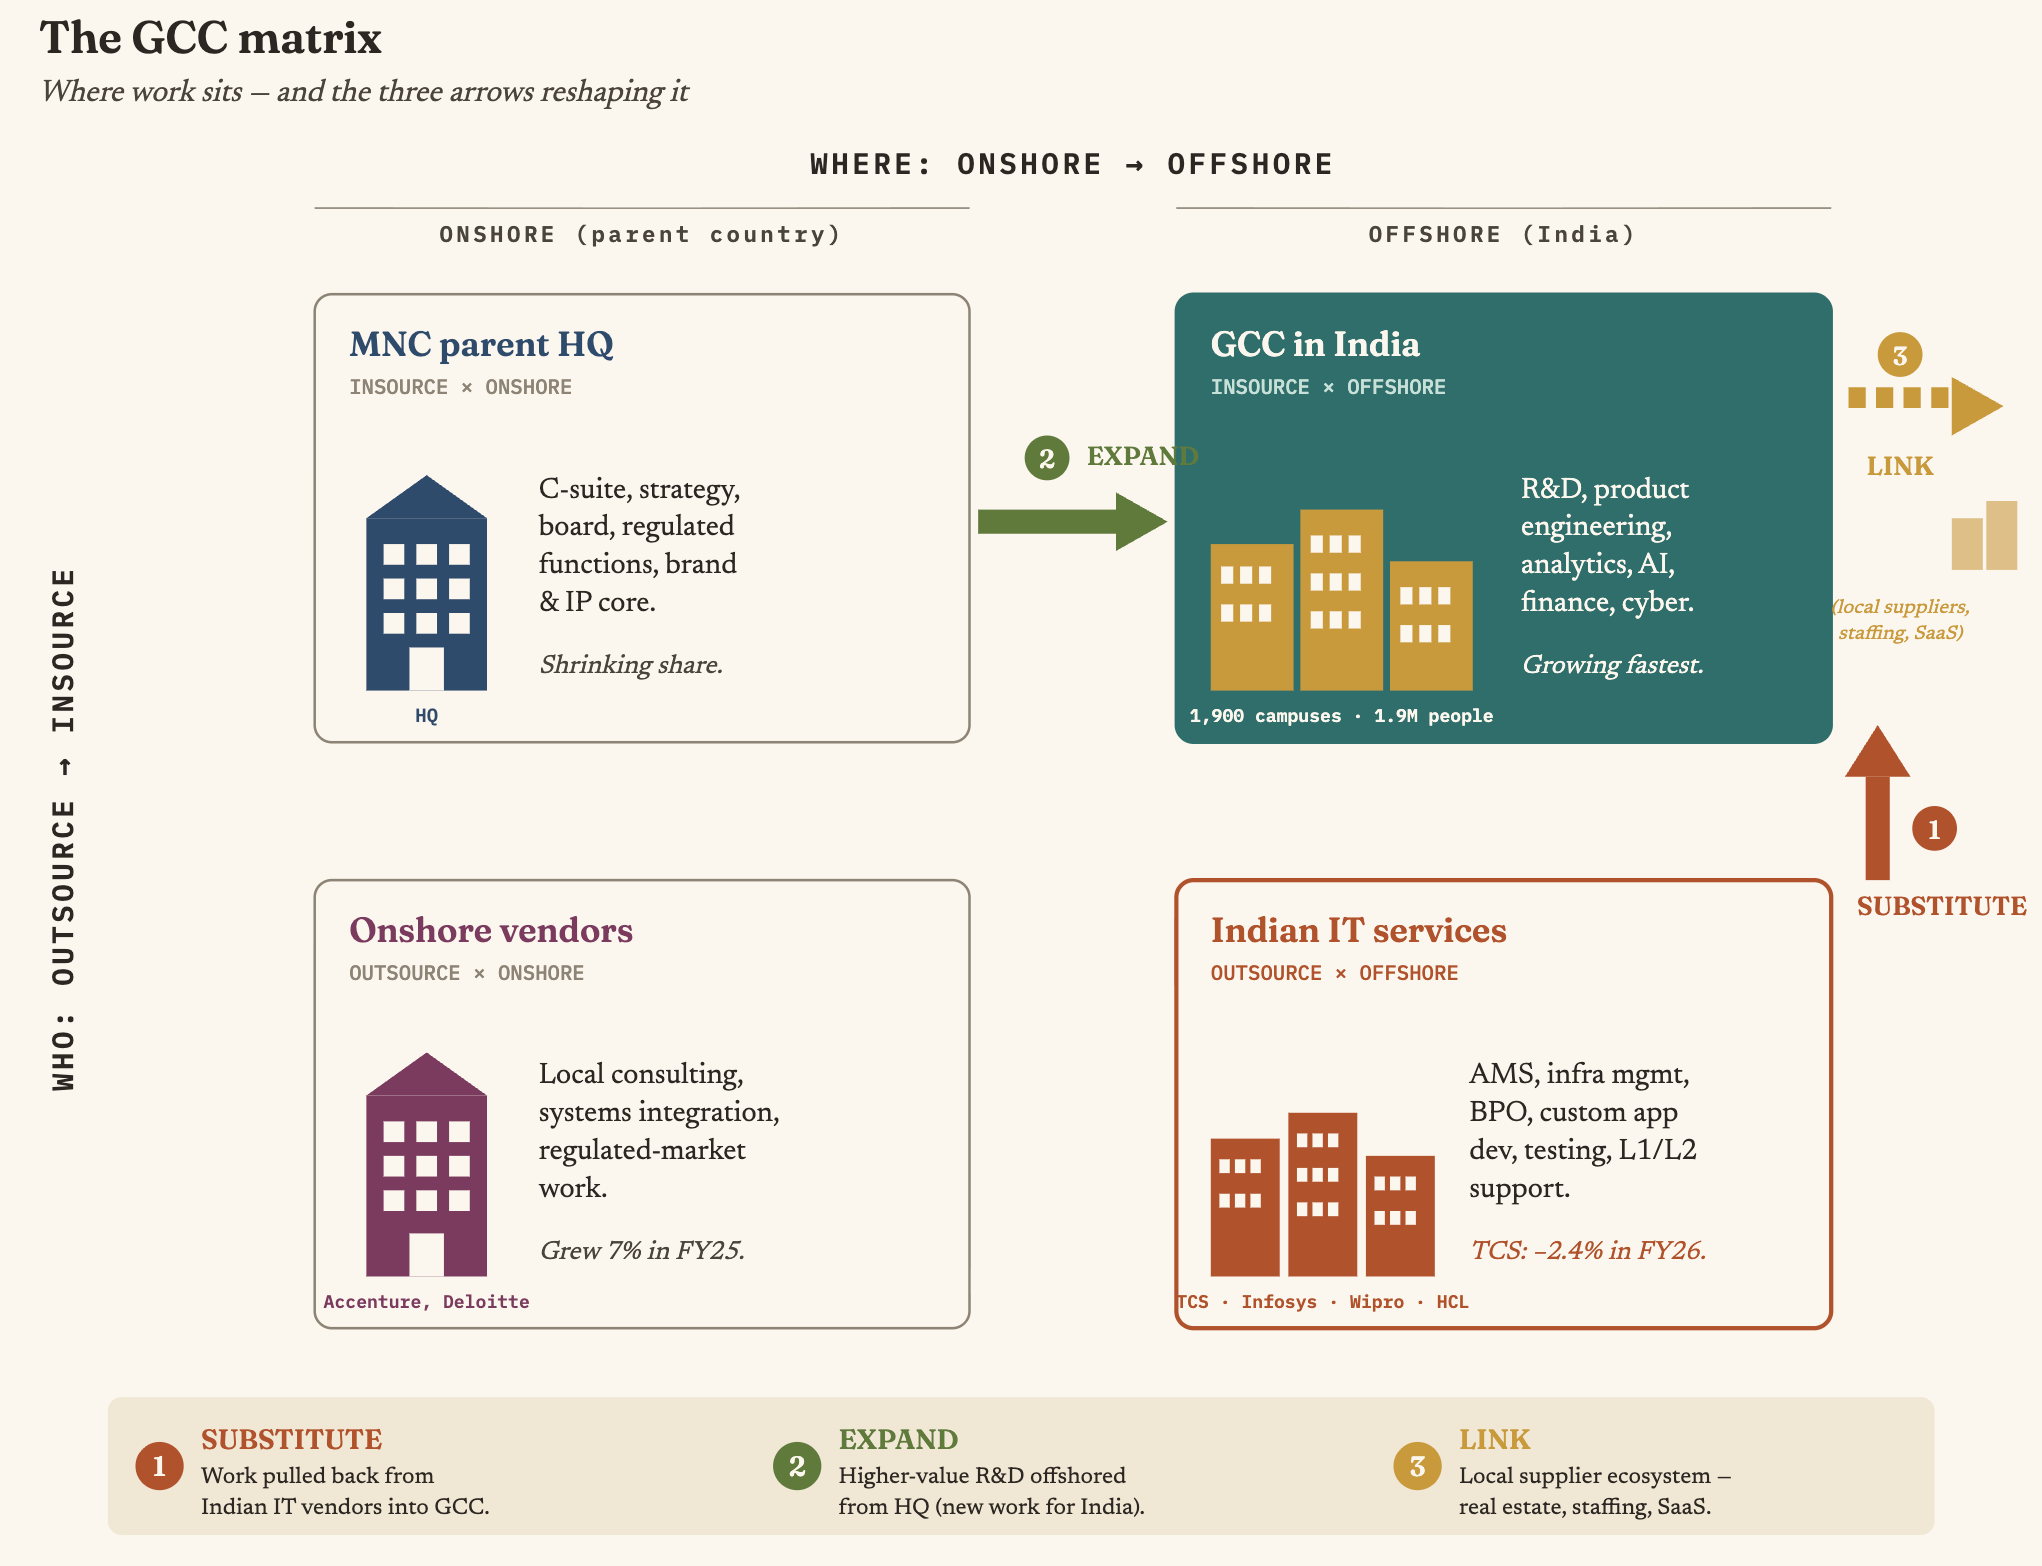
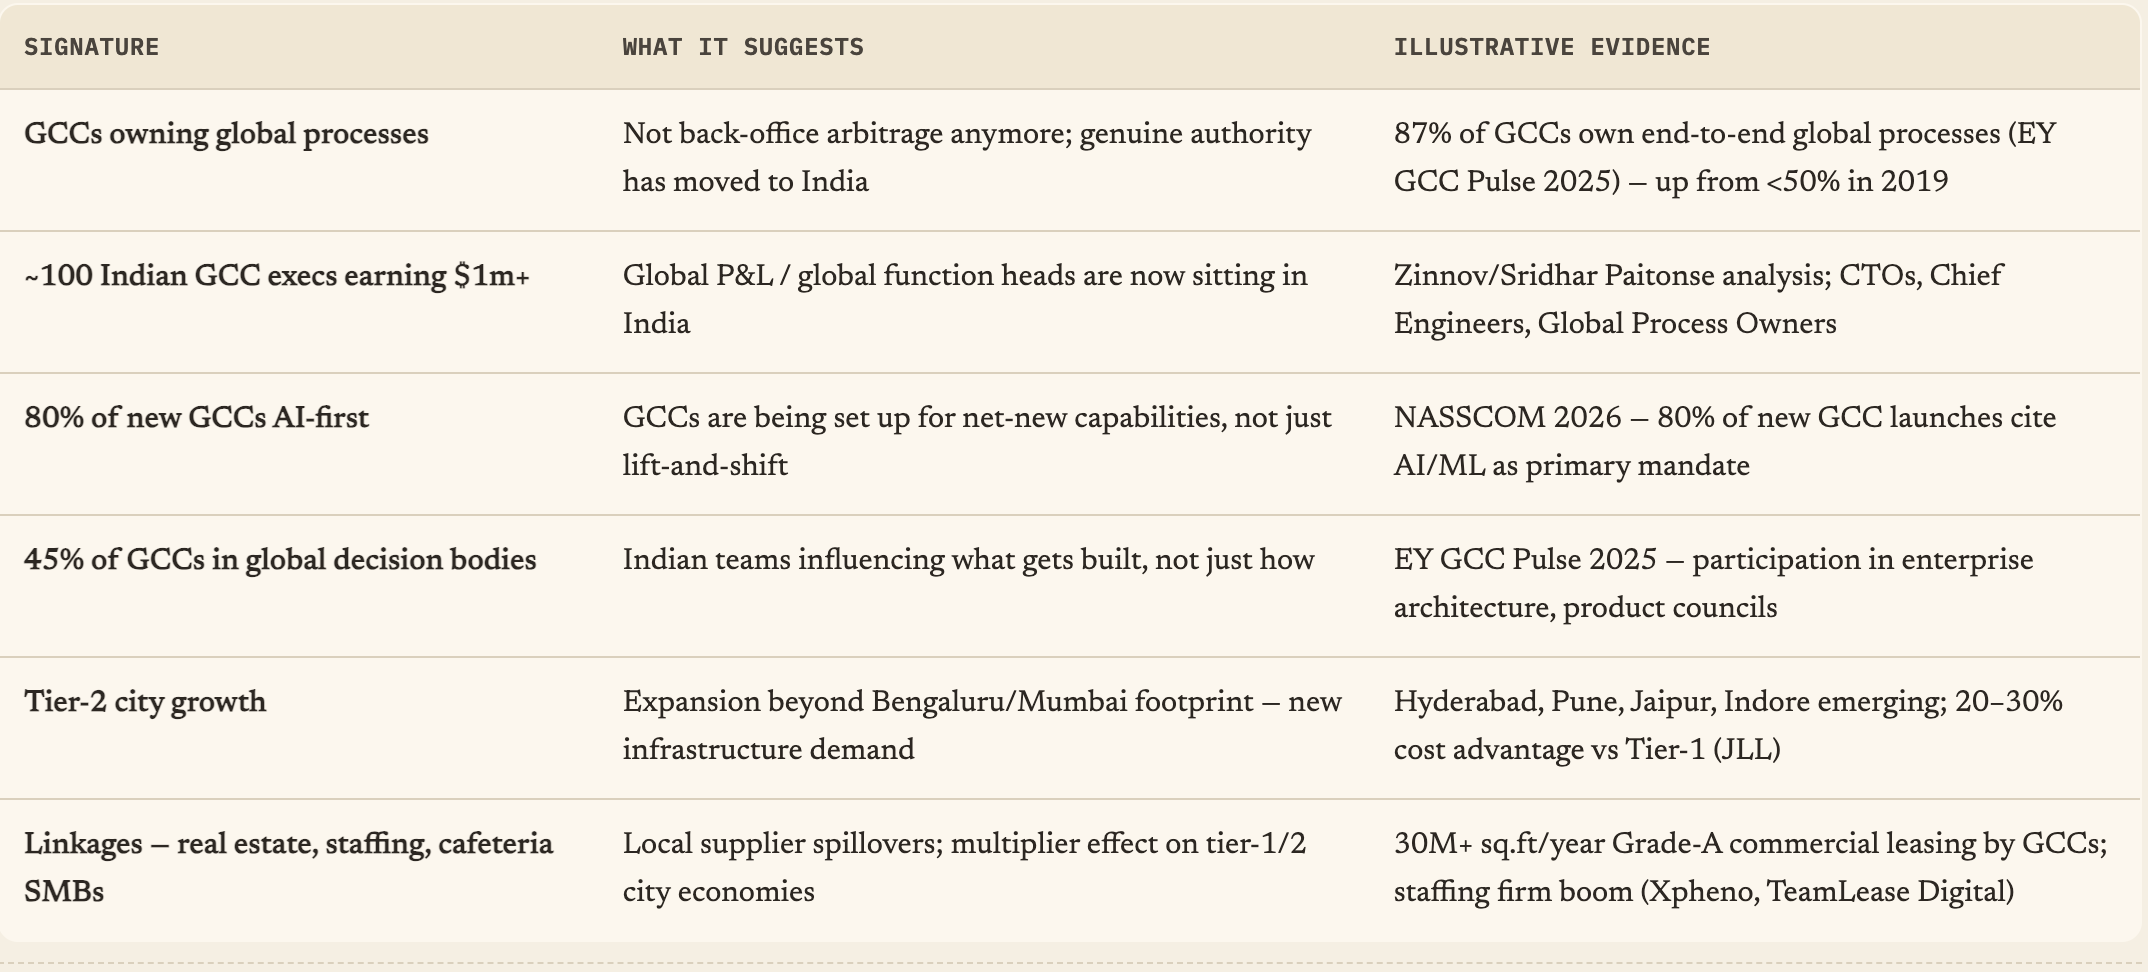
A useful framework to think about the issue is to view GCCs in two dimensions - who does the work (outsource/insource) and where it is done (offshore/onshore or reshore). This is likely to impact India in three measurable ways - substitution (insource work from IT firms to client-owned GCCs), expansion (offshore to the GCC those higher value added R&D and core functions that previously stayed with the parent), and linkages (creation of local supplier ecosystems around the GCC). 

It can be argued that substitution is a direct threat to Indian IT firms, expansion is a new opportunity for India (though benefits are captured by MNCs), and linkages are significantly beneficial in terms of knowledge spillovers and new business for the local firms. 

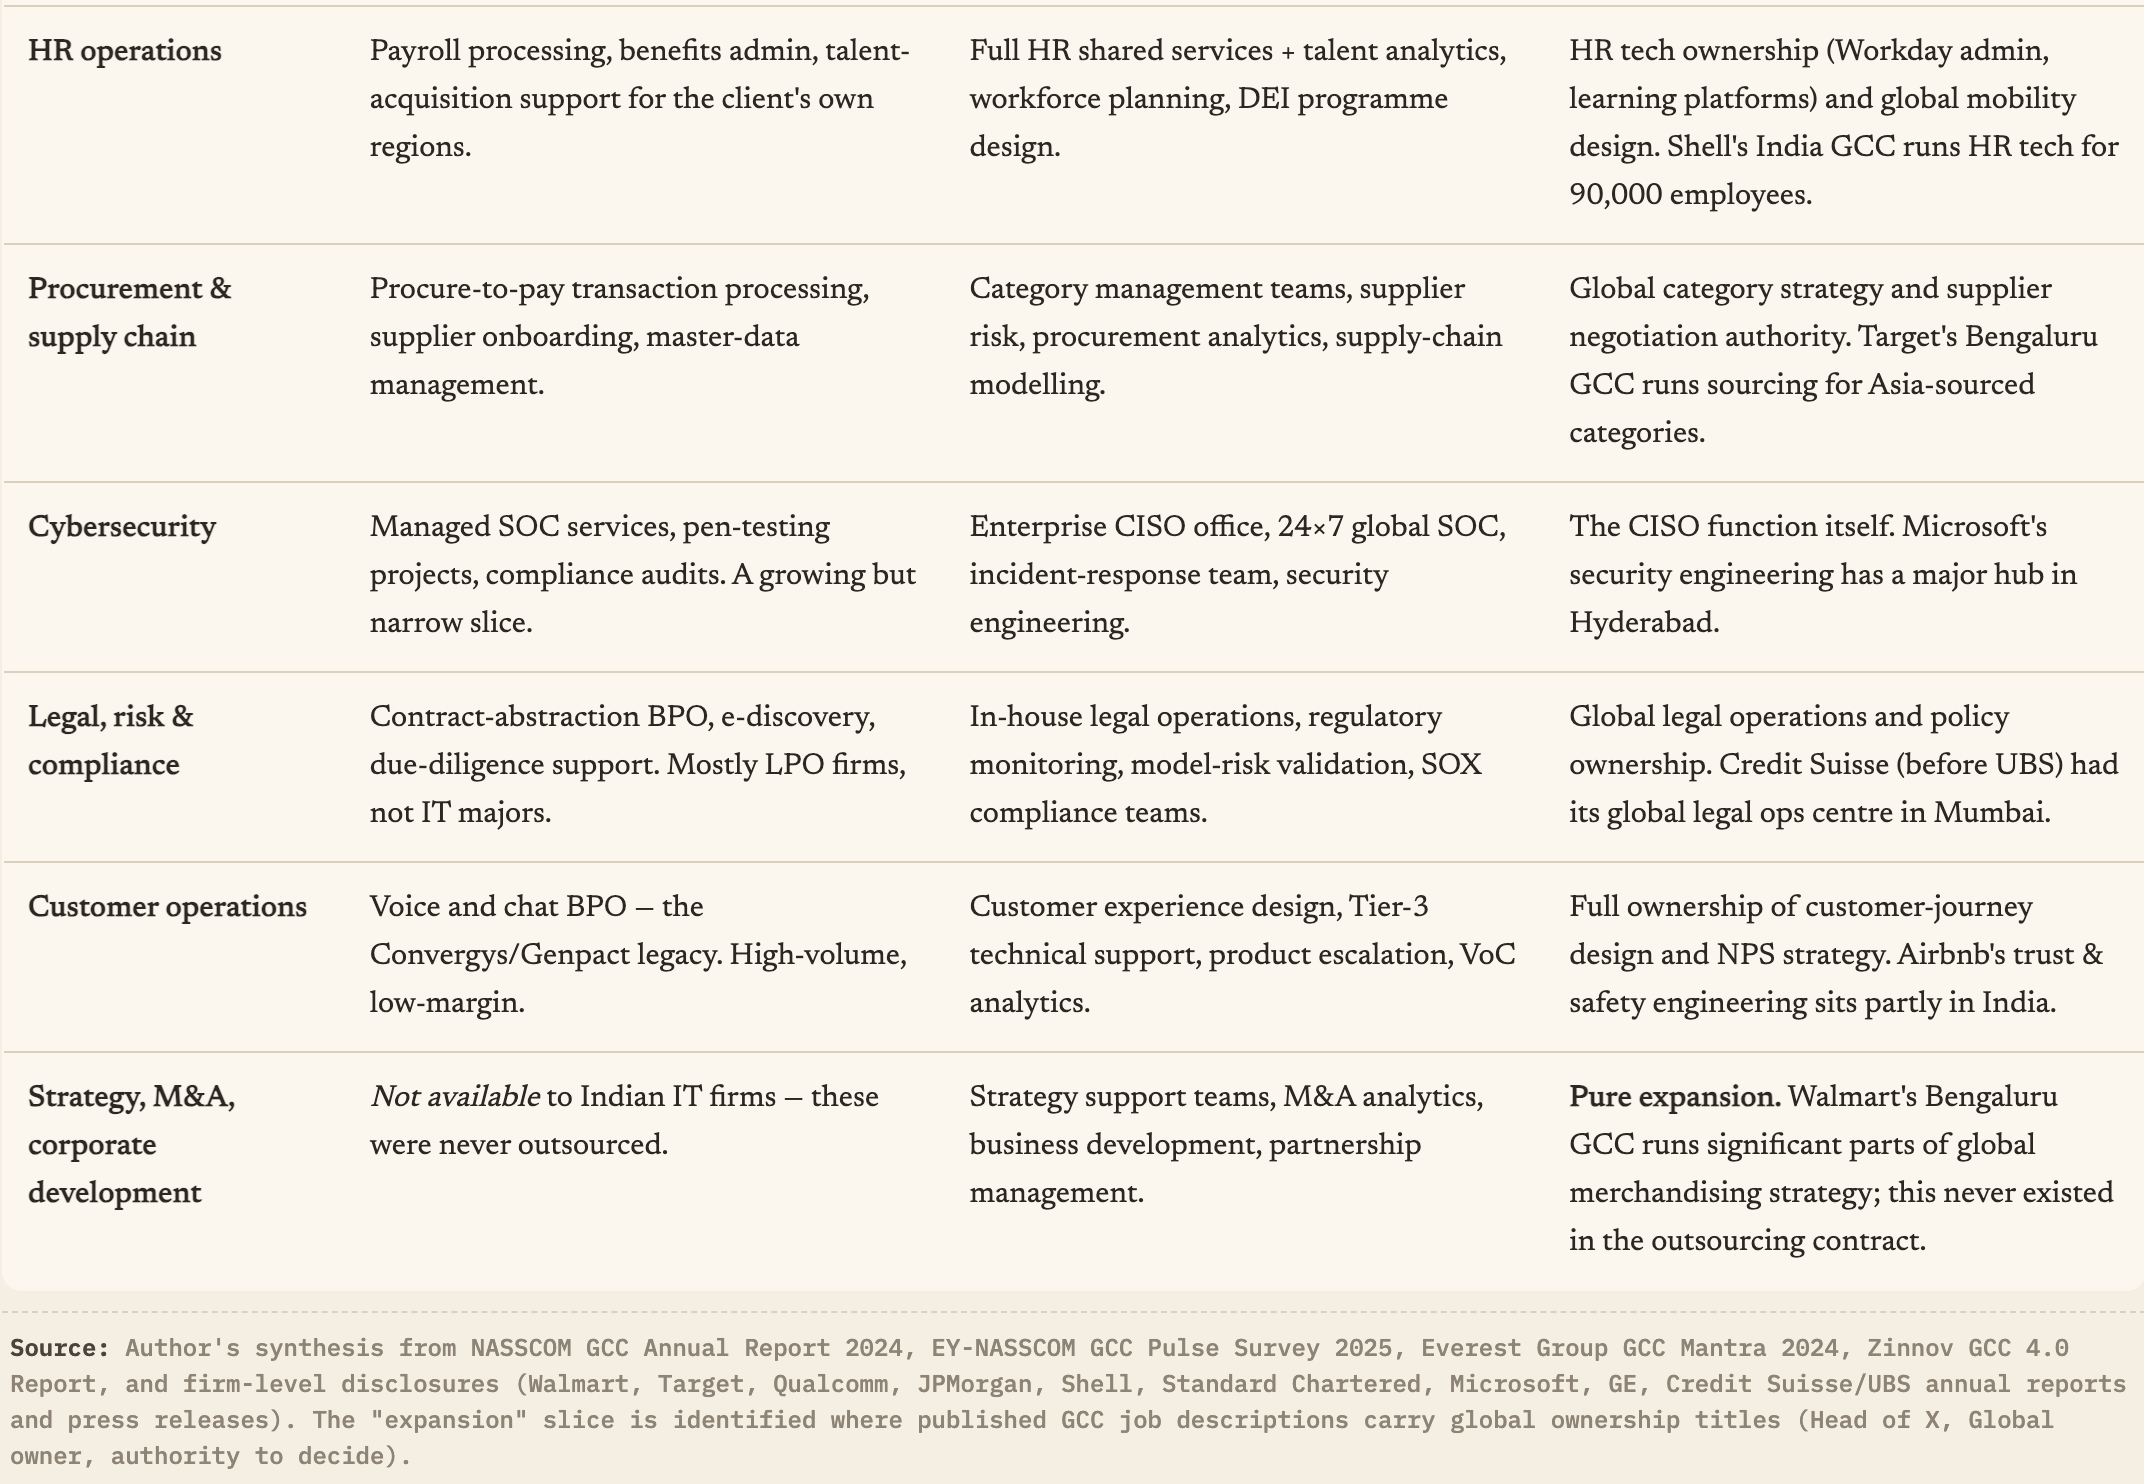
I used Claude to generate a taxonomy of activities with tasks that undergo substitution and expansion. For each activity category, the table outlines the parts of it done by the IT firms and GCC respectively, and their potential expansion areas.

In 2024, the 1900 odd GCCs generated revenues of $64.6 bn, forming 32% of the total IT exports of about $200 bn. At such volumes, even if they are substituting a small share of their total revenues, it can be a major top-line drag on the IT majors. 

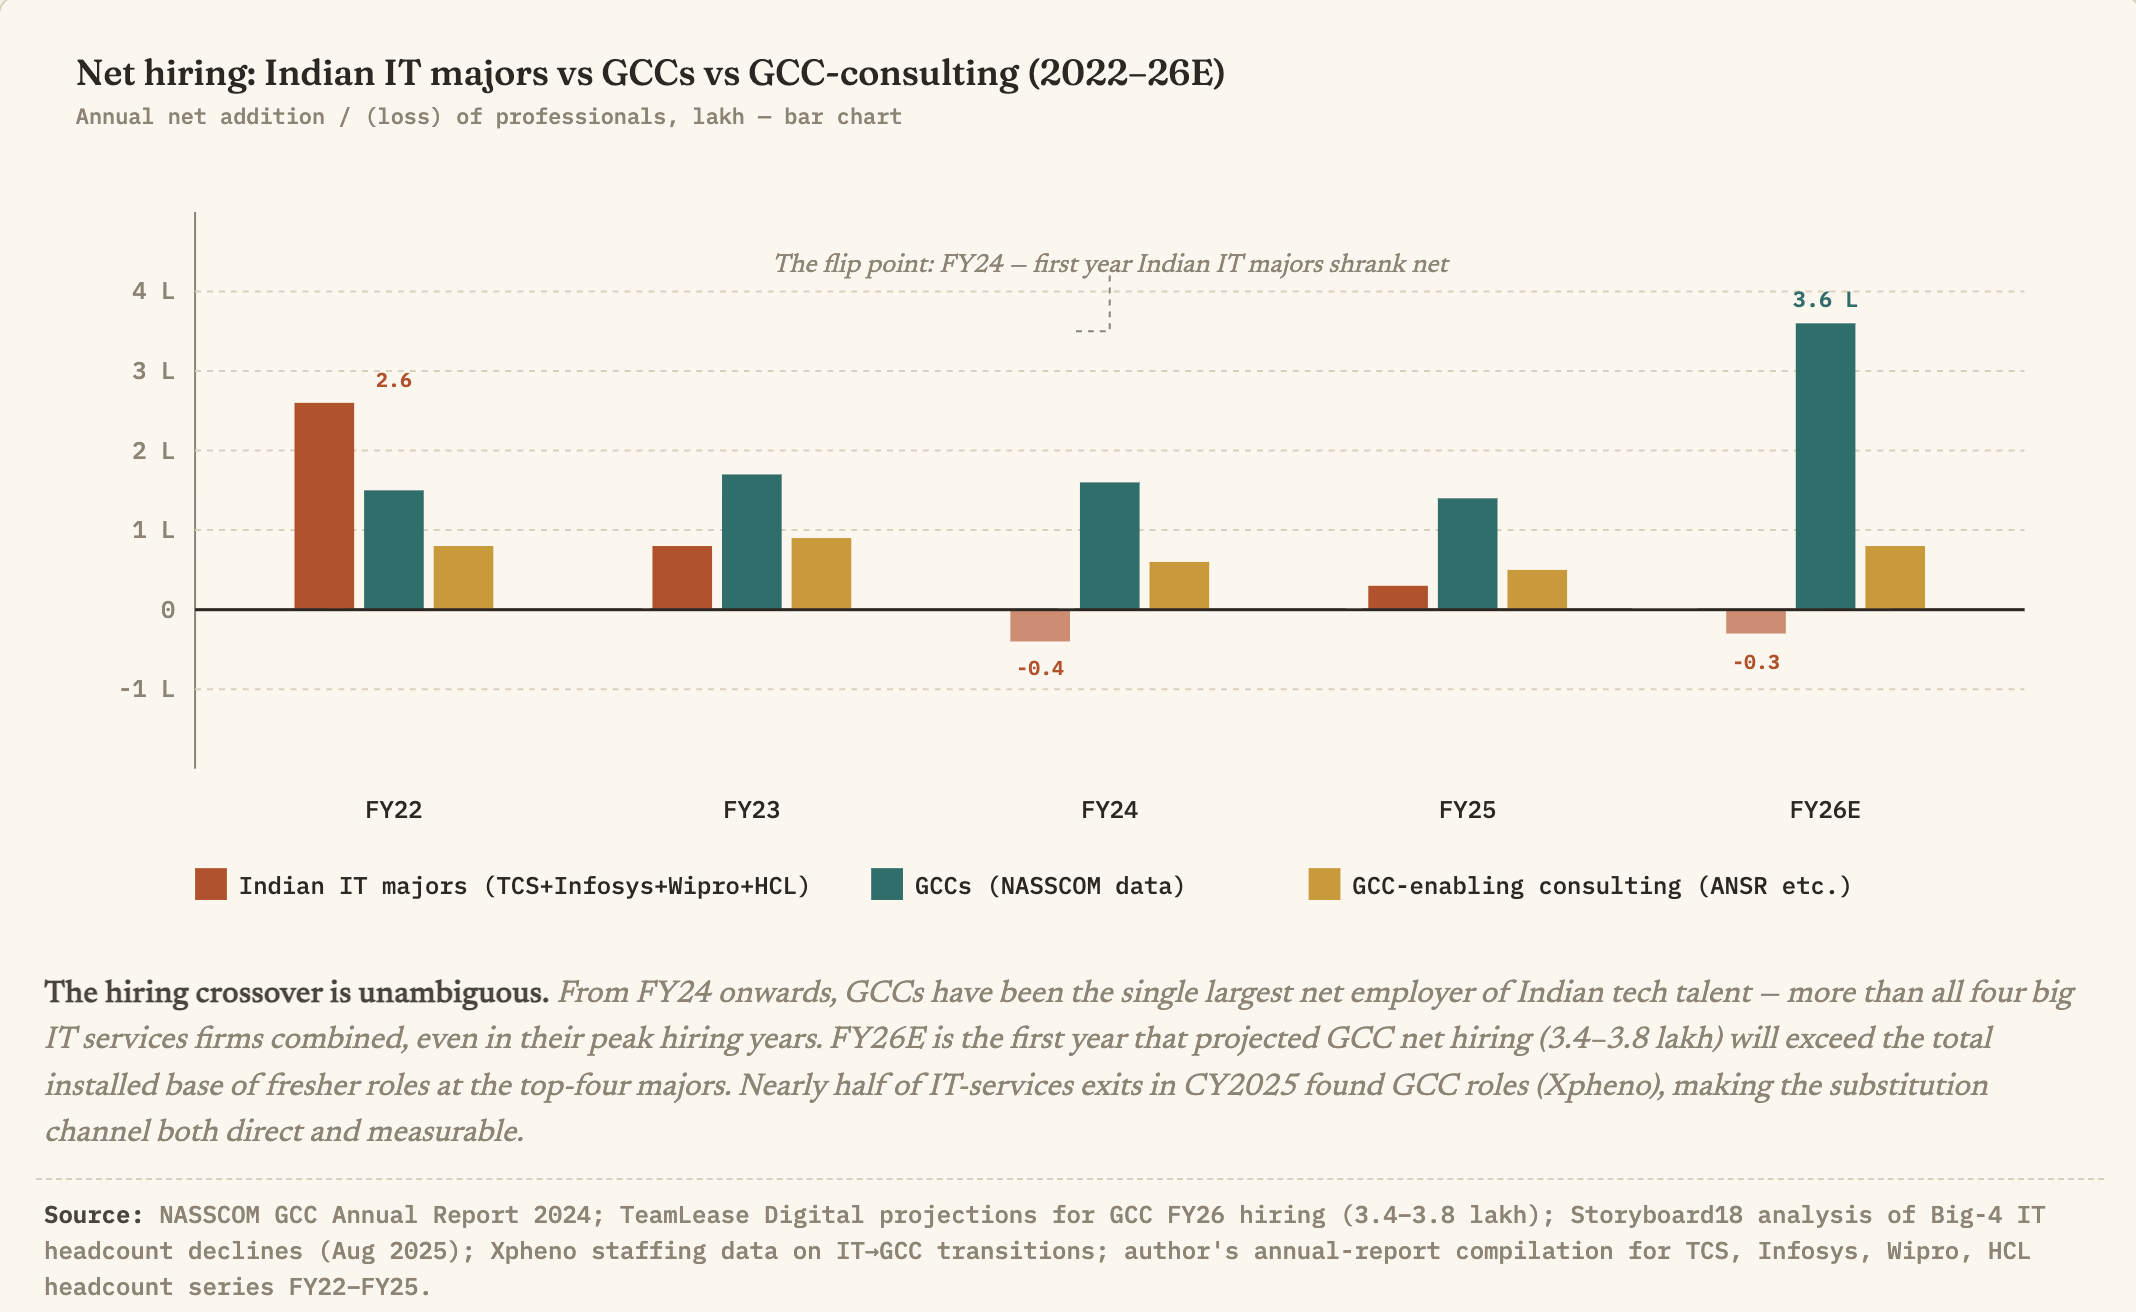
While neat causal attribution may be difficult, there are several signatures of stagnation and even decline in the fortunes of the IT firms, and they predate the emergence of AI. At a headline level, TCS reported its first-ever annual revenue contraction in FY26, Wipro has shrunk for three consecutive years, and Infosys’s FY27 guidance of 1.5–3.5% is the lowest in two decades. In the three years till 2024-25, GCCs added more net headcount in India than the four largest IT services firms combined.

TCS, Infosys and Wipro have decelerated from double-digit growth in 2021-22 and 2022-23 to low-single-digits or outright contraction since then. While GCCs may be substituting their work, on the AI side, the likes of Accenture appears to have taken a head start in capturing the AI consulting work. Reflecting this, Accenture grew 7% in 2024-25 and has crossed $69bn in revenue.

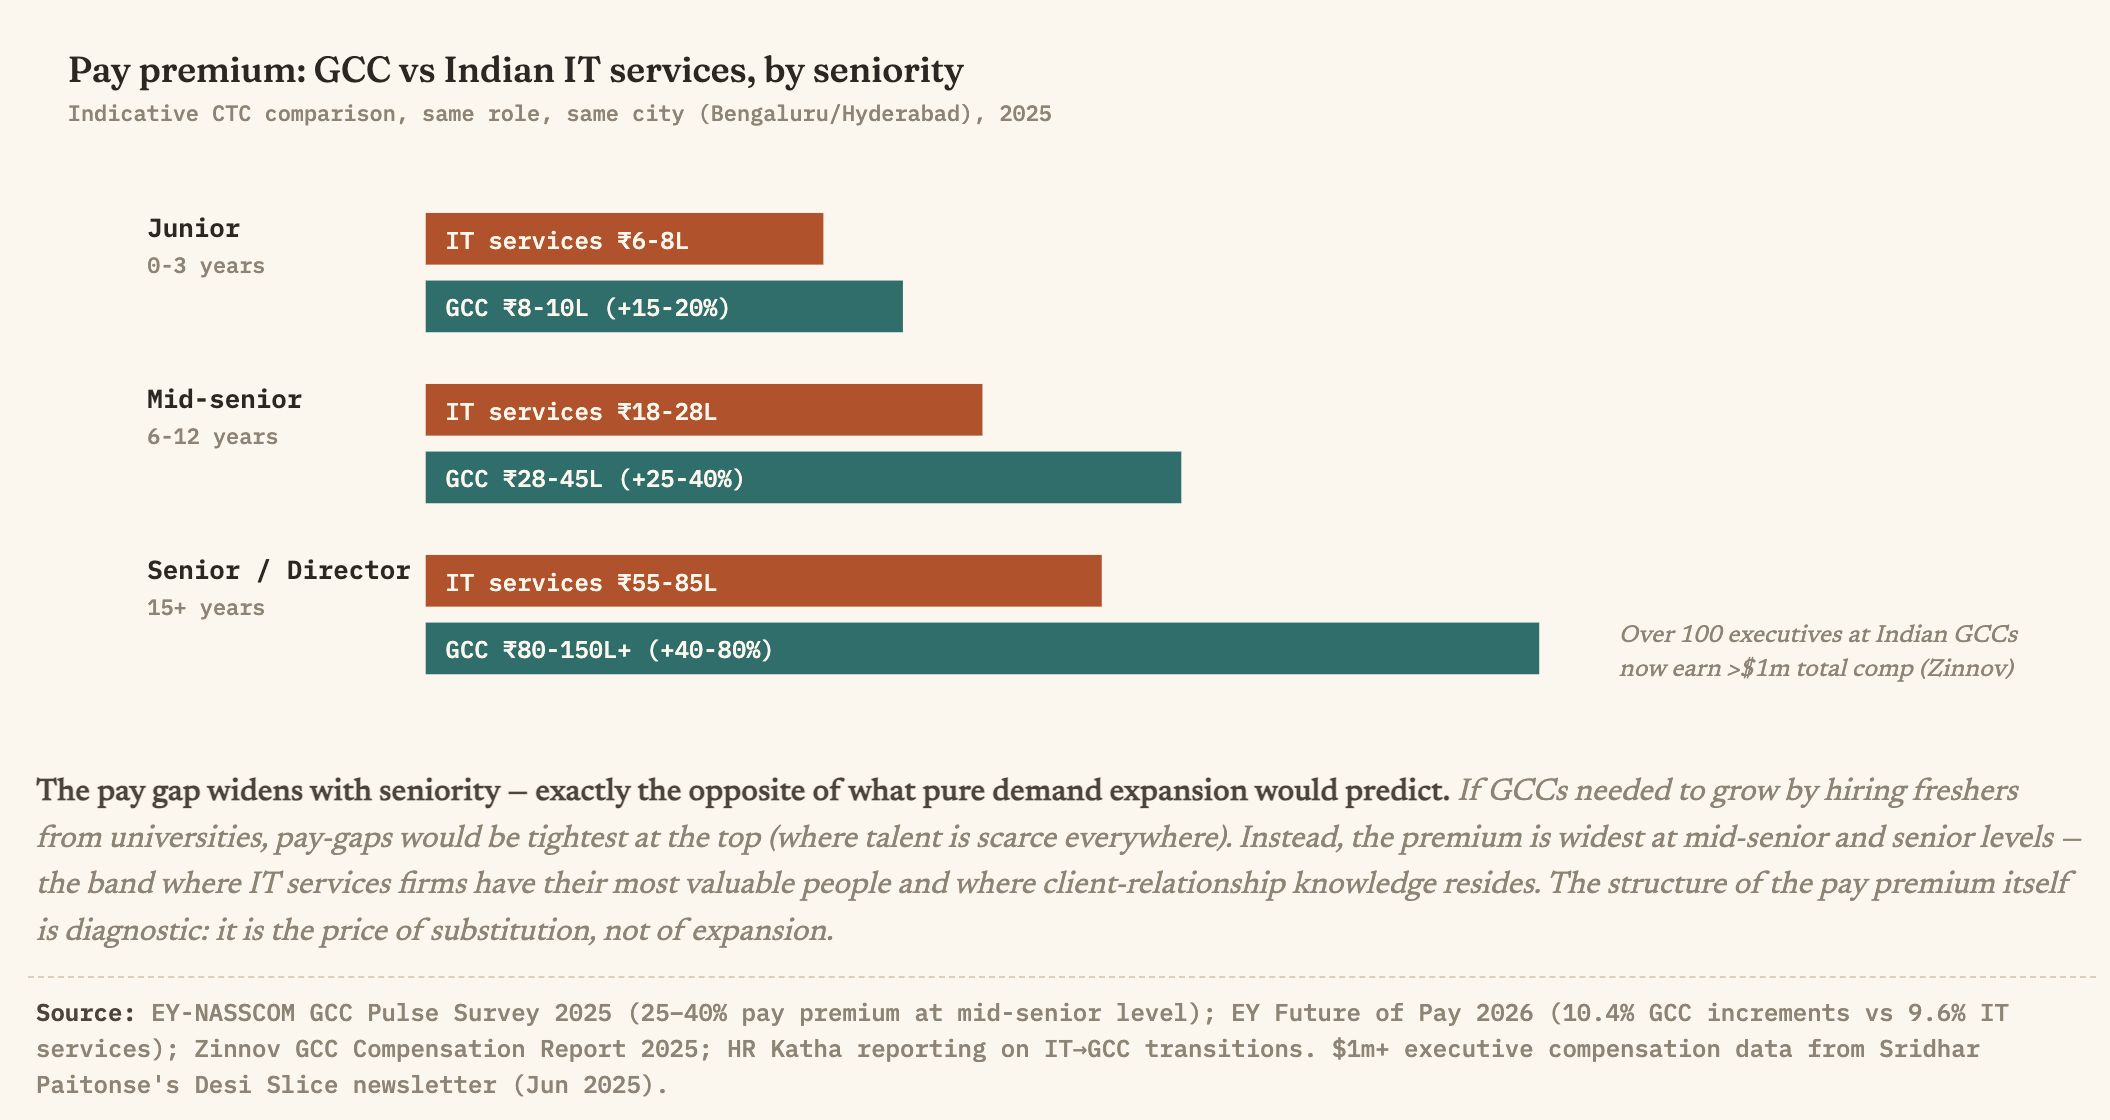
These trends are already reflected in the labour market. The GCCs are now hiring the same IT engineers from their previous outsourcing vendors, and at 25-40% higher pay. 

The clearest proof that GCCs are taking share from Indian IT vendors (rather than only expanding the pie) comes from the labour-market. Employees of the IT majors (TCS/Infosys/Wipro) are now being hired by the GCCs of the same multinationals that used to be their clients, at 25–40% higher pay. There may be signs that the IT vendors are now suffering a talent drain to their former clients. 

To summarise, Claude offered this assessment

Of the ~$65bn GCC revenue in 2024, roughly $35–40bn is expansion (work that would never have come to Indian vendors) and $25–30bn is substitution (work that was, or would have been, done by Indian IT services firms). That substitution slice is still only ~15% of total Indian IT services revenue, which is why the vendor firms are decelerating rather than collapsing. But at current GCC growth rates, the substitution slice compounds at 20%+ per year while the vendor base compounds at 3–5% — so the ratio reaches 25% by 2027 and 35%+ by 2030. That is when it becomes an existential risk to the current Indian IT services business model.

In the circumstances, for the Indian IT firms, the emergence of GCCs (and AI) bring down the curtain on the lower value added volume game of manpower outsourcing, and reveals that the only credible path is to compete on AI-first consulting at Accenture-like margins, which requires talent, human resource capabilities, and brand investments they historically avoided. 

The linkages possible from GCCs are also likely to be significant. Apart from the support services, the GCCs will also catalyse a supplier services ecosystem that serve the main activities. Services sector ecosystems are unlikely to be in the nature of physical input-output linkages. Instead, they are likely to be in the form of various kinds of externalities. 

The GCC’s local ecosystem is more likely to emerge through specialist technology vendors, subcontracting, employee mobility, start-ups, collaboration and the circulation of knowledge. The depth of the ecosystem depends on the nature of the GCC's activities, procurement practices, autonomy and connections to local firms. 

For example, GCC’s performing like product engineering, R&D, advanced analytics or software-platform/product development, are likely to have greater spillovers than those performing highly standardised internal processing with limited technical autonomy or few local commercial relationships. Further, it can create demand for specialised services and contribute to the concentration of technical expertise that makes local firms more viable, supply a pipeline of employees who can be prospective entrepreneurs, etc. 

There is evidence from studies on the impact of multinational IT firms in India of collaboration with local firms, knowledge flows and acess to resources and networks, innovation spillovers, productivity spillovers, and increased export intensity of domestic firms. 

Given the objective of maximising expansion and linkages, there is a case for close monitoring of the nature of the GCC’s activities to guide policy making. Are the GCCs procuring technology and professional services, thereby creating creating domestic demand that goes beyond routine facilities, staffing, and support services? What is the level of sophistication of Indian suppliers, and are they are moving into higher value activities? The nature and number of startups established by employees of GCCs, and their trends? How many joint R&D, and university and startup collaborations, that promote local innovation networks? What are the trends with the productivity, exports, sophistication and product development capabilities of domestic firms that are associated with the GCCs?

The answers to these questions can be useful inputs to guiding policy making that advance the objectives on expansion and linkages. It is also an area where applied research partnerships with universities and think tanks can be helpful. 

In any case, the overall impact of the emergence of GCCs on the Indian economy is significantly positive. The table below is likely an underestimate since it does not fully account for many of the externalities mentioned above. 

The real problem is likely to come from the third question about how the trend on off-shoring of activities through GCCs will be perceived in their parent countries. Hit by the China shock and weakening economies, advanced countries like the US are trying to reshore manufacturing base and protectionist measures are pervasive. In the US, these measures have extended to a crack down on visas for foreigners in the IT industry. 

As the GCCs start to become a salient part of the revenues and employment of the MNCs, they will come to be viewed as a backdoor to send local jobs to countries like India. This is all the more likely at a time when good jobs are becoming scarce and youth unemployment is already high and rising in the US and elsewhere. 

In this backdrop, a trend of off-shoring of IT services, which includes higher value added activities, even if within the same company, is certain to invite scrutiny and backlash. It is only a matter of time. Countries like India may have a far shorter window than imagined to capitalise on the GCC opportunity and make themselves indispensable parts of the global IT services supply chain just as China did in manufacturing.

Monday, October 12, 2026

Observations on India’s external exposure in the age of capital wars

There are two important trends that are likely to impact cross-border capital flows for the foreseeable future. The first is the already high and increasing public debt burdens and persistently high budget deficits across the developed world. The second is the growing efforts to reshore manufacturing and reduce the dependency on China. The US is at the forefront of both these trends. 

Both are having large and growing spillovers across the global financial markets, especially adversely impacting developing countries. The first trend is raising sovereign bond yields, forcing interest rate hikes, and weakening currencies. The second trend is triggering a rising competition to attract manufacturing investment and retain domestic savings. 

I blogged here arguing that these trends will intensify the competition for capital, and most likely trigger capital wars. I had also discussed the possible implications for India. 

These trends come at a time when India is continuing the opening up of its financial markets and actively courting foreign investment. What do these trends mean for the RBI’s monetary policy, the rupee, India’s foreign direct investment, foreign portfolio investment, external commercial borrowings, and bilateral and multilateral aid flows? 

Finance 101 and historical experience tells us that rising US Treasury yields trigger capital flow reversals, puts pressure on the rupee, worsens the trade deficit, and reduces RBI’s monetary policy autonomy. And there is a self-reinforcing spiral associated with this cycle. On top come the squeeze on FDI inflows arising from the efforts to retain domestic savings and reshore manufacturing. 

Globally, the rising stock and flows of public debt portend a long period of higher interest rates, also because of the inflationary pressures that are already on play and will remain so for the foreseeable future. 

In this backdrop, this post will use data analysed with Claude to examine the consequences of India’s external exposure. 

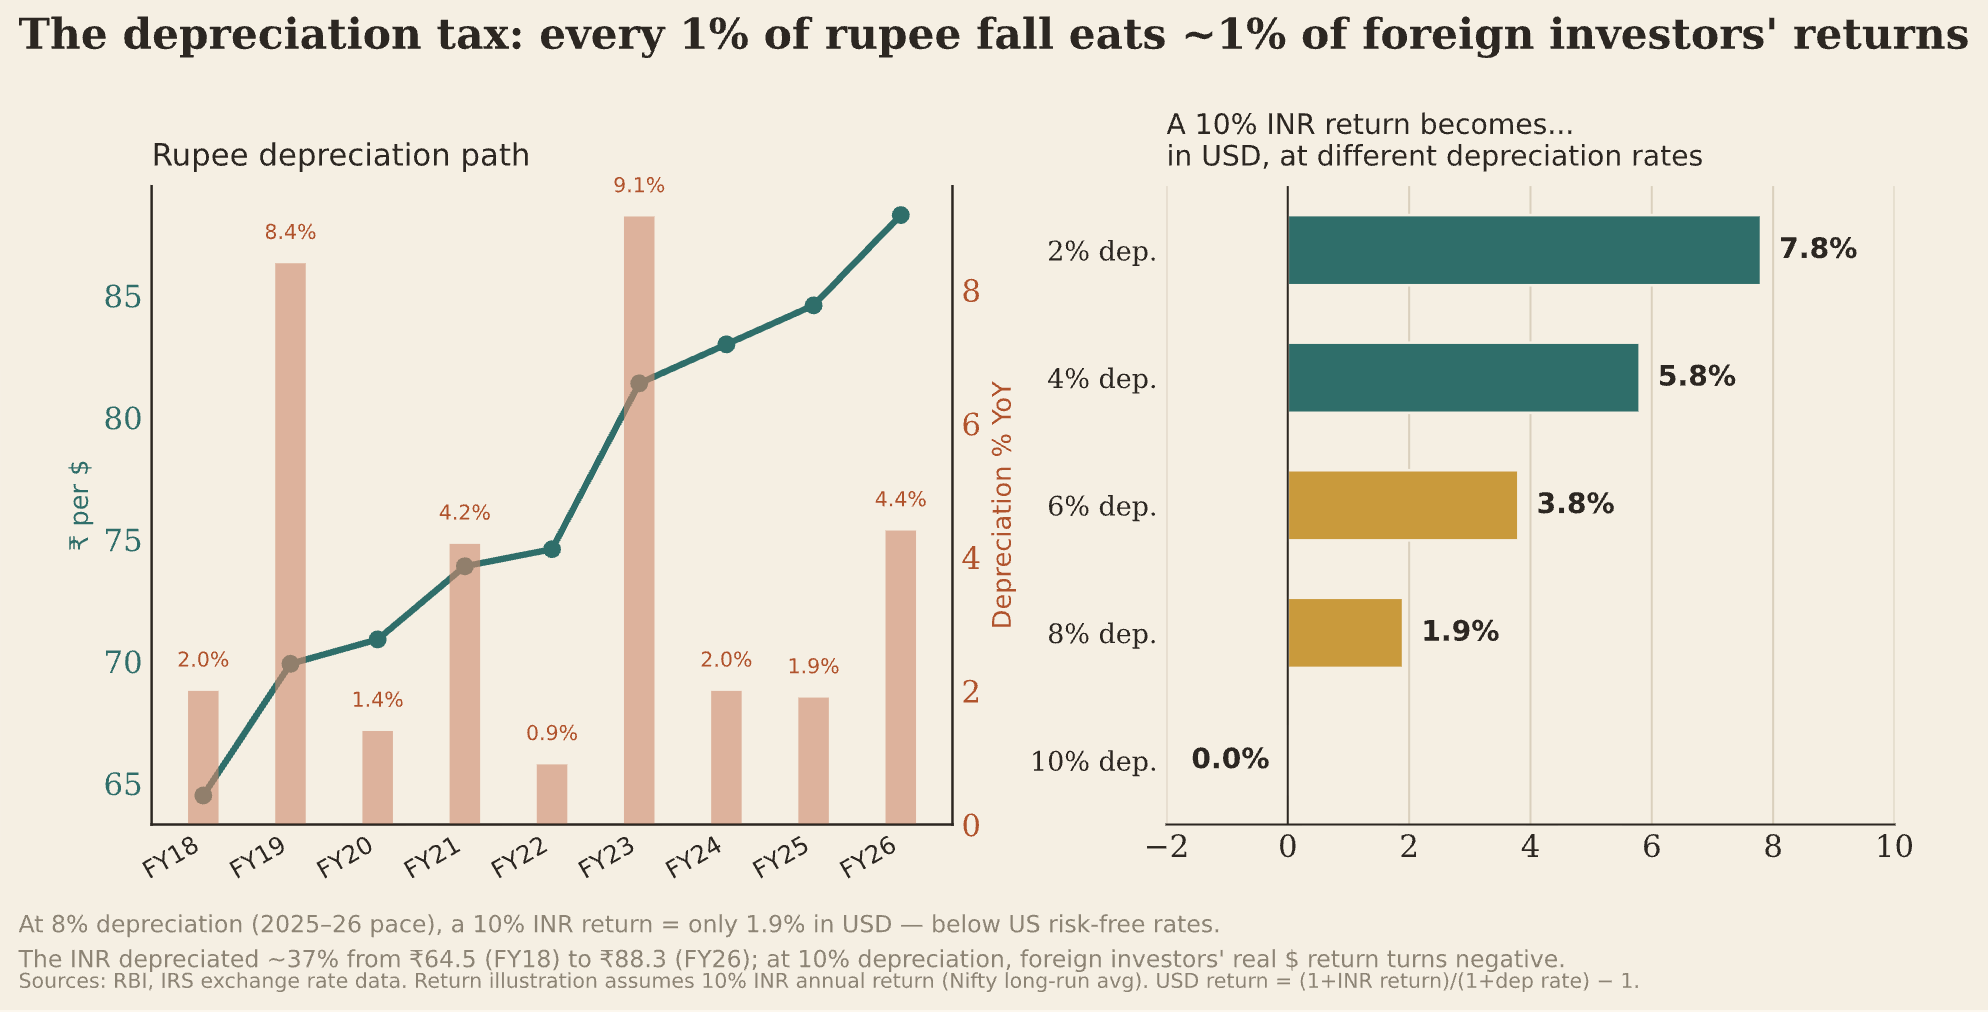
Arguably the biggest deterrent to foreign capital inflows into India today is the weakening trend of the rupee. A weaker rupee raises the hurdle rate that any investor, FDI or FPI, would demand for investing in India. The rupee depreciation, therefore, functions as a direct tax on foreign investors' dollar-denominated returns. Every 1% of depreciation eats roughly 1% of the foreign investor's return. 

As an illustration, the rupee has weakened from ₹74/$ in 2021 to ₹96/$ in 2026, a cumulative decline of 30% over five years. This means that any foreign investors who remained invested in India should have earned an additional 30% returns to offset the depreciating currency. 

So what drives rupee depreciation? 

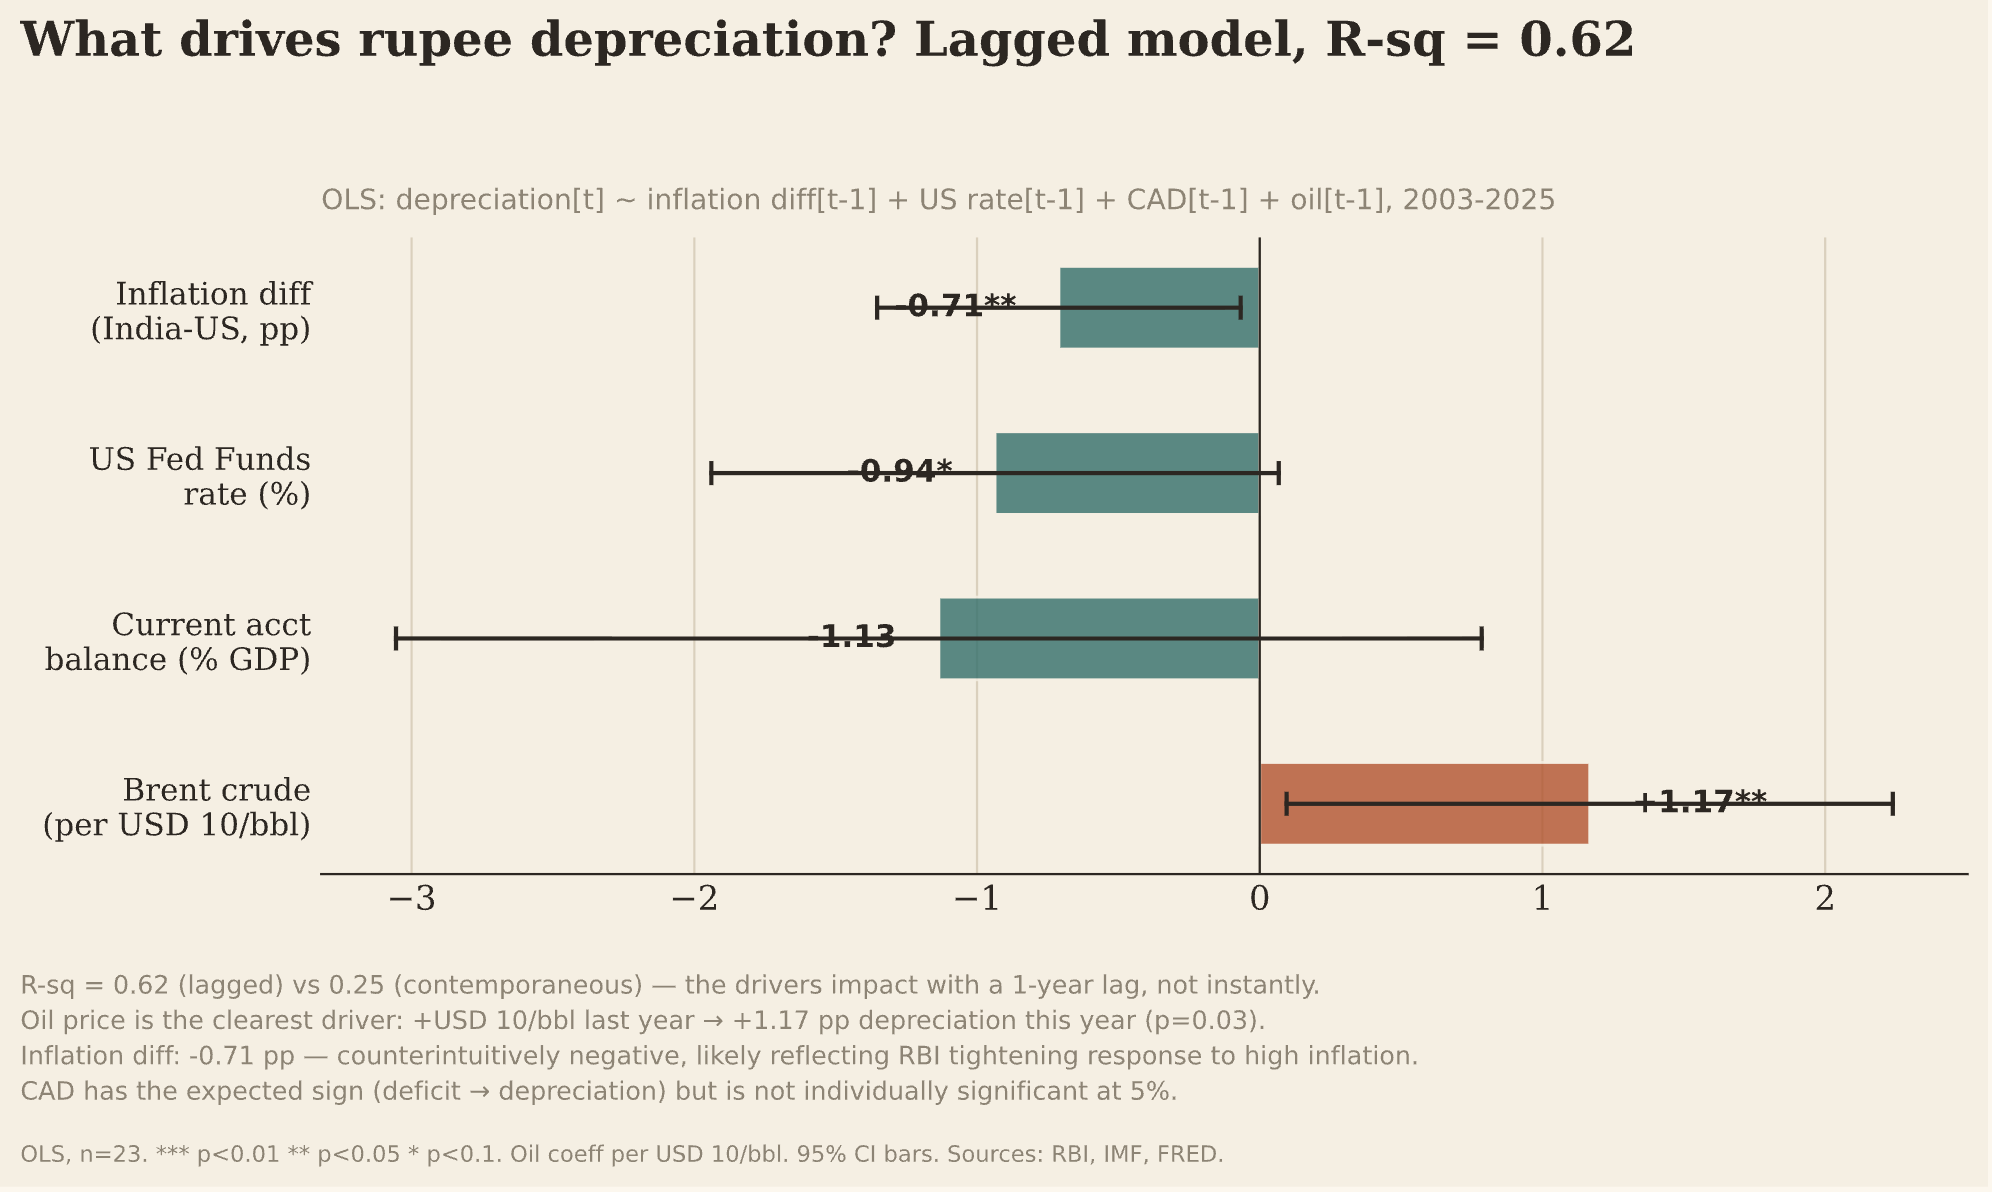
The obvious candidates are inflation differential, US Federal Funds rate, current account deficit, and oil prices. While a contemporaneous model OLS regression of annual rupee depreciation on these four structural drivers barely fits, a one year lagged model fits well (R-sq = 0.62, F-stat p = 0.001). The rupee depreciation correlates primarily with oil prices (the import-bill channel), the inflation differential (mediated by the RBI’s response), and the current-account balance, but with a one-year lag. 

Going by this, given the prevailing global market conditions and with no signs of an end to the Iran war, the rupee is primed for further declines in the year ahead.

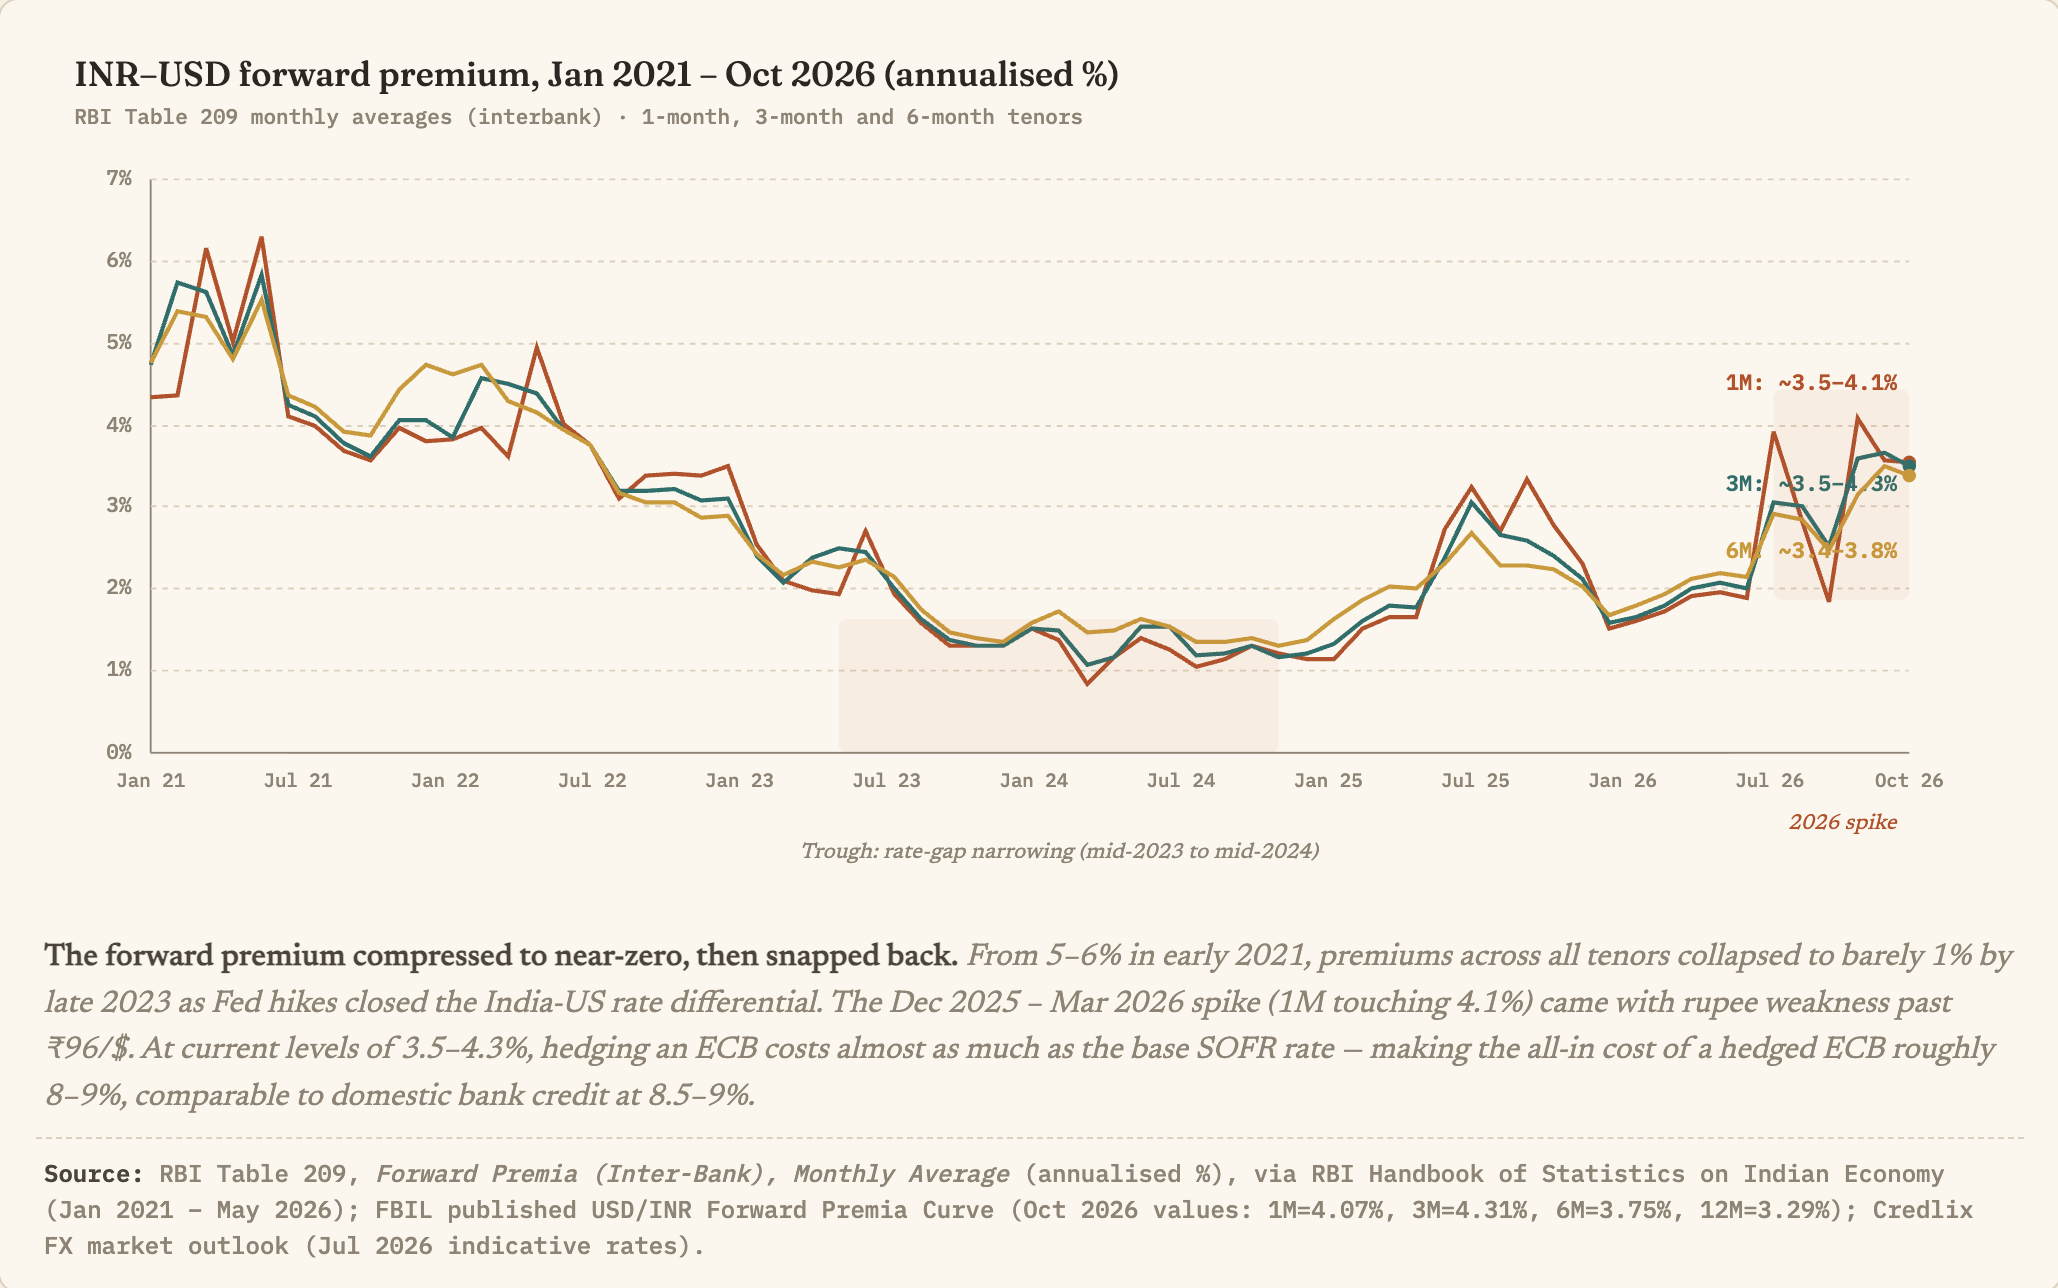
The prospects of further rupee weakening is reflected in the USD/INR forward premium, which compressed dramatically from ~5% in early 2021 to barely 1% by mid-2024 as Fed hikes narrowed the India-US rate gap, but has since been rising and is about 3.5-4.1% in October 2026. For ECB borrowers, the forward premium is the hedging cost.

What does all this mean for RBI’s monetary policy choices? 

The Uncovered Interest Parity (UIP), which is an unobserved theoretical construct, states that the difference in interest rates between two countries should equal the expected change in exchange rates between their currencies, so that there is no arbitrage opportunity. The reality though is complicated by risk premiums and transaction frictions. 

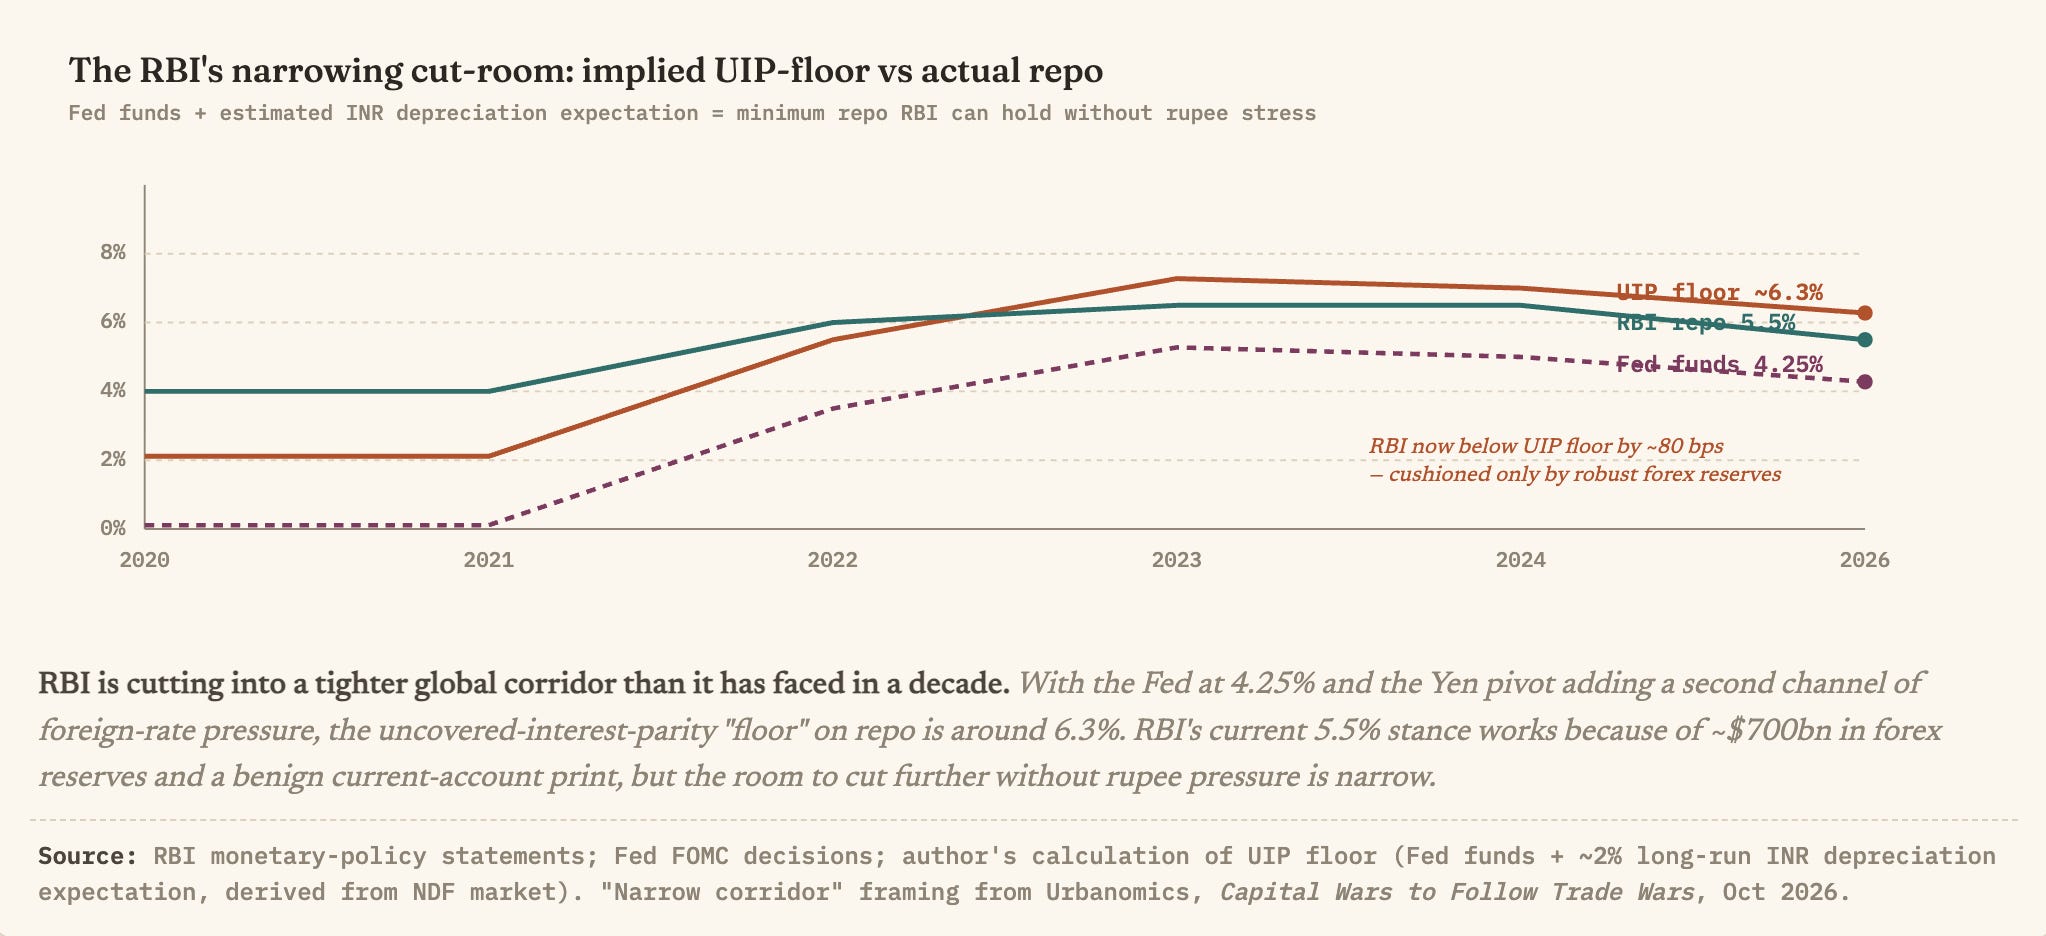
The higher-for-longer global interest rates narrow the monetary policy space to cut or even maintain neutral stance in India without triggering outflows and rupee depreciation. In an open-economy framework where India’s capital account is substantially open on the debt side, the UIP floor on the repo rate rises mechanically. And, as the graphic below shows, it has been rising since 2021. With the Fed at 4.25% and the BoJ no longer anchored at zero, the UIP floor on the repo rate is around 6.3%.

This has created a situation where the UIP floor today is above the RBI’s repo rate. This puts pressure on the rupee to depreciate, something backstopped only the RBI’s large reserves. In fact, the RBI’s 5.5% repo rate works today only because of the forex-reserve buffer. 

However, now with US looking at the beginning of a rate hike cycle, the RBI’s room for monetary policy autonomy is considerably squeezed. It has little choice but to respond with raising rates. 

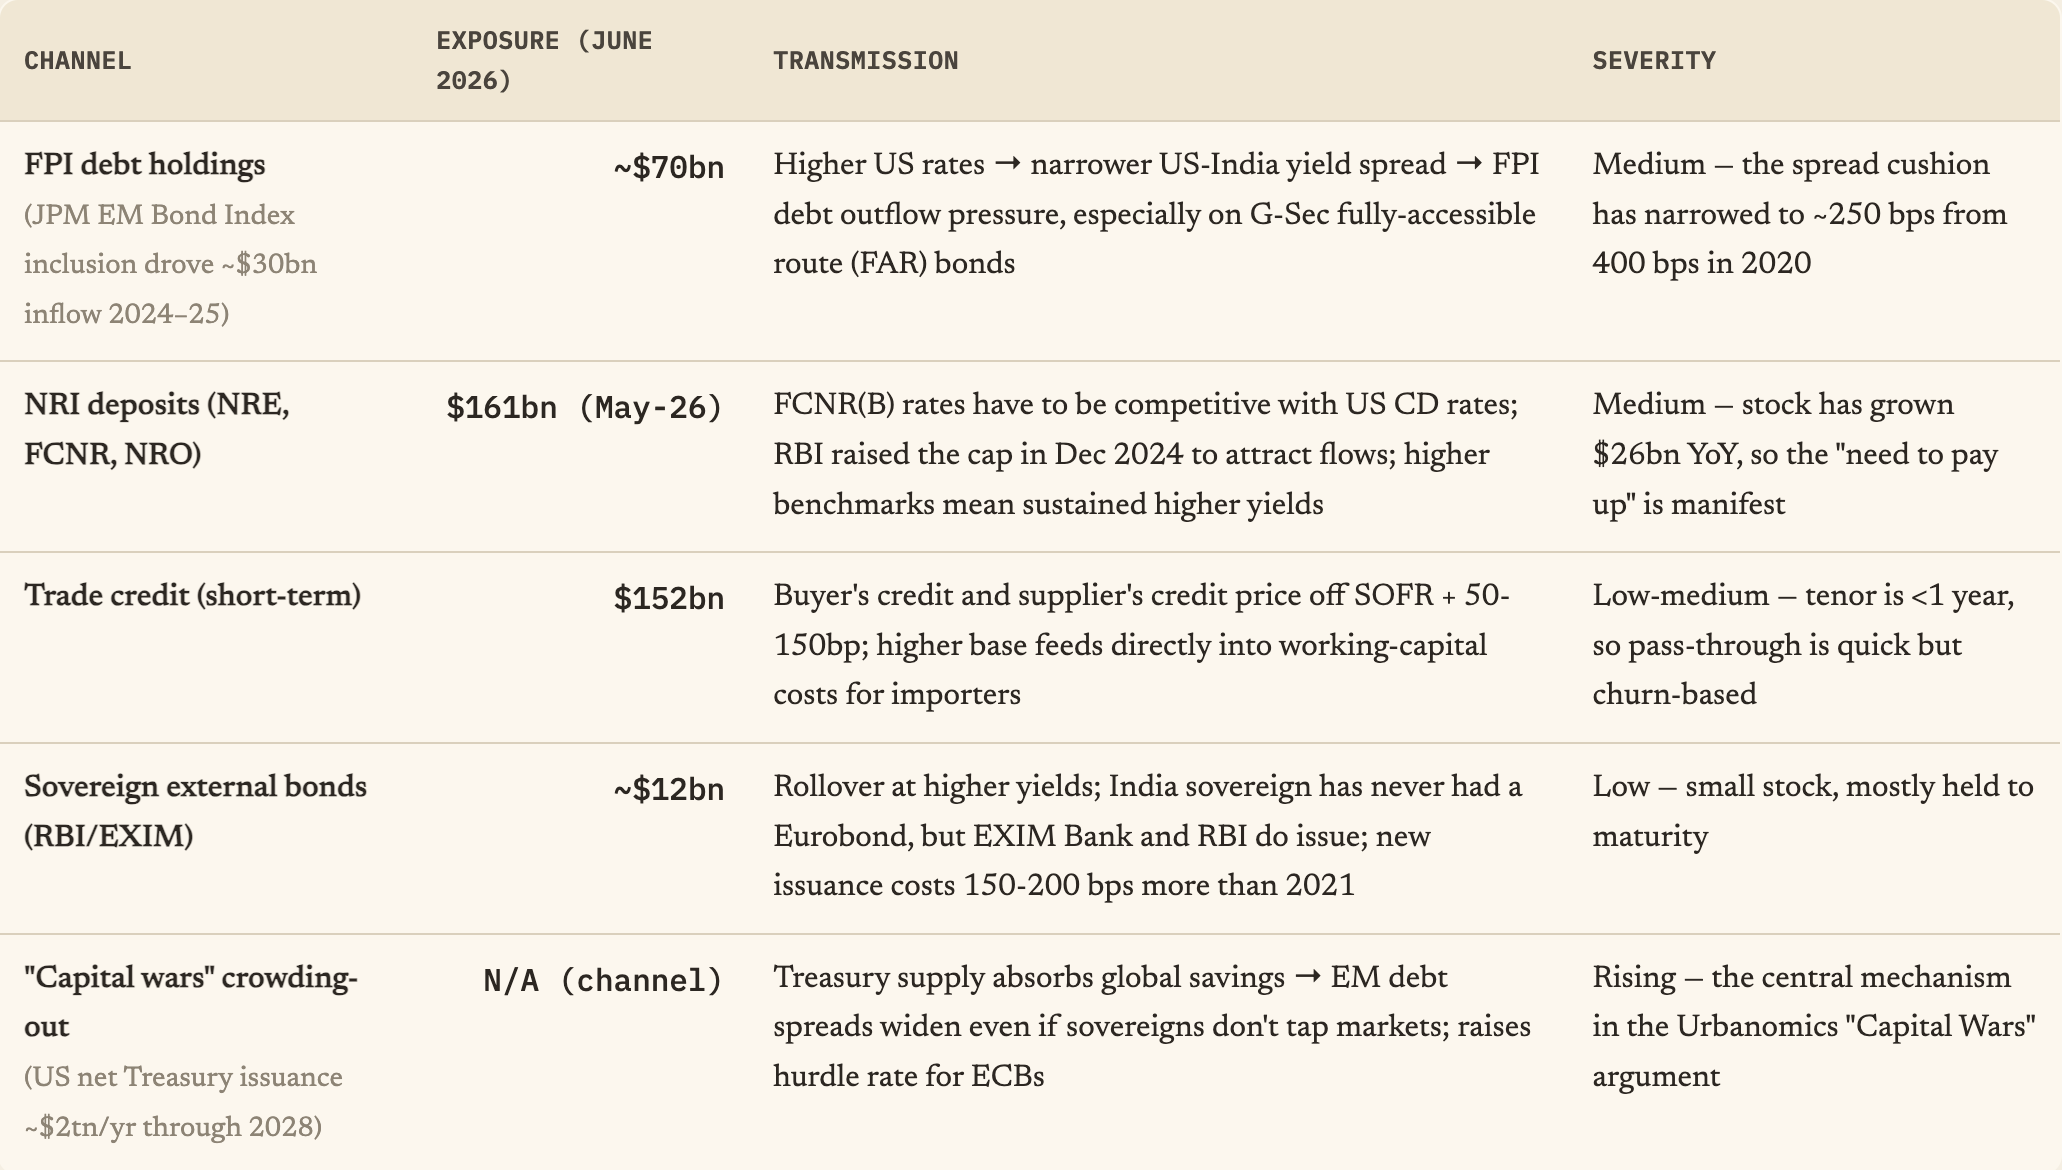
The capital wars channel compounds the problem. A big risk is the US net Treasury issuance estimate of $2tn/yr through 2028. It will be a major sink for global savings, and will raise the hurdle rate for all EM sovereign and corporate issuance.

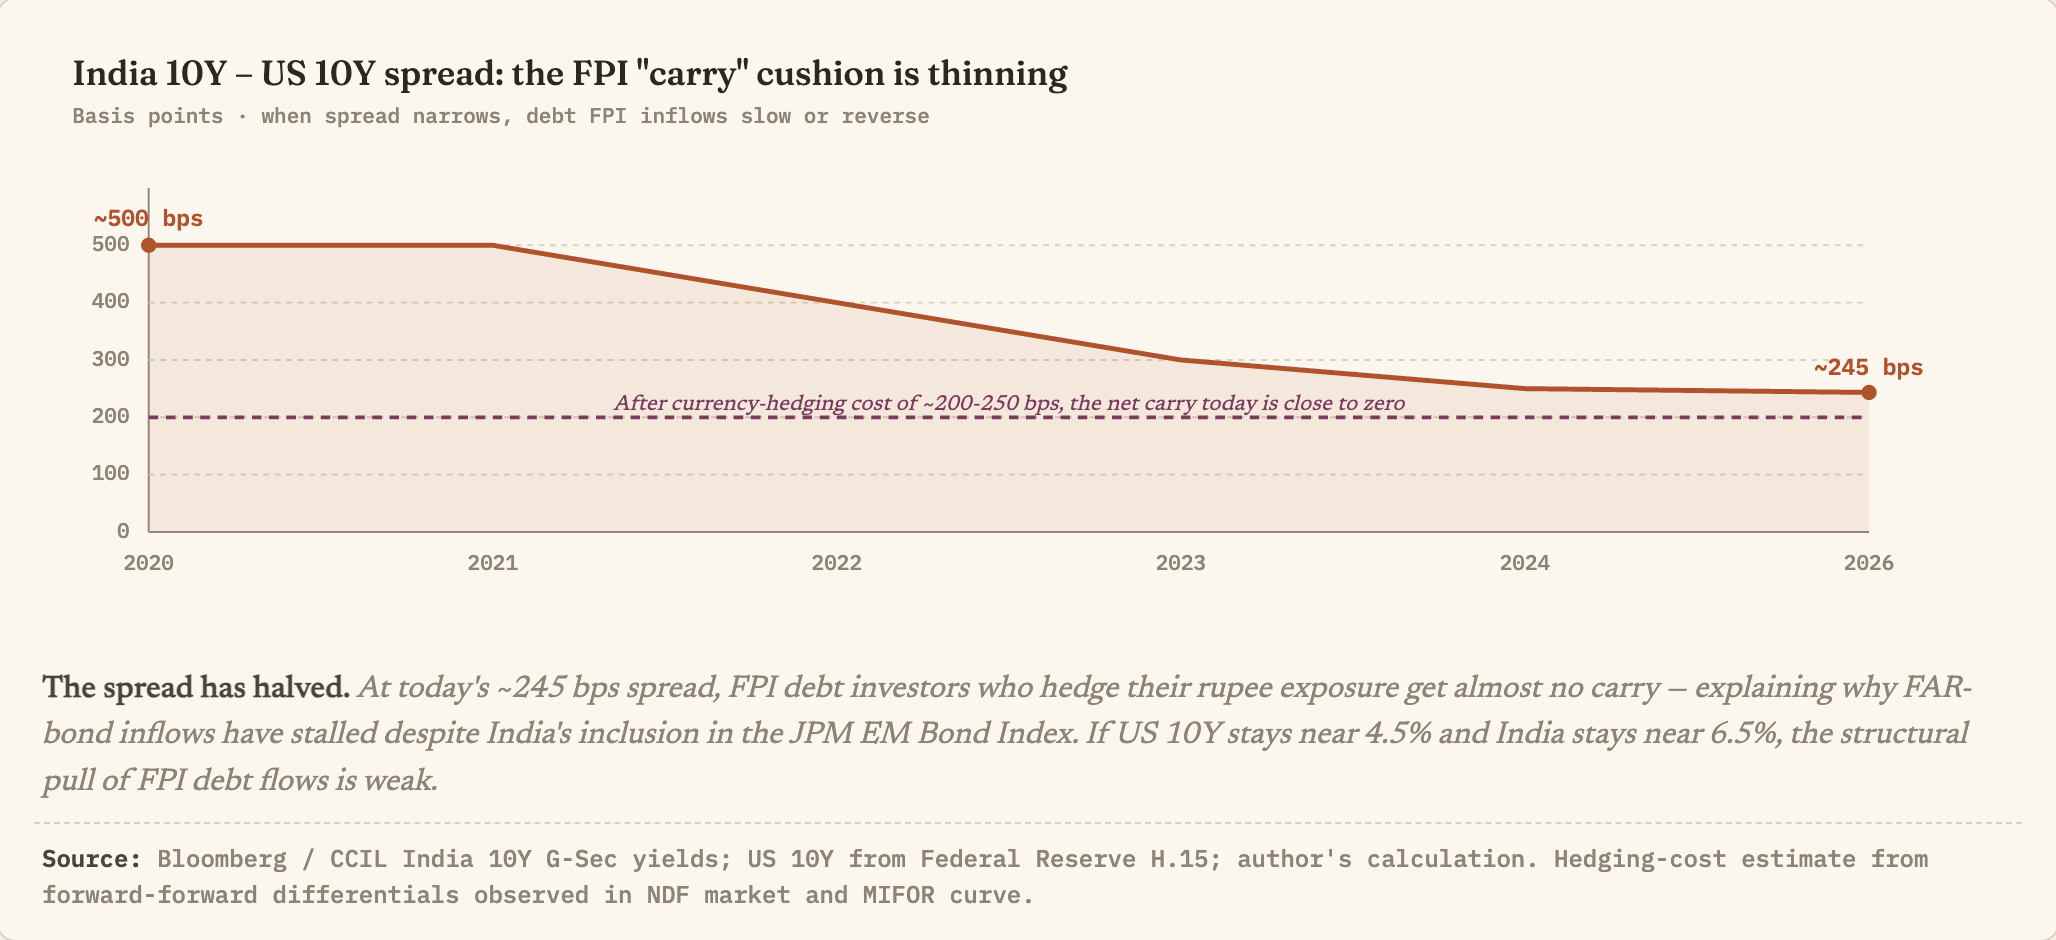
An associated signature of this squeeze is the narrowing of the spread between Indian and US 10 year sovereign bonds. It has more than halved since the beginning of 2021. Coupled with the currency hedging cost, the spread disappears, thereby eliminating any incentive among those pursuing carry trade opportunities. 

What does this imply for India’s external debt exposures? 

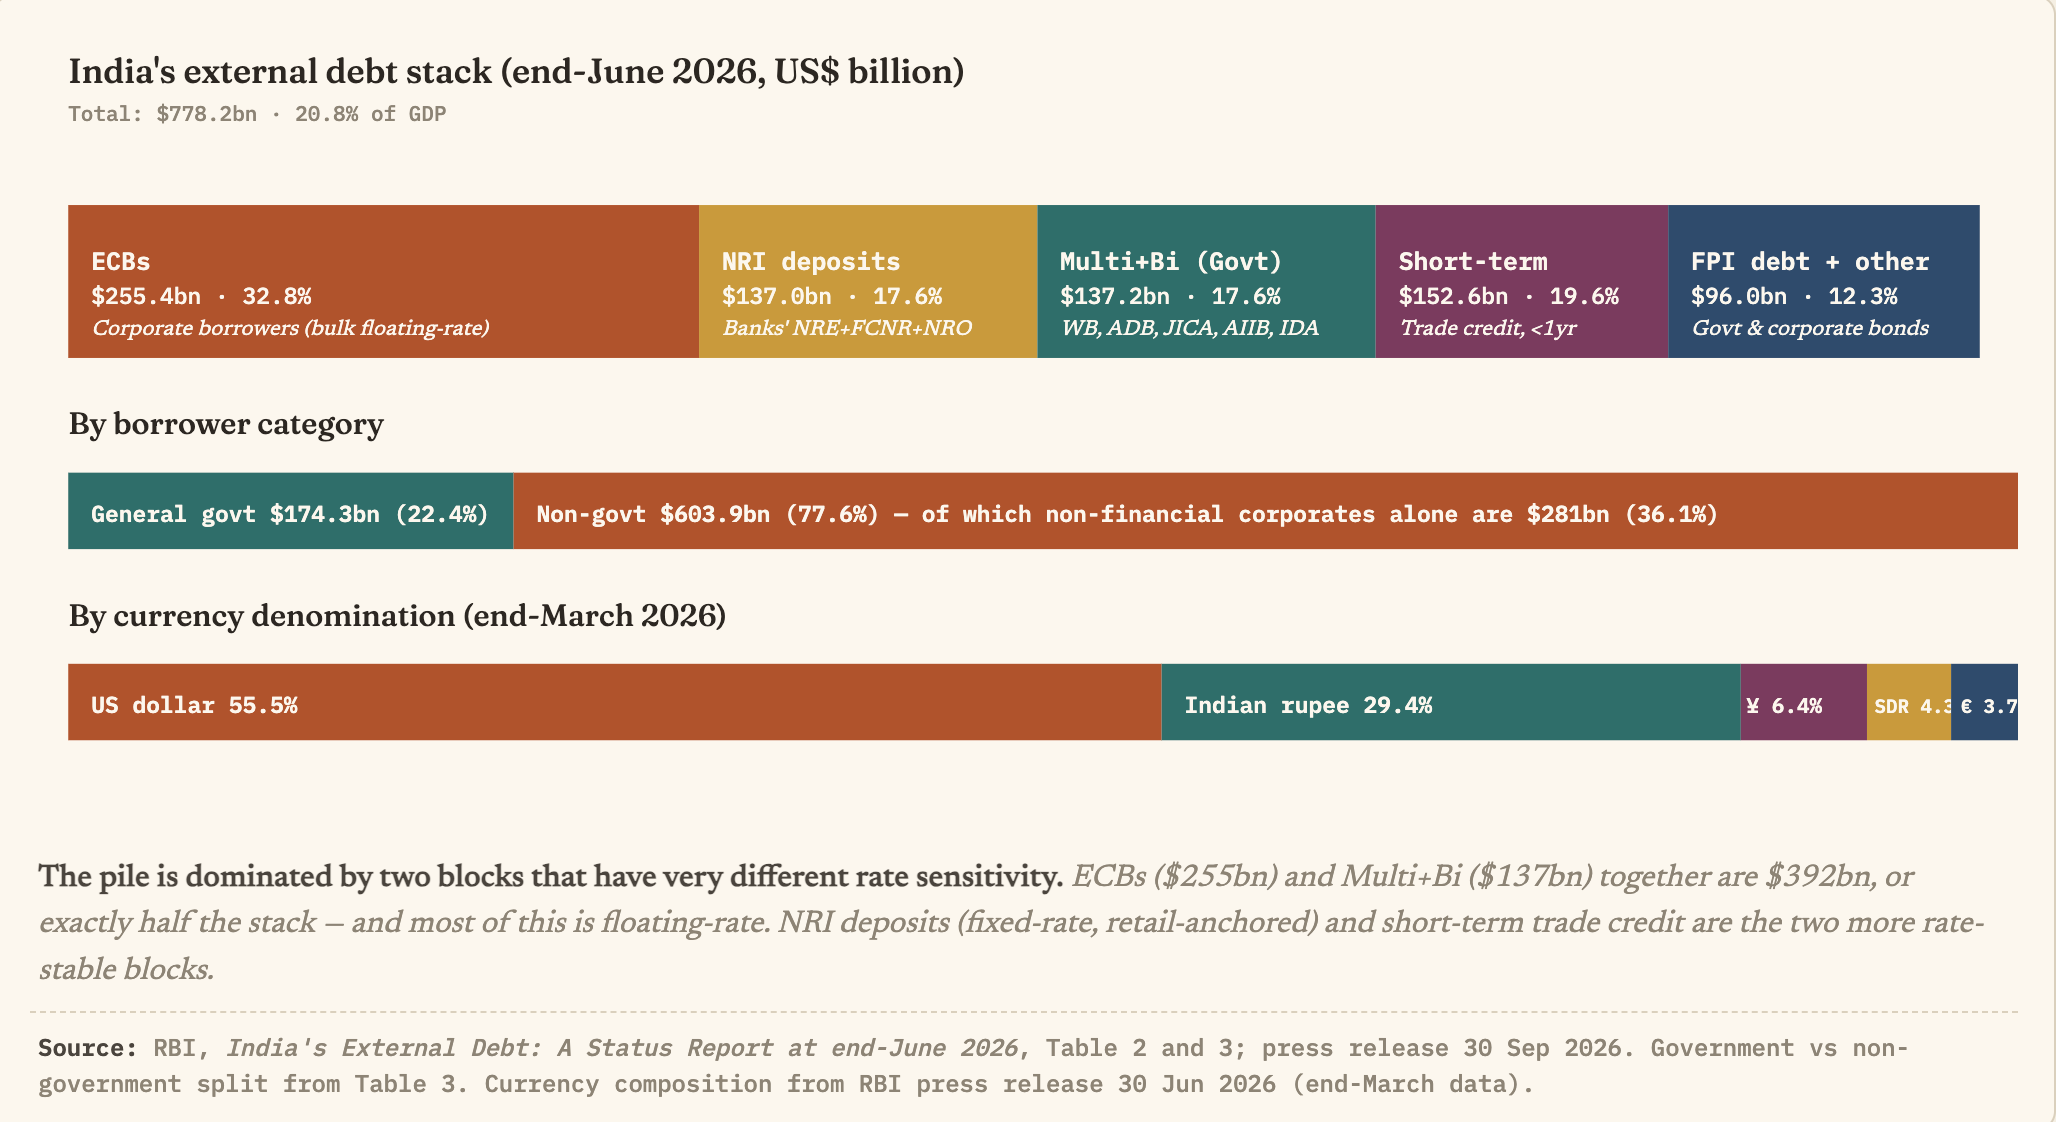
In the aggregate, India’s external debt looks moderate at 20.8% of GDP. But there are two dimensions that need monitoring. The first is that the historical access to cheap, long-tenor, concessional fixed rate debt, primarily from bilateral and multilateral institutions, has now given way to floating rate loans benchmarked to SOFR/TONA/TORF (the transition from LIBOR happened by 2023). Of the $174.3 bn sovereign debt exposure (as of June 2026), 58% are now floating rate loans. More on this latter.

The second is the composition of external debt is now shifting away from the government to the private sector. This composition deserves closer monitoring given the rising share of External Commercial Borrowings (ECBs). 

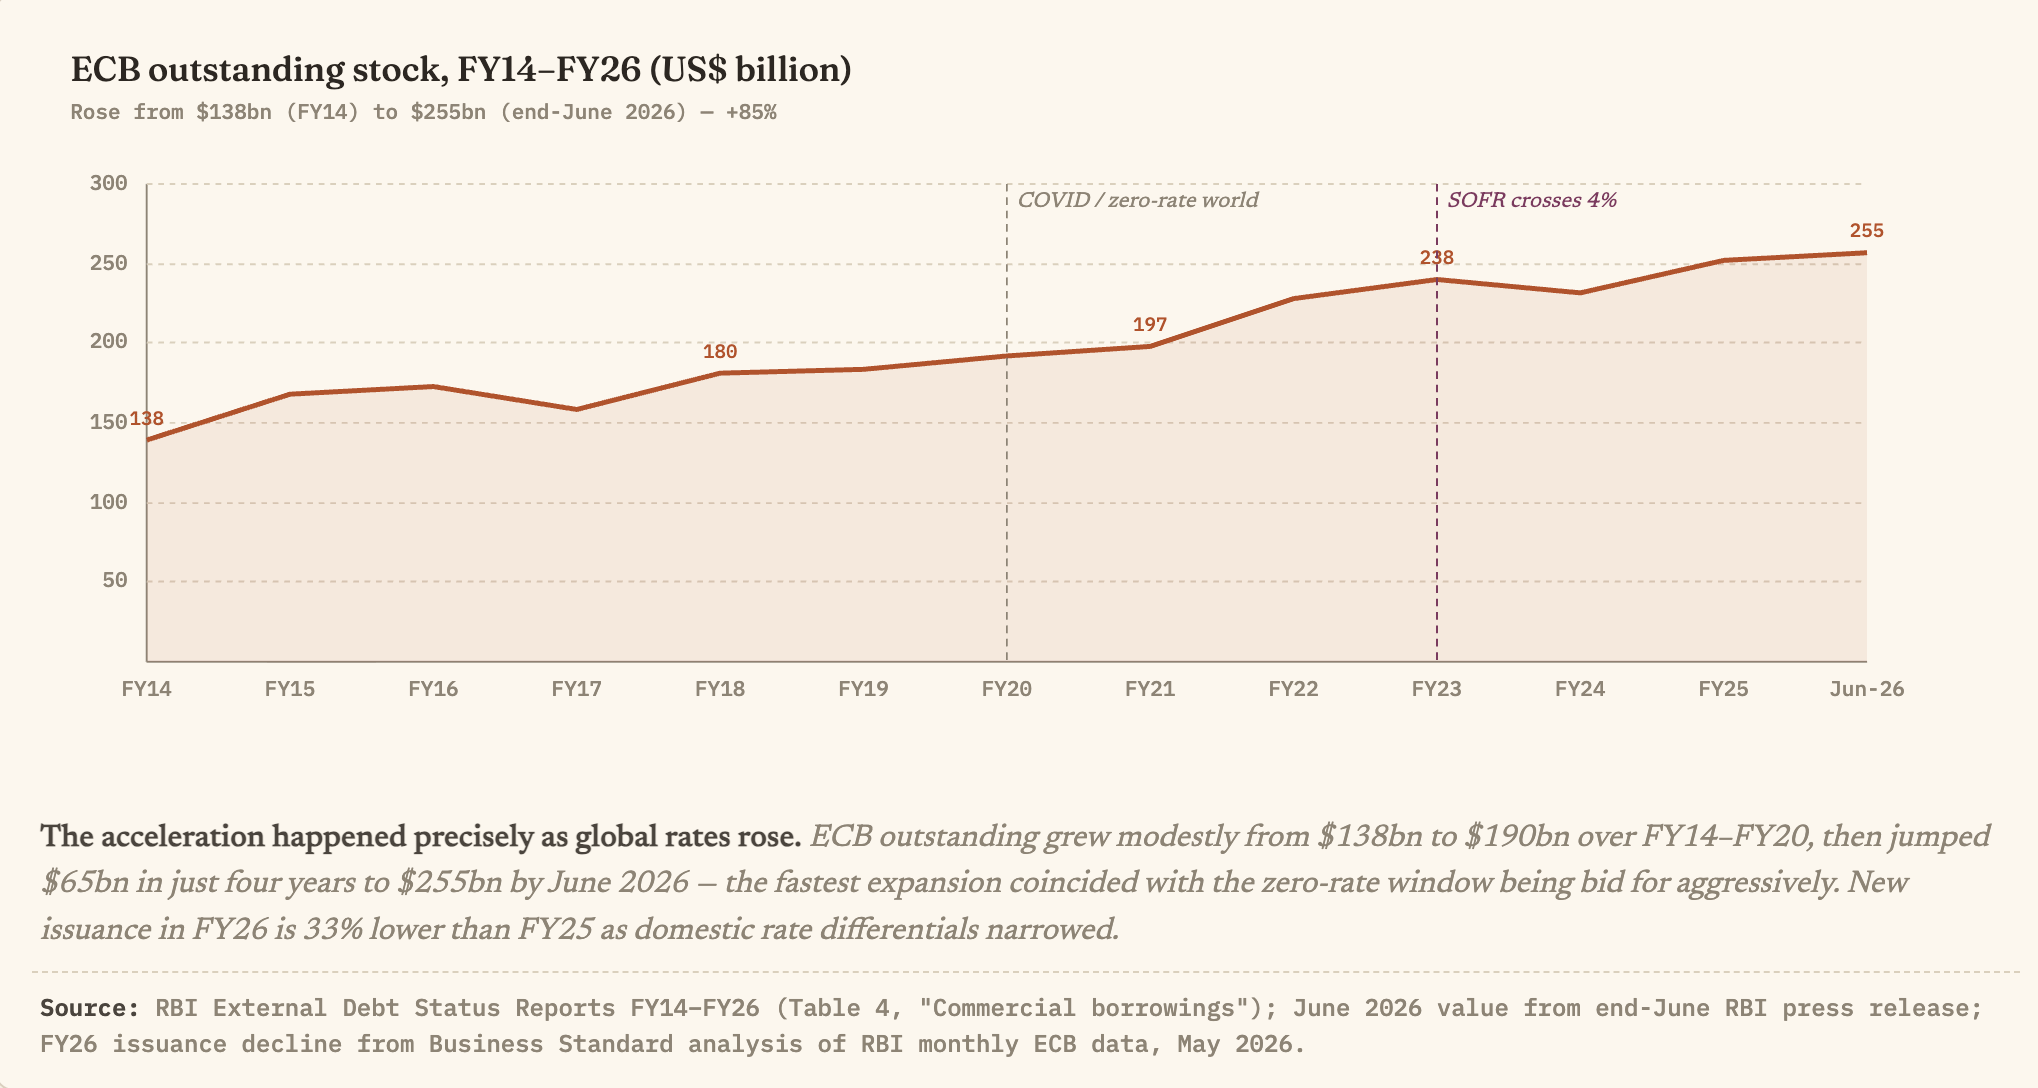
At 32.8% of India’s external debt, ECBs are now bigger than the combined value of multilateral and bilateral loans and NRI deposits. The downward pressure on the rupee is a major risk for ECBs. This risk is amplified by the rising rates globally since most ECBs are floating-rate (SOFR-linked).

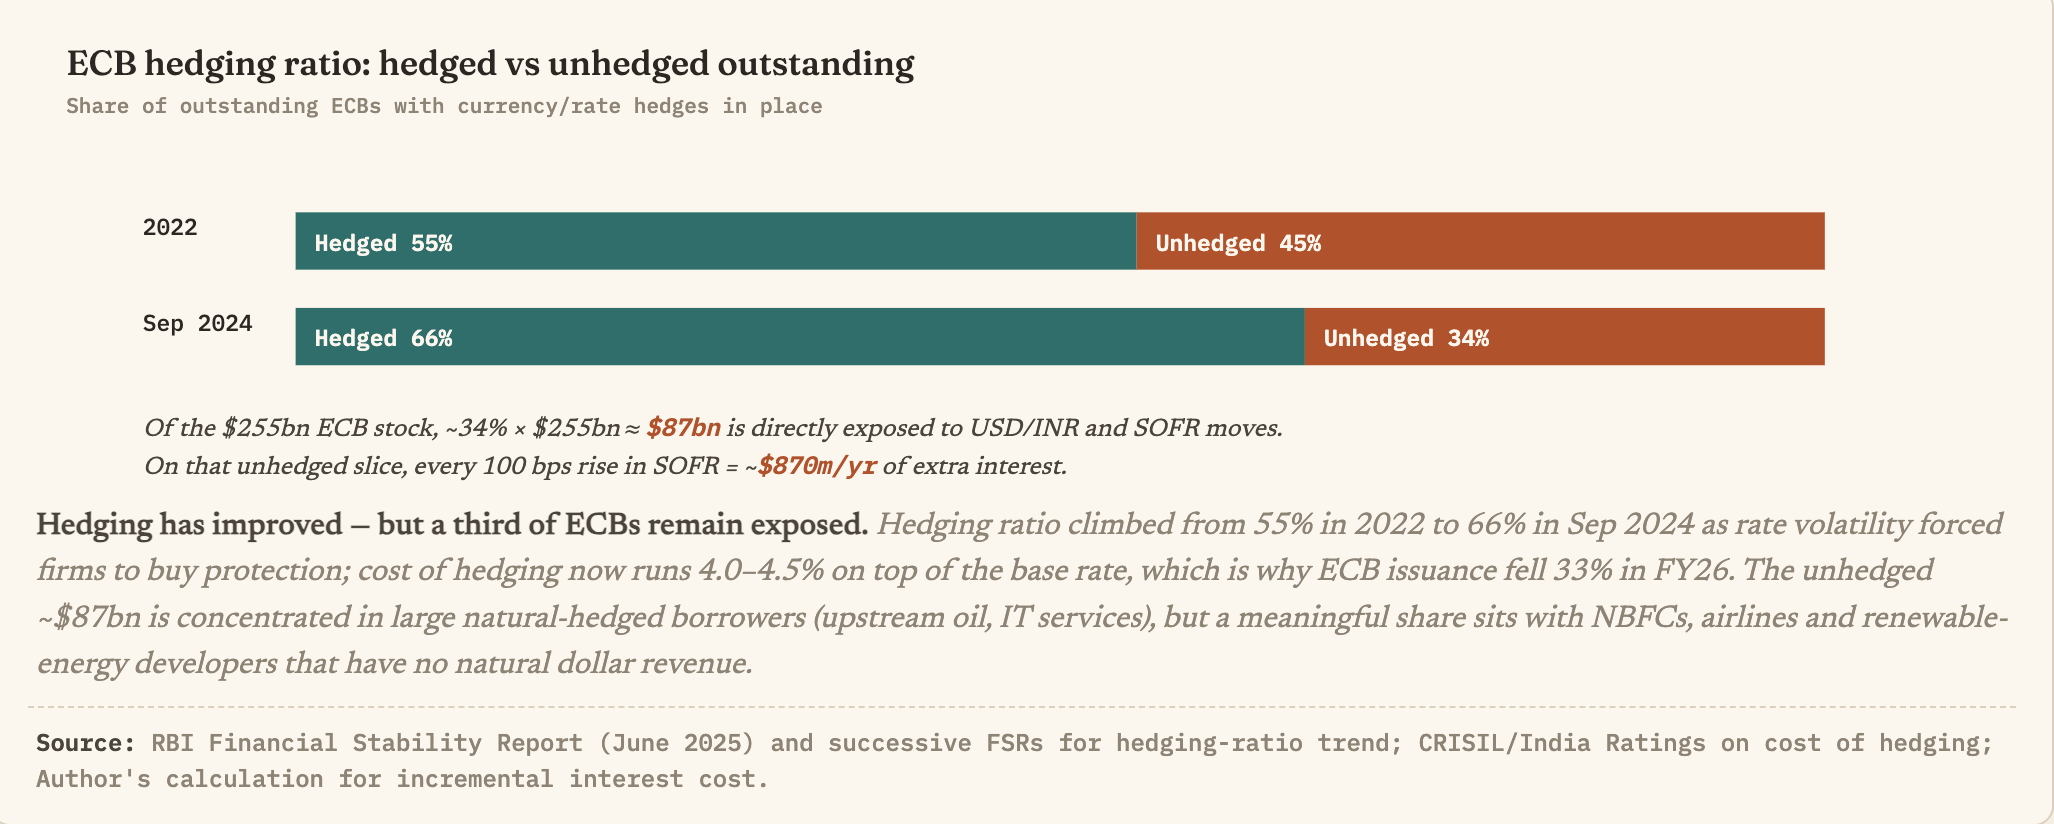
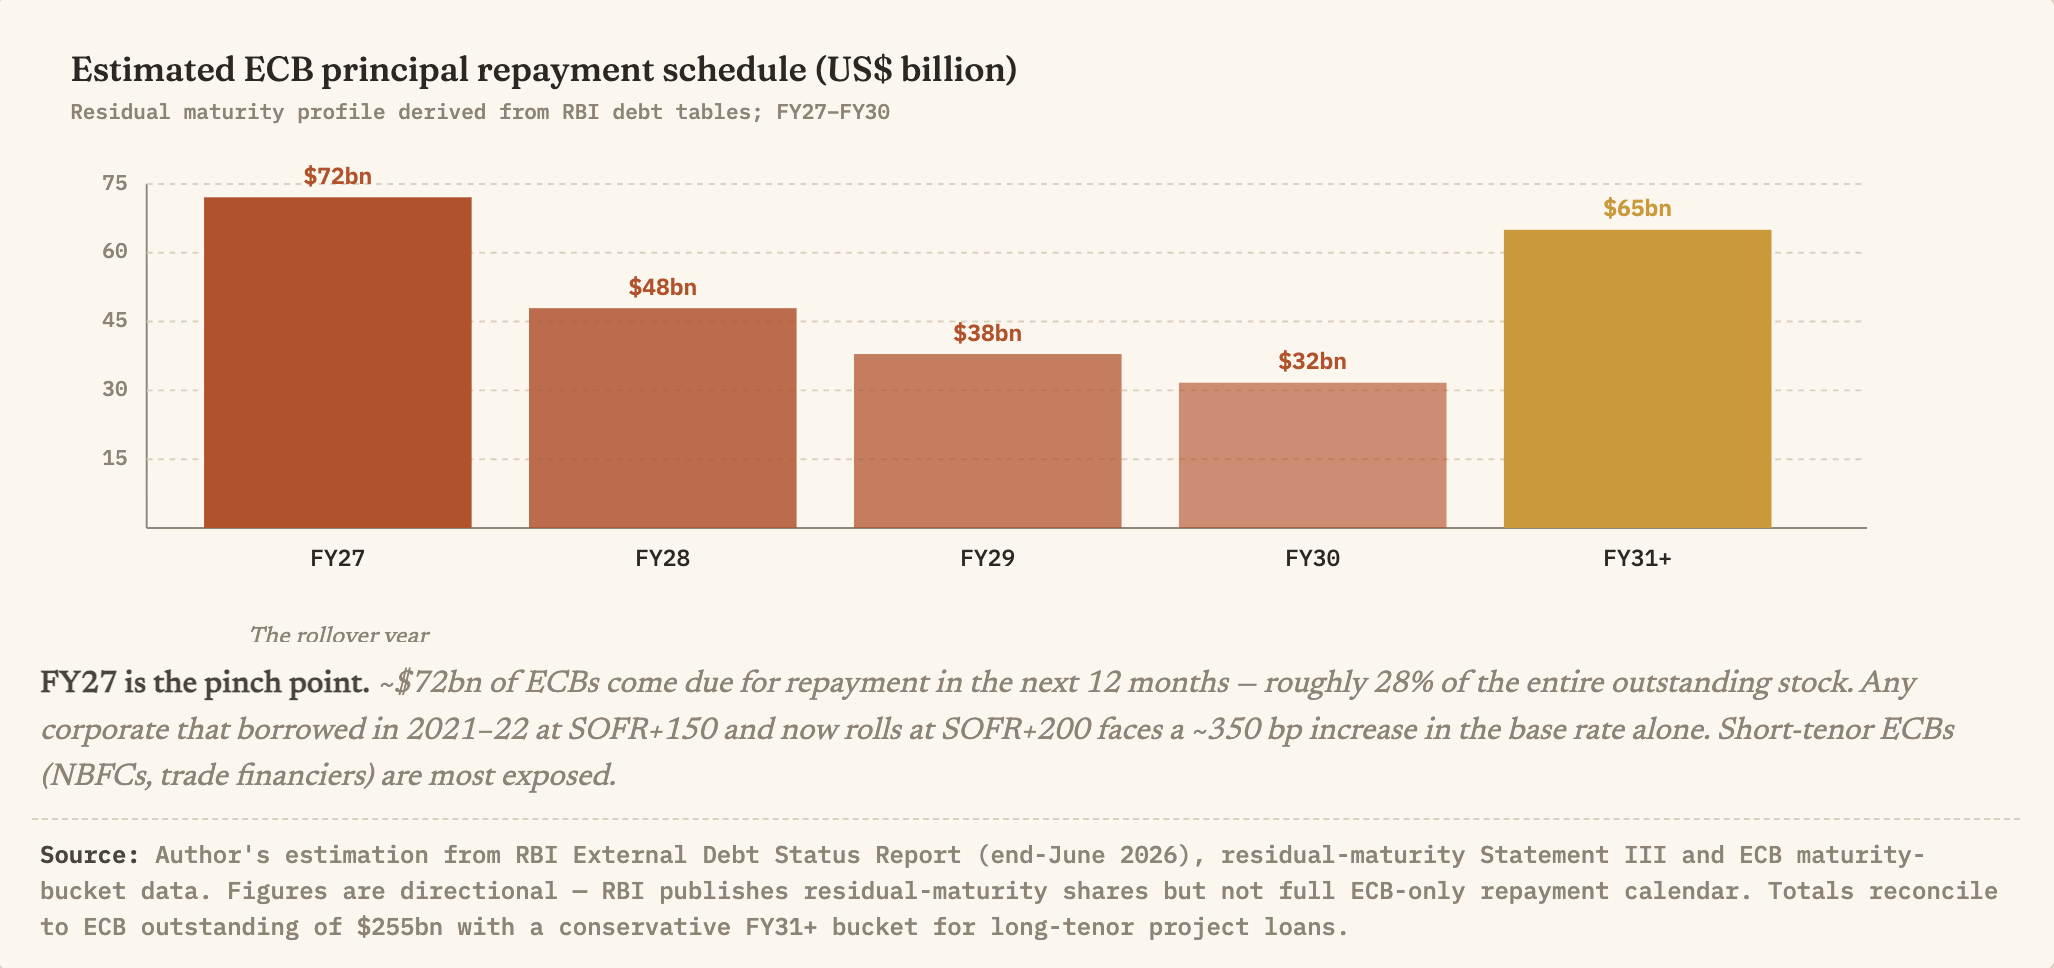
Of the $255bn outstanding ECBs, only 66% are hedged, and the remaining are direct, uninsured pass-through. The 34% unhedged slice ($87bn) is where the first stress will surface. It will fall most likely at NBFCs, airlines and renewable-energy developers that borrowed at low SOFR in 2021–22 and now must roll.

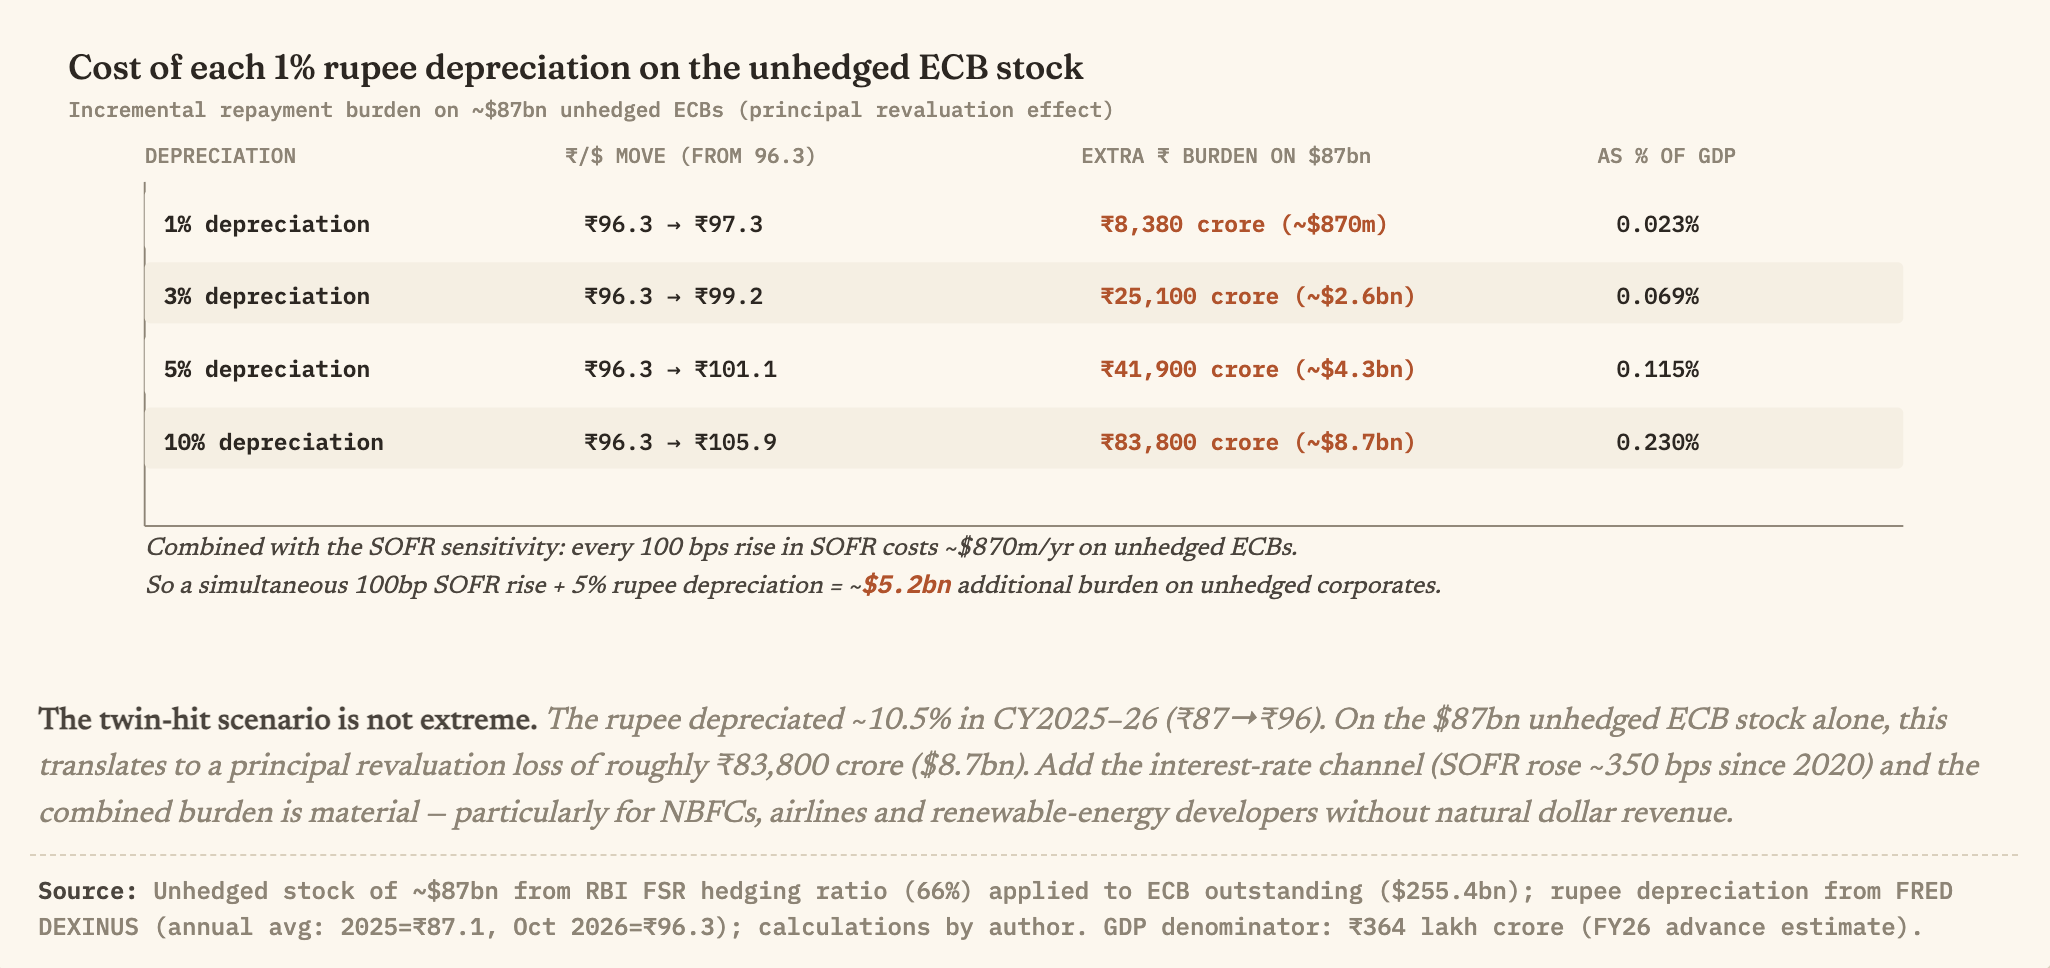
The impact of rupee depreciation on the $87 bn of unhedged ECBs is significant. 

These risks are also serious also because of the shorter repayment schedules of the ECBs. About $120 bn are due for repayment till March 2028. 

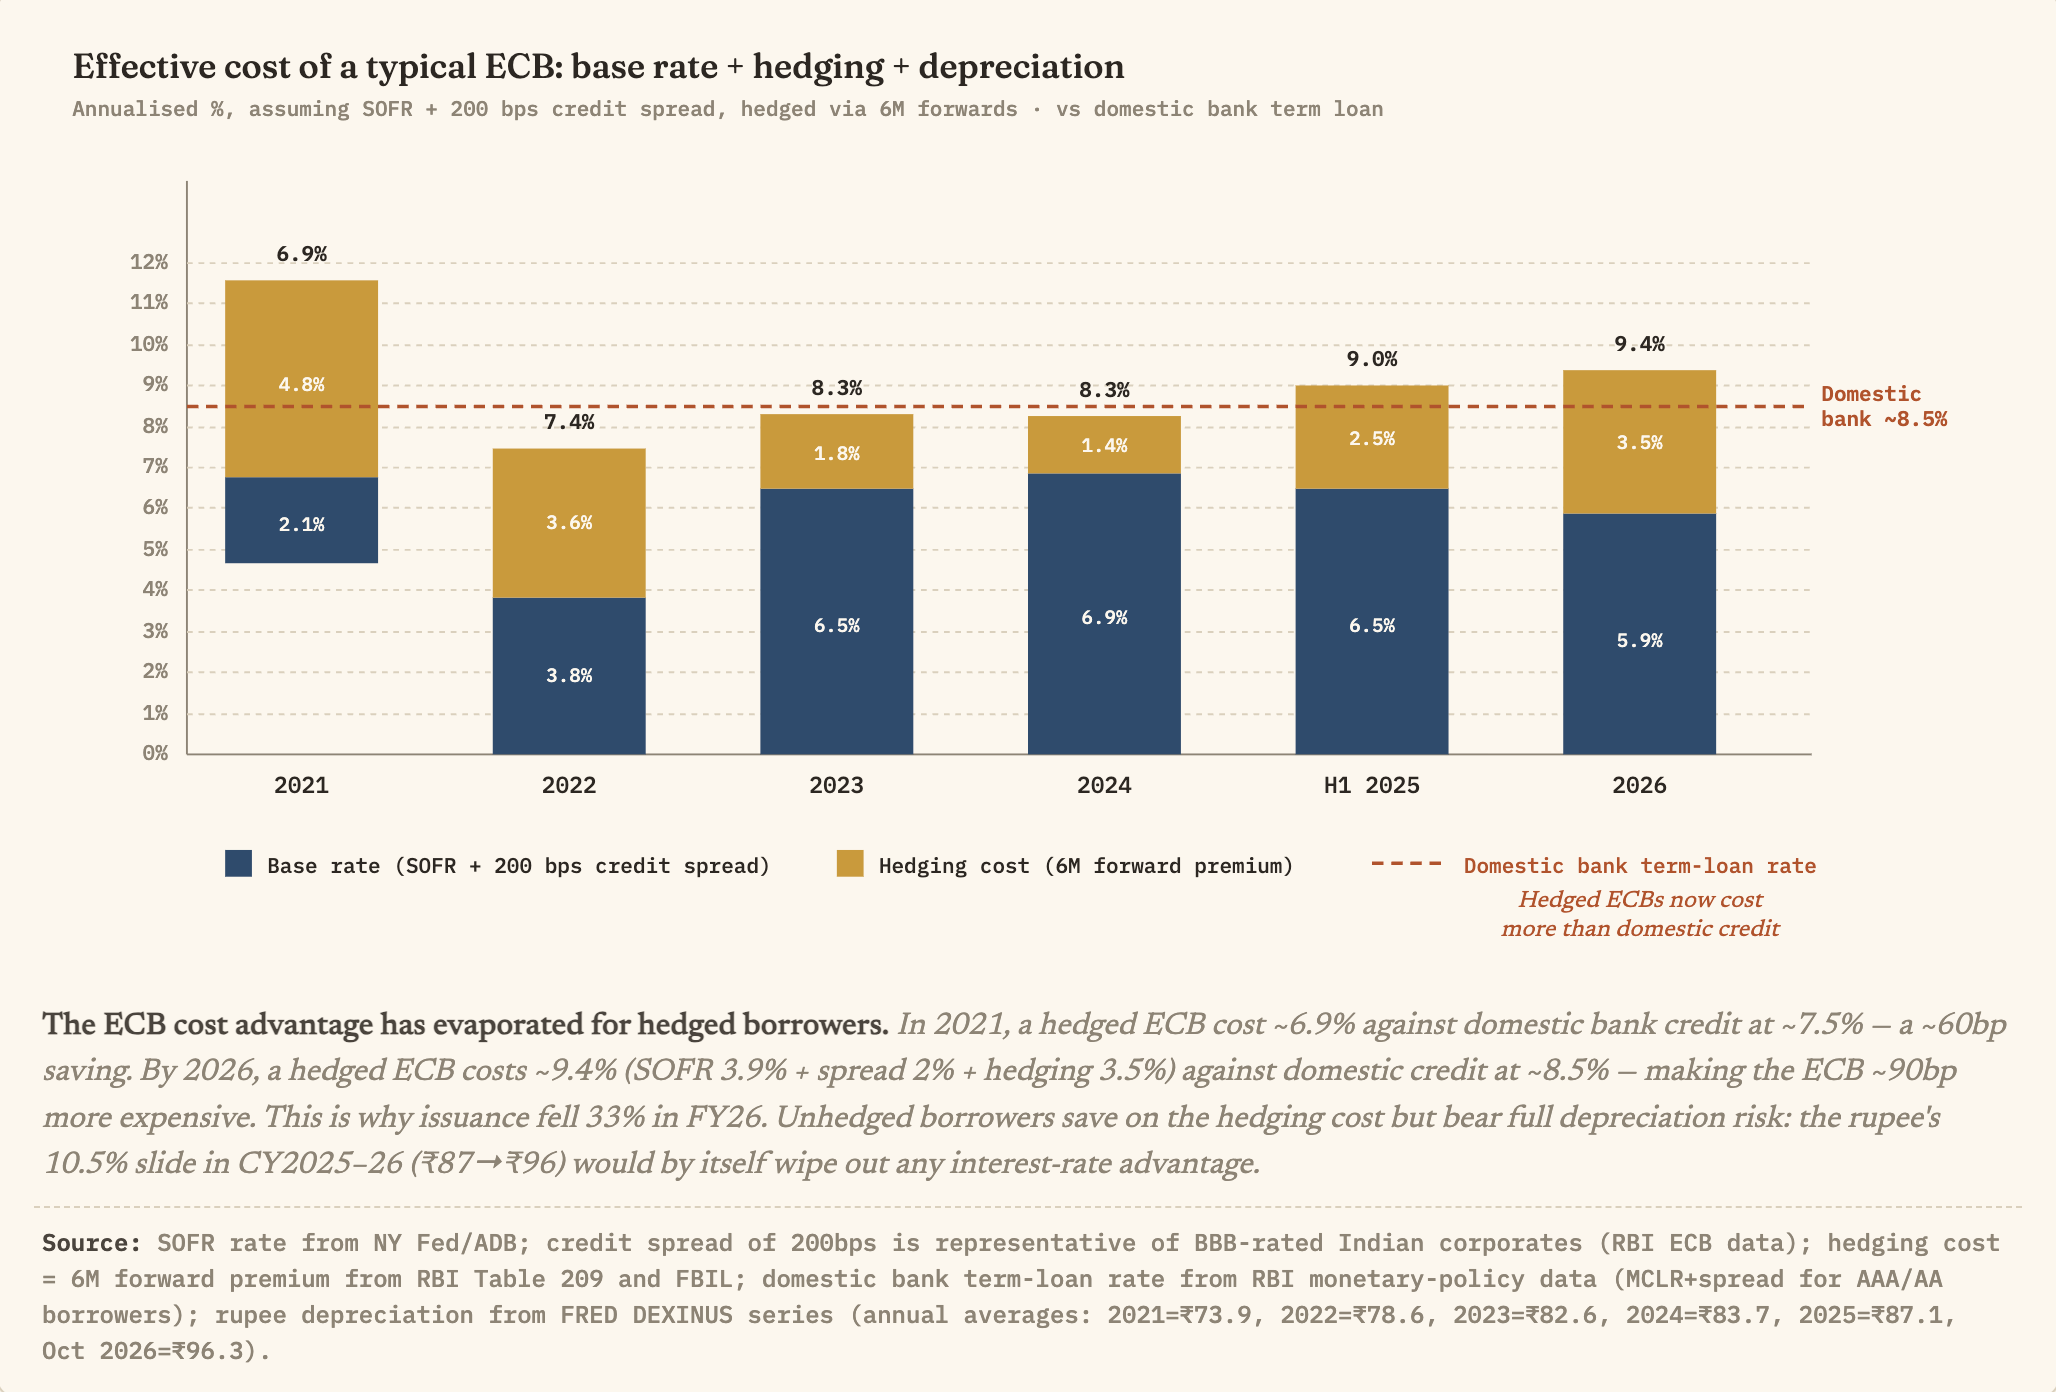
Another cause for concern may be the nature of ECB borrowers. An Indian corporate borrowing via ECB faces three cost layers - the base rate, currency depreciation, and the cost of hedging. The chart below shows that at least since 2023, ECBs should have been losing their attractiveness, especially for the higher rated borrowers. Nevertheless the ECBs have continued to rise, though issuance has fallen 33% in FY26. This raises a concern that some proportion of the ECB borrowers may be coming from the riskier market segments. 

The rising ECB exposure necessitates greater RBI oversight and microprudential regulation. For example, it should mandate higher ECB hedging ratios for sectors where revenues are in rupees (airlines, renewables, NBFCs). It should keep a close watch on higher cost commercial borrowings by by systemically important corporates.

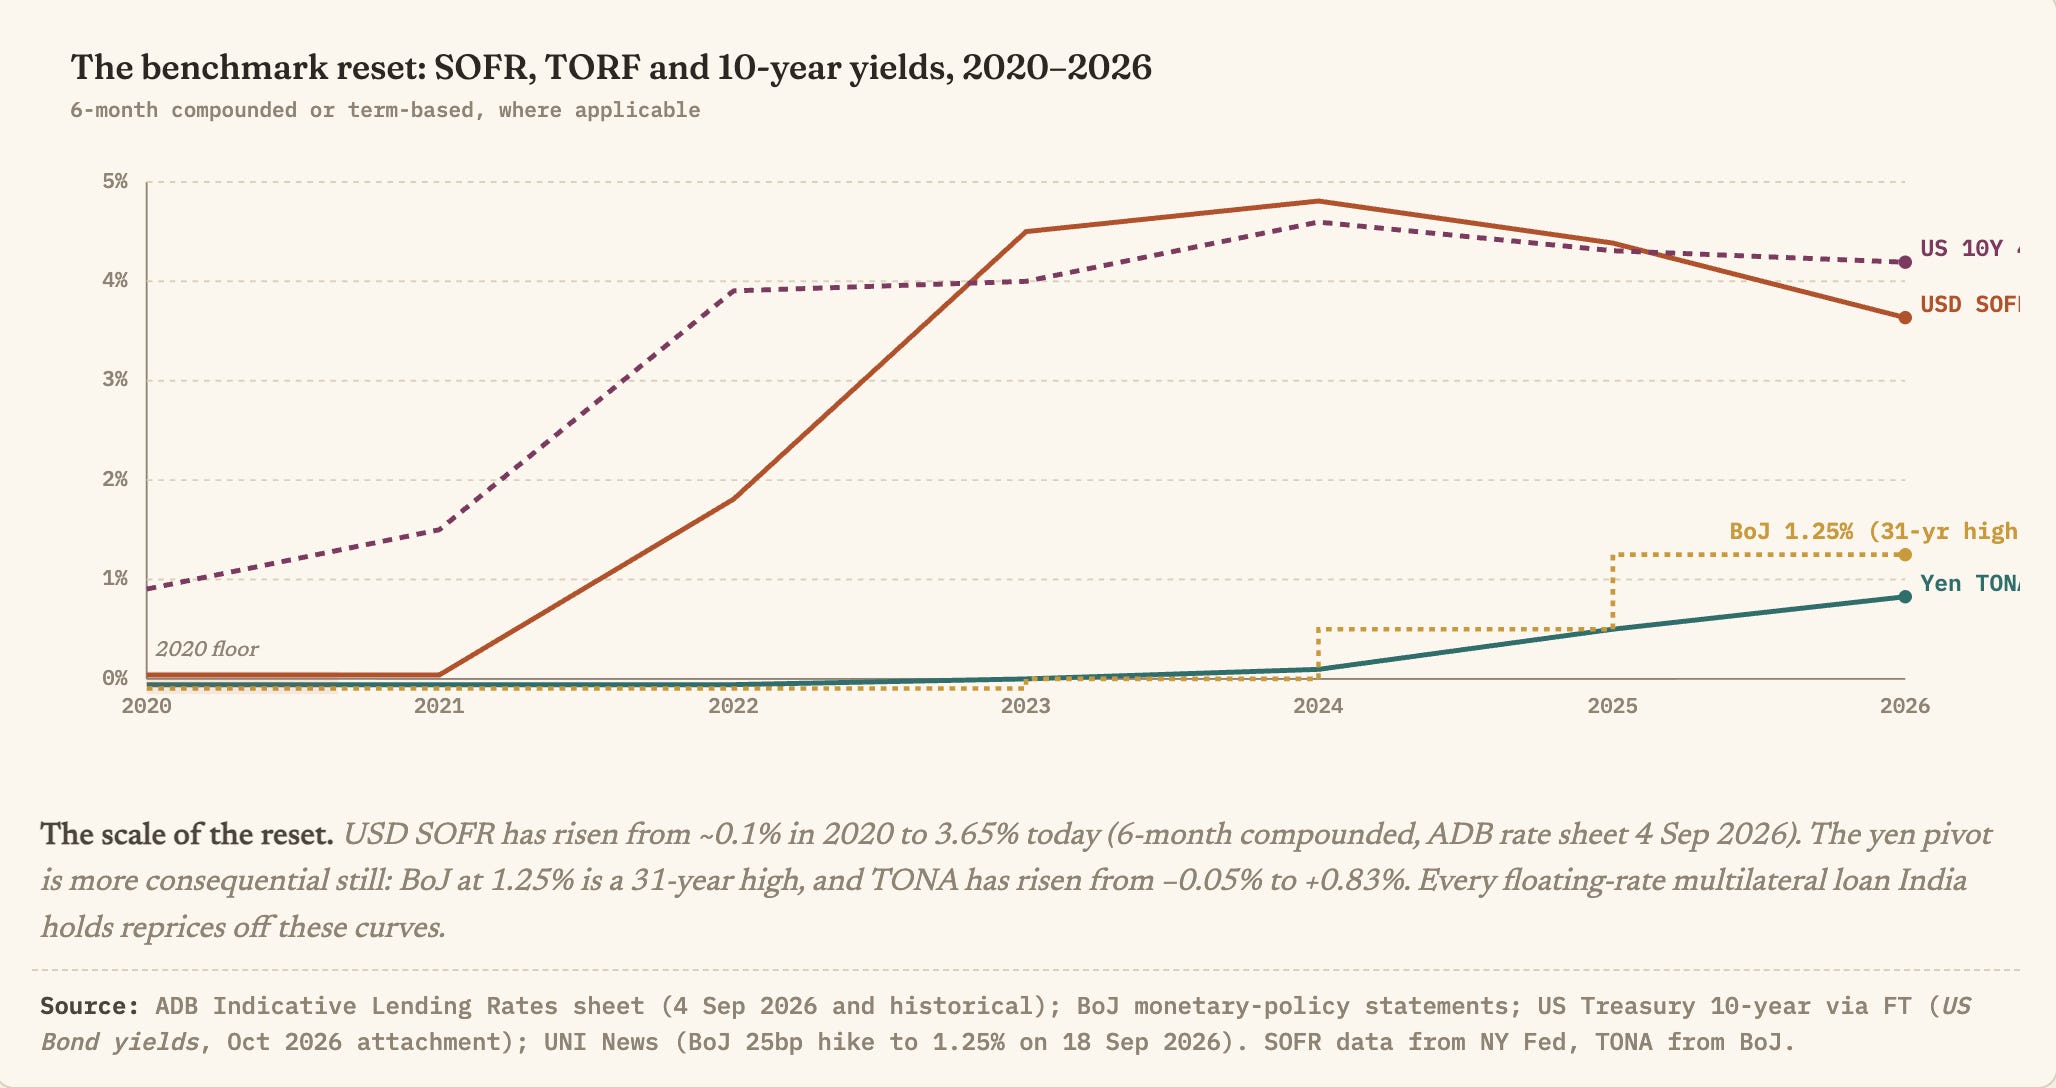
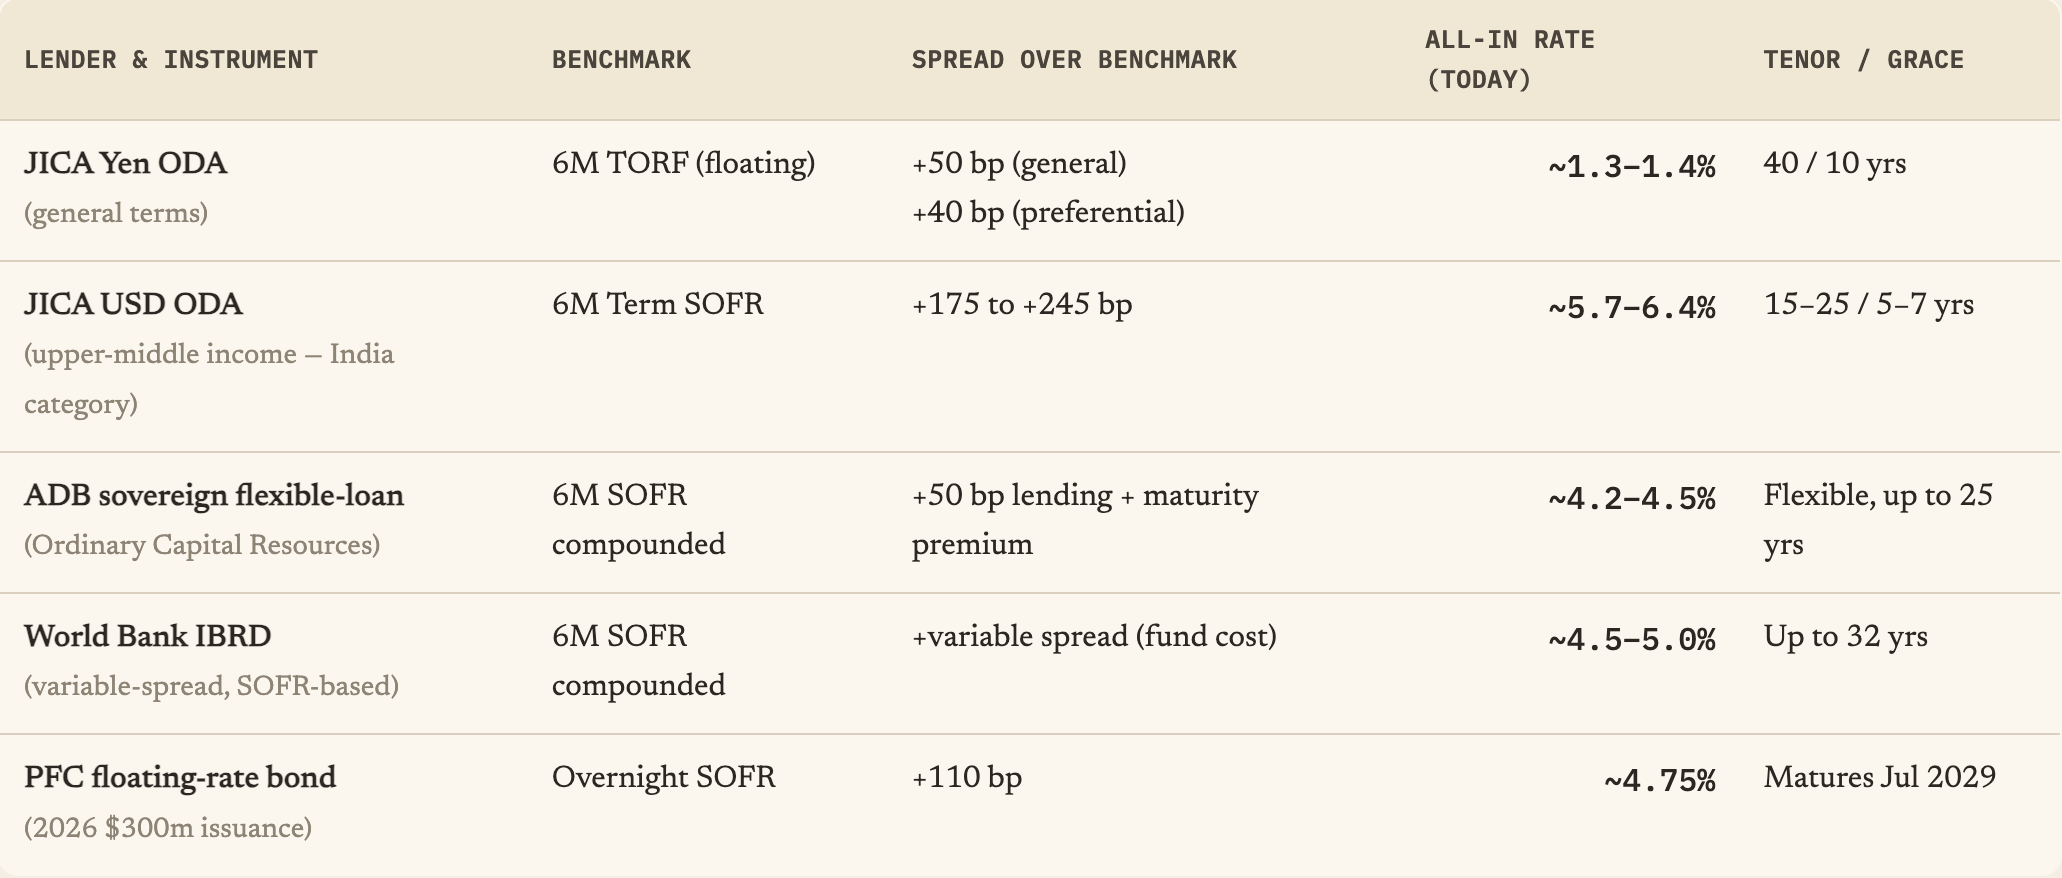
The impact of rising interest rates globally is also showing up on India’s bilateral and multilateral borrowing windows. The notion that multilateral and bilateral lending is cheap, long-tenor and insulated from financial-market cycles is no longer true. ADB, World Bank and JICA have all transitioned from LIBOR to the new overnight benchmarks — USD SOFR, Yen TONA and the newer TORF. Each is 300–350 bps above its 2020 floor.

For four decades, yen funding has been India’s cheapest formal external finance. JICA has been the backbone of financing for Delhi Metro, Mumbai Trans Harbour Link, Delhi Mumbai Industrial Corridor (DMIC), Western Dedicated Freight Corridor (DFC) and the Mumbai-Ahmedabad bullet train. All of them were conceived when the all-in yen cost was below 1%. But BoJ’s rate hikes, at 1.25% in Sep 2026, has already taken interest rates to their highest since 1995, and much more is expected as Japan normalises its financial markets. India has roughly $50bn of yen-denominated external debt (6.4% of total). 

Each 100 bps of additional yen funding cost on a 30-year ¥1 trillion exposure is roughly ¥100bn in extra lifetime interest. This shifts the IRR calculus materially.

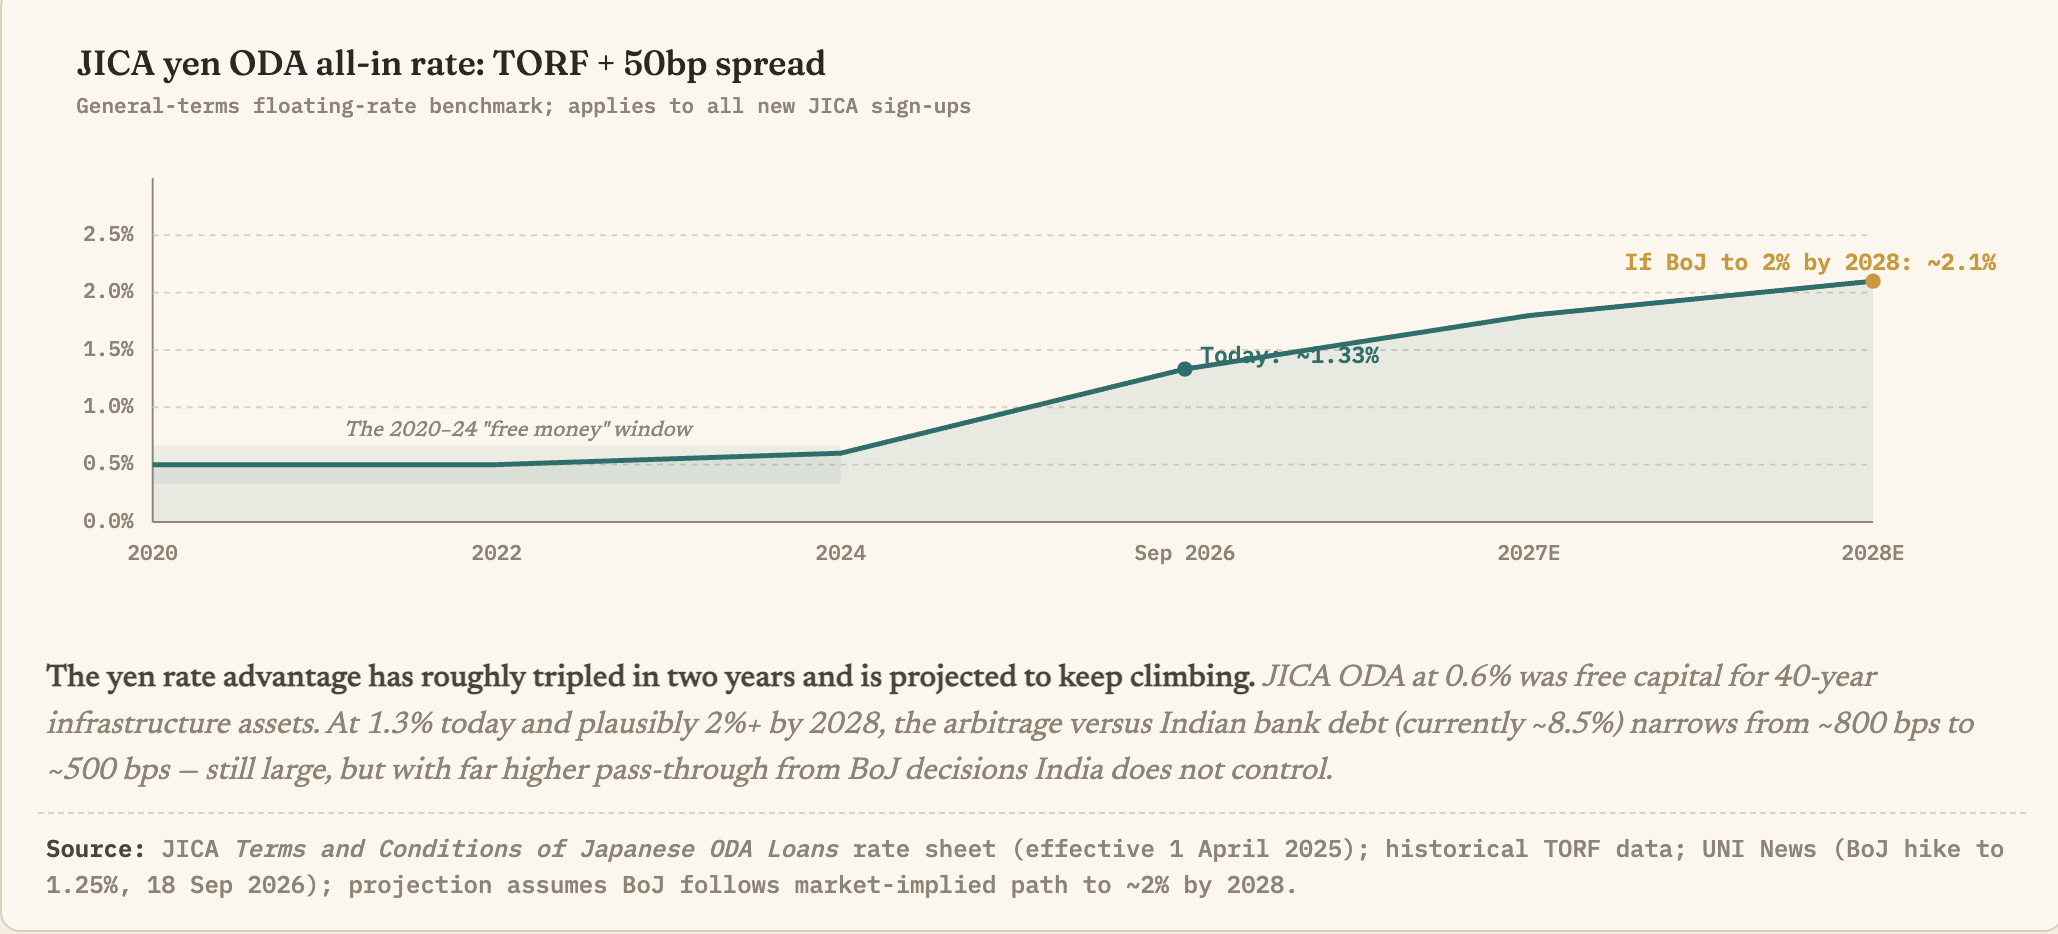
A JICA yen loan signed today has an all-in cost of about1.3–1.4%, still the cheapest money India can get, but roughly double the 0.6–0.8% that typical JICA loans carried in 2015–2022. More consequentially, as new BoJ hikes feed through, the TORF benchmark will keep rising. 

Put simply, India’s historical reliance on JICA for metro rail, DMIC, and large infrastructure is predicated on a yen funding cost that is quietly disappearing. This is not a cyclical shift, but structural one.

For the government, and including state governments, there is a need for a serious revisit of the external aided project (EAP) financing windows. Does it make fiscal sense to continue the same levels of such borrowings given the rate risks? 

Beyond the direct interest cost, higher global rates reset India’s external exposure through three further channels. They are the foreign portfolio flows into Indian debt markets, the yield that must be offered on NRI deposits to retain the stock, and the capital-wars channel through which US issuance crowds out EM access.

Finally, as we wrote in The Rise of Finance, thanks to the unavoidable spillovers from the dominance of the US economy and the dollar, the space available for developing countries to pursue autonomous monetary policy was already constrained. This is set to shrink further on the face of the trends discussed above.