Substack

Showing posts with label Transportation. Show all posts

Saturday, December 20, 2025

Weekend reading links

1. Mouth-watering prospects for Wall Street in 2026.
SpaceX is hoping to be valued at $800bn in its latest private share sale, while Anthropic is targeting $350bn. OpenAI’s most recent share sale was at $500bn. Given that anyone investing now would be hoping for another big lift before IPO day, the eventual numbers, if all goes to plan, would be much larger still. Any one of these would put the previous record for a tech IPO — the valuation of more than $230bn Alibaba achieved in its 2014 debut — in the shade.

2. Barring Tesla, at PE multiples of 20-30, the stocks leading the AI bubble do not look comparable to their peers in earlier bubbles. 

3. As the tech bros pursue self-governing enclaves, Prospera in Honduras offers a cautionary tale
Arguably the most evolved experiment in alternative governance is Próspera, a gated private community on a Honduran island run by a Delaware-based company, where close to 1,000 residents can enjoy co-working spaces, a beach resort and a golf course. As a for-profit semi-autonomous zone, Próspera has low taxes, its own labour rules and an arbitration system run by retired Arizona judges who hear its cases online. Bitcoin is one of the currencies of choice. Its founder, Venezuelan-born wealth fund manager Erick Brimen, describes his work as “an evolved way to drive socio-economic development” through public-private partnerships... Próspera’s hands-off approach to medical regulation has made it a mecca for people seeking experimental treatments as the field of longevity — or trying to live forever — becomes more popular in Silicon Valley circles...

Critics argue that the special economic zones legislation that allowed for Próspera to be established was championed by a corrupt former government whose leader, Juan Orlando Hernández Alvarado, has just been released from prison, where he was serving a sentence for narco-trafficking and weapons crimes, following a pardon from Trump. The government at time of writing (an election took place on November 30) since tried to repeal its charter on the grounds that, as ruled by the country’s supreme court, self-governing special economic zones are unconstitutional. Próspera is now suing the government for $11bn — just under a third of the country’s GDP — for lost future profits, through an international arbitration process... Cornell University historian Raymond Craib, author of Adventure Capitalism: A History of Libertarian Exit, from the Era of Decolonization to the Digital Age, says it offers a warning to elected politicians about the dangers of carving out semi-autonomous zones: “Precisely what Próspera is doing [suing Honduras] is precisely the argument governments are going to make about why you should not be editing your constitution to allow for this.”

4. John Burn-Murdoch has a great post arguing that the rising cost of services in developed economies may not mean that household consumption expenditures and living standards are declining. 

Add together the increased portion of incomes accounted for by healthcare (up by 3 percentage points over recent decades), childcare (up 2 points), housing (up 4 points) and food (up 1 point in recent years), and total spending on these unavoidable costs has climbed from just over a third of middle class disposable income to half of the total. But this squeeze from essentials has not led to an increase in the share of income American households spend in total across all categories, which is broadly in line with the historical average — even slightly down on where it was when all of these things were cheaper in real terms. This has been made possible primarily by dramatic falls in the price of clothes, electronics, household appliances and other mass-produced tradeable goods, which have more than offset the rise in essential services...
Rather than the increasing burden of essential costs suggesting living standards are being eroded, if we take a step back, it’s an indication that people across society are becoming more prosperous... William Baumol’s 1967 famous observation, as countries develop economically, the same productivity growth that drives down the cost of tradeable goods causes the cost of in-person services to balloon. Wages in sectors like healthcare and education that require intensive face-to-face labour, and have slow (if any) productivity growth, are forced upwards in order to attract workers who would otherwise opt for high-paying work in more productive sectors. The result is that even if people keep consuming the exact same basket of goods and services, as living standards in their country increase they will find more and more of their spending is going on essential services.

5.  Water metro facts.

A 75km elevated metro network could cost ₹15,000 crore. But a water metro of the same length would cost roughly ₹1,500 crore... Rail metros require continuous elevated corridors, viaducts, stations, land acquisition and traffic diversions through dense urban areas. Water metros, by contrast, rely on existing waterways, building only terminals, pontoons, control systems and a fleet of electric boats.

On Kochi metro

In Kochi, the water metro is priced to encourage regular use, with single-journey fares typically between ₹20 and ₹40 depending on distance, and monthly passes at ₹600. What makes it especially convenient is that passengers can use the same Kochi1 smart card, issued by KMRL, to access both boats and trains seamlessly... Kochi needs 53 water metro boats for its complete network but currently has only 20 operational vessels. Manufacturing electric-hybrid boats is a specialized, time-consuming process with limited global suppliers... With only 20 boats operating across six of the planned 15 routes, demand is concentrated on tourist-facing corridors... More than 80% of commuters are tourists... The shortfall in boats, and the resulting partial network, means many daily-use routes for local residents are still not operational.

Mumbai is seeking to emulate Kochi to develop a water metro system.

Amchi Mumbai Water Metro, covering nearly 200 nautical miles with more than 30 routes, represents a very different ambition. The planned routes are along the city’s western waterfront and eastern creeks, linking places such as Versova, Bandra, Wadala, Vashi, Airoli, Kalyan and even the upcoming Navi Mumbai airport.
6. For all the 200-plus PE multiples of Tesla riding on robotaxi prospects, the Chinese autonomous driving industry has a reality check
The recent listings of Pony.ai and WeRide in Hong Kong... shares in both have fallen since their November debuts, even as they pledged to use the funds towards scaling their fleets and advancing Level 4 autonomous driving — technology capable of operating without human monitoring or intervention... That is surprising given the businesses are already showing signs of viability. They have deployed more than 2,000 autonomous vehicles across 10 cities in China and have recorded millions of paid user rides. Many cities now allow fully driverless service. One explanation is that for Chinese investors, autonomous driving is still seen as a more costly hardware race than a software breakthrough.

7. Ed Luce sums up Trump's engagement with China.

On the grounds of never interrupting your enemy while he is making a mistake, Xi Jinping is 2025’s winner. The year’s hinge moment was Donald Trump’s cave-in to Xi in South Korea in late October. Trump’s trade war climbdown marked a new epoch. After mulling decoupling for years, talk of US-China divorce was suspended. Even so-called de-risking is now in question. Trump awarded their meeting a 12 out of 10. China took 10 of those points. Xi has profited simply by waiting for strategic gifts to come his way. Rarely has the inverted motto, “don’t just do something, stand there,” been more apt. Last week, Trump added to Xi’s windfall by approving Nvidia’s sale of H200 chips, albeit with a 25 per cent export tariff... Trump just handed China his biggest freebie so far. Advanced semiconductors are the one key area where China is still lagging behind the US. Trump is helping to close that gap.

8. Very good article by Ananth Narayan on India's currency management challenge

From FY2017-18 to FY2021-22, average annualised daily volatility was 5.5 per cent, close to the 6 per cent annualised daily volatility of the DXY index (which tracks the US dollar against a basket of six major currencies). During this period, net investment capital flows into India averaged 1.7 per cent of GDP. In contrast, between FY2022-23 and FY2024-25, annualised USD/INR volatility dropped to 3.3 per cent, even as DXY volatility rose to 7.4 per cent. USD/INR became significantly less volatile than other major currency pairs. Media reports attributed this to active RBI intervention that prevented INR depreciation, while dousing volatility. Notably, capital flows dropped to 0.6 per cent of GDP during this three-year period, pointing to the possible impact and constraint of the trilemma.

9. French President Emmanuel Macron makes the clearest signal towards a nuanced trade and financial market protectionism.

We should not be ashamed of a “European preference” as long as it means supporting strategic production — in automotive, energy, healthcare and tech — within our own borders. Protection against unfair competition is the foundation of resilience. We must not be naive: a credible protection strategy requires that we have the means to defend ourselves against those who break the rules. That is why we have a range of trade protection tools, including tariffs and anti-coercion measures. No one should be in any doubt about our willingness to use them. Second, in order to finance the investment we need, Europe must leverage its pool of around €30tn in savings. Each year €300bn is invested abroad. It is time we Europeans took the risk of investing in our own companies. Regulation simplification, securitisation and unified supervision will free much needed capital. Implementing the Savings and Investments Union will ensure European savings circulate freely to finance innovation and growth. Europe should also seek to reinforce the international role of the euro through the development of euro stablecoins and the introduction of a digital euro, as well as the creation of safe and liquid assets to finance defence and technologies.

He also invites Chinese investments into Europe but at certain terms.

China has long benefited from European FDI and co-operation, including on technology. The EU has invested close to €240bn in China while China has invested less than €65bn in the EU. Today, it leads in energy transition and clean mobility technologies, while Europe continues to lead in many service sectors. An optimal framework for our two regions is a co-operative one. The EU must stay open for China to invest in the sectors where it is a leader, provided the Chinese help generate employment and innovation and share technology.

This is a clear direction for engagement between Europe and China.

During my last trip to China, I made it clear that either we rebalance economic relations co-operatively — engaging China, the US and the EU in a genuine partnership — or Europe will have no choice but to adopt more protectionist measures. I much prefer co-operation, but will argue for using the latter if need be.

10. India FDI facts

Our assessment shows that the average risk-adjusted return on FDI investment in India remains quite attractive. We have estimated returns on inward FDI as the ratio of FDI equity income receipts to the total inward FDI stock, with a time lag (inspired by OECD and Eurostat methodologies). The risk-adjusted return has been calculated as the ratio of the 10-year average return to its standard deviation. Our assessment indicates that the average risk-adjusted return on FDI investment in India over the past 10 years is around 7.3 per cent, ranking second only to Indonesia (10.6 per cent). The risk-adjusted returns for other emerging economies are 6.6 per cent for Mexico, 4.5 per cent for South Africa, and 4.3 per cent for the Philippines, according to our assessment.

11. Good story in The Ken about how southern states are embracing a decentralised model of promoting ICT investments. 

Among the anchor cities in the four states, Visakhapatnam has a major competitive advantage. 

12. Western multinationals are finding ways to exit their China operations.

Global companies are seeking private equity partners in China to take on their local operations as they grapple with an increasingly competitive local market, a sluggish economy and volatile US-China relations. The owners of sports retailer Decathlon, ice cream brand Häagen-Dazs, coffee houses Peet’s and Costa, convenience store operator Lawson and GE HealthCare are all weighing options for their China operations, including selling parts or all of their businesses, said people familiar with their thinking. The rush to rethink China comes amid whiplashing relations with the US, the slowing of the world’s second-largest economy and the rise of fast-moving and better-adapted local rivals across a swath of industries.

13. Ruchir Sharma points to a deadly combination of over-valuation, over-ownership, over-investment, and over-leverage threatening the US economy. 

Households hold a record 52 per cent of their wealth in stocks, which is higher than the peak in 2000 and far above levels in the EU (30 per cent), Japan (20 per cent) and the UK (15 per cent). A closely related signal is overtrading. Over the past five years, the number of shares traded each day in the US has risen by 60 per cent to around 18bn. The retail share of short-dated stock options has grown from a third to more than half... Counting just the Magnificent Seven, AI spending has more than doubled since 2023 to $380bn this year and is on track to exceed $660bn by 2030. The potential returns are far from clear... the Magnificent Seven are not the cash machines they were even a year ago. Amazon, Meta and Microsoft are now net debtors, up from one in 2023. Their profits continue to rise but with so much flowing into AI, only Google and Nvidia still generate piles of cash.

Monday, September 1, 2025

Thoughts on affordable housing XI

This post in the series on affordable housing discusses the importance of transportation investments in promoting housing affordability. 

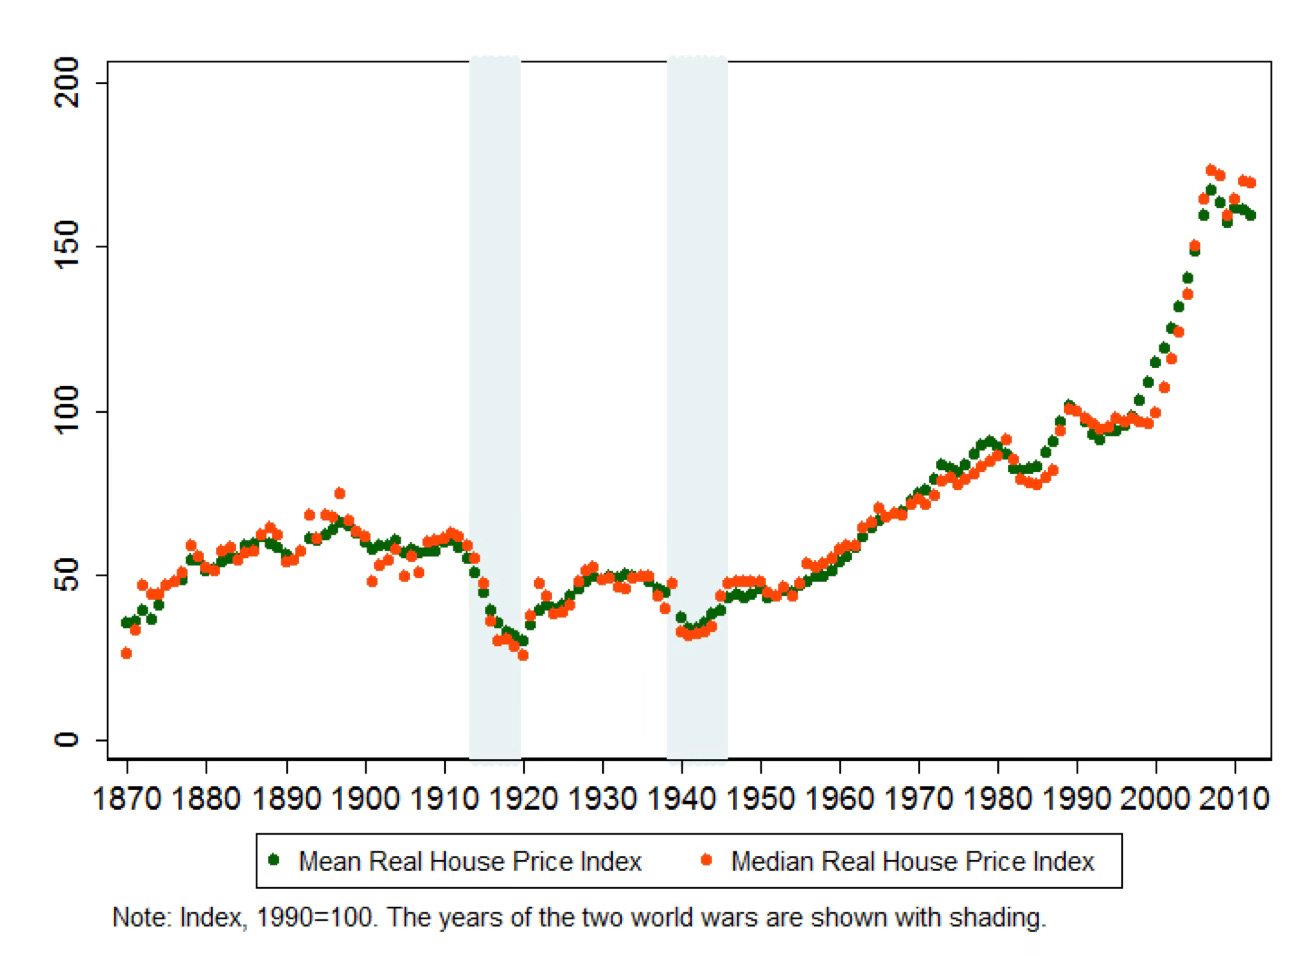
In an excellent 2014 paper, Katharina Knoll, Moritz Schularick, and Thomas Steger show that property prices remained constant in real terms for the major part of the development stages of 14 advanced economies (studied in the paper), driven in large part by transportation technologies and investments. 

This paper presents annual house price indices for 14 advanced economies since 1870. Based on extensive data collection, we are able to show for the first time that house prices in most industrial economies stayed constant in real terms from the 19th to the mid-20th century, but rose sharply in recent decades… By the 1960s, they were, on average, not much higher than they were on the eve of World War I. They have been on a long and pronounced ascent since then. For our sample, real house prices have approximately tripled since the beginning of the 20th century, with virtually all of the increase occurring in the second half of the 20th century. We also find considerably cross-country heterogeneity. While Australia has seen the strongest, Germany has seen the weakest increase in real house prices in the long-run. Moreover, we demonstrate that urban and rural house prices have, by and large, moved together and that long-run farmland prices exhibit a similar long-run pattern… 

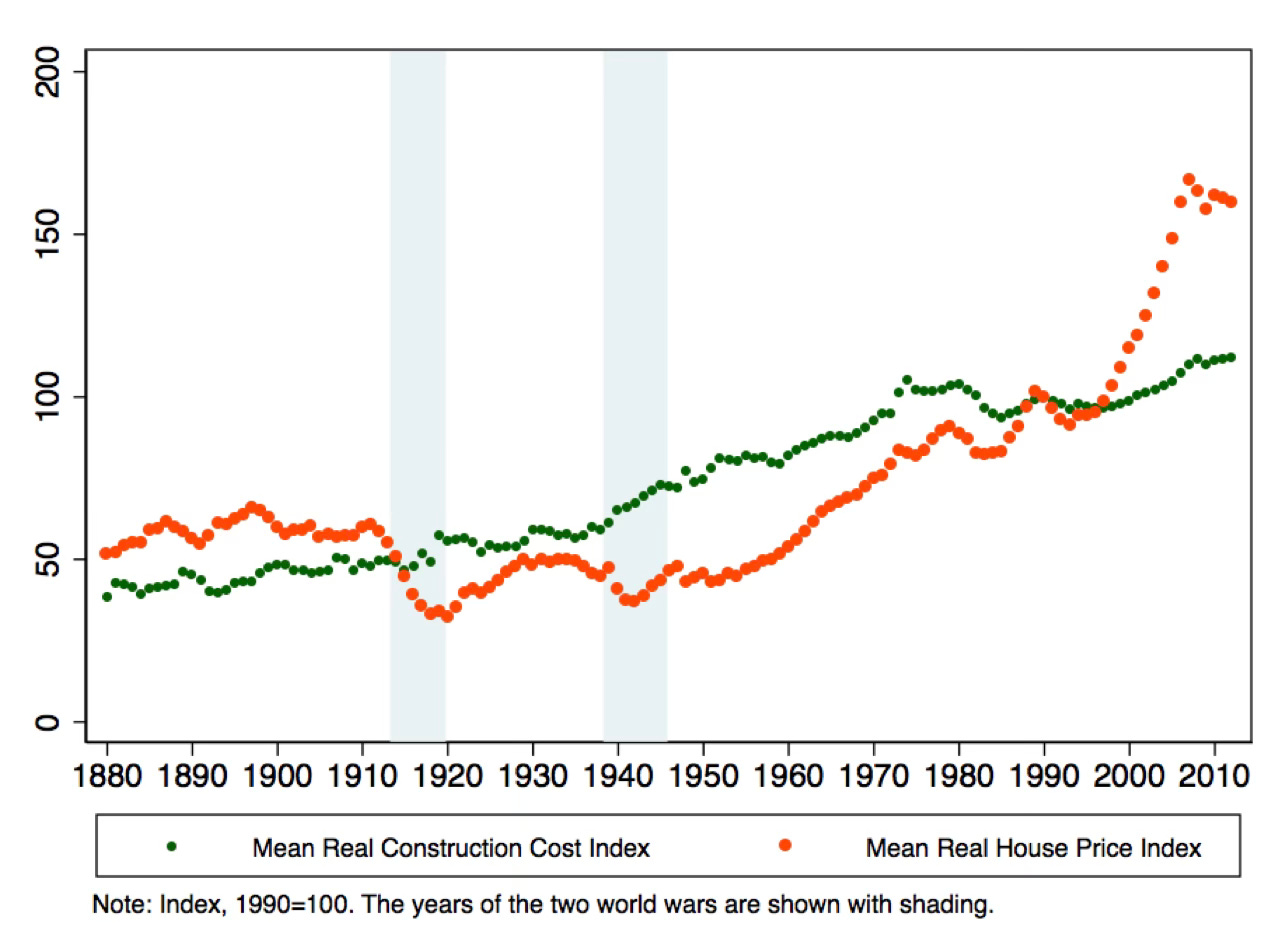
While construction costs have flat-lined in the past decades, sharp increases in residential land prices have driven up international house prices… During the past four decades, construction costs in advanced economies have remained broadly stable, while house prices surged… Our decomposition suggests that about 80 percent of the increase in house prices between 1950 and 2012 can be attributed to land prices. The pronounced increase in residential land prices in recent decades contrasts starkly with the period from the late 19th to the mid-20th century. During this period, residential land prices remained, by and large, constant in advanced economies despite substantial population and income growth…

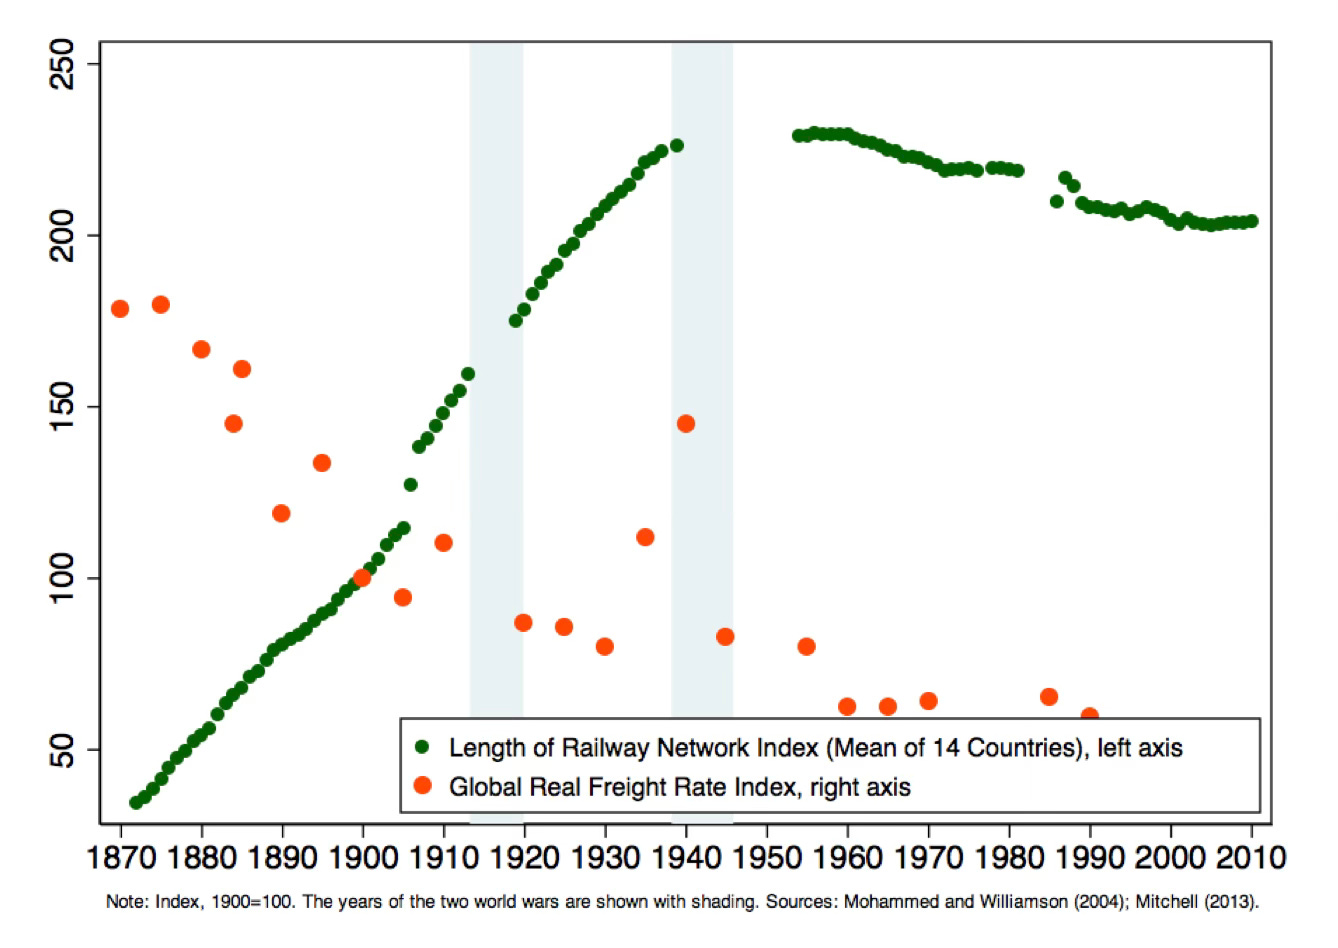
From the 19th to the early 20th century the transport revolution – mostly the construction of the railway network, but also the introduction of steam shipping and cars – led to a massive and well-documented drop in transport costs, often referred to as the transportation revolution. An important effect of the transport revolution was to substantially augment the supply of economically usable land… We show that this land-augmenting decline in transport costs subsides in the second half of the 20th century so that land increasingly became a fixed factor. At the same time, zoning regulations and other restrictions on land use also inhibited the utilisation of additional land in recent decades while rising expenditure shares for housing services added further to the rising demand for land…

Glaeser and Kohlhase calculate that the average cost of moving a ton a mile was 18.5 cents (in 2001 Dollars) in 1890 but had fallen to 2.3 cents at the beginning of the 2000s… The length of the railway network can serve as a proxy for the opening up of new territories over time. For our 14 countries, the length of the railway network peaked in the interwar period and has not grown materially since then… By 1930, essentially the entire world had been made accessible. Subsequent expansions of the transportation network through highways did not lead to a comparable fall in transportation costs… The dramatic efficiency gains in maritime transportation were also realized in the late 19th and early 20th century. The 19th century revolution in shipping rested on two developments: first, the fall of iron and steel prices that led to the introduction of metallic hulls; second, parallel advances in engine technology that led to much improved fuel efficiency Between 1870 and 1914 shipping costs fell by about 50 percent relative to the prices of commodities. By contrast, commodity-deflated real freight rates barely fell after 1950.

They offer a reinterpretation of David Ricardo’s hypothesis (made in the context of agricultural land, specifically where corn is grown) that, since land is a fixed factor, in the long run, economic growth will disproportionately benefit landlords. Further, given the unequal distribution of land, the rising land prices is likely to worsen inequality. They write,

The decline in transport costs kept the price of residential land constant until the mid-20th century. Yet the price surge in the past half-century could be an indication that Ricardo might have been right after all.

Illustrating the insights on the interaction between transportation developments and land prices, Binyamin Applebaum in the Times has an excellent article which shows how Tokyo has become a standout success in affordable housing on the back of a housing development strategy that revolves around mass transit. It has become the largest city in the world while also remaining affordable for its residents. Here’s a striking statistic.

Two full-time workers earning Tokyo’s minimum wage can comfortably afford the average rent for a two-bedroom apartment in six of the city’s 23 wards. By contrast, two people working minimum-wage jobs cannot afford the average rent for a two-bedroom apartment in any of the 23 counties in the New York metropolitan area.

This success comes with its costs and benefits

Maintaining an abundance of affordable housing has its downsides. Green space is scarce in Tokyo, living spaces are small by Western standards, and relentless redevelopment disrupts communities. But the benefits are profound. Those who want to live in Tokyo generally can afford to do so. There is little homelessness here. The city remains economically diverse, preserving broad access to urban amenities and opportunities. And because rent consumes a smaller share of income, people have more money for other things — or they can get by on smaller salaries — which helps to preserve the city’s vibrant fabric of small restaurants, businesses and craft workshops.

This is an important pointer to how Tokyo has managed a balancing act between urban growth and affordable housing.

From the air or from one of the city’s many observation decks, Tokyo appears as a vast sea of low- and midrise buildings laced with archipelagoes of high-rises, each island marking the location of a station along one of the city’s railroad lines.

This brilliantly captures the evolution of Tokyo’s housing landscape.

The Tokyu Railways Company developed the Den-en-toshi, or Garden City, line, which stretches southwest from the city center, in the 1950s as the backbone for a series of suburban neighborhoods of single-family homes… As Tokyo grew and demand for housing increased, the railroad has rebuilt the areas around its stations with condominium towers, shopping malls and office buildings. Around Futako Tamagawa Station, the largest of these new urban centers, Tokyu knocked down more than 100 homes to make way for more than 1,000 units in new apartment towers, as well as a new headquarters for the technology company Rakuten… 

The communities around the stations have grown denser, too, with apartment buildings interspersed among single-family homes. The population served by the Den-en-toshi line has increased from 20,000 people to more than 600,000. And the railroad, which once ran two-car trains three times an hour, now runs subway-style trains every few minutes, many of which continue into central Tokyo on a subway line. “We consider ourselves as a city-shaping company,” Hirofumi Nomoto, then chief executive of Tokyu, said in a 2016 interviewafter the completion of the Futako Tamagawa redevelopment project. “In Europe, for instance, railways companies simply connect cities through their terminals. That is a pretty normal way of operating in this industry, whereas what we do is completely different: We create cities.”

In stark contrast to Tokyo, cities like New York and others have stopped investing in mass transit lines and have strict restrictions on development along existing lines. And the consequences are evident in terms of housing unaffordability. 

This transit-led urban growth model has been supported by the city’s remarkably liberal zoning regulations.

In Tokyo, by contrast, there is little public or subsidized housing. Instead, the government has focused on making it easy for developers to build. A national zoning law, for example, sharply limits the ability of local governments to impede development. Instead of allowing the people who live in a neighborhood to prevent others from living there, Japan has shifted decision-making to the representatives of the entire population, allowing a better balance between the interests of current residents and of everyone who might live in that place. Small apartment buildings can be built almost anywhere, and larger structures are allowed on a vast majority of urban land. Even in areas designated for offices, homes are permitted. After Tokyo’s office market crashed in the 1990s, developers started building apartments on land they had purchased for office buildings.

Tokyo makes little effort to preserve old homes. Historic districts subject to preservation laws exist in other Japanese cities, but the nation’s largest city has none. New construction is prized. People treat homes like cars: They want the latest models. Between 2013 and 2018, new homes accounted for 86 percent of home sales in Japan, according to the most recent government data. In the United States, new homes typically account for about 15 percent of sales, according to data from the National Association of Realtors. One reason Tokyo looks forward is that little remains of the city’s past. Earthquakes, fires and American bombers destroyed much of the prewar city, and after the war, the rush to provide housing and the nation’s relative poverty produced a city that wasn’t meant to last… New buildings, and their occupants, also are more likely to survive the next earthquake… The ease of building in Tokyo means that new construction is not synonymous with luxury housing. Small workshops and factories are common…

Parks, too, are sometimes treated as unaffordable luxuries. Parks and gardens occupy just 7.5 percentof the city’s land, far below the figures for New York (27 percent) and London (33 percent). Mitake Park, once one of the few green spaces in the dense Shibuya neighborhood, is being transformed into a 26-unit apartment building. In the nearby neighborhood of Shinjuku, the government this year authorized construction of three high-rises that will eat into the Meiji Jingu Gaien, one of the city’s oldest and best-loved parks.

In another article in the Nikkei Asian Review, Benjamin Banzal and Jorge Almazan provide a nice description of Tokyo’s urban form.

After the firebombing of 1945, rebuilding was chaotic. Black markets flourished around train stations, while a severe housing shortage was often met with makeshift wooden homes on tiny plots, rather than large public housing. The government, constrained by weak institutions and scarce resources, was in no position to guide the city's recovery. When Japan's economic miracle took off in the 1950s, much of Tokyo's growth was driven by small, labour-intensive workshops embedded in residential districts. Zoning was flexible. Mixed-use, live-work arrangements were commonplace. Production chains were held together not by vertical corporate hierarchies but by horizontal social ties and local agglomeration economies. Subway expansion gradually allowed the city to grow outward, easing pressure on the center. Population density thus evened out across the metropolis. From above, Tokyo's vastness appears homogeneous, but its neighbourhoods remain distinct -- unified more by a shared set of local amenities than by architectural design. 

These amenities -- sento bathhouses, mom and pop stores, small manufacturing workshops, construction and building material contractors, eateries -- were tightly interwoven into the urban fabric and often owned and operated by local inhabitants, anchoring employment in neighborhoods. This model proved both functional and socially cohesive. With little open space, residents placed planters on pavements. Festivals were organised block by block. Economic growth did not produce stark urban divides. Tokyo remained relatively egalitarian in spatial terms.

The compact neighbourhoods that emerged in post-war Japan resemble the lightly planned, dense, mixed-use localities with small plots, narrow roads, limited public spaces, and low-rise multi-tenanted housing that characterise the majority of localities across all Indian cities. They have emerged organically through development by the original small plot owners, and encompass both slums and lower-middle and middle-class housing colonies. 

While in India, these colonies have largely remained stuck in time, with a slum-like quality of basic infrastructure. In contrast, Japan's provision of infrastructure and liberalised zoning regulations have allowed these colonies to become vibrant neighbourhoods that have retained their original character and social cohesion. 

The foundations of what we call the "Tokyo model" include dense, low-rise neighborhoods of around 20,000 residents per square kilometer woven together by narrow streets, gradually upgraded over time. Urbanism was "emergent," that is bottom-up and responsive to local needs… Private railway conglomerates such as Tokyu, Keio and Seibu also played a central role. They captured real estate value along their commuter rail lines -- building commercial hubs around stations and housing developments further out. In turn, Tokyo's transit system became one of the most efficient in the world, and helped spread the neighbourhood model across the metropolitan region… 

A mix of three phenomena around train stations added dynamism to this urban model. First, shotengaishopping streets, often covered arcades, branch off from station plazas and are filled with small, owner-run stores. Second, yokocho alleyways emerged when postwar black markets were regularised, allocating compact plots to bars and restaurants. These alleys still foster a strong sense of community. Third, zakkyobuildings -- narrow, multi-tenant towers on small lots -- stack diverse uses vertically, with their characteristic (neon) signage testifying to the vibrancy within.

Tokyo's urbanism has never been static. Over time, manufacturing gave way to services. Stricter environmental rules and broader economic shifts pushed industry out of the inner city. Height limits were relaxed, and taller apartment buildings began to rise along major thoroughfares. Since the 1980s, however, Tokyo's urban policy has increasingly tilted the balance toward top-down development. Floor-area-ratio restrictions were eased significantly. Special planning zones were introduced with looser urban restrictions. Tall, mixed-use towers -- especially near train stations -- became much easier to build, particularly since 2002… These towers often concentrate hundreds of apartments in a single building…

Unlike other countries that have incorporated tools for public participation, Tokyo's planning remains largely in the hands of powerful institutions: the central government, the Tokyo Metropolitan Government and its 23 special wards all have a say in decisions and have systematically sided with developers. As public consultation is minimal, community voices are rarely heard or often overruled. Over 200 redevelopment projects have already been completed since 2002 -- mostly in central areas like Roppongi, Shibuya and Toranomon. Many more are in the pipeline, including a second Roppongi Hills. As central areas will inevitably reach saturation at some point, developers are looking further afield in search of yield.

This is a good summary of the balance Tokyo has achieved between renewal and social cohesion. 

The Tokyo model deserves more recognition -- not out of nostalgia, but as a viable framework for future growth. Its buildings are constantly renewed. Its shops shift with demand. Its density supports both economic dynamism and social cohesion. It is a model built for change.

While I have quoted the trajectory of change in Tokyo’s urban form, the article itself cautions against the pace of change, which threatens the local character and social capital, replacing compact localities with homogeneous, gentrified high-rises. 

This has important lessons for developing countries like India, where the largest cities are already bursting at their suburban seams, mired in traffic congestion, and housing affordability is an acute crisis, with urban growth prospects facing strong headwinds. Sample this FT long read on Bangalore. 

The Tokyo example has strong relevance since Indian cities, too, are characterised by similar dense localities. Indian cities must create enabling mechanisms to allow them to shape and accommodate economic growth dynamically. It should allow, over time, pockets of high-rises to emerge so that the localities combine people from all economic classes.

This is important because the emerging landscape of India’s urban growth is that of older localities (both slums and middle-class colonies) frozen in time, increasingly congested, and with poor quality infrastructure (interspersed with pockets of affluent colonies), and suburban growth of homogeneous high-rise gated communities, interspersed with slums and squatter settlements. This is a deeply inefficient, unequal, socially dissonant, and growth-constricting form of urban development. 

A fundamental insight in urban development is that, given the fixed extent of land available in any city, there are only two ways to increase supply. The first is to develop vertically by raising the Floor Area Ratios (FARs), a topic discussed extensively in this blog (also this paper). The other option is to expand outward to encompass suburbs, while simultaneously building transportation infrastructure that shrinks the suburban sprawl and lowers commute distances. Tokyo illustrates how the combination of the two can keep housing prices affordable.

Transportation has traditionally been a performative aspect of urban planning in India, confined largely to instruments like road widths, land-use, and transport infrastructure creation (roads, Bus Rapid Transit, and metro railways). Unfortunately, public policy actions have largely been a form of isomorphic mimicry by transplanting top-down technocratic institutional arrangements (like UMTA/MTA and concepts like Modal Integration and Transit Oriented Development) that have worked in the cities of mature developed economies, without any thought for their integration with the local urban planning norms and without any meaningful social and political engagement and ownership by those stakeholders of the need for such changes. Even when implemented, they have remained only in form and have had little to show as substance. 

Accordingly, over the last two decades, we have seen that large transportation investments are made with limited changes to the master plan norms on land-use, FAR, and other measures to use the opportunity (presented by those investments) to shape urban growth and the future of the city. This is most egregiously manifest in the investments being made in new roads, road widenings, ring roads, BRT lines, metro-railway lines, and (now) the railway station redevelopment projects. In all these cases, there’s rarely any conscious, highest-level engagement to capitalise on the infrastructure investment’s geography-shrinking and housing supply-increasing potential by leveraging urban planning instruments. 

I blogged here that instead of being stand-alone PPP projects undertaken by the Indian Railways, railway station redevelopment projects should be viewed as urban regeneration projects that lay the foundation for the future of the locality and the broader city itself. I blogged here on the need to utilise metro railway investments as an opportunity to shape urban form by densifying the well-connected localities around stations through higher FAR and mixed land use. This and this are illustrative examples of transit-oriented development from London.

In conclusion, Indian cities require policy action at two levels. On the demand side, municipalities should adopt liberal planning regulations, such as those in Japan, that encourage renewal and vertical development, where feasible. The development of infrastructure,ties should complement thi roads and utilis. On the supply side, all transportation investments, especially metro rails, BRTS, or bus routes, should be approved only after easing planning regulations to permit significantly increased FAR and mixed-use developments around mass transit stations. This post provides more details on how to achieve such renewal.

Saturday, January 25, 2025

Weekend reading links

1. For a country which imported 72% of its crude oil in 2022, has China reaches peak oil?

Its crude oil imports declined 2% in 2024, the first such decline. The implications are enormous.
If Chinese demand is reaching a plateau that would fulfil projections by the IEA of global oil demand peaking before 2030. The forecast sustains hope for the world to reach net zero carbon emissions by 2050. The milestone would also shake the global economy. Over the past three decades, China has accounted for half of all growth in the world’s oil demand — some 600,000 b/d. If that rate continues to level off, the $500bn that oil companies are spending every year on finding new sources of oil and gas may be far too high.

2. Europe's stunning reversal of economic fortunes between its core (northern) and peripheral (southern) economies, the so-called PIIGS. 

In a stark reversal of fortune, the once-ailing “periphery” countries have stolen the lustre of its previously dominant “core”, including Belgium, the Netherlands, Austria and, at the centre, Germany. In the 15 years to the pandemic, German GDP on average grew by 1.5 per cent a year while the four southern states eked out just 0.3 per cent on average. Since 2020, Spain, Italy, Portugal and Greece have on average expanded by 1.3 per cent a year... on average, the four economies are nearly 6 per cent larger than they were at the start of the pandemic. Meanwhile, Europe’s largest economy Germany had no increase in economic activity at all over the past four years, and the Bundesbank has warned that this stagnation may drag on well into 2025. By contrast, the EU commission expects that Spain and Greece will grow by 2.3 per cent this year, Portugal by 1.9 per cent and Italy by 1 per cent.
Impressively, the much derided bureaucracy in Brussels may have contributed to this reversal for the PIIGS!
The newfound economic fortunes of Europe’s debt crisis countries can in part be traced right back to Brussels itself: A €800bn debt-funded investment programme that the EU launched during the pandemic. Through the so-called NextGenerationEU, member states are being provided with funds to invest in transportation and digital infrastructure, green energy generation, research and development among other areas, in exchange for undertaking productivity-enhancing structural reforms. Portugal, Italy, Spain and Greece are the main recipients. Though the four countries account for just 28 per cent of the Euro area’s GDP, they are expected to receive 78 per cent of all funds through the programme, according to ECB data. The scheme is currently set to run until mid-2026. In Italy, around €25bn of NextGenEU funds is being used for a major upgrade of the railway network, including new high-speed train lines into the country’s south, where travel is far slower than in the prosperous north. Billions of euros in infrastructure investment are generating much-needed employment in a region that has historically been short of jobs.
The money has come attached with reform conditionalities.
To unlock the funds, Italy has had to undertake major reforms of its public administration and judicial systems, with the aim of streamlining, simplifying and accelerating procedures and decision-making to boost efficiency and the country’s long-term competitiveness. The structural reforms demanded by Brussels are more important than the money itself, argues Yannis Stournaras, the governor of the Bank of Greece... Stournaras points to research by the Greek central bank suggesting that those measures alone could lift GDP up to 10 per cent by 2040.

3. German economy graphic of the day. Industrial output is falling and a quarter of manufacturing capacity is going unused. 

There are several other graphics in the article that point to the decline in the country's economic fortunes under Olaf Scholz. 

This graphic is both glass half full and half empty.

On the one hand, it's an impressive achievement that Germany was able to completely phase out a nearly 50% dependency on Russian gas in just over a year. On the other hand, Russian gas has not been substituted or offset by gas from LNG terminals. 

This means that Germany has either managed to improve its energy efficiency or figure out alternative energy sources or foregone output. More likely a combination of all, and subsequent economic contraction appears to indicate that it has been more of the last. 

Public investment is an area that Germany should focus.
Germany’s transport, energy and communications infrastructure suffers from years of under-investment, in part because of the country’s strict public deficit rules. The debt brake, a constitutional provision introduced under former chancellor Angela Merkel in 2009, prevents regional governments from taking on any new debt and the federal state from borrowing no more than 0.35 per cent of GDP in any given year. The result is an ageing railway network, crumbling highways and collapsing bridges. Deutsche Bahn, whose trains increasingly run late — if at all — has estimated it needs €45bn to modernise. The country’s adoption of new technologies has been slow. In a 2023 survey, 82 per cent of companies in Germany said they were still using fax machines. Germany also has one of the lowest penetration rates of fibre broadband in the OECD.

4. A peek at Donald Trump's commercial interests

5. China routinely overstates its GDP growth rates by 2-4 percentage points, says Rhodium Group. 

6. Good article that explains why it's not easy for ICE manufacturers to shift to EVs. This snippet illustrates the challenge,
In comparing their parts, the most important metric is weight reduction. For the electric business to keep growing, the cars need to better compete with gas-guzzlers on range. Therefore most every design decision must take into account whether it makes the car lighter. As a basic example, consider one component: Toyota part #55330-42410, a 20-pound steel bar, known by engineers as a cross-car beam. The beam holds the steering wheel and dashboard instruments in place and helps protect the cabin during a collision. This part is inside the bZ4X, the Toyota brand’s only global, mass-market fully electric car, because it’s of a tried-and-true design used in countless other models. Today’s standard cross-car beam is the product of incremental improvements made across decades, and most versions of it have wound up under the hoods of internal combustion cars. This is a testament to the Toyota Production System (TPS), which continuously refines even the tiniest details of individual auto parts.

Over untold iterations, the beam has been designed to keep the vibrations of an internal combustion engine from making their way to the passengers. But electric motors don’t vibrate, and steel is heavy. These are among the reasons why Tesla Inc. and BYD Co., the top makers of battery-electric vehicles, manufacture similar beams out of plastic. Theirs weigh only about 14 pounds, according to Caresoft, and they’re cheaper and easier to install, too... researcher Yole Group, which notes that BYD makes 40% of its parts. “It’s like, holy cow, these guys make everything,” says Woychowski, the Caresoft president. “They make their own batteries. They make their motors. They make their own body. They make their front and rear fascia, their headlights, their door trim panels, their console. It’s a quantum jump. That’s not conducive to kaizen.”
This is an important snippet

A typical electric car has about 11,000 parts, Goldman Sachs Group Inc. has estimated, about two-thirds fewer than its gas equivalent.

Many components are completely new.  

7. Andy Mukherjee compares the real cost of doing business in India and Thailand.

All told, 19% of a $2.3 million factory in India is an extra burden of governance — or lack of it — that doesn’t exist in Thailand. This may not be an showstopper for a high-margin business that relies on skilled, productive labor and cutting-edge technology. But for a labor-intensive startup operating with slim profits in an industry like readymade garments, going into production from a weak financial position means fewer resources left to scale up. And therein, the entrepreneur tells me, lies the basic difference between India and its East Asian neighbors. No ordinary Thai businessmen fears bankruptcy because of something his government may do; in India, such a prospect is very real.
8. Good description of the fissures building up in the Trump coalition between the Tech Right and the Nationalist Right. 
The core of the aspiring Trumpian aristocracy are still reactionaries and nationalists aching to restore an American way of life thought to be lost after decades of “globalist” technocracy. They are often deeply skeptical of the idea that the innovations promised by tech companies represent progress, and they describe America as “not just a country, not just an economy, but a people with a common history,” as Jeremy Carl, a deputy assistant secretary of the interior in the first Trump administration and a senior fellow at the Claremont Institute, told me. The tech figures who came to the movement in 2024 were often sympathetic to Trumpian nationalism. But they tended to be more interested in making money and launching a new era of “American dynamism.”... The coalition is achingly close to achieving a long-held conservative dream — of fashioning a high-low alliance powerful enough to supplant the liberal establishment and remake America. It is a project that might well collapse if one side or the other gets too much of what it wants, and ends up driving the other away... Mr. Bannon accused the tech barons of promoting “technofeudalism” and “transhumanism”— bending human life into technologized and unnatural new forms.

Another description of all the Republican factions that animate the Trump coalition.  

9. A study by LCH Investments, an investor in hedge funds, shows that hedge funds have pocketed nearly half their returns since their inception in 1969!
Managers generated $3.7tn of total gains before fees, but fees charged to investors were $1.8tn, or about 49 per cent of gross gains... The figures... date back to 1969... “Up to the year 2000, the hedge fund fee take had been running at around a third of overall gains, but since then it has increased to a half,” said Rick Sopher, chief executive of Edmond de Rothschild Capital Holdings and chair of LCH Investments. “As returns came down, fees went up.” New research comes after the world’s 20 most successful hedge funds made their biggest profits on record in 2024... The top 20 managers in the $4.5tn hedge fund industry made total profits for investors of $93.9bn in 2024... up from the previous record of $67bn in 2023. Together the top 20 generated asset-weighted returns of 13.1 per cent, significantly outperforming the average hedge fund, which made 8.3 per cent...

Hedge funds have historically been known for a “two and 20” fee model, where investors pay 2 per cent in management fees every year and a 20 per cent performance fee on investment gains... The increase in the overall fee take from 30 per cent to about 50 per cent of gross gains is largely due to higher management fees... Whereas management fees used to eat up less than 10 per cent of gross gains in the late 1960s and 1970s, they have represented almost 30 per cent in the past two decades... firms have a “pass-through” expenses model, where the manager passes on all costs to their end investors instead of taking an annual management fee. That can cover office rents, technology and data, salaries, bonuses and even client entertainment. It typically varies from 3 to 10 per cent of assets annually. A performance fee of 20-30 per cent of profits is usually charged on top.

This is the list of the biggest hedge funds and their life-term gains

10. Important point to be considered in the context of US government restrictions on the sales of high-end semiconductor chips by its chip designers.  
Indian firms that want more than 1,700 chips a year will require “National Verified End User” (“NVEU”) authorisation. The American side has been alarmed by events in India, eg reports of a company in India which imported 1,100 Nvidia chips from Malaysia and re-exported them to Russia for $300 million. Action by the Indian state blocking leakages of high technology to Russia, China, and Iran will help more Indian firms get to this NVEU status.

11. Important point about the trends in central government's assets.

The Central government’s assets as a proportion of its liabilities... rose from 67 per cent in 1950-51 to 100 per cent by the early 1960s and stayed at that level till the early 1980s because of the emphasis on investment in public sector industrial and infrastructure corporations. Since then, it has declined steadily to 75 per cent in 1990-91 and 42 per cent in 2023-24, with the shift towards subsidies and handouts. The growing role of freebies in electoral contests may well reduce the ratio of government assets to liabilities even further.

12. This captures the nature of the Indian market more than anything else

“India is a L1 (in the world of business contracts, L1 stands for the lowest bid in a tender)country. It is price that matters, not quality or source of imports," said N. Krishnamoorthy, deputy managing director, commercial, Chemplast Sanmar, a large PVC producer.

This is Uber CEO Dara Khosrowshahi

“Indian customers are so demanding and don’t want to pay for anything. I am so proud of the team. India is the gateway to the world for us. It has been the toughest market to succeed in. But if we succeed here, it sets the standards for us to succeed in other markets in the world.”

13. India state capacity fact of the day, Directorate General of Foreign Trade (DGTR) edition,

The time taken by DGTR to levy anti-dumping tariff measures is much longer than its peers. “It takes anywhere between 18 to 30 months from the start of dumping to imposition of duties," said A.K. Gupta, founder and director, TPM Consultants, a consultancy into trade remedies. Other countries do it in 9 to 12 months... That apart, the case should ideally be initiated within 15 days of the filing of the application. “In other countries, cases are initiated once there is prima facie evidence and then the investigation begins. But DGTR generally takes a couple of months or more to initiate a case as its officers first start a preliminary investigation, which takes weeks before they even accept the case. This is a typical Indian bureaucratic mindset," said Arora... DGTR has about 25 officers while its equivalent organization, in the US, has over 250. Each officer, at any given time, handles 10 to 20 cases. “In the US and EU, it is not more than two or three cases," said Arora.
14. Parking minimums come full circle.
When cars became the dominant mode of transportation after World War II, cities began adding parking requirements to ease road congestion. By 1969, nearly all municipalities with populations of at least 25,000 had minimum parking requirements for many buildings, including beauty salons and bowling alleys... Hundreds of cities and municipalities have rolled back or completely thrown out requirements on real estate projects since the nonprofit organization Strong Towns began keeping track a decade ago. In 2022 alone, 15 of them, including San Jose, Calif., Raleigh, N.C., and Lexington, Ky., repealed their parking rules. In late 2023, Austin became the largest U.S. city to eliminate parking minimums. And in December, New York City lawmakers put policies in place that reduced or eliminated parking requirements for new housing in some parts of the city... In November 2023, Austin, Texas, became the largest U.S. city to end parking mandates.

Its impact,

A 2022 study by the Regional Plan Association, a nonprofit group focused on the New York City area, found that more low-income housing was built in city neighborhoods where parking requirements were reduced... Seattle, considered a pioneer in parking policy, took an incremental approach. In 2012, the city relaxed minimums in central neighborhoods and areas served by public transit. Then in 2018, it expanded the approach to more locations and types of development. Roughly 60 percent of the housing developed in Seattle since the changes were put in place would not have been possible under the old rules, according to a 2023 study by Sightline Institute.

Saturday, May 18, 2024

Weekend reading links

1. The Ken has a story which writes that the UPI has now become an oligopoly involving two companies - Phone Pe and Google Pay, who together make up nearly 85% of the UPI transactions. The NPCI had announced a 30% cap for any one company in 2020, and the deadline has since been extended to end of 2024. 

2. Chinese local governments are raising tariffs and fees on various utility and other services

China is taking the rare step of sharply increasing fares for riders on four major bullet train lines, in its broadest move to address rising costs and heavy debts since construction of the system began nearly two decades ago. The higher prices for train tickets are part of a push to raise prices for public services. Earlier this year, water and natural gas bills started going up in some cities. Public services in China are heavily subsidized by local governments. But huge municipal debts mean that these governments have less money on hand to keep prices down... China has already pushed up electricity charges considerably since 2021 for many factories, although residential customers continue to pay low, subsidized electricity rates...

The bullet trains... infrastructure has been paid for with enormous borrowing, which has reached $870 billion just for China State Railway Group, the state-owned enterprise that runs the rail network... Many of its lines are owned by joint ventures with provincial and municipal governments that helped pay for construction and are becoming less able to subsidize transportation... China has opened 28,000 miles of bullet train routes since 2008. Routes connect every major city and hundreds of smaller cities and towns. To put its size in perspective: The system is long enough to span the continental United States more than 10 times from New York to Los Angeles. The first line opened right before the Beijing Summer Olympics. China’s bullet trains typically run at either 186 or 217 miles per hour, depending on the route. Because the tracks are straight, the trains run for long distances without slowing down... With the price increases, the peak fare of a second-class high-speed train ticket from Wuhan to Guangzhou, a nearly 600-mile trip that takes less than four hours, will soon be $78. A ticket in first class, which has two seats on either side of the aisle like economy class on American trains but more leg room, will cost $125, and a lie-flat business class seat will cost $273.

3. In pursuit efficient management of their times, couples are taking to using work-management tools like Slack and Notion. This is one more example of efficiency maximisation taken to its extremes.  

4. The optimal currency area benefits that the richer South India gets over the poorer North India.

The more industrialised, richer countries get a huge captive market in the EU in which they can sell their products.  Those that have adopted the euro as their currency also get a huge competitive advantage as their labour becomes cheaper (relative to labour productivity), while that of the relatively poor countries in the euro — such as Spain, Greece, and Portugal — more expensive. The Bertelsmann Stiftung Foundation showed that German growth was 0.5 per cent per year higher due to the euro — largely because its national currency the D-Mark would have been stronger, and, as a result, exports were lower. Similar benefits also accrue to Austria and the Netherlands, and even to Denmark, which is not in the EU but keeps its krone pegged to it.  So, while the richer parts of the EU subsidise the poorer parts through fiscal transfers, they also gain by having a captive market and an undervalued currency that improves their competitiveness across the world.

5. Fascinating account in NYT about the evolution of road usage in New York City.

New York City’s streets were laid out before anyone knew how they would ultimately be used — long before cars were even invented. The first city planners could not have anticipated Uber vehicles, let alone Amazon deliveries or commuters on electric scooters. In New York’s earliest days, the streets were a free-for-all. People walked or rode horses. There were no crosswalks or stoplights; if you had to cross the street, you simply walked across the street. Soon, horse-drawn vehicles used the streets alongside pedestrians, and people dashed between them. (Later, New Yorkers dodged streetcars in much the same way, giving the Brooklyn baseball team its name.) The arrival of bicycles neatly encapsulated the city’s ever-shifting debate over how the streets should be used — and by whom. By the 1890s, the streets were full of bikes. Men and women took to cycling through the city so quickly — and dangerously — that it was called “scorching.” About 100 years later, in 1987, speeding bike messengers were deemed so dangerous that bicycles were banned from Midtowntemporarily. Today, the city encourages residents and visitors to ride bikes. New York has bike lanes and a flourishing bike share program, plus an explosion of food delivery powered by e-bikes. The renewed popularity has also come at a grave cost: Last year 30 cyclists were killed on city streets, and 395 were severely injured...

“At the end of the Gilded Age, right before World War I, suddenly, there were motor vehicles everywhere,” said James Nevius, an author and New York historian. The development meant people could move around faster — but it also put more people in danger. In 1920, there were about 200,000 registered vehicles in New York City; by 1925 that number had more than doubled. A century later, that figure is two million. And yet New Yorkers are still using the same streets that were laid out generations ago. In Manhattan, the rigid street grid was designed in 1811. Avenues are 100 feet across. Cross streets are 60 feet wide, including the space for sidewalks on both sides. That’s 720 inches in which to fit not just cars but also pedestrians, baby strollers, trash, compost, scaffolding, bicycles, e-bikes, scooters, skateboards, package delivery trolleys, garbage trucks, delivery trucks, food carts, 5G towers, dining sheds, trees, CitiBike docks, buses, taxis, ambulances and on-street parking. It’s like a giant game of Tetris — except all the pieces just won’t fit. In fact, some of the pieces are growing larger: In the past decade, the average vehicle got 12 percent longer and 17 percent wider. (Cars’ blind spots have also gotten larger.) And the number of pieces just keeps expanding. New York City’s population reached 8.8 million in 2020, and the New York region is now home to nearly 19 million people. The city’s population has dropped some in the past few years, but city officials believe that recent population estimates have significantly underestimated the number of newly arrived migrants, which, by some counts, is over 180,000...
Over the past 10 to 15 years, sweeping pedestrian plaza initiatives — detouring cars and encouraging space for sitting and strolling — have gradually changed the landscape, from the Jackson Heights neighborhood in Queens to Times Square. The Open Streets program restored pedestrian-first streets, free of cars and safe enough for strolling, chatting and letting kids ride bikes... And there are plenty of other places to look for inspiration: In Bogotá, Stockholm, London and Paris, certain streets are being closed to cars. There is an effort in Europe to avoid the oversize pickup trucks and SUVs that make American roads so deadly. Paris has designated “school streets” where cars have been removed to make way for children. Cycling is flourishing in Europe; emissions are down.

6. The investment-side story of the Indian economy over the last few years is nicely captured in this table.

Surging government capex has been the driver of economic growth, even as private capex and consumption have declined. The former has been driven by railways and highways, whose expenditures have indeed risen sharply. But the rise in government capex is exaggerated by the government assuming the debts of NHAI and Railways. Finally, the space for the government capex increase has been facilitated by the post-covid surge in fiscal deficit. 

Underlining the weakness in private investments throughout recent years, the value of completed projects has mostly stayed the same in real terms from 2017-18. 

This is likely to remain so for a longer time given that project completion in future is dictated by the projects started in recent years and today, and they have yet to show signs of an uptick. From a recent BS oped, this about private consumption and corporate investment trends.
The most recent National Accounts Statistics (NAS) show a drop in the annual rate of growth of consumption from around 7 per cent between 2011-12 and 2018-19 to a little over 4 per cent in the past five years.(Table 1.1 NAS 2024). In fact, the second advance estimate for 2023-24 shows only a 3 per cent growth in private consumption. In a large country like India, a slowdown in private consumption growth will affect corporate investment. That is why the recent NAS shows a drop in the annual rate of growth of private corporate investment from a little over 10 per cent between 2011-12 and 2015-16 to under 5 per cent in the years since then until 2022-23. (Table 1.11 NAS2024).
The weakness in private investment is despite the much improved corporate balance sheets, with the share of excessively leveraged corporates being among the lowest in Asia. And bank credit growing at record rates. 
7. Dani Rodrik critiques those who rail against Chinese green energy subsidies, arguing that they have dramatically reduced the prices of green technologies and expanded its access manifold. He argues that the need of the hour is more industrial policy and subsidies by all countries to make green technologies more affordable and accessible. He describes the case for subsidising green industries like China has done as "impeccable". 

He does acknowledge the problems with China's subsidies.
Countries have other interests besides the climate, of course. They can harbor legitimate concerns about the consequences of other countries’ green-industrial policies for jobs and innovative capacity at home. If they judge that these costs outweigh the climate and consumer benefits, they should be free to impose countervailing tariffs on imports, as trade rules already allow. It would be better for the world overall if they didn’t react that way, but nobody can or should stop them.

The problem is with the last line. While the Chinese green power subsidies have achieved tremendous success in mainstreaming green technologies, it has come at the cost of destroying local green industries elsewhere and making all countries chronically dependent on China for green technologies. Given green technologies are a major share of today's and future manufacturing, the destruction of the domestic manufacturing bases across countries due to cheap Chinese exports is a prohibitive and unacceptable price to pay. It becomes a serious, almost existential, national security risk when there's a Cold War raging and the near-certain weaponisation of its dominance in these frontier technologies by the Chinese government. 

The manufacturing trends in green technologies are an encore of what has happened across the manufacturing sectors in the last two decades. Thanks to the cheap Chinese imports, the manufacturing base that's essential to create the good jobs that Dani Rodrik frequently writes about has been seriously weakened across developed and developing countries. Besides, the world has become excessively dependent on China for even basic manufacturing, as the Covid 19 painfully exposed. 

Economists should consider this trend in manufacturing as a failure of comparative advantage. If there's a strong Matthew Effect, whereby the dominant producer is able to strengthen their position with economies of scale and subsidies, then comparative advantage and trade end up leaving the world economy worse off.

8. Among advanced economies, the Germans work the least and the Americans the most.

According to the OECD, the average annual hours worked by Germans are down 30 per cent in the past 50 years, falling a quarter below US levels, reflecting Europeans’ growing preferences for longer periods of leave and more leisure time.
9. Alan Beattie points to a problem with the definition of subsidies. The IMF has been pointing to "implicit subsidies" or countries failing to internalise the external costs including air pollution and road traffic accidents. 
By this measure, annual global fossil-fuel subsidies are a massive $7tn, nearly three times as much as worldwide spending on defence. This has caused considerable consternation in policy circles: old subsidy hands correctly point out that these estimates of implicit subsidies are highly uncertain and hence cannot practicably form the basis of international rules. They also often lead to a misleading idea — unfortunately propagated by the fund itself, its sister organisation the World Bank and the UN — that trillions of dollars are being spent on fossil-fuel subsidies and could be redirected elsewhere. In reality, the public money that supposedly funds implicit subsidies does not yet exist: it’s notional revenue from a tax the IMF thinks ought to be levied but isn’t.

Such subsidies are clearly defined by value systems and preferences of certain groups of countries. It raises several questions. What should be an acceptable level of internalisation? Why should only certain kinds of social costs be considered (labour standards, pollution etc.), whereas certain others are not considered (labour displacing technologies, cross-border capital flows)?

10. Rahul Jacob in Livemint has some stats about India's trade figures

A Federation of Indian Export Organisations report says that apparel, knitted garments, marine products, plastics, and gems and jewellery had grown at just 1 % to 2%. In fact, during 2023-24, while goods exports contracted by 3%, exports of textiles, leather, gems and jewellery and marine products declined 9%... A report earlier this year by Global Trade Research Initiative, a think-tank, contains alarming data-points on India’s decline in the global garments market. It states, “In 2023, China exported $114 billion worth of garments, followed by the EU with $94.4 billion, Vietnam with $81.6 billion, Bangladesh with $43.8 billion, and India with just $14.5 billion… From 2013 to 2023, Bangladesh’s garment exports grew (cumulatively) by 69.6%, Vietnam’s by 81.6%, but India’s grew by only 4.6%."

11. Finally, via Kyle Chan, some interesting graphics on the iPhone in the Nikkei Asian Review. The prices of iPhone components have been rising.

Apple has been largely absorbing a significant part of the price increases.

The share of China in the components cost is tiny. 

But the low share does not reveal that the components are manufactured in China - 87% of Apple's 187 suppliers have production facilities in China and China/HK headquartered companies make up more than half of Apple's suppliers.