Substack

Showing posts with label Urban Issues. Show all posts

Tuesday, July 21, 2026

Lessons from Spain for urban planning

Football is not the only area where we can learn from Spain. Energy transition, infrastructure construction and urban planning are some others. This one is about urban planning. 

An essay in Works in Progress examined how traditional apartments have declined across Europe, except in Spain, and the role played by late development and public policy. It also underlines how Spain uniquely got all the basics of urban planning right - land readjustment, infrastructure development, mixed-use, densification, connected street network, walkability, mass transit, and low car usage. 

This is a good description of mixed-use density in Spanish cities that promote walkability and mass transit commutes, and limit sprawl and carbon emissions. 

Spain’s cities are unusual. They are much denser, tighter, and more deliberate than other European cities, let alone North American ones. They reject picket fence for apartment block and choose balcony over front lawn. Two thirds of Spaniards live in flats, against 41 percent of Poles, 36 percent of the French, and just 10 percent of the Irish. Of the remaining third, most live in terraced rowhouses. In Spain’s cities, over four fifths of people live in an apartment. At the edge of Madrid or Valencia, dense mid-rise blocks stand beside open countryside without sprawl in between, something that has almost never happened in an English-speaking country, and that has been rare in France or Germany for a century… Spain’s settlements have some of Europe’s lowest per capita transport emissions, in part because about 70 percent of trips in Madrid and Barcelona are made on foot, tram, or metro. Almost every neighborhood is mixed use; almost all urban Spaniards live in the ‘fifteen-minute cities’ that seem like remote ideals in most affluent societies.

This is a good comparison with other Southern European cities, and even here, Spain stands out. 

Spain is not alone in Europe in having become wealthy only recently: most Southern European countries have a similar economic history. And Portugal, Italy, and Greece do share the distinctive features of Spanish urbanism to some extent, with relatively dense cities and relatively high shares of people living in apartments (46 percent in Portugal, 53 percent in Italy and 59 percent in Greece compared to 65 percent in Spain). In other ways, however, Spain is distinctive in Southern Europe. The cities of Portugal, Greece, and Southern or Central Italy are generally surrounded by ragged fringes of unplanned suburban development: their urban cores are dense in the same way as Spain’s, but their peripheries are a chaotic mixture. The transport situation is also dramatically different. About half of journeys in Lisbon and Athens are by car; in Rome, the figure is two thirds, with another substantial share on mopeds; in Nicosia, it is 85 percent, the highest of any European capital. In Madrid, the modal share of cars is below 30 percent. Cities tend to be dense all over Southern Europe, but they have not all achieved the transport outcomes that urbanists associate with density: in this respect, Spain is the outstanding model.

Public policy has played an important role in making this difference. In Britain and the US, the government develops the main arterial roads and allows development that follows the development control regulations, which results in fragmented urban forms (in terms of plot sizes and types of development). In Spain, the authorities undertake land re-adjustments like the Town Planning Schemes of Gujarat and thereby lay down clear boundaries and forms of development. 

This also means a high level of infrastructure development with a high density of roads, based on plans that connect streets and localities to promote pedestrians and cyclists.

This has yielded cities with exceptionally good infrastructure. About 28 percent of Madrid’s surface area is taken up by roads, almost exactly the 30 percent recommended by UN specialists. This compares to 21 percent in Paris, 19 percent in London and 20 percent in New York. Even Los Angeles, a famously road-heavy city, uses only 25 percent for roads. As we have seen, these roads are also more skilfully interconnected, which is indispensable for pedestrians and cyclists

A large road network has not detracted from policy focus on public transport. 

Despite having far superior road infrastructure, Spanish cities also have high public transport use. Around 60 percent of trips in the Madrid metropolitan area and over 70 percent of trips in the Barcelona metropolitan area are made through public or active travel, similar to other major European cities and far higher than American, Canadian, or Australian cities, which typically fall below 30 percent. In other words, Spanish cities have Los Angeles-tier road infrastructure and Paris-tier public transport access. This is paired with some of the continent’s best intercity transport. Spain has significantly more motorways than any other European country: 17,228 kilometers, versus 13,183 in Germany and 11,671 in France. It has the second-longest high-speed rail network in the world, after China.

In fact, public policy played perhaps an even more important role by keeping infrastructure construction costs low and ensuring construction was done within budget and without delays. It was able to utilise something like €200 billion in cohesion funding received from the EU between the late 1980s and 2020. 

More importantly, Spain kept costs low… Spain, combined with its non-EU injections, built 4,000 kilometers of high-speed rail, 10,000 kilometers of motorway, and numerous metros, trams, ring roads, and radial arterials, because it kept costs extremely low. It did this by maintaining good practice: flexible environmental rules (although these have since become more problematic), top-tier in-house capacity in engineering and contracting, a commitment to a steady pipeline of projects over decades, and, above all, rapid decision-making, avoiding the costly delays and redesigns common elsewhere. Another part of this was giving small areas the power to decide on and fund infrastructure, like the Madrid Metro, avoiding the ping pong between authorities seen in some high-cost countries. 

Together, this has allowed it to build metros more than 20 times cheaper than in New York City. For the price of one mile of the New York’s Second Avenue Subway extension, Spanish builders covered the entire 35-mile 1995–1999 expansion of the Madrid Metro. As a result, Spanish transport infrastructure is both abundant and cheap. Madrid’s metro underwent one of the fastest growth spurts in the worldbetween 1995 and 2007, adding around 203 kilometers of new lines to its already impressive footprint​. Barcelona has been continuously expanding its metro network since the Second World War: in a period of astonishing activity between 1990 and 2010 there were 18 separate extensions, and seven more since.

Cities including Valencia, Bilbao, Seville, and Málaga all built metro or light rail systems in the 1990s and 2000s. Madrid and Barcelona have both joined their old suburban rail lines up into Cercanías/Rodalies systems, similar to London’s Crossrail scheme but far more comprehensive (though not always well run). The upshot of this is that, despite having some of the world’s best road infrastructure, Spain still has relatively low levels of car use and ownership: the modal share of driving is low not because driving is a bad option, but because other options are so good.

Since the late 2000s, changes in laws placing a series of restrictions on buildings have adversely impacted Spanish urban planning. For example, before 2007, Spanish land was buildable by default; the same was inverted to allow housing construction only if specifically zoned by the local council. Today, in an emulation of the planning practices followed in the US and Europe, building in Spain has become extremely restrictive. 

Planning a major Spanish urban extension now depends on agreement from the municipality, the community (the regional government), the landowners, and, individually, each of the environmental, water, roads, electricity, public transportation, and social housing authorities. The result is that creating new city plans now takes an enormously long time. Creating the plan takes between six to eight years, while designing the streets and plots takes another three to seven… This is leading to high prices. Madrid asking prices are now nearly €6,000 per square meter, and Barcelona over €5,000, above Hamburg, Berlin, Frankfurt, Brussels, Milan, and Rome… But Spanish wages are low… This has left leading Spanish cities with some of the worst house price to income ratios in Europe.

Spain offers important lessons for cities in developing countries like India. Spain’s late development means that its experience has even greater relevance for us. 

Spain's cities are unusual not on any single dimension but on the combination - density, mixed use, mid-rise (not high-rise) apartments, walkability, cheap and abundant transit, high car ownership but low car use, infrastructure preceding development, and municipally planned street grids. Spain is unique in getting all the dimensions right. 

Indian cities, from metros to the lower-tier ones, are characterised by a far lower share of multi-tenement units, rigid land-use restrictions, high setbacks, poorly maintained or absent footpaths, infrastructure coming well after habitations emerge, and sorely deficient mass transit facilities (especially bus networks). 

In India, exclusive land-use zoning is the norm, with mixed-use permitted only beyond generally 15-18 m roads and above, which are present in a very small proportion of the localities. In the older areas, commercial facilities in residential areas have emerged informally over time, whereas in the planned colonies and new developments, mixed use is restricted. 

Indian cities have among the lowest share of urban households living in multi-tenement units, with Spanish cities being at the other extreme. Only 31% of urban Indian households live in flats (NSS 2018) compared to about 80% in Spanish cities, with Mumbai being the exception. The India NSS “flat” includes chawls, single-storey shared tenements, and informal walk-ups - so Indian numbers overstate what a Spaniard would recognise as a flat.

Similarly, Indian cities have among the lowest share of road network, not even a third of the UN Habitat norm. Most Indian metros are 6–12%, with only Delhi, the only Indian city with municipally planned extension, getting close.

I can think of at least a few big takeaways. Foremost, there’s no alternative to mixed-use, densified development for both greenfield and brownfield areas. 

Given its high share of detached housing, Indian cities have a great opportunity to reinvent themselves. This can be done by increasing FAR, and more importantly, doing it in a manner that allows upzoning adjacent to 9 m and 12 m roads. As I blogged here, the current upzoning deregulation, confined to plots with road width greater than 18 m, is largely superfluous. 

This must be coupled with planning norms like allowing for relaxations of setbacks, even dispensing with them and encouraging row housing, multi-tenement units, and mixed-use in terms of encouraging commercial amenities. The latter is about ensuring that people living in a locality should be able to buy their regular groceries and other household items and services from within there. Further, the local government fee and property tax regimes must consider lowering the layout development charges, building permission fees, and property taxes to encourage the realisation of these objectives. 

These policies and instruments must be deployed with a long-term perspective (as against expectations of immediate results). The objective should be that they would shape incentives and enable the gradual redevelopment of brownfield areas as densified communities. 

Second, we must use urban planning to lay down street network configurations that enable connectivity and walkability. Master plans and their development plans should keep this in mind. Minimising or even eliminating setbacks would be one step to enable such street networks. The prioritisation of walkability requires the infrastructure of footpaths and street connectivity to be able to walk, and the supply in terms of mixed-use amenities to create the demand. And all this must be combined with local campaigns to promote the culture of keeping footpaths free of encroachments. 

Third, the current dominant trend across Indian cities of the emergence of gated communities in the suburbs must be examined. These communities, while attractive for their residents and developers, go against all principles of sustainable urban development. These are largely monocultures of upper-middle and higher-income housing (the maids and drivers, and others, commute from distant places), with exclusive residential zoning, limited or no mass transit connectivity, exclusively car-based, and very poor external street connectivity (large gated enclaves with one or two entry/exit points). They impose massive negative externalities on the city and locality, while appropriating all the benefits. 

Fourth, mass transit must be at the core of all developments. All greenfield areas, in particular, must be planned around mass transit, in the form of transit-oriented development (TOD). This post discusses some principles for TOD in Indian cities, and this post outlines some of the challenges. This would require going beyond the current norm of merely giving higher FAR and offering significant incentives on fees and taxes to make it more attractive for developers to build inside the TOD zones. 

Like in Spain, the challenge is to get the combination more or less right. The good thing is that all of them lie with the states and mostly with the cities themselves. It is only required for 2-3 cities to take the lead and strike out on their own in following these principles and reinventing themselves. They can be the lighthouses that guide urban development in India. 

Wednesday, July 15, 2026

Higher FARs, but very few plots can avail them

Many state governments in India have issued executive directions increasing the permissible Floor Area Ratios (FARs) in their cities. However, these upzoning reforms are likely to struggle to meet the objective of densification due to restrictive conditions to avail the increased FAR. Specifically, three gate-keeping elements - minimums on road width and plot size, and a maximum on height - leave the upzoning reforms largely stillborn. 

To understand why, we need to keep in mind the street layout of the typical Indian city. The colony street widths are typically 9 m (30 ft) or less, and at best 12 m (40 ft). Even the connecting roads are no more than 12 m. In any city, a very small proportion of properties, and an even smaller proportion of residential land use, will have road widths greater than 9 m. Only the arterial roads, which are in any case mostly commercial and higher-valued, are above 12 m.

A comparison of upzoning reforms across the ten biggest states reveals some interesting insights. For a start, the upzoning itself is generally marginal, and even where significant, the higher FARs can be realised only on wider roads. In simple terms, the upzoned FAR apply to a tiny minority of parcels - greenfield layouts and edge plots on arterial roads. Every state except Gujarat, UP (individual) and Haryana (small plot) sets the FAR uplift threshold above 12 m - typically 18 m, 24 m or 30 m. But even for the three, the uplift is marginal and only for a few categories of properties. Also, none of the three touches group housing or vertical redevelopment on narrow-road plots.

Further, plot size and setbacks compound the problem of a minimum road-width gate. Even where a 12 m road technically qualifies, high-rise / group-housing rules require minimum plot sizes of 750–2000 sqm and setbacks of 6–12 m. In existing settlements, individual plots average 60–150 sqm, and assembling five to twenty of them is legally and commercially nearly impossible without a TDR/land-pooling instrument. Even then, practical challenges are daunting.

This also means that even the TOD zones cannot benefit from the upzoning. In existing town cores, which are where TOD catchments actually sit, FAR reform delivers almost nothing until the road-width and plot-size gates are lifted or bypassed. 

In other words, the upzoning reforms largely bypass the built-up city and are relevant only to the greenfield areas. In these areas, the uplifts linked to higher road widths end up benefiting only the large developers. They, in turn, build high-rise gated communities of higher-end housing, mostly unconnected to mass transit and with multiple car-users in each household. Ironically, this also ends up expanding the sprawl, flooding the roads with cars, thereby worsening traffic and increasing pollution.

On the other hand, it does nothing for the smaller developers who are likely to develop affordable mid-rises (say, 6-12 floors) inside the existing colonies. Instead, they end up constructing low-rises (up to 4-5 floors). Further, the unit economics given high land prices mean that even these low-rises gravitate towards the suburbs. 

It is these mid-rises that are likely to contribute meaningfully to expanding supply and addressing the affordable housing problem. Unless the upzoning covers the 9 m road width and smaller plots (which make up the vast majority of the potential developable properties in any city), there cannot be any significant impact on housing supply and the affordable housing problem. 

Further, to realise the full potential of such upzoning, it must be complemented with sharply increased mass transit services, especially buses, that cover these colonies. The quality, frequency, and connectivity of the bus network must be high enough to induce people to shift from car usage.

Saturday, July 11, 2026

Weekend reading links

1. FT long read on how senator Deborah O'Neill, as chair of the Parliamentary joint committee on corporations and financial services, has single-mindedly exposed and brought the knees the Big Four auditing and consulting firms in Australia. 
Deborah O’Neill has led the charge against KPMG in Australia over a client confidentiality scandal that prompted the departure of the firm’s chair, chief executive, chief operating officer, audit leader and a senior partner over the past month... comes on the heels of a similar implosion at PwC. The rival Big Four firm came unstuck when a data leak led to the exit of senior management... An EY employee was charged with accessing the bank details of Prime Minister Anthony Albanese while working on contract at Australia’s biggest bank. Meanwhile, Deloitte partially refunded the Australian government after admitting that it used AI to compile a report...
In 2023, the Labor senator forced the publication of emails that implicated PwC partners in the tax leaks scandal. PwC partners were caught sharing secret government tax plans that one of them had obtained from his work on an advisory board in Canberra, in the hopes of winning business in the US. This year O’Neill used parliamentary privilege to air allegations made by a KPMG whistleblower that had been inadequately investigated by the firm. KPMG has now been exposed as having used confidential information from existing audit clients to try to win new business from rivals — some from PwC as its audit customers looked to switch in the wake of that firm’s woes...

She entered parliament in 2010 having spent her career in education. O’Neill soon discovered that some Big Four consultants acted like some of her former pupils — copying the answers from the back of the book and then marking their own work, as she puts it — and used her role to put the leaders of the firms under pressure.
2. Soumaya Keynes points to a fascinating study by Rebecca Diamond of Harvard University of the use of GLP drugs that appears to show increased confidence and employment rates among women in the US. The study finds, using data gathered between 2021 and 2023, that the poorest third of women in the US suffered an obesity rate 14 percentage points higher than the richest third, whereas the gap was negligible for men. 
The study's main findings:
After 18 months, women using GLP-1 drugs who start off without a job enjoy employment rates 27 percentage points higher than otherwise similar non-users. Women who start off with a job see their employment rate fall slightly, and although the data is too noisy to pick out effects on their earnings, it looks like their household income rises by 10 per cent. That second effect is a bit surprising, and possibly explained by parallel developments in these women’s love lives. Diamond estimates that GLP-1 drugs give single women a dramatic 29 percentage point increase in their chances of coupling up. On average, their new partners are richer than them, giving their household income a bump. Which could explain why a few of the women losing weight then feel able to drop out of work.
The study also points to a more disturbing consequence.
So far at least, GLP-1 drugs are disproportionately used by the rich. In Diamond’s study two-fifths of the women paid for the drugs out of pocket, at a median cost of $275 a month. Research based on Voy prescriptions shows how, adjusting for relative obesity rates, uptake is skewed towards more affluent areas. If obesity becomes an even stronger signal of economic disadvantage, the stigma attached could grow.

3. The rise of London's King's Cross area as perhaps Europe's AI capital.

Two decades ago, King’s Cross was central London’s most neglected district. Today, it is home to the main foreign outposts for several of the world’s wealthiest companies, from Big Tech giants Google and Meta to their richly funded AI challengers including OpenAI, Anthropic and Jeff Bezos’ Prometheus. AI researchers and entrepreneurs are packing out the area’s canal-side cafés so densely that venture capitalists prowling for their next deal are struggling to prevent their coffee meetings from being overheard by rivals.
For many, this resurgence can be traced back to one individual: Sir Demis Hassabis, the DeepMind co-founder and Nobel laureate who stayed in London to build his AI lab following its sale to Google in 2014 for £400mn. “Demis keeping DeepMind in London and resisting the gravitational pull of [America’s] West Coast is the most important thing that has ever happened to the London tech ecosystem,” says Tom Hulme, a tech investor at Alphabet’s GV venture capital unit... Just as PayPal helped launch the careers of a generation of Silicon Valley founders and investors including Elon Musk and Peter Thiel, a “DeepMind mafia” in London is pulling in billions of dollars to AI start-ups founded by Hassabis’s former lieutenants, including David Silver’s Ineffable Intelligence and Tim Rocktäschel at Recursive Superintelligence...
It was Hassabis’s pursuit of an “artificial general intelligence” capable of scientific research and a wide range of human tasks that in many ways kick-started the current AI boom. DeepMind’s sale to Google prompted Elon Musk to set up a research lab to counterbalance the internet group’s dominance of AI; that lab was OpenAI. DeepMind went on to make a series of AI breakthroughs including AlphaGo, which in 2016 beat the board game Go’s world champion Lee Sedol, and AlphaFold, which used deep learning to predict protein structures with superhuman speed.

King's Cross has emerged as the Canary Wharf of tech in UK, and this description is apt and underlines the continuing importance of personal interactions and connections. 

The density of AI talent in King’s Cross was why the government’s scientific research agency Aria took a “very conscious decision” to base itself there rather than Whitehall, says Pippy James, its deputy chief executive. “We were definitely inspired by Kendall Square in Boston,” she says, referring to the area surrounding MIT where Google, Microsoft and Amazon, as well as biotech companies Moderna and Novartis, have offices. “Value creation comes from those serendipitous collisions.” In recent weeks there has been a steady stream of American AI companies announcing moves into the area. OpenAI and Anthropic have signed leases for tens of thousands of square feet in King’s Cross. Others moving in include Bezos’s “physical AI” company Prometheus, Cursor, the AI coding company that recently agreed a $60bn sale to SpaceX, AI agent group Perplexity and open model developer Reflection. Google, which already has many researchers and engineers in the area, plans to start moving staff into its vast new “Platform 37” office this summer after almost a decade in development.

4. This is a striking factoid about the importance of chips now. 

With SpaceX going public, the list of the 10 most valuable US public companies is entirely made up of tech companies for the first time. Of those, three are semiconductor specialists. But with chips a key ingredient in AI, the other seven are also now all designing their own chips.

Some stats about the global chip squeeze.

... Elon Musk’s xAI to rent out spare capacity in its data centres. In recent weeks, Anthropic, Google and start-up Reflection AI have agreed to pay a total of around $2.3bn a month — or $28bn a year. This looks like a big return on Musk’s data centre investments. As of March this year, xAI’s total capital spending over its lifetime totalled $26.5bn... this surge in demand has already prompted a huge increase in supply, both of planned chipmaking capacity and newly minted chip stocks. One sign is the $600bn that memory chipmakers Samsung and SK Hynix said this week they plan to invest in Korea. Another is the $29bn that SK Hynix hopes to raise when its American depositary receipts begin trading in the US next week... TSMC has said it will boost its capital spending by as much as 37 per cent this year, as it did in 2025. But those increases follow two years of retrenchment and would leave 2026 capex only around 50 per cent higher than 2022. Contrast that with the biggest buyers of AI chips. Seven of the largest data centre operators are planning to spend an astounding $848bn this year, at least five times what they spent in 2022, according to a calculation by the newsletter Exponential View.

5. On the new bonds issued by SpaceX.

The bonds enjoyed very robust demand at the point of issuance, but some see that as a problem in itself. Allianz’s chief investment officer has described the market’s willingness to hand money over to Musk as a clear sign that we have moved from “a healthy boom, a stretched boom . . . into bubble territory”. Ominously, the bonds have weakened since they launched.

6. The AI LLMs scorecard

Where will Sarvam stand?

Also national scorecard.
7. The low-margin business of mobile phone assembly. Amber Industries which makes air conditioners for eight of the top 10 brands and more than a quarter of all ACs made in the country, now proposes to assemble smartphones for Oppo. 
Now, the company plans to sub-lease a part of Oppo India’s factory in Noida, set up SMT lines, and start assembling phones there... But smartphone assembly is one of the toughest businesses in electronics manufacturing... The target is to eventually assemble about a fifth of Oppo India’s volumes, scaling from roughly 8 million handsets in the first year to nearly 15 million in the second... Amber expects Ebitda margins of 1.5–2%, excluding benefits from the government’s production-linked incentive (PLI) scheme. That’s well below the 8.8% Ebitda margin generated by its broader electronics business in FY26, and the 7.1% operating margin recorded by its AC-heavy consumer-durables segment... Take Dixon, for instance. The company already accounts for nearly one-fifth of India’s smartphone output. Even at that scale, smartphone assembly, aided by PLI incentives, generates Ebitda margins of only about 3%.

8. AI boom compared with historical episodes.

9. On the rise of non-compete clauses in OECD countries and their adverse impact on productivity.
About 30 per cent of employers surveyed by the OECD said they had increased their use of the clauses in the past five years... It estimates that a 10 percentage-point increase in the prevalence of non-compete clauses in an industry was associated with a 1.9 per cent decline in the level of labour productivity, with workers stuck in sub-optimal jobs and firms less able to gain new skills. In many countries, non-competes have spread into parts of the labour market where the original justification of protecting sensitive information and firm-specific information is “weak or absent”, the research found, pointing to their use among entry-level fast-food staff in the US, manual workers in Italy and childcare workers or yoga instructors in Australia.

10. The market concentration in DRAM chips.

A market in which a monopolist owns 100 per cent gets an HHI of 10,000, a duopoly scores above 5,000, and a perfectly competitive market approaches zero... The US DoJ considers anything between 1,000 and 1,800 points to be “moderately concentrated”. Per Counterpoint Research, as of the first quarter of 2026 the memory market is 38 per cent Samsung (South Korea), 29 per cent SK Hynix (South Korea), 22 per cent Micron (US), 8 per cent CXMT (China), 2 per cent Nanya (Taiwan), and 1 per cent everyone else. This gives us an HHI of 2,838... Both Samsung and SK are two of Korea’s largest conglomerates (the so-called chaebols) which benefit from cosy relations with the state, so viewing them as fierce competitors in the same memory market might be wrong-minded in this case... And if the two companies function as a single economic entity in the global DRAM market, we should probably count them together for HHI purposes. And doing this we get a much higher HHI reading of 5,042. That’s above 5,000 —the HHI of a perfect duopoly.
11. China’s excess capacity in manufacturing requires something similar to what was done by the former Prime Minister Zhu Rongji

In the late 1990s and early 2000s… under Zhu’s slogan of “zhua da, fang xiao” or “grasp the large, let go of the small”, Beijing retained its grip on key strategic industries while relinquishing control of a vast sea of smaller companies and factories…Thousands of mines, steel mills and other industrial sites were shut for good. An estimated 30mn to 40mn workers lost their jobs. The process was deemed painful but necessary: not only in setting up China’s accession to the World Trade Organization in 2001, but in freeing Beijing from supporting uneconomic industries… 

Over the past 15 years, as China’s share of global manufacturing surged to around one-third, the share of lossmaking industrial businesses jumped from about 10 per cent in 2010 to nearly 25 per cent last year, according to the MERICS China Overcapacities Monitor. This dynamic exists across everything from steel and cement to cars, computer chips and robots. Take the automotive sector for example. Domestic car sales last year totalled 23.9mn against estimated production capacity of 45mn to 50mn. Sales are highly concentrated among a clutch of leading companies. According to HSBC, more than 70 per cent of EV sales — including plug-in hybrids — are being soaked up by 10 brands, leaving 47 others jostling for the remainder. In the shrinking market for petrol and diesel cars, 10 brands have about 70 per cent of sales and 73 others compete for the rest.

12. South Korean capitalism and windfall profits sharing - SK Hynix and Samsung edition.

Soaring global demand for high-bandwidth memory chips used in AI systems has propelled SK Hynix and Samsung Electronics to record earnings. This week Samsung announced quarterly operating profit of Won89.4tn ($59.7bn). The windfall is being shared with employees. Last September, SK Hynix agreed to pay workers 10 per cent of annual operating profits for a period of 10 years. Samsung followed with a similar arrangement in May after its union threatened strike action. With both firms expected to earn hundreds of billions of dollars this year, average bonus payouts per memory chip worker could reach about Won600mn ($400,000) at Samsung and even more at SK Hynix. Such amounts are staggering in a country where the average worker earns Won50.6mn per year, according to Korea Enterprises Federation data. 

The Bank of Korea has warned of potential inflationary pressure as a result, and towns where many semiconductor workers live are undergoing property price jumps. Competition is intensifying for places at universities offering semiconductor “contract” programmes that guarantee jobs at Samsung Electronics or SK Hynix upon graduation. Admission scores required for some such courses now exceed the average for natural sciences at Seoul National University, the country’s top-ranked university, and are just below those needed for medicine... The boom is also reshaping Korea’s marriage market. Matchmaking agencies, which are known for using meticulously harsh metrics to rank clients, are now giving higher points to chip workers.

13. Data centres are consuming massive amounts of power and water.

Data hubs already devour more electricity globally than all but 10 countries. About 448 terawatt hours last year if you’re interested. The AI boom means that amount is on track to roughly double within four years... By 2030, they could be using enough water to meet the basic needs of all 1.3bn sub-Saharan Africans for a year, UN researchers estimate.

And it is provoking backlashes. Sample this from the US.

An unprecedented 75 US data centre projects worth around $130bn were blocked or delayed in the first three months of this year, nearly as many as in the whole of 2025, says the Data Center Watch research group. It reckons active opposition group numbers have grown from 396 at the end of 2025 to 833 by the end of March.

14. The Strait of Hormuz squeeze was not as bad as earlier episodes. 

15. Transformers are at the heart of power transmission, distribution, and use. Thanks to the AI and data centre boom, transformer prices have gone over the roof.
Specialist electrical steel — essential for transformer cores — is produced by only a handful of global suppliers, many of whom are struggling to keep up with the surge in demand. Market growth, price volatility and limited mining capacity have also strained supplies of copper, crucial to the conductivity of windingsaround a device’s core. But one of the most acute bottlenecks is the shortage of skilled workers needed to carry out complex, labour-intensive manufacturing tasks...
With up to 80,000 different designs, most transformers still have to be built largely to order, taking three to six months to make. The most demanding stage is the windings, when copper wire is applied around a transformer’s core — a “beautiful” process, according to Bruno Melles, an engineer now leading Hitachi’s global transformer business. Each winding is unique and is “still a human manual activity that we’re very proud of”, he says. The number and pattern of these windings dictate voltage — fewer turns lead to lower voltage while higher-voltage devices can have multiple windings stretching hundreds of kilometres. Once complete, the assembly is placed in a protective outer metal shell, where oil acts to insulate and cool the device...

The world’s biggest transformer manufacturers have reported tens of billions of dollars in backlogs in the first quarter of 2026... US developers are turning to imports. The EU, Mexico, South Korea and Brazil are the biggest suppliers of power transformers to the US, together accounting for more than three-quarters of imports by value last year.

Into this mix come innovations in the form of modular solid-state transformers that use modern power electronics and respond dynamically to changing power needs, enabling real-time monitoring and control (which legacy transformers with their steel and copper cannot do). 

Friday, June 5, 2026

The challenges with TOD implementation in India

Transit-Oriented Development (TOD) remains an elusive urban planning goal for India despite nearly two decades of efforts. I blogged on TOD implementation in India here

In simple terms, TOD is about minimising commute times, ideally by locating both homes and workplaces within walking distance of mass transit stations, or at least one location within walking distance.

This would entail crowding in high-density residential, office, commercial, and institutional developments around the station. This requires making it attractive for developers to prefer building within the TOD influence zone, despite its much higher land costs.

There are perhaps four big failings with the TOD policies over the years. 

1. The biggest problem is that metro and commuter railway projects are primarily seen as infrastructure projects and only distantly as opportunities for urban development and economic growth. This is manifest in the limited involvement of the municipal corporations in their design. TOD is planned and executed mainly by the transportation entities without adequate ownership by the local governments. 

The railways, Road Transport Corporations (RTCs), mass transit entities, state governments, and Urban Development Authorities (UDAs) view TOD primarily as station-based real estate development opportunities that lead to monetisation and revenue mobilisation. A second consideration is to increase housing supply. The UDAs tend to view TOD as an instrument to develop or monetise their own lands, mostly to increase housing supply. 

The idea of minimising commute times is rarely explicitly considered as an important factor. 

2. Policymakers have internalised a belief that the attractions of connectivity and higher (this too is mostly marginal) FAR are sufficient for developers to choose TOD influence zones. 

But, as I blogged here, this assumption is seriously flawed. The global experience on TOD clearly points to the need for fiscal concessions to make it attractive enough for real estate development in the pricier TOD influence zone.

Given the higher land costs in TOD zones, the case for fiscal incentives to offset them and attract developers should be obvious. A TOD policy can therefore be effective only if the conflict between the objectives of minimising commute times (or densified development around stations) and maximising revenues is resolved in favour of the former, at least in the initial years

Planning officials are averse to dense high-rises. Bureaucrats are averse to foregoing revenues. Taken together, we have a TOD gridlock. The common ground is mid-rise residential property development where government lands are available around transit stations. This is the reality of TOD in India. 

3. By its very nature, there cannot be a uniform TOD policy with tightly prescribed norms on use categories. However, governments (especially UDAs), struggling with the problem of housing, tend to view TOD primarily as an instrument to address housing problems in cities. This creates a pronounced bias towards housing in TOD zones. This, too, is a seriously flawed assumption. 

The proportion of the different use categories varies across stations. So, for example, the vicinity of a large metropolitan downtown station would be more suitable for predominantly institutional and office uses, whereas that around a smaller suburban node would be suitable primarily for residential and commercial uses. This would allow the satellite nodes to grow by feeding off the metropolitan node, and the latter to decongest and grow sustainably. A prudent policy choice, therefore, may be to leave it to the market to decide the proportions of different uses within the TOD zone depending on the strengths and opportunities of each node. 

4. TOD demands a high level of coordination among different government agencies. But it is a daunting challenge to coordinate across the universe of stakeholders involved in TOD - the municipal corporations, the UDAs, the RTCs, the metro or commuter rail SPVs, and Indian Railways.

This is best illustrated with modal integration - the seamless integration across the different modes of transport at a station, including ticketing - an essential requirement for TOD. This has proved elusive despite numerous serious efforts. Further, because each view focuses on real estate development and revenue mobilisation (or housing), and overlooks the primary objective of minimising commute times, their incentives pull in different directions. 

Even something as apparently simple as the integration of the facilities of distinct metro, commuter rail, IR, and RTC in one station becomes a challenging exercise. Their physical integration as one unit to share and optimise space and services can be a bureaucratic nightmare. Instead of planning and developing the area as an integrated unit, each entity pursues its priorities with limited synergies.

There are no easy answers here. When a problem has proved elusive for a long time, a good starting point would be recognition of its complexity and piloting it. It may therefore be prudent to focus on implementing TOD at 1-2 stations in a bespoke manner. 

What would be the nature of a TOD (the mix of categories of developments) appropriate for the station? What package of interventions and incentives would be sufficient to attract private developers to invest in the TOD influence zone? What governance arrangement can get all stakeholders on board at a high-enough level to ensure effective coordination? 

Monday, June 1, 2026

Implementing TOD in India

I have blogged here outlining nine low-hanging fruits in urban planning, here on the use of land value capture instruments, and here on TDR trading platforms. This one examines why transit-oriented development (TOD) has not worked in India and what could be done. 

TOD is about densifying a defined neighbourhood around a transit station to minimise commute times. It would encourage people to use the mass transit system to commute between their offices and homes. TOD is especially relevant in the context of railway stations. 

Globally, many cities owe their expansion to TOD. London and Mumbai are good examples. I used Claude to extract the schematic maps conveying TOD developments in commuter railway stations around London and Mumbai over the 1991-2011 period. 

This is the London map for a longer 1991-2021 period.

The Mumbai map draws from the Marron Institute’s Atlas of Urban Expansion, and the London map uses the ONS census visualisations. 

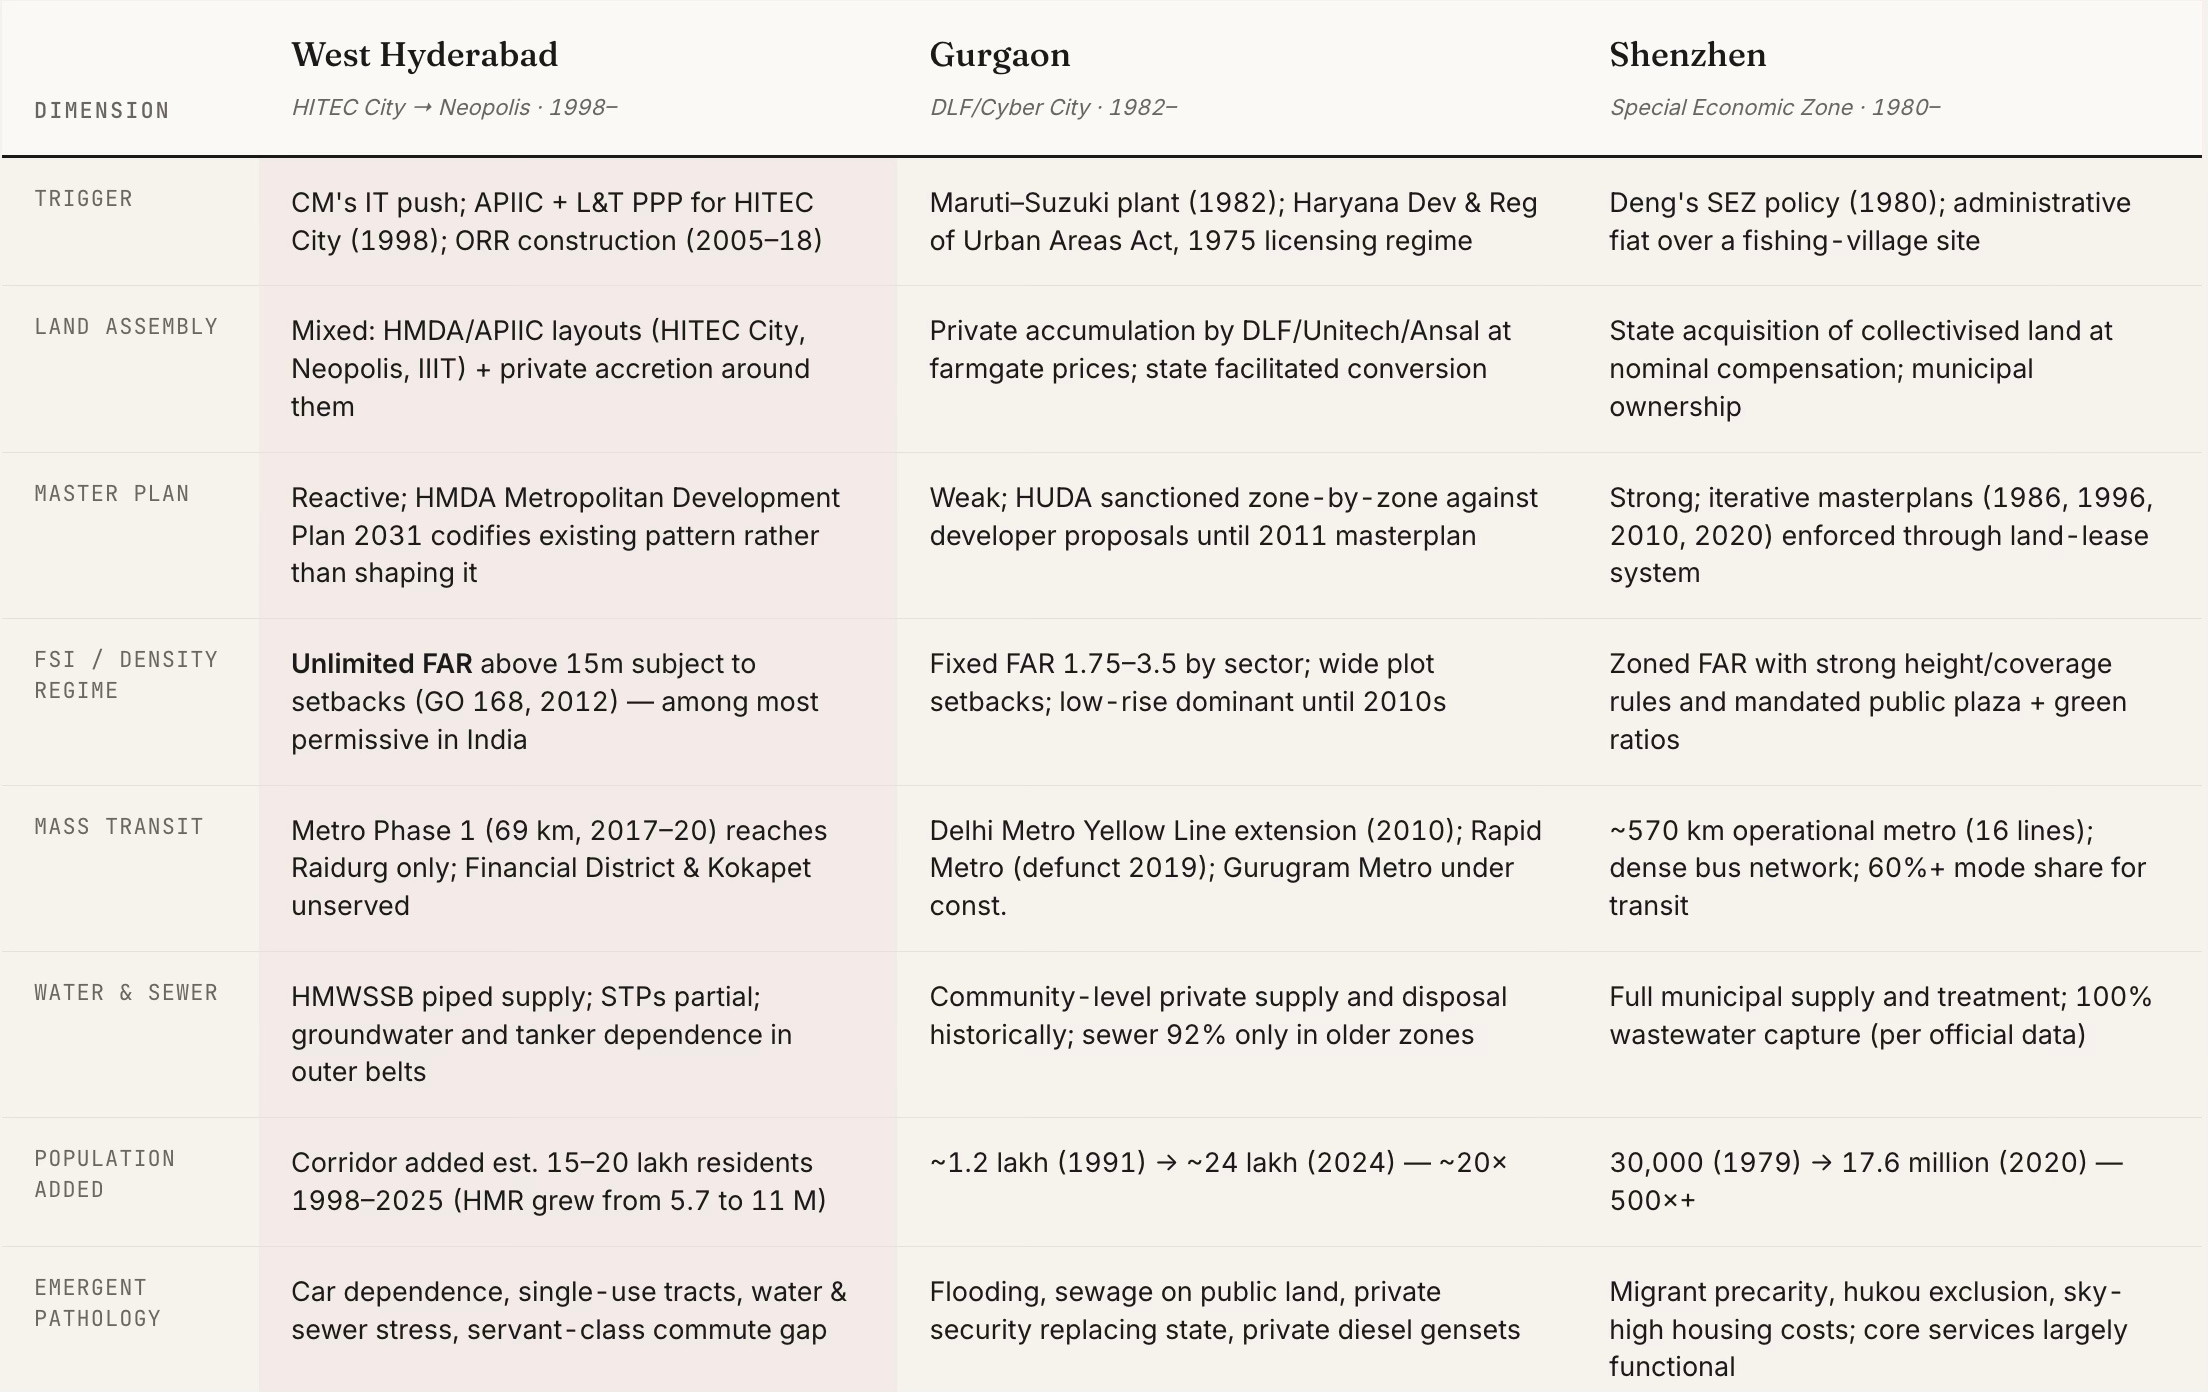
Despite several efforts for nearly two decades, Indian cities have struggled with TOD. The only genuine integrated mixed-use station-centric development in India is Gurgaon’s DLF Cyber City + Cyber Hub + Rapid Metro (125 acres, ~15 million sq ft of office, 400,000 sq ft of F&B). The Gurgaon Rapid Metro is itself a private TOD example (built by IL&FS/DLF), covering 12.85 km and 11 stations. Both were built privately by DLF and IL&FS, predating the 2016 TOD policy by years, and the Rapid Metro became financially unviable and had to be taken over by HMRTC in 2019. The MGF malls at MG Road station, Sector 29 at HUDA City Centre, and the Golf Course Road density are all pre-existing development that happens to lie near a metro — co-location, not coordinated TOD.

A fundamental problem with TOD Policy formulation is the assumption that higher FAR, coupled with the benefits of living or working adjacent to a station, will by themselves translate into utilisation. In other words, it is assumed to be sufficient enough incentive for builders and home buyers to choose the TOD zone over its neighbourhood and elsewhere. Unfortunately, this is rarely the case. 

Worse still, governments tend to view TOD as also a large revenue generation opportunity from the flush of property developments. The combination of registration fees (in case of purchases), layout development fees, purchaseable FAR rate, building permission fees, etc., adds prohibitive cost layers for developers and buyers. They prefer to develop and buy elsewhere. The normalised expectation of high revenues also prevents governments from considering providing concessions. A gridlock ensues.

So how do other countries promote TOD?

The Tokyo region offers double or even triple FAR in TOD zones, and allows FAR transfer from adjacent lower-value land parcels. Most importantly, the zones have no development fees, with local governments recovering value through land appreciation and property tax growth, not upfront levies. MTR in Hong Kong also offers much higher FAR and does not levy any development charge, and even gives the land to the developer at pre-rail land values. Singapore has URA White sites where land use is left flexible, apart from a much higher FAR. The purchasable FAR rates are waived or significantly reduced. Additional FAR and no parking minimums in the US allow developers to build significantly more in the zones, especially for affordable housing. Australia allows FAR several multiples higher, fast-tracks permissions, waives off infrastructure levies for affordable housing, and even has lower property tax assessment. 

The common thread across all of these is that governments provide a package of benefits in the TOD zone. It always combines higher FAR (making more revenue possible per unit of land cost) with lower upfront charges (reducing the cost stack) and faster approvals (reducing holding cost and uncertainty). The Japanese and Hong Kong models go furthest by making the TOD zone not just more permissive but more profitable than any suburban alternative.

So what can cities in countries like India do?

Fundamentally, the objective of any TOD Policy should be to ensure that it makes building in the TOD zone more attractive than outside or elsewhere. 

Apart from higher land values, the TOD zone suffers from several other disadvantages - less likely to have larger vacant plots, more likely to be congested, noisier, and so on - that make them less attractive compared to their surroundings or the suburban areas. Besides, the surroundings of stations are not perceived as desirable residential locations. 

In the circumstances, there must be a significant incentive to crowd-in development into the TOD zone. Such incentives come from both urban planning instruments and fiscal concessions. Apart from additional FAR, the former could include a higher base FAR, a lower price for purchasable FAR, higher TDR loading, and a more generous TDR conversion rate. Fiscal concessions could include lower stamp duty, layout development fees, building permission fees, and property taxes. If there is a betterment levy or impact fees, the same may also be discounted for those desirable developments (like high-rise buildings). These benefits could be limited to developments initiated within a certain period.

This would also require a shift in the way governments view TOD. They should prioritise the development of the zone over the maximisation of revenues. In fact, foregoing current revenues to harvest future revenues should be the mantra. The foregone revenues would be offset within a few years by those from the economic activities triggered by the developments. 

In other words, the strategy should be to first crowd-in a critical mass of developments that is sufficient to sustain future development. Till this happens, revenue realisation should be strictly subordinate. This is especially required in the large Indian cities, which have poor urban planning and a culture of sprawling suburbs. 

The timing of TOD adoption is also important. The best time to initiate TOD is just before the project work starts, when land values are lower, and the market is being catalysed. The marginal response to incentives is likely to be much greater in the initial stages when property prices too have not gone over the roof. 

It may be useful to experiment in a few bigger cities by picking one or two locations (those with sufficient developable land) and providing a package of incentives for a period of 3-5 years. At the risk of repeating, the package should be designed keeping in mind the need to make the TOD zone significantly more attractive than its surroundings.