The market reaction to Kevin Warsh’s second FOMC meeting decision to stay the course on interest rates despite rising inflation has triggered a debate on the Fed’s credibility in fighting inflation.
This is how the $31 trillion US Treasury market reacted.
Long-term government borrowing costs shot higher as Mr. Warsh spoke, with the 30-year bond notching its largest one-day increase in more than a year. Trading around 5.22 percent, it is at the highest level since 2007. The 10-year Treasury yield, which serves as the benchmark for borrowing costs around the world, also rose alongside expectations about inflation over a longer time horizon.
Warsh has made it clear that he does not agree with the policy of forward guidance, and intends to discontinue it. He has argued that forward guidance distorts market incentives and comes in the way of market discipline. This blog is in agreement with it.
The reversal of forward guidance comes abruptly, at a time when market expectations of the Kevin Warsh era are vitiated by the circumstances surrounding his appointment. Markets clearly think that Warsh may buckle down to pressure from the White House or prefer to please it and delay raising interest rates.
In this context, I created the table below that evaluates forward guidance and central bank credibility.
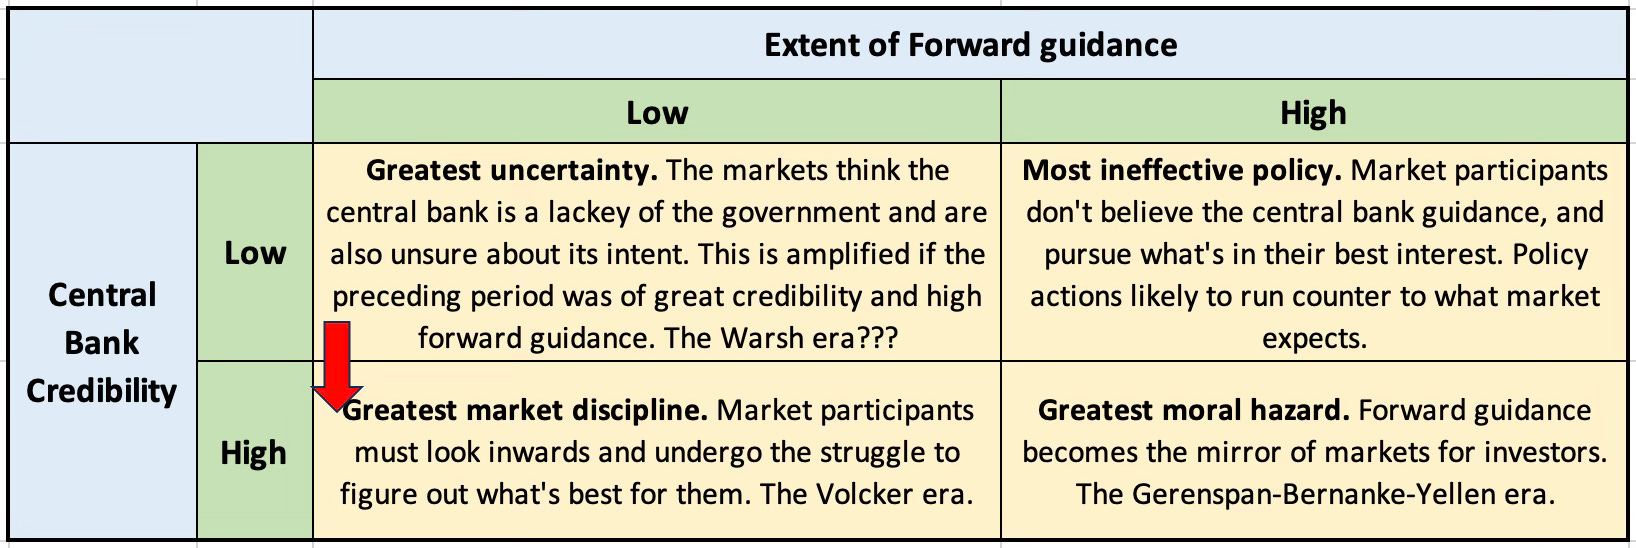
The high credibility and low forward guidance Volcker era is the golden quadrant. The central bank has earned trust through demonstrated willingness to act decisively, but it doesn’t tell you what it’s going to do next. Participants must do their own work to assess fundamentals, price risk properly, and build in uncertainty premia. Volcker’s Fed famously targeted money supply, not interest rates, and didn’t telegraph moves. The result was that markets had to think for themselves, and the discipline that emerged was real. Risk was priced because nobody could assume a backstop.
The Bernanke-Yellen era of high credibility coupled with a high degree of forward guidance ensured that the latter became the market’s mirror. When participants believe the central bank will do what it says, and the central bank tells them exactly what it will do, the rational strategy is to front-run the guidance rather than analyse fundamentals. The “dot plot” era, the “considerable period” language, the “whatever it takes” formulation created a world where the trade was to decode the Fed rather than decode the economy. The moral hazard is structural insofar as investors are rewarded for taking risk they don’t understand because the central bank has told them the floor exists.
The worst combination for policy effectiveness is that of low credibility and high forward guidance. The central bank issues guidance but nobody believes it. Participants pursue their own interests, and policy actions run counter to market expectations. This produces whipsaw where the central bank says one thing, markets price another, and when the policy actually arrives it dislocates rather than stabilises. One could argue the late-stage BOJ falls here (decades of forward guidance that markets progressively stopped believing).
Finally, the Warsh era tries to limit forward guidance but in a period of low central bank credibility, inducing a period of “greatest uncertainty”. Worse still, the transition itself amplifies the shock - moving from a regime of high credibility andhigh forward guidance (the post-2008 consensus) to one where both are removed simultaneously. The question to analyse is whether the Warsh Fed currently sits in the fourth quadrant.
There are four points to be noted.
First, the transition path matters enormously. Moving from the Bernanke-Yellen quadrant (high-high) to the Volcker quadrant (high-low) requires maintaining credibility while withdrawing guidance. This means the central bank must demonstrate through actions (not words) that it will do the right thing even when it doesn’t tell you what the right thing is. The Warsh challenge is that he has withdrawn guidance and may not yet have established credibility through a demonstrated willingness to act decisively against inflation. The risk is that he lands in the bottom-left quadrant (low-low) rather than the top-left (high credibility, low guidance).
Second, while I had blogged here listing forward guidance as an important channel in eroding market discipline, it must be noted that it’s not forward guidance per se that erodes discipline, but forward guidance combined with high credibility. Low-credibility forward guidance is merely useless. And high-credibility forward guidance is actively dangerous because it works too well, by substituting the central bank’s judgment for the market’s own.
Third, there’s a temporal asymmetry in credibility. Credibility is earned slowly (Volcker needed 2-3 years of painful rate hikes) but lost quickly (a single capitulation can destroy it). Warsh’s current position - rates unchanged while prices rise - coupled with the circumstances of his appointment (and the credibility problem it engenders) risks a credibility test analogous to Arthur Burns in 1972-73. If inflation accelerates and the Fed is seen as having waited too long, the move from “low guidance with emerging credibility” to “low guidance with low credibility” could be swift and self-reinforcing.
Fourth, this also highlights the less discussed aspect of policy making that involves shaping expectations. Once collective beliefs are formed and incentives aligned, it is very hard to reshape them. The Bernanke-Yellen response to the market tumult during and after the Global Financial Crisis, guided by the research works of Gauti Eggertsson and Michael Woodford, and Paul Krugman, may well have been required in its immediate aftermath. The mistake was to continue and institutionalise it as part of the regular central bank policy toolkit. Bernanke or Yellen, with their credibility, ought to have exited forward guidance once normalcy was restored. But instead, they chose to please the markets with this new crutch. It is a bit like subsidies - once offered, there’s no sunset.