Substack

Friday, December 31, 2021

A graphical look back at 2021

1. Performance of various financial asset categories over the year - bitcoin tops.

2. US equity markets topped among the major economies.

3. Corporates globally raised over $12.1 trillion in 2021 through loans and capital markets.

The cash raising is 17% up from 2020 and equity issuance at $1.44 trillion is up 24%. The real talking point was the emergence of SPACs.
For the first time ever, more money was raised by special purchase acquisition companies in the US than through traditional IPOs. Issuance has slowed down since a bumper first quarter, but a steady stream of blank-cheque companies — which raise money from investors then seek a company to acquire — have come to market through the final months of the year, collectively raising more than $152bn this year.

Reflecting the froth in financial markets, global M&A for 2021 soared to their highest ever levels at $5.8 trillion, a 64% rise from last year. 

The most egregious manifestation of the times has been the rise of SPACs from being a derisive curiosity to an important contributor to the financial market.
A total of 334 Spac deals — where a company is created to list and merge with a privately held business and bring it to the stock market — were announced, for companies valued at a combined $597bn, or 10 per cent of global deals by value. 

4. Indian markets benefited from the liquidity glut and search for yields. Another positive factor was the re-direction of capital away from China. It was a record breaking year for IPOs in Indian markets

Sixty-three companies raised Rs 1.19 trillion through initial public offerings (IPOs) in calendar year 2021 — a record for any year. This is nearly 4.5x the Rs 26,613 crore raised through 15 IPOs in 2020 and almost double the previous best of Rs 68,827 crore raised in 2017, according to PRIME Database. Overall, public equity fundraising — that includes qualified institutional placements, follow-on offerings, as well as infrastructure investment trusts/real estate investment trusts — stood at Rs 2.02 trillion — higher than the previous high of Rs 1.76 trillion in the preceding year... The average deal size for IPOs was Rs 1,884 crore... Of the 59 IPOs for which the data is available, 36 IPOs received mega responses of more than 10x (of which, six IPOs more than 100x), while eight IPOs were oversubscribed more than 3x. The balance 15 IPOs were oversubscribed between 1x and 3x.
In general, it was a record year for equity fund raising in India.

The biggest jump was in IPOs, where it topped the previous best by nearly 100%. Of the IPOs, 38.7% by deal value was cornered by digital companies.  

Retail interest as manifest in inflows into mutual funds too was at a record high.

Arguably the financial market trend of the year in India was the emergence of an extraordinary 39 unicorns

The country overtook China to become the second most happening VC market after the US. 

5. The driving force behind the liquidity glut has been the extraordinary decade and more long monetary accommodation by central banks in developed countries, which got amplified during the pandemic. Reflecting this, the market capitalisation of the biggest global companies is dwarfed by the combined balance sheets of the major central banks. Since the start of the pandemic, the balance sheet of US Fed, ECB, and BoJ has swollen by $9 trillion to $24 trillion

This has had distributive consequences.

However, it can be now safely stated that the era of quantitative easing may have ended and the era of "quantitive tightening" has begun. 

6. Good set of graphics from McKinsey here. This captures the remarkable pace of pandemic vaccine development times in perspective

7. Income loss due to the pandemic was steepest for the poorest.


8. One of the biggest stories of the year concerned the supply chain disruptions which impacted everything from groceries to consumer goods to semiconductor chips and cars. The Council of Foreign Relations has a very good primer here

The pandemic, aided by the rise in household savings during lockdowns and the generous stimulus measures, triggered a spurt in demand for consumption goods. The abrupt nature of the positive demand shock coupled with the pandemic disruptions in China and elsewhere meant that supply got constrained. The available supply itself struggled to find shipping fleets and port operations too slowed down. 

The result was that shipping times nearly doubled, and global shipping costs surged spectacularly, especially the China-US route.

The most salient impact was on semiconductors. This captures the globalised nature of its supply chain. 
The wait times for chips doubled in 2021.
Another salient example was in power generation, with coal supply disruptions in 2021 shown below
See graphics here and here.

9. McKinsey Scott, the ex-wife of Jeff Bezos, has shaken up the philanthropy world
With almost $8.6 billion in gifts announced in just 12 months, Scott has vaulted to the tippy top of philanthropic giving, outspending the behemoth Gates and Ford Foundations’ annual grants — combined... For nearly 90% of organizations that responded to a Bloomberg survey, Scott’s gift was the largest they’ve ever received, with donations ranging from $750,000 to $60 million.
10. Finally, 2021 may well be remembered as the year when inflation returned.

Thursday, December 30, 2021

Summary of 2021 - link-fest

1. Interactive feature in NYT on some of the important issues debated in 2021

2. Graphical summary of the year in the US.

3. Best of FT long reads and interviews.

4. The Economist Briefings.

5. Top 25 New Yorker stories of 2021.

6. NYT - Best of 2021 (in various fields/areas).

7. FT - Best Books 2021 (in different categories). This is WSJ's ten best books, and this of NYT.

8. NYT: Year in visual stories and graphics - 2019, 2020, 2021. And some of NYT's best visualisations over the years here.

9. News stories of the year - WSJ (here and here)

10. Eleven graphics on the impact of the pandemic on world economy from the World Bank.

11. Bloomberg year in graphics. Each story is excellent.

12. FT year in graphics.

13. 15 of best Livemint long reads here.

Tuesday, December 28, 2021

Christmas reads from The Economist

Some articles from The Economist's Christmas double issue.

The first article uses Agatha Christie's Orient Express to tell the remarkable story of how a well-endowed network of railways in the MENA region fell prey to colonial ambitions and the region's political intrigues and civil wars. The story starts with the late nineteenth century Ottoman Empire which embraced the arrival of railways by building an elaborate network  encompassing Khartoum, Alexandria, Tripoli, Beirut, Haifa, Jerusalem, Damascus, Medina, Homs, Aleppo, and Basra.  

However, the network was destroyed by the colonial and post-colonial rivalries and wars that have been the bane of the region. The British (and TE Lawrence was the primary culprit in blowing up dozens of railway bridges), Bedouins with support first from Lawrence and later the Al Saud family, and finally the Zionists and Israel were the main culprits in one of the worst infrastructure destruction episodes in history. Regional conflicts and civil wars added the final touches on the destruction. The article has a beautiful description of the dismemberment,
The Middle East had been a cosmopolitan hotchpotch of languages, ethnicities and sects since civilisation began. The railroads tossed them together like fruit in a bowl... Seventy years later the tracks that joined continents lie in wreckage. From Morocco to Iraq not a single train crosses borders. Rusting carriages and engine hulks litter the sands. Cypress trees sprout between Lebanon’s lines. Rails were smelted into bullets like ploughshares into swords. Sleepers reinforced trench walls, and stations and repair yards became barracks and prisons. As in the murder on the Orient Express, the network fell victim to multiple blows. Tracing culpability is one of the region’s great whodunits... 
Like the 12 killers aboard the Orient Express, the region’s rulers each had a motive. The colonial powers carved up the Middle East. The generals who succeeded them prioritised their parcels of territory over the common market and culture developed across millennia. Tinpot dictators saw cosmopolitanism and connectivity as threats to new national identities. Religion lost its universality and shrank into cults tied to plots of land. Syria expelled its French inspectors. Iraq’s railway administration sacked its Jewish managers. Bereft of expertise, many lines fell into disrepair. Train lines became like ancient silk-road souqs and bazaars, relics of a past when riches came from regional trade rather than the rent of a single raw material, be it oil, gas or phosphates. 

The second article looks at the widely prevalent North-South rivalries across European countries. This about Belgium, a country just 222 km long,
Formally, Belgium’s splits are linguistic, with its 11.5m people mostly shared between a Dutch-speaking north and a French-speaking south. In reality, language is clearly seen as a badge of tribal belonging. In both Dutch-speaking Flanders and Francophone Wallonia, it is common to hear people declare that the country’s linguistic border—which runs from east to west, dividing the capital, Brussels—is nothing less than the frontier between the Germanic and the Latin worlds... As northerners, the Flemish are called hardworking, dour and thrifty, a race of early-to-bed merchants and farmers, inhabiting a land of flat cabbage fields and drab coastal lowlands. As southerners, the Walloons are deemed wily, lazy and corrupt: a race of drinkers and dreamers, faded gentry and public servants employed in vast numbers by a bloated patronage system... In Flanders the grumble is that Walloons—who in the 19th and 20th century lorded it over their Flemish neighbours—are too arrogant and welfare-addicted to learn Dutch and move to their country’s dynamic north... In 1921, a historian, Emile Cammaerts, traced his country’s divisions back to fifth-century wars that saw pagan Frankish tribes from the Germanic north attack Christian Belgo-Romans in the south, only to be stopped by an impenetrable physical barrier: the Silva Carbonaria, a long-vanished forest that ran along the line of today’s linguistic frontier.

The same stereotype exists in France, Spain (Catalan north and Galician south), Italy, and even America. So, this about the general north-south stereotypes,

Within many countries, strikingly similar north-south stereotypes crop up time and again. Such prejudices are often defended by references to climate, topography and history. Northerners are hailed for hard work and thrift. Northern agriculture is praised for its efficiency, which is often linked to an early abolition of feudalism creating lots of small farms owned and worked by sturdy, self-reliant yeomen. Southern regions are deemed friendlier but blighted by clannish corruption and idleness. If southern farms are less productive, harsher weather is only one explanation. Another involves the legacy of vast estates on which hard-pressed, semi-literate peasants laboured well into the 20th century.

Such stereotypes exist outside Europe in China, India, Korea, Vietnam, and Australia, though in all these cases the stereotype is reversed with the Southerners claiming superiority over the northerners. 

However, closer examination reveals the problems with such stereotypes, 

Look at a map, and it becomes clear that one person’s north is another’s south. Take supposedly cold, northerly Barcelona. It lies some way south of the sun-baked, southern French city of Marseille, and enjoys almost the same climate... on a map of Europe, distinctively northern Italy is not in the north. Indeed haughty, handsome Florence lies on a lower latitude than Avignon, in the southern French region of Provence... The idea that warm places are lazy is impossible to separate from long-debunked theories of racial superiority, seeking to explain why white Europeans conquered African, American and Asian colonies with such brutal ease. Over the years, north-western Europeans came up with self-serving theories to explain why Providence had ordained that they should run the world. They boasted that their climate was just bracing enough to inspire men to industry, whether that meant weaving fine clothes or building cities of brick and stone, without being so cold as to make agriculture impossible. They scorned hot places where fewer clothes are necessary, and food supposedly falls from trees. In fact, the link between temperate weather and invention is distinctly weak. Until well into the Middle Ages, northern and western Europe were backwaters. Whether studying the history of mathematics, medicine or literature, civilisation flowed from east to west, carried from the Mediterranean basin, the Islamic world and China to damp, chilly places like Germany or the British isles.
The third article traces Julius Caesar's nine year long conquest of Gaul (modern France) through his first-hand account of his campaign, "Commentaries on Gallic Wars". The campaign that conquered France built Caesar's myth and helped build the foundation for his assumption as the Roman dictator.
He shaped the political geography of Europe. He ensured that French words such as liberté, égalité, fraternité, vin blanc and croissant all have Latin roots. He gave the world a calendar that more accurately reflects the time it takes Earth to go around the sun and that is still used. Today only two days are named after Jesus Christ, but Caesar and his heir each have a whole month. The words “kaiser” and “tsar” derive from his name.

The fourth article describes how technology has made it easier to sell old clothes. 

In 2021 resold clothing fetched around $15bn, up from less than $1bn in 2013. A further $21bn was spent on garments from charity and thrift shops. The total spent on second -hand garb, some $36bn, is slightly bigger than the $30bn spent on “fast fashion” in shops such as Zara or H&M. By 2025, according to GlobalData, a research firm, the value of resold and thrifted clothing will climb to $77bn as resale revenues triple to $47bn annually and charity-shop revenues climb to $30bn. Combined revenues will dwarf those from fast fashion which are expected to grow to just $40bn... According to estimates from GlobalData last year saw over 33m new buyers and 36m new sellers of old garb... A poll in 2016 by GlobalData found that 45% of adults had bought second-hand clothing, or said they would consider doing so. That share is now 86%.

This assumes great significance given the short shelf life of fast fashion clothes - 95% of clothes sent by Americans to landfills are good enough to be resold - and clothing manufacture and distribution account for 2-8% of global carbon emissions. 

The fifth article describes an old problem, figuring out a satisfactory enough voting system. It has a reference to the quadratic voting (QV) proposal put forth by Glen Weyl.
In its simplest version, each voter would be given a budget of “marks” as Carroll might call them or “voice credits” as Mr Weyl calls them. Voters could use these credits to “buy” votes for a candidate or proposal. The first vote for a candidate costs one credit. But casting two votes for a single candidate costs four credits (ie, two squared); casting three costs nine (three squared), and so on. Under this scheme, people buy votes with their credits just as countries “earn” votes with their populations in Penrose’s imagined assembly. In both cases, the aim is to give voters as much sway as their population or passion warrants. But no more so.

Compared with the method of marks, QV makes it harder to “lump”’ votes. That is because each additional vote for a single candidate costs more than the last one did. (A second vote costs an additional three credits; a third vote costs an additional five.) Thus instead of buying increasingly expensive votes for their number-one choice, voters are nudged to cast some relatively cheap votes for second- or third-choice options. In this way, the method encourages compromise. In the book “Radical Markets”, Mr Weyl and his co-author Eric Posner argue that the method could potentially work well in organisations large and small, from the United Nations to presidential elections, from shareholder meetings to homeowner associations... In principle, this... gives people a reason to express, but not overstate, the intensity of their feelings.

This experiment proves the point,

Distinguishing strong from mild support is equally valuable in opinion polling. In 2016 David Quarfoot of the University of California, San Diego and his co-authors put ten controversial policy proposals to 4,850 American voters. They included proposals to raise the minimum wage, deport illegal immigrants, repeal Obamacare and tax the rich. Some of the voters were asked to respond on a conventional scale (from strongly approve to strongly disapprove). Others were given a budget of 100 voice credits to spend quadratically. In the conventional survey, people tended to gravitate to one end of the scale or the other. They expressed strong approval or disapproval, just as online reviewers tend to give five stars or none. In both cases, a strong statement costs nothing. In the quadratic poll, people faced a constraint. Expressing vehemence on one issue required them to weaken their stand on another. This constraint forced them to be more discerning about their passions.

And quadratic voting has made its debut in a few places,

The Democratic legislators used QV to help pick which of many possible spending bills they should push in the year ahead. It is also used in Taiwan to help decide among the innovations cooked up in the annual Presidential “Hackathon”, which challenges civic entrepreneurs to use data to improve public services. In Brazil the city council of Gramado has also used quadratic voting to set its priorities for the year and to find consensus on tax amendments.
The final article examines the importance of Ukraine to Russia. It writes,
The need to let the Baltic states go was clear—and when they left the Soviet Union in 1990, Solzhenitsyn, Yeltsin and most of Russia rallied against revanchist attempts to keep them in. Much the same was true of Central Asia and the Caucasus; they were colonies. Belarus and Ukraine were part of the metropolitan core. The bonds which tied “Little Russians” (ie Ukrainians), “Great Russians” and Belarusians together, Solzhenitsyn argued, must be defended by all means short of war. For centuries Ukraine had anchored Russia’s identity. As the centre of the storied medieval confederation known as Kyivan Rus, which stretched from the White Sea in the north to the Black Sea in the south, Kyiv was seen as the cradle of Russian and Belarusian culture and the font of their Orthodox faith. Being united with Ukraine was fundamental to Russia’s feeling of itself as European... Russian empire required Ukraine; and Russia had no history other than one of empire. The idea of Kyiv as just the capital of a neighbouring country was unimaginable to Russians... One of their (Russians') grievances was the loss of Crimea, a peninsula in the Black Sea reallocated from the Russian republic to the Ukrainian republic in 1954 but still seen as part of Russia by most Russians. A holidaying place for both the Soviet elite and for millions of ordinary people, it had been at the heart of the imperial project since the days of Catherine the Great.

Monday, December 27, 2021

The rise and rise of private equity

The Economist has a summary of the bumper year for PE firms,

In the first 11 months of 2021, private-equity firms sealed over 13,000 deals globally, worth a combined $1.8trn—more than in any previous full year. Private buyers have bought or are eyeing up Sydney airport, Italy’s phone company, the French football league and Saudi Arabia’s pipelines. Private-capital firms—which include pe shops as well as funds that target credit, infrastructure and property—have raised $1.1trn from end-investors this year, not far off the highest-ever annual tally (see chart 1). The boom is pushing up pay to even more extraordinary levels. On December 10th KKR, a buy-out firm, announced long-term share awards that could net its two new co-chief executives more than $1bn each.
The assets under management of PE firms has grown spectacularly
Private assets were once so obscure they were called “alternatives”. The label seems absurd today. Private-capital firms manage a record $10trn of assets, the equivalent of 10% of total assets globally. This includes several types of activity. PE—which consists of taking over companies using debt, juicing up profits and reselling them at a premium—promises racy returns. Infrastructure and, to some extent, property help diversify portfolios. Private credit lends to smallish firms with a relatively high default risk, earning attractive yields.

In an environment of low yields, PE has emerged as a mainstream asset category,

In order to meet their future liabilities, institutional investors such as pension funds must achieve annual returns of 6-7%. With interest rates at rock-bottom levels they piled into private assets where, it is argued, returns are more attractive. Using data from Preqin, The Economist calculates that the world’s biggest 25 investors by assets under management—including pension funds, insurers and sovereign funds that together manage $22trn—now hold 9% of their assets in private markets, twice the share in 2011 (see chart 3). Australia’s Future Fund, a sovereign-wealth pot of $142bn, allocates 35% of its portfolio to them; cdpq, a pension fund in Quebec, nearly 55%.

This has been aided by a process of capital recycling through IPOs,
With capital markets open for initial public offerings, a virtuous circle of activity is taking place: private-capital firms can sell more of their existing assets (to another buyer or by listing them) and return the proceeds to their ultimate investors, who in turn are keen to participate in fresh fund raising for private markets. For Blackstone, for example, the biggest firm of all, asset sales, cash returned and funds raised so far this year have all been roughly double the level of 2020. Greater deal “velocity” means asset managers are deploying capital faster and raising funds more often. 

The mainstreaming of PE has been accompanied by some large investors in PE funds (the Limited Partners) setting up their own PE divisions to manage their money, and some PE funds themselves getting into the businesses they are investing in.

Lured by high returns, some investors are keen to be more directly involved in running private assets, rather than being passive customers of the big private-capital managers. apg, a Dutch pension manager that oversees $703bn, aims to own at least 10-15% of every fund it backs, so as to negotiate veto rights over strategic matters, says Patrick Kanters, its private-markets boss. Many big limited partners also “co-invest” alongside funds directly in portfolio companies, which allows them more discretion over the size of their exposure, and lowers overall fees. Some bypass managers entirely. Co- and direct investments are set to reach $265bn this year, the highest-ever amount by far. Large investors in “real” assets, which include property and infrastructure, have become full-fledged developers, enabling them to create their own pipeline of deals—whether for student housing or hospitals—and pocket a fat margin.

The increase in funds and competition is engendering several distortions and perverse incentives,

Valuations are creeping up. In a survey of 71 global institutions carried out by Probitas this autumn, 65% ranked unhealthy competition for deals as the biggest risk, up from 55% last year. Frenetic activity means less due diligence. Limited partners (as the ultimate investors in funds are known) have little time to forge relationships with new managers and diversify their bets. Some are recruiting more staff, triggering what Maxime Aucoin of CDPQ calls a “war for talent”. Meanwhile managers are feeling rushed, too. “Decisions are being made on bigger dollars in fewer days,” notes Steve Moseley of APFCc. The amount of “dry power”, the total committed to funds but not yet spent, stands at a record $3.3trn. The pressure to deploy capital means fund managers have less incentive to evaluate potential targets strictly, or to turn down deals.

Interestingly, the article makes only a passing mention of the returns on PE, and that too a selective one. This is representative of the mainstream narrative on PE.  

I have blogged here, here, here, and here about the returns of private equity investing. This paper by Ludovic Phalippou is a must read. 

Update 1 (14.01.2022)

Arthur Korteweg has a paper in the Annual Review of Financial Economics which finds that VC returns this century have been lower than those made on similarly risky assets in public markets.

The weight of evidence suggests that, relative to a similarly risky investment in the stock market, the average venture capital (VC) fund earned positive risk-adjusted returns before the turn of the millennium, but net-of-fee returns have been zero or even negative since. Average leveraged buyout (BO) investments have generally earned positive risk-adjusted returns both before and after fees, compared with a levered stock portfolio. Based on an expanded set of risk factors from the literature, VC resembles a small-growth investment, while BO loads mostly on value.

Saturday, December 25, 2021

Weekend reading links

1. I blogged here about the politics and economics of Cobalt mining in DRC. This article examines the politics and economics of extracting Lithium, used in Lithium-ion batteries for electric vehicles, from the giant brine sea high up in the Bolivian Andes. 

The Indigenous Quechua people revere the Salar de Uyuni, 4,000 square miles of salt flats that their forebears believed were the mixture of a goddess’s breast milk and the salty tears of her baby... With a quarter of the world’s known lithium, this nation of 12 million people potentially finds itself among the newly anointed winners in the global hunt for the raw materials needed to move the world away from oil, natural gas and coal in the fight against climate change.

2. India cinema fact of the week,

It is one more paradox among the millions of contradictions that constitute India that what is perhaps the most film-mad country in the world also has among the lowest ratios of screens to human beings. There are just eight screens per million people in India today, compared with 37 in China and 124 in America. Yet Indians bought 1.98bn movie tickets in 2017, while Chinese cinemas saw a more modest 1.62bn admissions and American ones a meagre 1.24bn... Today there are around 8,000 permanent screens—as many as 1,500 shut just during the pandemic—and only 52 travelling cinemas.

3. Striking point in an FT article, "The rate at which booster doses in high-income countries have been administered exceeds that of total doses in low-income countries".

4. A very good analysis of the success of Bangladesh by Mihir Sharma. This is an important point
In India, female labour force participation peaked at 32 per cent of the working-age population in 2005, and has since come down to 21 per cent. (Pre-Taliban Afghanistan had a higher ratio of women to men working than India.) In Bangladesh, the past three decades have seen female labour force participation steadily increase, to its current level of 36 per cent. This is perhaps the biggest difference between India and Bangladesh, just as it is the biggest difference within India between states such as Tamil Nadu, Kerala and Maharashtra, and others, such as Uttar Pradesh, according to the Periodic Labour Force Survey.

This is an equally important observation about the difficulties with replication of such economic successes,

It is entirely possible that Bangladesh’s tragic origin story is in itself partly responsible for these choices. For example, fiscal prudence may have been imposed on a country without resources, before it became a habit. A less hierarchical and more inclusive economy may be a consequence of the multiple calamities inflicted on the country’s elite in the 1940s, 1960s, and 1970s. Openness to trade and investment — indeed, the outward orientation of the entire country — may be related to the fact that, for the first decade after independence, it had few internal resources and had to depend upon external assistance from multilateral agencies and Japan, which even in the 1970s was the country’s largest bilateral donor. The Bangladeshi-British economist Mushtaq H Khan, studying the difference in aid patterns between Pakistan and Bangladesh, has argued that the assistance to Bangladesh in the 1970s did not allow the concentration of political or economic power, aiding the emergence of a new middle class that “was drawn into the garment industry”. Openness to mechanisms for grassroots aid delivery also helped in the creation of the NGOs that have played such an important role in inclusion and development subsequently.

5. Some facts about Minimum Support Price (MSP) and the cost of extending it to cover all crops,

As of today, the government declares MSP for 23 crops: Seven cereals (paddy, wheat, maize, bajra, sorghum, ragi and barley), five pulses (tur, moong, chana, urad and masur), seven oilseeds (soybean, groundnut, rapeseed-mustard, sesamum, safflower, sunflower and nigerseed) and four commercial crops (sugarcane, cotton, jute and copra). The main procurement, however, happens largely for rice and wheat to feed the public distribution system (PDS). The PDS issue prices of rice and wheat are subsidised by more than 90 per cent of their economic cost to the government. In 2020-21, the food subsidy bill was almost 30 per cent of the net tax revenue of the central government... assuming that only 10 per cent of the production of remaining crops (excluding sugarcane) is procured, it will cost the government about Rs 5.4 lakh crore annually to procure these other MSP crops. This cost is estimated on the basis of economic costs of operation that are usually about 30 per cent higher than the MSP (in case of rice and wheat it is 40 per cent).

This about price deficiency payments,  

One argument that is floated is that instead of physical procurement, one may use price deficiency payments (PDP), implying that the government pays to farmers the gap between the market price and MSP, whenever market prices are below MSP. We know very well that Madhya Pradesh adopted this scheme (Bhavantar Bhugtan Yojana) in kharif 2017 for eight crops (maize, tur, urad, moong, soybean, groundnut, sesamum, and nigerseed) but had to give up the very next season as traders gamed it, widening the gap between market prices and MSP, and benefited massively from this scheme, while the government incurred heavy expenditure.

Ashok Gulati therefore suggests income transfers, 

It may be better to use an income policy on a per hectare basis to directly transfer money into farmers’ accounts without distorting markets through higher MSPs or PDPs. This can be improvised by better identification of tenants and owners through transparency in land records.

6. Tamal Bandopadhyay points to yet more examples of corporate governance failures in India, this time between ARCs and borrowers. Last week it came to light of fraud in four ARCs. 

The four are accused of “unfair and fraudulent trade practices in acquiring” the stressed loans. The bad loans acquired by them were “far less” than the real value of the securities covering such loans. What’s more, the minimum cash the ARCs paid to the lenders for such loans — typically 15 per cent of the value — came from the defaulting borrowers! The money had been routed through several layers of dummy companies controlled by the borrowers or through hawala channels.

7. On the rise of retail stock market trading in India, Vivek Kaul writes

Between December 2019 and December 2020, the number of demat accounts went up by 26%—from 39.4 million to 49.8 million. Further, between December 2020 and October 2021, the number of demat accounts went by around 48% to 73.8 million. Around 1.7 million new demat accounts were opened in February 2021. By October, this had jumped to 3.5 million accounts.

He makes an important point about likely market trajectory in 2022

It also needs to be pointed out that the stock market rallied in 2020 because of the huge amount of money brought in by the foreign investors (about $23 billion) searching for higher returns, given the low interest rates in the Western countries. In 2021, this has fallen to $4.5 billion, with the foreign investors net selling stocks in October, November and December. This, to some extent, explains why the Sensex has fallen by 7.7% from its 18 October peak. To conclude, the Federal Reserve of the United States, the American central bank, has now decided to stop printing money by March 2022 and raise interest rates after that. The Bank of England has already raised interest rates. If this continues, the chances of fresh foreign money coming into India in search of higher returns in 2022 will come down. In fact, even in 2021, the stock prices have been driven primarily by domestic Indian investors. The question is: Will the domestic investors continue to bet big on the stock market in 2022 as well?

8. Livemint has an assessment of the Udaan program to enable air connectivity of remote place by providing bridge financing to airlines,

As of 14 December, only 403 of the 948 awarded routes awarded under the UDAN (Ude Desh ka Aam Nagrik) scheme were operational—connecting 65 airports, eight heliports and two water aerodromes—with airlines shying away from using most of the routes, wary of inadequate infrastructure, low demand, lack of manpower and capital... delays in operationalization and discontinuation of various regional routes were due to non-readiness of civil airports and heliports on account of unavailability of land and infrastructure, the unsustainability of operations on certain routes, and the adverse impact of the pandemic on passenger demand on these routes... the central government has released about ₹2,062.50 crore of the ₹4,500 crore earmarked for reviving existing unserved and underserved airports across the country. The Airports Authority of India (AAI), the state-run airport operator, is the implementing agency for conducting bidding to award routes connecting underserved and unserved airports. AAI has so far held four rounds of bidding since the launch of the scheme in October 2016... Government subsidies on regional connectivity routes often don’t make up for the costs borne by the airlines to operate such flights as fares on such routes are often capped, thus hindering airlines’ ability to make the flights sustainable for the long run.

9. Ruchir Sharma points to an important political economy issue across the world - the emergence of a cohort of young new capital investors who have benefited from the ongoing bull run, who will be a strong and vocal interest group for measures to keep the bubble inflated. 

More than 15m Americans downloaded trading apps during the pandemic, and surveys show many of them are young, first-time buyers. Retail investors have also been hyperactive in Europe, doubling their share of daily trading volume, and in emerging markets from India to the Philippines. All told, US investors alone poured more than $1tn into equities worldwide in 2021, three times the previous record and more than the prior 20 years combined. After retreating last decade, US households overtook corporations as the main contributors to net demand for equities in 2020. They now own 12 times more stock than hedge funds... US households bought at an astonishing pace throughout 2021, peaking in the third quarter when their stock holdings rose by more than 16 per cent over the previous year. That level of new retail flows matches the prior record, set in 1963... Another warning sign of impending trouble for the markets is heavy borrowing to buy stocks, or margin debt. Net margin debt in the US now amounts to 2 per cent of GDP, a high since records began three decades ago. A large chunk of it is on the tab of retail investors: their borrowing to buy stock rose by more than 50 per cent over the past year to record levels, much as it did before the crashes of 2001 and 2008...

But many retail investors are placing their bets in a highly speculative way, for example by buying one-day call options or stocks with low nominal value that are easy to lever up. It is a surreal sign of confusing times to hear avowedly socialist political leaders defend extreme capitalist risk-taking by a class of investors that includes many lower and middle-income voters. The result is a market that is historically overvalued, over-owned and to a perhaps unprecedented extent, politically flammable. Americans now have an unusually high level of savings and the share of their portfolios that they hold in stocks now matches the all-time high, going back to 1950... having done so much to inspire this retail investor mania, governments and central banks could face a major backlash when the next bear market inevitably arrives.

10. Excellent NYT article explaining how inflation is eating into New York city's $1 pizza slice joints. 

11. Some facts about India's public expenditure and revenues. First on expenditure of States and centre.

And on tax revenue trends.

12. Livemint primer on warehousing policy to set up 35 multi-modal logistics parks (with warehouses) on PPP, so as to cut India's logistics cost from 14-16% of GDP to China's 8-10% and US's 12-13%. 
13. Promising signs in electronics manufacturing in India with the emergence of local manufacturing in wearables and wearables for mobile phones, thanks to the PLI scheme. These were almost 100% imported till a few quarters back. 

14. Gillian Tett has an article arguing that far from reversing, globalisation may only have taken a different course, this time without America at the centre. In the article she points to this,
But Squid Game is a made-in-Korea product, backed by Netflix, which has become the most viewed show in 90 countries around the world this year. Indeed, polls suggest that one in four Americans has watched it, while Spanish, Brazilian and French offerings produced for a global audience now litter the Netflix site. The globalisation of media, in other words, is no longer about Hollywood; digitisation has made it a multipolar affair.

The absence of any Indian soaps and movies in the landscape of chart toppers in Netflix is interesting.

15. Status report on the Brazilian economic health,
Brazil launched one of the developing world’s most expensive programmes of government support, worth about 11 per cent of gross domestic product. The package limited economic damage — output fell just 3.9 per cent in 2020 and is set to rebound by around 4.5 per cent this year, taking the economy above its pre-pandemic level. But the budget deficit soared and inflation started to take off. Alarmed by rising prices, Brazil’s independent central bank has implemented the world’s most aggressive programme of interest rate rises, pushing the reference Selic rate to 9.25 per cent. Further rises are forecast to take rates as high as 11 per cent next year, increasing further the cost of servicing Brazil’s government debt. To help pay for Auxílio Brasil, Bolsonaro negotiated congressional approval to bypass a constitutionally mandated cap on public spending. Now the overall budget deficit is set to nearly double next year from 4.4 per cent of GDP in 2021 to 7.8 per cent, according to Goldman Sachs...

Buoyed by the success of an emergency cash transfer programme during the pandemic, the president has launched a new welfare scheme, known as Auxílio Brasil, that could benefit about 50m poorer Brazilians, nearly a quarter of the population. The programme is handing out roughly 18 per cent more than the average R$189 ($33) given monthly to recipients of the Lula-era Bolsa Família scheme. In December, Bolsonaro secured congressional support to increase this amount to R$400 a month until the end of next year, two months after the election. 

Friday, December 24, 2021

The short (western) history of restaurants

The Economist's Christmas double-issue is always a delightful read. This time, there is an excellent brief history of the evolution of restaurant industry in the west.

It appears to have had purely utilitarian roots and to serve the masses,
Archaeologists have counted 158 snack bars in Pompeii, a city destroyed by a volcano in 79 AD—one for every 60-100 people, a higher ratio than many global cities today. Ready-cooked meat, game and fish were available for Londoners to eat from at least the 1170s. Samuel Cole, an early settler, opened what is considered to be the first American tavern in 1634, in Boston. These were more like takeaways, though, or stands where food might be thrown in with a drink, than restaurants. The table d’hôte, which appeared in France around Cole’s time, most closely resembled a modern restaurant. Clients sat at a single table and ate what they were given (trends now making a comeback). Many of these proto-restaurants resembled community kitchens, or quasi-charities, which existed for the benefit of locals. Strangers were not always welcome... Before the use of coal became widespread in England in the 17th century, preparing food at home involved spending a lot on wood or peat. Professional kitchens, by contrast, benefited from economies of scale in energy consumption and so could provide meals at a lower cost than people could themselves. Today dining out is seen as an indulgence, but it was the cheapest way to eat for most of human history... most wealthy people preferred to eat at home, enjoying the luxury of having staff to cook and clean up.

Before it became acceptable to the rich,

Yet for restaurants to flourish, richer people had to demand what Pepys did not: eating in full view of others. Until the 18th century elites largely viewed public spaces as dirty and dangerous, or as an arena of spectacle. But as capitalism took off, public spaces became sites of rational dialogue which were (putatively) open to all. And, as Charles Baudelaire, a French poet, observed, 19th-century cities also became places where people indulged in conspicuous consumption. The restaurant was the natural habitat of the flâneur, Baudelaire’s wandering observer of city life. Where better than a restaurant to see and be seen? Out went the set menu of the table d'hôte; in came the à la carte kind. Shared tables gave way to private ones. Eating out became less of a communal activity focused on calorie intake and more of a cultural experience—and a place, as Baudelaire wrote, where people could show off their wealth by ordering more food than they could eat and drinking more than they needed.

The evolution of restaurant industry also had its share of overcoming regulatory restrictions,

Powerful guilds often made it hard for a business to sell two different products simultaneously. Butchers monopolised the sale of meat; vintners that of wine. The growth of the restaurant, which serves many different things, required breaking down these barriers to trade. A Monsieur Boulanger, a soup-maker in Paris, may have been the first to do so. He dared sell a dish of “sheep’s feet in white-wine sauce”. The city’s traiteurs (caterers) claimed the dish contained a ragout, a meat dish only they were allowed to prepare, and was therefore illegal. They took their case to court, but Boulanger triumphed... In Britain reformers worried about public drunkenness passed a law in 1860 allowing places serving food to serve wine as well (thus encouraging people to eat something to sop up the booze). Around the same time American states started passing food-safety laws, giving customers more confidence in the quality of the food.

The article finds puzzling the growth of restaurant business despite the increased convenience of home cooking and the widening differential between restaurant meal and home cooking (the restaurant meal was 25% costlier than an equivalent meal at home in 1930, and it rose to 280% by 2014). It points to three possible drivers for rising demand for restaurants despite the rising prices.

The first is immigration. In the 50 years after the second world war the net flow of migrants into rich countries, relative to population, more than quadrupled. Starting a restaurant is a good career move for new arrivals; it neither requires formal qualifications nor, at least for chefs, fluency in the local language... The second factor was the changing microeconomics of the family... households’ choices about whether to make their own food or to buy it premade... also depend on what economists call “shadow costs”. The true cost of an at-home meal involves not just the outlay for the ingredients, but the time spent on shopping and preparation. In an era of low female labour-force participation, shadow costs were low... as more women entered the workforce during the 20th century this equation changed, raising the shadow cost of cooking... And so eating out made increasing economic sense, even as it became more expensive. The third factor was changing working patterns. Historically poor people have tended to work longer hours than rich ones. But in the latter half of the 20th century the opposite became true. The rise of knowledge-intensive jobs, and globalisation, made rich people’s work more financially rewarding—and enjoyable. Toiling into the night became a sign of status. The upshot was that the people with the most money to spend on dining out increasingly needed it most, since they had the least free time.

As the article points out, the pandemic may have again made eating out less attractive and may make restaurants more an experience need, "offering those who need to eat a taste of romance, glamour and love."

Thursday, December 23, 2021

Limits to evidence in public policy - road widenings edition

CityLab has an article about the continuing funding for road widening despite ample evidence that it only  induces demand and worsens the problem. This is a teachable example on the limits to evidence-based policy making when faced with an issue defined by an entrenched popular narrative.

Critics of road widening argue that it creates "induced demand", or it invites more trips until the gridlock returns or even worsens. As economist Anthony Downs famously wrote, "On urban commuter expressways, peak-hour traffic congestion rises to meet maximum capacity." The CityLab article writes,
In 1955, urban observer Lewis Mumford wrote a series of essays in the New Yorker titled “The Roaring Traffic’s Boom,” in which he memorably compared a highway planner widening a congested highway to “the tailor’s remedy for obesity — letting out the seams of trousers and loosening the belt. [T]his does nothing to curb the greedy appetites that have caused the fat to accumulate... Downs’ iron law applies not only to U.S. cities, which have grown more traffic-jammed despite billions of dollars in fresh pavement, but also to those around the world. Highway expansions in Norway and Britain haven’t reduced congestion there, either. The principle now meets little opposition among economists and urban planners. “It’s widely accepted,” says John Caskey, who teaches induced demand as part of his urban economics course at Swarthmore College. “For economists interested in urban transportation, there isn’t really any debate.”... Caskey... explains the process, using Philadelphia’s Schuylkill Expressway as an example. “Think about what happens if you widen the Schuylkill,” he says. “Before, I was driving at 5 a.m. to avoid the traffic, but now that you widened it, I’ll start driving at peak time. Maybe I used to take transit on SEPTA, but now I’ll drive. By increasing the supply of expressway space, you’re going to lower the price in time, and you’re going to increase the volume of travel.” The hypothetically expanded Schuylkill might offer faster travel for a year or two, but any time savings will prove fleeting.
Critics point to a coalescing of vested interests consisting of vehicle owners and users, automobile manufacturers, construction contractors, officials of Transportation and other related departments, and politicians jumping on the gravy train. Instead, they advocate investments in mass transit, again pointing to evidence about its positive impacts in reducing congestion. 

This is a teachable example. Despite the apparently overwhelming evidence, near consensus of the issue, on both evidence against road widening and in favour of investments in mass transit, road widenings are the norm even among US transportation authorities. So what gives?

The article contains the answer. The powerful coalition of interests aligned in favour of road widenings is aided by an even more powerfully entrenched popular perception. 
The idea that a big highway will end up more congested than a smaller one still strikes many people as strange. “The whole notion of induced demand is a little counterintuitive,” says Sundquist. “Highway building seems like a straightforward thing to do. And it does make cars go faster — for a little while.” Caskey agrees. “I understand that if someone who drives everywhere sees traffic congestion, their immediate solution is to keep paving things. It’s sort of a natural reaction.” That makes the topic of induced demand a challenging one for policymakers. “Everyone with a driver’s license thinks they understand transportation,” says Rosenberg. Meanwhile, politically potent contractors, unions and automakers have an incentive to keep the public confused.

No evidence, howsoever rigorous, can shake-off this entrenched narrative. Dismantling it requires a counter narrative. This is illustrative of problems elsewhere in development, where evidence can do little on the face of entrenched narratives. Development, and many public policy responses, are, what Lant Pritchett calls, faith-based activities. 

Wednesday, December 22, 2021

Some readings on the inflation debate

Is the current inflation transitory or is it the latest episode of inflationary breakout? There debate is almost evenly balanced. 

The former argue that the current inflation is due to the stimulus and shocks imposed by the pandemic, whose effects will wear off soon. The other side invokes Econ 101 to claim that the massive fiscal deficits and eruption in money supply is manifesting as the expected inflationary episode. Besides, they argue that the post-pandemic stimuluses and labour market shifts have left people with significant disposable incomes and encouraged people to leave the labour market. They also argue that the supply chain disruptions will take at least a couple of years to heal, leaving the market with an extended supply shock. 

I am sitting on the fence in this argument. So summarising two papers that came to notice recently (HT: Ananth).

James Montier and Philip Pilkington of GMO argues that monetarist theories of inflation have limited empirical basis and feels that in the absence of a shift in labour's bargaining power, inflation talk is meaningless, 

History teaches us that inflation is... invariably, as Wicksell put it, a “cumulative process” in that it involves a feedback loop between prices and costs. Labour costs are particularly important in the production process, and thus a sustained inflation requires wages to rise significantly faster than productivity (as we have noted before, we have actually been witnessing the opposite situation for a long period of time now – a phenomenon known as wage repression). Without a radical shift in labour’s bargaining power (of which there is yet no sign) it is unlikely that inflation will be able to embed itself in the system. Thus, we believe the upsurge in inflationary angst is likely much ado about nothing.

They plotted average fiscal deficits and average inflation data from 37 countries over the 2009-19 period and found no correlation. 

On the contrary, they found, 

Here we see that not only is the sign wrong – if anything, a higher fiscal balance is associated with higher inflation – and that there is no solid correlation, but that most countries experience between 0% and 2% inflation even though fiscal balances tend to be anywhere between -8% and +2% of GDP. The two extreme outliers also seem to discredit any simple relationship.

Similarly, they show fiscal deficits and inflation in US and Japan over the last 70 and 40 years respectively and finds no correlation. They also point to the poor empirical basis for theories like Philipps Curve and non-accelerating inflation rate of unemployment (NAIRU). 

They point to a sharp rise in US household savings rate due to the pandemic,

They constructed an index of worker bargaining power, the Worker Bargaining Index (WBI), consisting of  number of strike days per year, share of union membership in total workforce, and unemployment rate. Again, far from increasing, they find the WBI declining in recent times.

They argue that any simultaneous supply and demand collapse, followed by a major stimulus will result in a higher price level, which however is unlikely to be a long-lived one. 

In sharp contrast to GMO, analysts at Bridgewater argue that far from a squeeze, "supply of almost everything is at all-time highs". They claim that the monetary and fiscal stimuluses in the aftermath of the pandemic has triggered a demand shock, whose drivers they feel are not transitory. 
The mechanics of combined monetary and fiscal stimulus are inherently inflationary: MP3 creates demand without creating any supply. The MP3 response we saw in response to the pandemic more than made up for the incomes lost to widespread shutdowns without making up for the supply that those incomes had been producing. This is very different than post-financial-crisis MP2, where QE, by and large, was not paired with significant fiscal stimulus but instead offset a credit contraction and, as a result, was not inflationary.

We’re now seeing the inflationary mechanics of MP3 play out and observing just how potent a tool it is. And while the composition of the demand it fueled will evolve (e.g., shift from goods back toward services as COVID recedes), demand is likely to remain highly elevated. There are still large stockpiles of latent spending due to the transformative effects that MP3 has had on balance sheets and the ongoing incentive provided by extremely low real yields, and more fiscal stimulus is on the way. Choking off demand would require central banks globally to move toward restrictive policies quickly, which looks unlikely... the demand-driven nature of the problem results in a game of whack-a-mole: alleviating a shortage in one area will likely just exacerbate the problem elsewhere in the supply chain.

They point out that while US goods production is well above pre-covid trend, demand has exploded.

Incidentally, though supply is much higher than in recent years for copper, aluminium, and nickel, prices are still rising and inventories are being driven down. Similarly, the surging coal prices conceal the reality that Chinese coal production is 20% higher and exports a full 40% higher than at the start of 2020.  They argue that commodity prices will rise because of significant underinvestment in capacity addition over the past decade, and adding new capacity will take time. 

Business inventories are at historic lows as they're drawing down stocks. Shipping costs and delivery times have soared. The extended monetary accommodation and rising wages have meant that housing inventories too have fallen to levels unseen in recent times, leading to rise in housing and rental prices. 
Finally, they point to the labour market trend of people, especially those above 65, leaving the labour market for good, creating a tightness in the market which is unprecedented. 

The shift from efficiency maximisation to resilience - global supply chains

The Covid 19 pandemic has underscored the perils with efficiency maximisation at all costs and the importance of resilience. The excessive concentration of manufacturing, especially of critical Pharma products, in China and the supply chain disruptions have provided the most salient reminders. This post discusses the problems of pursuing efficiency at all costs and to the exclusion of all else in case of global manufacturing supply chains. 

I have blogged extensively on the topic of prioritisation of efficiency at the cost of all else here (push for renewables and spot market purchases in energy markets), here (efficiency-resilience trade-off), here (efficiency-resilience in supply chains), here (Just-in-time SCM), here (natural gas), here (Pharma/vaccine manufacturing), and here (Amazon HR practices).

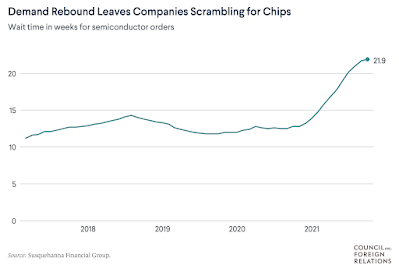
FT has a long read about this market failure in the case of supply chain management (SCM),
All over the world, companies have encountered snags in their supply chains during the pandemic and the shipping bottlenecks that have followed as economies restarted. Car production lines have been halted by a lack of semiconductors, liquor distillers have run out of bottles and department stores are short of Christmas stock. Such troubles are forcing a rethink of corporate strategy. For decades, companies prioritised costs above all else when selecting suppliers, building factories and deciding how much stock to keep on hand. This philosophy was often dubbed “just in time” because it emphasised keeping inventory to a minimum and using short-term, flexible contracts that could be adjusted quickly to changes in demand. But the drive for efficiency encompassed far more than that. Companies also moved production to low-wage locations, consolidated orders to maximise economies of scale, and tried to minimise their physical presence in high-tax jurisdictions... Companies that had consolidated their production into one or a few low-cost locations got a nasty shock last year as pandemic-related shutdowns and shipping bottlenecks left them without key parts or even merchandise to sell.

Businesses are responding to the pandemic induced problems,,

Some businesses are increasing the inventory they keep on hand and entering into longer term contracts with key suppliers. Others are diversifying their manufacturing to create regional hubs with local suppliers and investing in technology to give them greater advance warning of potential bottlenecks. Some companies are also investigating ways of working with their rivals to share information to develop emergency back up facilities without falling foul of competition regulators. “What companies love to do is to optimise working capital. So many manufacturers went to just-in-time inventory, and, pre-pandemic, that worked pretty well,” Carol Tomé, chief executive of UPS, said at a recent industry event. “But when the pandemic hit and everything was shut down, including manufacturing, and then the economy started to open and the demand . . . jumped, well, that just-in-time inventory didn’t work any more. Companies are now thinking about, I need ‘just in case’ inventory,” she added...
One big German industrial group caught flat-footed by the semiconductor shortage has shifted from three-month non-binding arrangements with suppliers to 24-month commitments that require it to pay in advance of receiving its chips. “We had to give the supply chain more stability,” a top executive says. “It’s a change from a buyer’s to a seller’s market.” It is not alone. US carmakers Ford and GM are setting up partnerships, rather than just supplier contracts, with semiconductor manufacturers to improve their access to chips. Their German rival Volkswagen is looking at extending the length of its contracts with key suppliers, and Chinese energy groups have been rushing to sign liquefied natural gas contracts that extend as long as 20 years, more than double the old normal length. 
Its impact is being felt across the economy,
As a result, warehouse costs are rising sharply in many markets, as manufacturers and retailers boost inventory levels. US industrial vacancy rates — a measure of available warehouse space — hit a historic low of 3.6 per cent nationally in the third quarter, according to CBRE. In California’s Inland Empire, a key bottleneck near the ports of Los Angeles, vacancy rates scraped 0.7 per cent. And property agent Cushman & Wakefield predicts the UK could run out of warehouse space within a year... Multinational companies are now talking about “local for local” supply chains. That’s partly because logistics problems have eaten away the advantages of shipping products from low-cost factories half a world away. It now takes anywhere from 28 to 52 days to ship a pair of shoes produced in China from Shanghai to Los Angeles, up from between 17 and 28 days before the pandemic. And the total cost has gone up by $1.77 per pair, according to research by consultancy AlixPartners — an additional cost which smaller industry members with slimmer profit margins will struggle to absorb... Manufacturers and retailers of everything from cars and footwear to vaccines are rediscovering the advantages of having suppliers closer to consumers. In strategically important sectors such as healthcare, they are also receiving government support. This is reviving interest in manufacturing in North America.

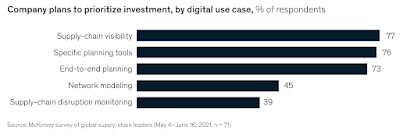
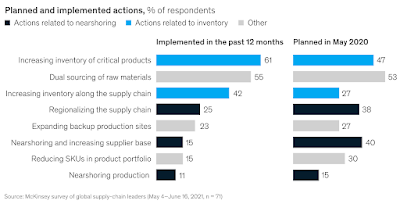
A survey of senior executives from global supply chain leaders by the consultancy McKinsey highlight some of the aforementioned trends. 

It highlights an important point about how digitisation and analytics focus on the operational performance and efficiency improvements and gloss over issues of risk management,

Today’s ongoing and planned digitization efforts are most likely to focus on visibility, as companies strive for a better picture of their supply chains’ real-time performance. For example, since May 2020, 30 percent of respondents had implemented new digital performance-management systems—an important enabler of supply-chain visibility. Improved planning tools, either for specific aspects of the supply chain (such as logistics management) or broader end-to-end planning systems, come a close second among the companies in our survey, with more than three-quarters saying they were a priority. Just under half of all respondents also say they are looking at network-modeling tools to help them improve supply-chain design in the longer term. Nevertheless, despite the prevalence and impact of supply-chain shocks over the past two years, only 39 percent of companies are investing in tools to monitor risks and disruptions.

While some of the responses are perhaps exaggerated and likely to taper off once the pandemic subsides, it's reasonable to claim an overall shift away from efficiency maximisation above all else and towards resilience. A host of other factors - increased protectionism, climate change related actions, automation, increased labour costs in China and elsewhere, global tax harmonisation initiatives etc - are tailwinds to support this shift. 

So what's the broader takeaway?

Thanks to business schools and management gurus, it had become articles of faith that businesses should outsource, focus on comparative advantage, specialise functionally, concentrate suppliers and production facilities, minimise inventories, tighten supply chains, contract labour services, minimise tax payout through tax avoidance, and so on. For sure, when done in proportion, all of them have merits and are desirable. But when taken beyond reasonable proportions, they generate distortions. 

A common underlying factor behind all these concepts is efficiency. Conventional wisdom has it that their pursuit leads to greater efficiency in some form or other (mainly cost reduction), all of which generally lead to greater profitability, the primary objective of businesses. Therefore efficiency maximisation by pursuing these concepts to their extremes becomes an innate and inexorable dynamic of the market. It does not help that globalisation and advances in information and communications technology and transportation end up furthering these trends. 

Businesses and consumers doubtless benefited from these trends. It led to cost reductions which got distributed between higher profits (for businesses) and lower prices (for consumers). A virtuous cycle of consumption, production, and trade led to expansion of aggregate output. 

Then the pandemic struck. Lockdowns and quarantines ensued. Supply chains were disrupted. Outsourced suppliers and producers were cut-off or failed to keep their commitments. The lack of diversification at country and company levels among suppliers and producers became painfully evident. Businesses realised that their pursuit of efficiency maximisation and cost reduction had gone too far. 

This was largely unfettered free-markets at play. Businesses faced competition and had access to producers, suppliers, and labour in a global market. And environment was created where maximising efficiency and cutting costs, above all else, became the overwhelming objective of businesses. This dynamic was creating faultlines every where. It was a teachable exhibit on the failure of unfettered markets.

This post highlights the problems with the efficiency maximising supply chain integration complement to the dominant shareholder capitalism of today. Just as the former marginalised resilience for efficiency maximisation, the latter marginalised stakeholder welfare for profit maximisation. There, as here, markets failed to not only prevent the emergence of distortionary trends but actually ended up amplifying those trends.

Update 1 (24.12.20210

FT has an article on the supply chain for an electronic bicycle, Pedego.

Here is the story of factory to customer story of Pedego's Element e-bike,
Pedego uses eight factories located across Asia. Once an Element bike order is placed, its more than 50 components are assembled at a plant in Shanghai. After factory inspection of the product, the assembled bikes are transferred to be shipped from Shanghai, where it can take up to two weeks to find a shipping container. Depending on the size of the container, each shipped container holds 150-224 bikes. After two weeks on the ocean, the shipment arrives at the Port of Long Beach, only to then wait up to six weeks at the port due to severe delays in docking ships and unloading containers. Once the shipments have been unloaded at the port, they are loaded onto trucks to be transferred to Pedego's nearby warehouse in Orange County. Finally, the bikes take one to two weeks to ship from the California warehouse to one of 200 Pedego dealerships across the US, including the store in Winnetka, Illinois.