Substack

Showing posts with label Mass Transit. Show all posts

Tuesday, July 21, 2026

Lessons from Spain for urban planning

Football is not the only area where we can learn from Spain. Energy transition, infrastructure construction and urban planning are some others. This one is about urban planning. 

An essay in Works in Progress examined how traditional apartments have declined across Europe, except in Spain, and the role played by late development and public policy. It also underlines how Spain uniquely got all the basics of urban planning right - land readjustment, infrastructure development, mixed-use, densification, connected street network, walkability, mass transit, and low car usage. 

This is a good description of mixed-use density in Spanish cities that promote walkability and mass transit commutes, and limit sprawl and carbon emissions. 

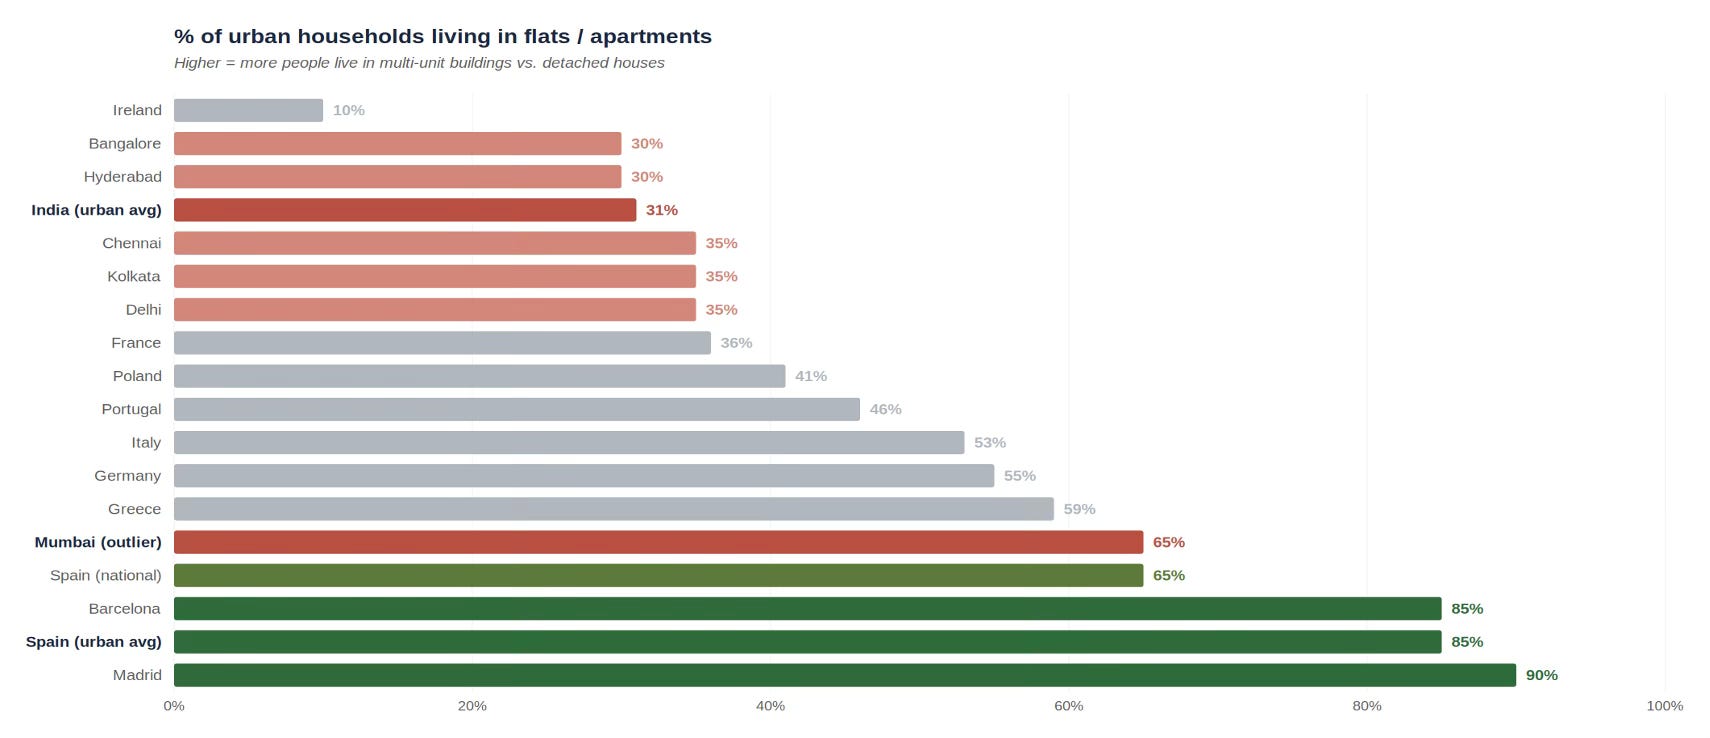
Spain’s cities are unusual. They are much denser, tighter, and more deliberate than other European cities, let alone North American ones. They reject picket fence for apartment block and choose balcony over front lawn. Two thirds of Spaniards live in flats, against 41 percent of Poles, 36 percent of the French, and just 10 percent of the Irish. Of the remaining third, most live in terraced rowhouses. In Spain’s cities, over four fifths of people live in an apartment. At the edge of Madrid or Valencia, dense mid-rise blocks stand beside open countryside without sprawl in between, something that has almost never happened in an English-speaking country, and that has been rare in France or Germany for a century… Spain’s settlements have some of Europe’s lowest per capita transport emissions, in part because about 70 percent of trips in Madrid and Barcelona are made on foot, tram, or metro. Almost every neighborhood is mixed use; almost all urban Spaniards live in the ‘fifteen-minute cities’ that seem like remote ideals in most affluent societies.

This is a good comparison with other Southern European cities, and even here, Spain stands out. 

Spain is not alone in Europe in having become wealthy only recently: most Southern European countries have a similar economic history. And Portugal, Italy, and Greece do share the distinctive features of Spanish urbanism to some extent, with relatively dense cities and relatively high shares of people living in apartments (46 percent in Portugal, 53 percent in Italy and 59 percent in Greece compared to 65 percent in Spain). In other ways, however, Spain is distinctive in Southern Europe. The cities of Portugal, Greece, and Southern or Central Italy are generally surrounded by ragged fringes of unplanned suburban development: their urban cores are dense in the same way as Spain’s, but their peripheries are a chaotic mixture. The transport situation is also dramatically different. About half of journeys in Lisbon and Athens are by car; in Rome, the figure is two thirds, with another substantial share on mopeds; in Nicosia, it is 85 percent, the highest of any European capital. In Madrid, the modal share of cars is below 30 percent. Cities tend to be dense all over Southern Europe, but they have not all achieved the transport outcomes that urbanists associate with density: in this respect, Spain is the outstanding model.

Public policy has played an important role in making this difference. In Britain and the US, the government develops the main arterial roads and allows development that follows the development control regulations, which results in fragmented urban forms (in terms of plot sizes and types of development). In Spain, the authorities undertake land re-adjustments like the Town Planning Schemes of Gujarat and thereby lay down clear boundaries and forms of development. 

This also means a high level of infrastructure development with a high density of roads, based on plans that connect streets and localities to promote pedestrians and cyclists.

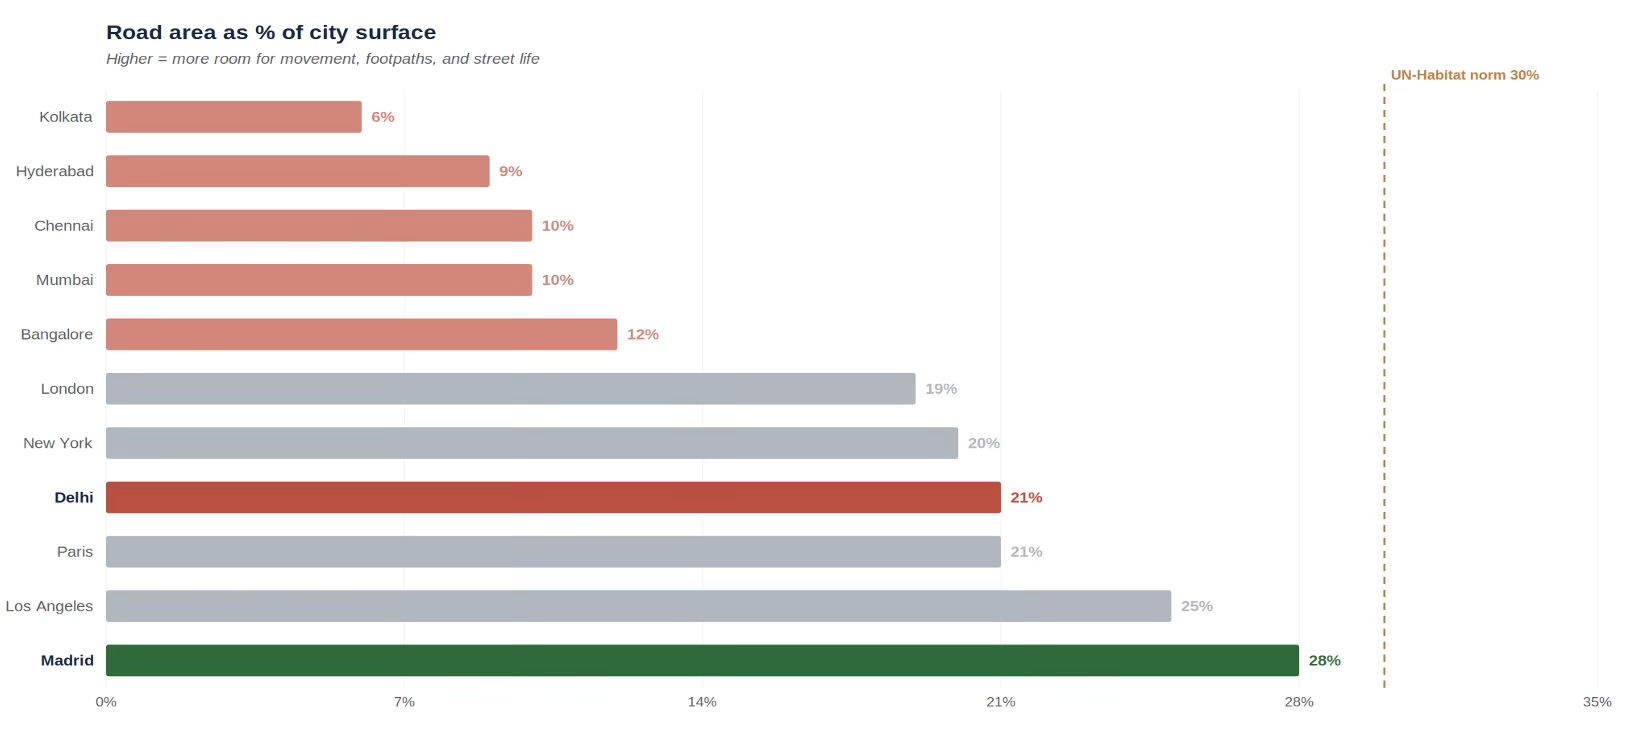
This has yielded cities with exceptionally good infrastructure. About 28 percent of Madrid’s surface area is taken up by roads, almost exactly the 30 percent recommended by UN specialists. This compares to 21 percent in Paris, 19 percent in London and 20 percent in New York. Even Los Angeles, a famously road-heavy city, uses only 25 percent for roads. As we have seen, these roads are also more skilfully interconnected, which is indispensable for pedestrians and cyclists

A large road network has not detracted from policy focus on public transport. 

Despite having far superior road infrastructure, Spanish cities also have high public transport use. Around 60 percent of trips in the Madrid metropolitan area and over 70 percent of trips in the Barcelona metropolitan area are made through public or active travel, similar to other major European cities and far higher than American, Canadian, or Australian cities, which typically fall below 30 percent. In other words, Spanish cities have Los Angeles-tier road infrastructure and Paris-tier public transport access. This is paired with some of the continent’s best intercity transport. Spain has significantly more motorways than any other European country: 17,228 kilometers, versus 13,183 in Germany and 11,671 in France. It has the second-longest high-speed rail network in the world, after China.

In fact, public policy played perhaps an even more important role by keeping infrastructure construction costs low and ensuring construction was done within budget and without delays. It was able to utilise something like €200 billion in cohesion funding received from the EU between the late 1980s and 2020. 

More importantly, Spain kept costs low… Spain, combined with its non-EU injections, built 4,000 kilometers of high-speed rail, 10,000 kilometers of motorway, and numerous metros, trams, ring roads, and radial arterials, because it kept costs extremely low. It did this by maintaining good practice: flexible environmental rules (although these have since become more problematic), top-tier in-house capacity in engineering and contracting, a commitment to a steady pipeline of projects over decades, and, above all, rapid decision-making, avoiding the costly delays and redesigns common elsewhere. Another part of this was giving small areas the power to decide on and fund infrastructure, like the Madrid Metro, avoiding the ping pong between authorities seen in some high-cost countries. 

Together, this has allowed it to build metros more than 20 times cheaper than in New York City. For the price of one mile of the New York’s Second Avenue Subway extension, Spanish builders covered the entire 35-mile 1995–1999 expansion of the Madrid Metro. As a result, Spanish transport infrastructure is both abundant and cheap. Madrid’s metro underwent one of the fastest growth spurts in the worldbetween 1995 and 2007, adding around 203 kilometers of new lines to its already impressive footprint​. Barcelona has been continuously expanding its metro network since the Second World War: in a period of astonishing activity between 1990 and 2010 there were 18 separate extensions, and seven more since.

Cities including Valencia, Bilbao, Seville, and Málaga all built metro or light rail systems in the 1990s and 2000s. Madrid and Barcelona have both joined their old suburban rail lines up into Cercanías/Rodalies systems, similar to London’s Crossrail scheme but far more comprehensive (though not always well run). The upshot of this is that, despite having some of the world’s best road infrastructure, Spain still has relatively low levels of car use and ownership: the modal share of driving is low not because driving is a bad option, but because other options are so good.

Since the late 2000s, changes in laws placing a series of restrictions on buildings have adversely impacted Spanish urban planning. For example, before 2007, Spanish land was buildable by default; the same was inverted to allow housing construction only if specifically zoned by the local council. Today, in an emulation of the planning practices followed in the US and Europe, building in Spain has become extremely restrictive. 

Planning a major Spanish urban extension now depends on agreement from the municipality, the community (the regional government), the landowners, and, individually, each of the environmental, water, roads, electricity, public transportation, and social housing authorities. The result is that creating new city plans now takes an enormously long time. Creating the plan takes between six to eight years, while designing the streets and plots takes another three to seven… This is leading to high prices. Madrid asking prices are now nearly €6,000 per square meter, and Barcelona over €5,000, above Hamburg, Berlin, Frankfurt, Brussels, Milan, and Rome… But Spanish wages are low… This has left leading Spanish cities with some of the worst house price to income ratios in Europe.

Spain offers important lessons for cities in developing countries like India. Spain’s late development means that its experience has even greater relevance for us. 

Spain's cities are unusual not on any single dimension but on the combination - density, mixed use, mid-rise (not high-rise) apartments, walkability, cheap and abundant transit, high car ownership but low car use, infrastructure preceding development, and municipally planned street grids. Spain is unique in getting all the dimensions right. 

Indian cities, from metros to the lower-tier ones, are characterised by a far lower share of multi-tenement units, rigid land-use restrictions, high setbacks, poorly maintained or absent footpaths, infrastructure coming well after habitations emerge, and sorely deficient mass transit facilities (especially bus networks). 

In India, exclusive land-use zoning is the norm, with mixed-use permitted only beyond generally 15-18 m roads and above, which are present in a very small proportion of the localities. In the older areas, commercial facilities in residential areas have emerged informally over time, whereas in the planned colonies and new developments, mixed use is restricted. 

Indian cities have among the lowest share of urban households living in multi-tenement units, with Spanish cities being at the other extreme. Only 31% of urban Indian households live in flats (NSS 2018) compared to about 80% in Spanish cities, with Mumbai being the exception. The India NSS “flat” includes chawls, single-storey shared tenements, and informal walk-ups - so Indian numbers overstate what a Spaniard would recognise as a flat.

Similarly, Indian cities have among the lowest share of road network, not even a third of the UN Habitat norm. Most Indian metros are 6–12%, with only Delhi, the only Indian city with municipally planned extension, getting close.

I can think of at least a few big takeaways. Foremost, there’s no alternative to mixed-use, densified development for both greenfield and brownfield areas. 

Given its high share of detached housing, Indian cities have a great opportunity to reinvent themselves. This can be done by increasing FAR, and more importantly, doing it in a manner that allows upzoning adjacent to 9 m and 12 m roads. As I blogged here, the current upzoning deregulation, confined to plots with road width greater than 18 m, is largely superfluous. 

This must be coupled with planning norms like allowing for relaxations of setbacks, even dispensing with them and encouraging row housing, multi-tenement units, and mixed-use in terms of encouraging commercial amenities. The latter is about ensuring that people living in a locality should be able to buy their regular groceries and other household items and services from within there. Further, the local government fee and property tax regimes must consider lowering the layout development charges, building permission fees, and property taxes to encourage the realisation of these objectives. 

These policies and instruments must be deployed with a long-term perspective (as against expectations of immediate results). The objective should be that they would shape incentives and enable the gradual redevelopment of brownfield areas as densified communities. 

Second, we must use urban planning to lay down street network configurations that enable connectivity and walkability. Master plans and their development plans should keep this in mind. Minimising or even eliminating setbacks would be one step to enable such street networks. The prioritisation of walkability requires the infrastructure of footpaths and street connectivity to be able to walk, and the supply in terms of mixed-use amenities to create the demand. And all this must be combined with local campaigns to promote the culture of keeping footpaths free of encroachments. 

Third, the current dominant trend across Indian cities of the emergence of gated communities in the suburbs must be examined. These communities, while attractive for their residents and developers, go against all principles of sustainable urban development. These are largely monocultures of upper-middle and higher-income housing (the maids and drivers, and others, commute from distant places), with exclusive residential zoning, limited or no mass transit connectivity, exclusively car-based, and very poor external street connectivity (large gated enclaves with one or two entry/exit points). They impose massive negative externalities on the city and locality, while appropriating all the benefits. 

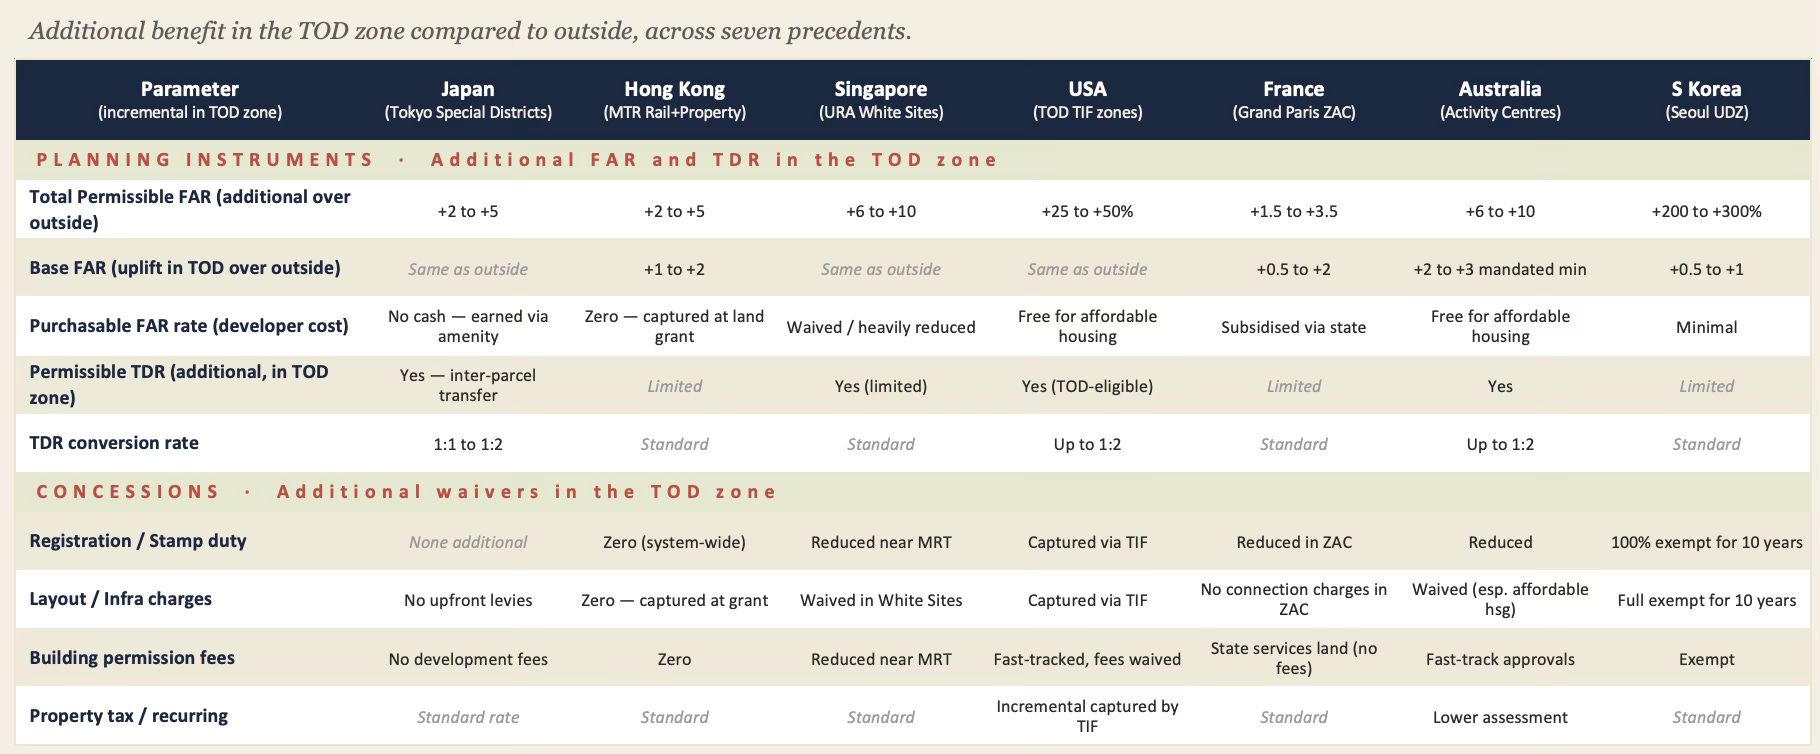
Fourth, mass transit must be at the core of all developments. All greenfield areas, in particular, must be planned around mass transit, in the form of transit-oriented development (TOD). This post discusses some principles for TOD in Indian cities, and this post outlines some of the challenges. This would require going beyond the current norm of merely giving higher FAR and offering significant incentives on fees and taxes to make it more attractive for developers to build inside the TOD zones. 

Like in Spain, the challenge is to get the combination more or less right. The good thing is that all of them lie with the states and mostly with the cities themselves. It is only required for 2-3 cities to take the lead and strike out on their own in following these principles and reinventing themselves. They can be the lighthouses that guide urban development in India. 
Friday, June 5, 2026

The challenges with TOD implementation in India

Transit-Oriented Development (TOD) remains an elusive urban planning goal for India despite nearly two decades of efforts. I blogged on TOD implementation in India here

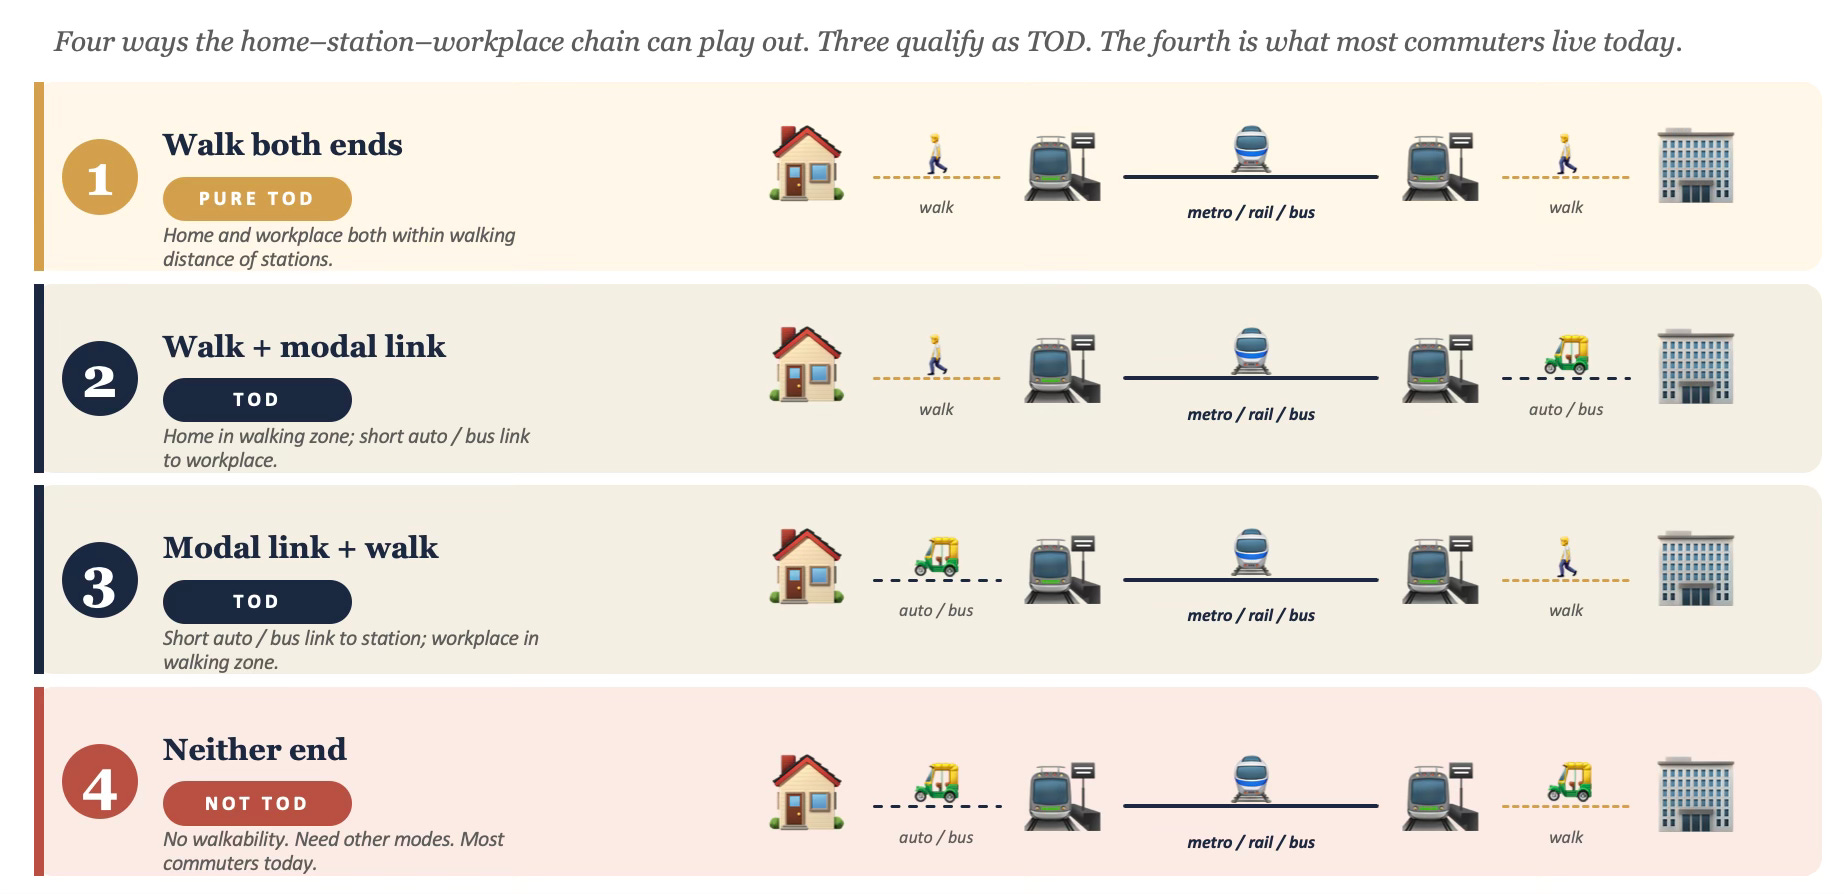
In simple terms, TOD is about minimising commute times, ideally by locating both homes and workplaces within walking distance of mass transit stations, or at least one location within walking distance.

This would entail crowding in high-density residential, office, commercial, and institutional developments around the station. This requires making it attractive for developers to prefer building within the TOD influence zone, despite its much higher land costs.

There are perhaps four big failings with the TOD policies over the years. 

1. The biggest problem is that metro and commuter railway projects are primarily seen as infrastructure projects and only distantly as opportunities for urban development and economic growth. This is manifest in the limited involvement of the municipal corporations in their design. TOD is planned and executed mainly by the transportation entities without adequate ownership by the local governments. 

The railways, Road Transport Corporations (RTCs), mass transit entities, state governments, and Urban Development Authorities (UDAs) view TOD primarily as station-based real estate development opportunities that lead to monetisation and revenue mobilisation. A second consideration is to increase housing supply. The UDAs tend to view TOD as an instrument to develop or monetise their own lands, mostly to increase housing supply. 

The idea of minimising commute times is rarely explicitly considered as an important factor. 

2. Policymakers have internalised a belief that the attractions of connectivity and higher (this too is mostly marginal) FAR are sufficient for developers to choose TOD influence zones. 

But, as I blogged here, this assumption is seriously flawed. The global experience on TOD clearly points to the need for fiscal concessions to make it attractive enough for real estate development in the pricier TOD influence zone.

Given the higher land costs in TOD zones, the case for fiscal incentives to offset them and attract developers should be obvious. A TOD policy can therefore be effective only if the conflict between the objectives of minimising commute times (or densified development around stations) and maximising revenues is resolved in favour of the former, at least in the initial years

Planning officials are averse to dense high-rises. Bureaucrats are averse to foregoing revenues. Taken together, we have a TOD gridlock. The common ground is mid-rise residential property development where government lands are available around transit stations. This is the reality of TOD in India. 

3. By its very nature, there cannot be a uniform TOD policy with tightly prescribed norms on use categories. However, governments (especially UDAs), struggling with the problem of housing, tend to view TOD primarily as an instrument to address housing problems in cities. This creates a pronounced bias towards housing in TOD zones. This, too, is a seriously flawed assumption. 

The proportion of the different use categories varies across stations. So, for example, the vicinity of a large metropolitan downtown station would be more suitable for predominantly institutional and office uses, whereas that around a smaller suburban node would be suitable primarily for residential and commercial uses. This would allow the satellite nodes to grow by feeding off the metropolitan node, and the latter to decongest and grow sustainably. A prudent policy choice, therefore, may be to leave it to the market to decide the proportions of different uses within the TOD zone depending on the strengths and opportunities of each node. 

4. TOD demands a high level of coordination among different government agencies. But it is a daunting challenge to coordinate across the universe of stakeholders involved in TOD - the municipal corporations, the UDAs, the RTCs, the metro or commuter rail SPVs, and Indian Railways.

This is best illustrated with modal integration - the seamless integration across the different modes of transport at a station, including ticketing - an essential requirement for TOD. This has proved elusive despite numerous serious efforts. Further, because each view focuses on real estate development and revenue mobilisation (or housing), and overlooks the primary objective of minimising commute times, their incentives pull in different directions. 

Even something as apparently simple as the integration of the facilities of distinct metro, commuter rail, IR, and RTC in one station becomes a challenging exercise. Their physical integration as one unit to share and optimise space and services can be a bureaucratic nightmare. Instead of planning and developing the area as an integrated unit, each entity pursues its priorities with limited synergies.

There are no easy answers here. When a problem has proved elusive for a long time, a good starting point would be recognition of its complexity and piloting it. It may therefore be prudent to focus on implementing TOD at 1-2 stations in a bespoke manner. 

What would be the nature of a TOD (the mix of categories of developments) appropriate for the station? What package of interventions and incentives would be sufficient to attract private developers to invest in the TOD influence zone? What governance arrangement can get all stakeholders on board at a high-enough level to ensure effective coordination? 

Saturday, May 9, 2026

Weekend reading links

1. China may be turning to its traditional industrial policy playbook to reduce its current import dependence and achieve self-sufficiency in food, especially animal protein, thereby upending global supply chains. 
Adam Tooze writes, pointing to analysis by the research group Systemiq.
This involves a combination of investment and innovation. Beijing is coordinating central and provincial government, state-owned enterprises and financial institutions around smart agriculture. It has licensed the commercialisation of genetically modified maize and soya. Research clusters are forming around neoproteins, fermentation-derived ingredients, feed additives and agricultural biotechnology. State banks are on hand to provide cheap finance. To channel demand, Beijing is tightening food and feed standards and tweaking procurement requirements. This is the kind of whole-system policy that has given China a commanding lead in the new energy sectors. With all the levers in play, we may, by as early as 2030, see a significant fall in soyabean demand, slashing imports from the US dramatically. By 2040, innovation and efficiency gains could plausibly turn China into a net exporter of poultry, dairy, eggs, fish and seafood. If agriculture follows the industrial policy timeline, by 2050 we should expect to see China emerging as a major source of “cultivated meat”.

2. Indonesia's President Prabowo Subianto has signed a presidential regulation cutting the percentage that ride-hailing platforms like Grab and GoTo can take from each order to a maximum on 8%, down from the current 20%. 

3. The latest on the dominance of the Magnificent Seven (US stocks make up 65% of global stock market capitalisation, up from 40% in 2010).

This is an important data point.
Bloomberg data suggests that almost 80 per cent of the S&P 500 companies that reported first-quarter results this month beat analyst earnings estimates.

4. Chinese ports facts of the week.

Chinese firms now operate or have a financial stake in at least 129 ports outside China (see map), and have spent at least $80bn on port construction from Antigua to Tanzania, with many of the investments tied to bilateral trade and regional shipping agreements. More than a third of China’s overseas ports are near maritime chokepoints, including the Strait of Malacca, the Strait of Hormuz and the Suez Canal, making them indispensable operators in strategic areas. China’s firm grip on global ports has rattled Western governments. MERICS, a think-tank in Berlin, found that after a terminal operating contract is signed, total trade with China rises by more than a fifth, while countries that allow Chinese firms to run all their terminals at one of their ports see a 19% drop in exports to the rest of the world. Operating ports allowed Chinese firms to prioritise their cargo and vessels and speed up customs and logistics...
China’s reach extends beyond physical infrastructure. LOGINK, a Chinese government-run logistics-management software, is used in at least 24 countries and 86 ports (America banned its use in 2023). LOGINK shares data with CargoSmart, another shipping-management software firm owned by COSCO, another Chinese state-owned firm, and in turn gives it access to the whereabouts of 90% of the world’s container ships. It also has a tie-up with CaiNiao, a logistics provider with hundreds of warehouses around the world... Chinese firms are also building industrial parks and manufacturing facilities close to their existing ports in Africa and Europe.

5. Good FT article on how data centres construction is triggering local backlash as residents fear for their water and electricity.

Around two-fifths of all US data centres are located in areas of high water stress, according to S&P Global... In DeKalb, a city of around 40,000 people, water demand averages just over 3mn gallons a day, rising to in excess of 4.5mn gallons at peak. The latter figure is broadly comparable to the needs of a single large AI data centre.
Data centres have already emerged as a significant driver of economic expansion in the US, accounting for 80 per cent of private sector growth in the first half of 2025, according to S&P Global... Researchers at the Lawrence Berkeley Laboratory forecast that so-called hyperscaler data centres will consume anywhere between 60bn and 124bn litres (16bn and 33bn gallons) of water on-site each year in 2028. This figure excludes the indirect water use tied to electricity generation, which the lab previously forecast could be as much as 12 times higher than direct consumption...

Of the roughly 100GW of additional electricity capacity that the US is projected to need at peak times by 2030, roughly half will be used by data centres, according to the Department of Energy... On average, American bill payers — including residential, commercial and industrial customers — paid over 6 per cent more for electricity year on year at the end of 2025. This increase was starkly higher in the mid-Atlantic states which house a large number of data centres such as Pennsylvania and Virginia, where bills rose by 19 and 10 per cent respectively.
6. Indian equities suffer from a high valuation gap with EM peers.
In recent weeks, a string of global brokerages – including Goldman Sachs, Nomura, HSBC, UBS, and JPMorgan – have downgraded Indian equities in their emerging market portfolios. The concerns converge around a common theme: Deteriorating macro conditions amid rising energy prices, weakening earnings visibility and, crucially, more attractive opportunities in other EMs... The relative valuation gap still stands at around 65 per cent—well above South Korea, Brazil, China, Mexico and South Africa. “South Korea is expected to deliver about 180 per cent earnings growth at around 7x P/E. Taiwan offers about 35 per cent growth at 18x. China delivers about 14 per cent at 11x. India, by contrast, offers 8–14 per cent growth but trades at ~19x,” said Amish Shah, head of India Research, BofA Securities. From a global allocator’s perspective, India remains expensive.

The weight of Indian equities in the MSCI EM index has continued to fall since March 2025, from 18.5% to 12.58% in March 2026.

7. India's trade deficit with China continues to grow.

On April 8, Xu Feihong, Chinese ambassador to India, posted on X: “Glad to know that China has become India’s largest trading partner in FY2026 — for the 11th straight month.” This was great news for China but not for India. The $151.1 billion trade between the two comprised $131.63 billion of exports from China to India and a meagre $19.47 billion of imports from India. It was a one-way street. China was flooding Indian markets even as it became India’s “largest trading partner”...
India must import electronics and electrical equipment ($40 billion-50 billion), machinery ($27 billion), organic chemicals ($12 billion-13 billion), plastics, steel, medical equipment, and so on from China every year. These are critical products without which the Indian economy would not be able to function. Alternative sources exist for some, but at a much steeper price. Moreover, China has diversified its supply sources, so even if not directly from it, Chinese goods would still reach India through Southeast Asian and other manufacturing bases.

8. One explanation with oil markets are still not rising as much as expected. 

In 1973, the year of the first oil price shock, I calculate from industry sources that about 80 per cent of one barrel of oil was consumed per $1,000 of global GDP in 2025 prices — 131 litres, to be precise. In 1980, the year after the Iranian revolution, this was down to 116 litres. Last year, it was 52 litres. The current level is still a lot, but the average oil burden is 60 per cent less than 50 years ago. If so much less oil is needed, real prices should have much more room to escalate before they cause the economic damage associated with previous disruptions. A simple illustration of today’s diminished oil cost burden to the global economy is to adjust the nominal price of oil not only for inflation but also for the efficiency improvements. If one does, a hypothetical price of $115 per barrel today compares with an average price of $339 in 1980 in today’s dollars. By this measure, prices have plenty of runway before the oil burden resembles 1980.
But it must be balanced against other factors pulling in the opposite direction.
Oil consumption today is more concentrated in high-value uses and in areas where there is no substitute, like road or air freight and maritime shipping. These are load-bearing economic activities, less price sensitive than discretionary or consumption-oriented drivers of growth. Once disrupted they are likely to cascade through the economy... Oil concentrated in high-value uses is a little bit like rare earths, tiny compared with the size of GDP but essential for much of it. If the size of a supply disruption requires demand to come down and prices surge to the required level, the response will be sudden with a potentially unforeseen and disproportionate impact on economic activity.

9. Jakarta's success with mass transit appears exemplary.

In 2014, Jakarta was crowned the world’s most congested city by the Stop-Start Index and a year later was ranked far below other Asian cities on livability by the Economist Intelligence Unit. Ten years later, Jakarta has the world’s largest and one of the most used bus rapid transit (BRT) systems. The old, crowded diesel commuter trains, famous for allowing passengers to ride on the roofs, are now electrified, air conditioned, and run on regular schedules linking the suburbs to the city center. There are multiple subway and light rail lines crisscrossing the city. The transformation has been remarkable: in 2015, less than 20% of residents were within walking distance of transit. Now, nearly 90% of the city has access to BRT or trains... 

The user experience has also been streamlined. All of the new MRT lines are part of an integrated digital fare system. A journey from one end of Jakarta to another is capped at 10,000 rupiah (about 70 US cents). According to WRI Indonesia, as of 2024, 10 percent of trips in Greater Jakarta are now made by public transit, compared to just 2 percent in 2015... While the JICA loans covered the cost of building the MRTS and training local staff, the full cost of operation has now fallen to the city government. So far, this has worked reasonably well, with Jokowi arguing that the cost of running the system — at about 800m billion rupiah (US$50 million) a year — is justified by the estimated 65 trillion rupiah (US$3.5 billion) in annual economic losses due to traffic.

However, much more remains to be done. 

The city has recently overtaken Tokyo as the world’s largest city, with a metro population of over 41 million people, and it is still growing rapidly. It is projected to add another 10 million people in the next 25 years. To serve this population, Greater Jakarta has only six train lines and under 250 miles (400 km) of track. Tokyo, by contrast, has an astounding 158 train lines and 2,930 miles (4,715 kilometers) of track connecting 2,210 stations throughout its massive metro area.

10. Foreign portfolio investors sharply cut exposure to Indian software firms.

Foreign Institutional Investors’ (FIIs) allocation to the Indian technology sector stood at an all-time low of 7.3% at the end of March compared to 10.1% at the end of FY25, according to brokerage Motilal Oswal Financial Services... So far in 2026, FIIs have sold $21.6 billion of Indian equities – more than the $18.9 billion they sold in all of 2025 – of which $2.4 billion worth of net sales have been of Indian IT stocks (until April 15). As a result, FII holdings in the IT sector reduced to $41.4 billion from $59.8 billion at the end of 2025.

11. TIDCO stake in Titan Company.

This state government-owned industrial promotion agency, TIDCO, has a 27.88% stake in Titan Company Ltd. That’s more than the combined 25.02% share of the Tata Group through its holding company and various subsidiaries. It makes TIDCO the main promoter of Titan, which was established in 1984 as a joint venture for manufacturing quartz analog watches at Hosur on the Tamil Nadu-Karnataka border. That company — originally Titan Watches Ltd — has today grown to a premier lifestyle accessories maker with a product portfolio spanning watches and wearables (Titan, Fastrack and Sonata brands), jewellery (Tanishq and CaratLane), eyecare, women’s bags (IRTH) and ethnic wear (Taneira sarees and tops). Titan Company earned a net profit after tax of Rs 3,337 crore on a total income of Rs 60,942 crore during the year ended March 31, 2025... at the share’s closing traded price on May 6... TIDCO’s 27.88% holding in Titan will alone be valued at Rs 1,07,873 crore... if TIDCO were to sell its entire stake in Titan Company, the Tamil Nadu government would be able to mobilise upwards of Rs 1 lakh crore and bring down its outstanding debt by roughly a tenth. The annual savings in interest outgo resulting from it will far exceed the Rs 272 crore that TIDCO received as dividend for 2024-25 from its 27.88% shareholding in Titan Company.

12. Ruchir Sharma makes some very important points about the critical role being played by retail investors in the US equity markets. Some numbers.

The share of US households that own stocks has surged this decade to nearly 60 per cent, the highest proportion in any country. Americans are all in on the market, holding more wealth in stocks than in their homes for the first time. And retail is now the most active class of traders as well. Retail’s share of daily trading in US stocks doubled in the past 15 years to 36 per cent, surpassing that of big banks or hedge funds, and making them the market price-setters. Last year US retail trading topped $5tn, exceeding the pandemic high, only this time Americans weren’t stuck at home or flush with savings.

He points to contributors to the rise of retail investors.

Three forces are encouraging small investors’ deep faith in the stock market: stimulus, bailouts and technology. Record sums of money pouring out of government and central banks, intended to lift the fortunes of the real economy, have instead been used by households (particularly the richer ones) to invest in the stock market. With policymakers rushing to rescue the economy at the slightest hint of trouble, investors have come to believe the government will always bail them out. And low-cost, mobile trading platforms have given everyone easy access to investments of all kinds.

Finally, a very important political economy dynamic arises from this trend. 

The larger the retail community gets, the more pressure builds on politicians to support the market. What was said of Wall Street banks after the crisis of 2008 can now be said of the stock market as a whole: it’s “too big to fail”.

13. The rise and rise of stock market concentration in the US.

Analysts at UBS said that a measure of how many stocks were materially contributing to the index’s performance — so-called “effective constituents” — hit a record low of 42 last week, far below the level of about 100 that has been typical in recent decades.

14. Nice interactive story of how oil from the Gulf reaches Japan, gets refined, and is distributed. 

15. The $725 bn capex spending projected by the Big Tech (Amazon, Alphabet, Microsoft and Meta) is estimated to leave them with their lowest free cash flow since 2014. 

16. Fascinating 5km split of Sebastian Sawe's sub-two-hour marathon.

Saturday, January 10, 2026

Weekend reading links

 1. US equity market exceptionalism may have peaked, says Ruchir Sharma

A weakening dollar helped the rest of the world outperform the US in 2025, reducing the country’s share of the global stock market index from a high point of 66 per cent at the end of 2024 to 64 per cent now. While “American exceptionalism” may have peaked, this shift has ample room left to run given the still wide disconnect between America’s market cap and its 26 per cent share of the global economy.

I agree with this assessment of the Chinese economy. 

China’s domestic economy is hardly growing, weighed down by a busted property market, too much debt and a shrinking population. But strength defines the export sector, which is expanding its share of global markets and propping up the overall economy. Without the export surge, nominal GDP growth would be barely 3 per cent, significantly lower than the officially reported rate of about 4 per cent. Wall Street analysts and economists keep urging China to unleash new stimulus, but their Keynesian bias is blinding them to the underlying problems. China’s total debt including households and corporations is already above 300 per cent of GDP; its augmented fiscal deficit (which includes its influential local governments) is above 11 per cent of GDP. Lacking the money for stimulus, Beijing will be hard pressed to spend more, and the domestic economy will keep disappointing... For the last two years, China has engineered a dramatic increase in its export volumes by slashing prices and holding down the value of the renminbi. As a result, China continues to gain global market share at the expense of rival exporters.

2. Adam Tooze points to an important consequence of Trump's Venezuela invasion: the stabilisation of Guyana's oil market. 

3. This about the invasion of Venezuela and the kidnapping of Nicolas Maduro, and the emerging Donroe Doctrine generally is important. 
Competition with China over resources in America’s “backyard” will only get fiercer, predicts Stephanie Junger-Moat, chief executive of Karcsi Global, a corporate consulting firm focused on Latin America. Chinese companies have extensive interests in both oil and mining in Latin America. They have invested in the “Lithium Triangle” of Argentina, Chile and Bolivia to supply their battery industry and have significant stakes in Chilean copper and Peruvian iron ore. Junger-Moat says competition could intensify if Trump moves to exert more control over the Panama Canal, which handles 5 per cent of maritime trade, and puts pressure on Latin American countries to limit Chinese trade and investment. “The clear short-term losers would be the countries stuck in the middle of this that are resource rich but with little negotiating power,” she says.

Given China's significant investments in mineral extraction in Latin American countries, the US invasion raises the prospects of a face-off between the two countries in America's backyard.

China has gone from doing nearly no business in the region two decades ago to bilateral trade worth more than $500 billion in 2024. Chinese mining companies extract copper from Peru and lithium from Argentina. China’s agricultural conglomerates import lifeline commodities like soybeans from Brazil. Chinese utilities power entire cities. China controls much of the shipping infrastructure and the ports that transit goods across the Pacific. Latin America’s 670 million consumers are also buying Chinese brands. In Mexico, dealerships sell gasoline-powered Chery cars and MG sedans. In Brazil, the fast-food chain Mixue sells ice cream, the e-commerce platform Meituan delivers food and the ride-hailing service Didi ferries people around. In Peru, Xiaomi smartphones are popular...

China’s pursuit of deeper ties in Latin America began two decades ago. At the time, Chinese companies were scouring the world to secure copper, oil and iron ore to power China’s breathtaking economic growth. Chinese banks extended ever-larger loans to countries across Latin America in exchange for oil and critical minerals, and along the way China began building railways and highways and selling its goods. Since then, China has economically displaced the United States in 10 of 12 countries in South America alone, according to research by Francisco Urdinez, an associate professor of political science at the Pontifical Catholic University of Chile. China now engages in more trade, investment and development financing than the United States in most of the region, including Central America. China is Latin America’s largest official source of aid and credit, offering an estimated $303 billion in financing across the region between 2000 and 2023, according to AidData, a research institute at the College of William and Mary in Williamsburg, Va. Between 2014 and 2023, for every $1 lent or given in aid by the United States in Latin America and the Caribbean, China provided $3, said Brad Parks, the executive director of AidData. These investments in many cases have left the countries saddled with debt and obligations to fulfill contracts for commodities like oil.

Venezuela itself may well become the first flash point. 

China is still owed, by one estimate, about $10 billion that Venezuela is paying off through oil shipments. In 2024, more than half of its crude exports — or 768,000 barrels — went to China, according to Kpler, a global oil monitoring service.
Dixon, a 30-year-old company, is on track to produce around 40 million smartphones in FY26, capturing over 50% of India’s mobile outsourcing market. Yet, it spends less than 1% of its revenue on R&D, according to its annual reports. In contrast, Chinese ODM Huaqin Technology, which also started off as a contract manufacturer, spends around 5% of its revenue on R&D... India’s largest listed EMS players with foreign-partner JVs—the likes of Dixon, Syrma SGS, and Amber Enterprises—spend 0.2–0.9% of their revenue on R&D. Their patents reflect this: Dixon’s are valued at a mere Rs 2 crore, while Syrma’s intangible assets, valued at over Rs 1.5 crore in FY25, grew through acquisitions rather than internal R&D.

They have also not been able to capitalise on their JVs with foreign design companies (ODMs). 

Indian EMS players have chased this be-all-end-all through joint ventures (JV) with Chinese, American, and Taiwanese original design manufacturers (ODM). They’ve brought home some of the biggest ODMs through JVs such as Dixon-Longcheer, Bhagwati-Huaqin, and Syrma SGS-Shinhyup Electronic... On the face of it, Dixon and its ilk’s JVs with foreign partners seem a win-win Indian companies learn to manufacture complex products such as smartphones and TVs, and foreign players get access to one of the largest consumer-electronics markets in the world. But there’s often an implicit power imbalance in the way they’re structured. 

“Such partnerships transfer process discipline, quality systems, and operational know-how, but core design authority and roadmap ownership usually stay with the foreign partner,” says Sanchit Vir Gogia, an analyst at tech-research-and-advisory firm Greyhound Research. Another executive at an EMS firm put it more directly. “Even if they tell us how a certain printed circuit board is made, it’s limited to supporting its manufacturing in our factories. We never know what future technologies foreign companies are working on back home,” he says. The result: partnerships meant to facilitate tech-transfer from one partner to another don’t actually end up doing so. The little design that is getting localised in India is that which is tweaking pre-existing products for local use cases... Foreign partners carefully control what—and how much—knowledge flows to their Indian counterparts, which creates a hierarchical power dynamic within the partnership.
On top of it all, the integration of design and manufacturing ecosystems remains broken. “India has research institutions and it has manufacturing lines. What it lacks are applied industrial labs tied directly to clusters—places where engineers solve production problems, test reliability, and feed learning back into design,” says Gogia. Without this shared infrastructure, firms face a beguiling choice: over-invest individually or under-invest collectively. Most end up choosing the latter. Most EMS firms operate on razor-thin margins. “Where capital costs are already high, long-horizon R&D stops being a strategic bet and starts looking like a threat to liquidity,” says Gogia. The only thing that makes it viable is scale.

5. In a reflection of ageing and weak infrastructure, parts of Berlin suffers a power outage that stretches from Saturday to Wednesday, in Germany's longest outage since the Second World War!

6. India's declining tax to GDP ratio

And tax buoyancy

I'll blog more on this separately. But this is intriguing. 

Under India’s electric bus programme, cities don’t buy e-buses directly. Procurement runs through central agencies earlier under the Faster Adoption and Manufacturing of Electric Vehicles (FAME) scheme, and now under PM-ebus sewa. These agencies aggregate demand, float tenders, and sign long-term contracts with manufacturers and operators. The goal is scale and cost control. It also shifts control away from cities. Central government agencies such as CESL and NVVN act as buyers of record. They sign contracts with OEMs and hold warranties. Payments flow through them. Meanwhile, state transport undertakings (STUs) operate the buses. They schedule routes, deploy drivers, and handle breakdowns on the ground—paying a per-kilometre fee which goes to the OEMs. “This structure wasn’t accidental,” said a former NVVN official. “The electric bus push came from the Centre, and the subsidy came from the Centre. So control also stayed central. That’s very different from how states normally buy buses.”
... The model works when buses run as expected. When they do not, authority fragments. STUs can log faults and track downtime. They cannot escalate repeated failures directly to manufacturers or demand design fixes. Those decisions sit higher up the chain and move through contract clauses and payment cycles... The state transport units can track downtime and flag violations, but the actual fines are processed by the contract owner—the central aggregator agencies in this case. What follows is less a punishment than a reconciliation exercise. Numbers are logged. Penalties are calculated. And eventually, amounts are just adjusted against future payments, often weeks later... More importantly, those deductions are capped by design. Under the gross cost contracts used for electric buses, penalties apply only after fleet availability falls below a defined threshold, usually around 85–90%. Contracts also set a maximum amount that can be deducted in a day and another cap for the entire month. Once those caps are reached, deductions stop, even if the buses continue to remain idle. Effectively, a bus that breaks down briefly and one that is out of service for several days can end up facing similar financial penalties.

8. Elon Musk tweeted in response to Nvidia's launch of its own autonomous driving software. 

What they will find is that it’s easy to get to 99% and then super hard to solve the long tail of the distribution.

This is the challenge for AI applications

Musk is right that it is the edge cases that have made fully autonomous driving so hard. The real world is way messier than any computer simulation. A good example occurred in San Francisco in December when a power outage knocked out scores of traffic lights, causing problems for the robotaxis operated by Waymo, owned by Alphabet. In spite of its fleet clocking up more than 100mn miles of autonomous driving, Waymo’s cars froze when the lights went dark, clogging the city’s streets. In such unexpected circumstances, remote human interventions are still needed to instruct the cars how to respond. Waymo uses an app called Honk to summon human gig workers to solve other problems too, such as shutting car doors after passengers have left them open.

9. China's EV manufacturing is increasingly dependent on exports for survival.

The China Passenger Car Association, an industry group based in Beijing, has forecast the country’s auto exports will rise by 20 per cent this year, driven by EV sales from Tesla rival BYD... Mexico, Middle East, Russia and parts of Europe are among the top export markets, according to Chinese data. Chinese carmakers are rapidly setting up factories and sales networks around the world to circumvent rising tariffs, except in the US, where they are limited by levies and security controls. Overseas sales, which include exports and cars made by Chinese companies in markets outside China, account for about 20 per cent of the Chinese industry revenue and close to half its earnings, according to UBS. Seven of China’s biggest auto groups — BYD, Great Wall Motor, Chery, SAIC, Changan, GAC and Geely — have 31 factories overseas. Shenzhen-based BYD, UBS analysts noted, was “the most aggressive” with plans to double the number of its European stores from about 1,000 to 2,000 by the end of 2026. The domestic outlook in China remains tough as Beijing scales back tax breaks and subsidies for electric cars. This will put financial pressure on a crowded EV market where more than 100 companies face wafer-thin margins and a regulatory crackdown on unsustainable discounting practices. Goldman Sachs analysts said profits this year would be further diminished with “aggressive” EV competition, with the release of 119 new models — roughly one every three days — and slowing volume growth.

This is an excellent graphic on technology disruption: in the Chinese automobile market.

As China’s economy boomed and car ownership soared, annual ICE sales rose from 3.9mn in 2005 to peak at 23.9mn in 2017, according to data from the China Association of Automobile Manufacturers, another local industry group. Now, having retreated to about 14.5mn in 2025, ICE sales in China are set to sink to below 5mn by 2030, their lowest level in about 25 years, UBS has forecast.
An alternative telling of the boom in software employment and salaries is a boom in demand for people who — while certainly mathematically skilled — are primarily distinguished by their aptitude in using these skills to work closely with others in finding creative solutions to complex and multi-faceted problems. Contra the narrow focus of policymakers on Stem subjects or coding, now more than ever our economy rewards broad skillsets: team players, problem solvers, good communicators and creative thinkers.
And this.

Even within tech and other deeply quantitative fields, roles combining strong coding skills with creativity and collaboration are the ones in which people have thrived. People in mathematical jobs with the lowest emphasis on social skills (actuaries and mathematicians among others) have fared markedly worse both in terms of employment and earnings than those for whom collaboration, creativity and interpersonal interaction play a larger role (software developers among them).

11. Finally, the job market for economists in the US is bleak.