Substack

Tuesday, July 21, 2026

Lessons from Spain for urban planning

Football is not the only area where we can learn from Spain. Energy transition, infrastructure construction and urban planning are some others. This one is about urban planning. 

An essay in Works in Progress examined how traditional apartments have declined across Europe, except in Spain, and the role played by late development and public policy. It also underlines how Spain uniquely got all the basics of urban planning right - land readjustment, infrastructure development, mixed-use, densification, connected street network, walkability, mass transit, and low car usage. 

This is a good description of mixed-use density in Spanish cities that promote walkability and mass transit commutes, and limit sprawl and carbon emissions. 

Spain’s cities are unusual. They are much denser, tighter, and more deliberate than other European cities, let alone North American ones. They reject picket fence for apartment block and choose balcony over front lawn. Two thirds of Spaniards live in flats, against 41 percent of Poles, 36 percent of the French, and just 10 percent of the Irish. Of the remaining third, most live in terraced rowhouses. In Spain’s cities, over four fifths of people live in an apartment. At the edge of Madrid or Valencia, dense mid-rise blocks stand beside open countryside without sprawl in between, something that has almost never happened in an English-speaking country, and that has been rare in France or Germany for a century… Spain’s settlements have some of Europe’s lowest per capita transport emissions, in part because about 70 percent of trips in Madrid and Barcelona are made on foot, tram, or metro. Almost every neighborhood is mixed use; almost all urban Spaniards live in the ‘fifteen-minute cities’ that seem like remote ideals in most affluent societies.

This is a good comparison with other Southern European cities, and even here, Spain stands out. 

Spain is not alone in Europe in having become wealthy only recently: most Southern European countries have a similar economic history. And Portugal, Italy, and Greece do share the distinctive features of Spanish urbanism to some extent, with relatively dense cities and relatively high shares of people living in apartments (46 percent in Portugal, 53 percent in Italy and 59 percent in Greece compared to 65 percent in Spain). In other ways, however, Spain is distinctive in Southern Europe. The cities of Portugal, Greece, and Southern or Central Italy are generally surrounded by ragged fringes of unplanned suburban development: their urban cores are dense in the same way as Spain’s, but their peripheries are a chaotic mixture. The transport situation is also dramatically different. About half of journeys in Lisbon and Athens are by car; in Rome, the figure is two thirds, with another substantial share on mopeds; in Nicosia, it is 85 percent, the highest of any European capital. In Madrid, the modal share of cars is below 30 percent. Cities tend to be dense all over Southern Europe, but they have not all achieved the transport outcomes that urbanists associate with density: in this respect, Spain is the outstanding model.

Public policy has played an important role in making this difference. In Britain and the US, the government develops the main arterial roads and allows development that follows the development control regulations, which results in fragmented urban forms (in terms of plot sizes and types of development). In Spain, the authorities undertake land re-adjustments like the Town Planning Schemes of Gujarat and thereby lay down clear boundaries and forms of development. 

This also means a high level of infrastructure development with a high density of roads, based on plans that connect streets and localities to promote pedestrians and cyclists.

This has yielded cities with exceptionally good infrastructure. About 28 percent of Madrid’s surface area is taken up by roads, almost exactly the 30 percent recommended by UN specialists. This compares to 21 percent in Paris, 19 percent in London and 20 percent in New York. Even Los Angeles, a famously road-heavy city, uses only 25 percent for roads. As we have seen, these roads are also more skilfully interconnected, which is indispensable for pedestrians and cyclists

A large road network has not detracted from policy focus on public transport. 

Despite having far superior road infrastructure, Spanish cities also have high public transport use. Around 60 percent of trips in the Madrid metropolitan area and over 70 percent of trips in the Barcelona metropolitan area are made through public or active travel, similar to other major European cities and far higher than American, Canadian, or Australian cities, which typically fall below 30 percent. In other words, Spanish cities have Los Angeles-tier road infrastructure and Paris-tier public transport access. This is paired with some of the continent’s best intercity transport. Spain has significantly more motorways than any other European country: 17,228 kilometers, versus 13,183 in Germany and 11,671 in France. It has the second-longest high-speed rail network in the world, after China.

In fact, public policy played perhaps an even more important role by keeping infrastructure construction costs low and ensuring construction was done within budget and without delays. It was able to utilise something like €200 billion in cohesion funding received from the EU between the late 1980s and 2020. 

More importantly, Spain kept costs low… Spain, combined with its non-EU injections, built 4,000 kilometers of high-speed rail, 10,000 kilometers of motorway, and numerous metros, trams, ring roads, and radial arterials, because it kept costs extremely low. It did this by maintaining good practice: flexible environmental rules (although these have since become more problematic), top-tier in-house capacity in engineering and contracting, a commitment to a steady pipeline of projects over decades, and, above all, rapid decision-making, avoiding the costly delays and redesigns common elsewhere. Another part of this was giving small areas the power to decide on and fund infrastructure, like the Madrid Metro, avoiding the ping pong between authorities seen in some high-cost countries. 

Together, this has allowed it to build metros more than 20 times cheaper than in New York City. For the price of one mile of the New York’s Second Avenue Subway extension, Spanish builders covered the entire 35-mile 1995–1999 expansion of the Madrid Metro. As a result, Spanish transport infrastructure is both abundant and cheap. Madrid’s metro underwent one of the fastest growth spurts in the worldbetween 1995 and 2007, adding around 203 kilometers of new lines to its already impressive footprint​. Barcelona has been continuously expanding its metro network since the Second World War: in a period of astonishing activity between 1990 and 2010 there were 18 separate extensions, and seven more since.

Cities including Valencia, Bilbao, Seville, and Málaga all built metro or light rail systems in the 1990s and 2000s. Madrid and Barcelona have both joined their old suburban rail lines up into Cercanías/Rodalies systems, similar to London’s Crossrail scheme but far more comprehensive (though not always well run). The upshot of this is that, despite having some of the world’s best road infrastructure, Spain still has relatively low levels of car use and ownership: the modal share of driving is low not because driving is a bad option, but because other options are so good.

Since the late 2000s, changes in laws placing a series of restrictions on buildings have adversely impacted Spanish urban planning. For example, before 2007, Spanish land was buildable by default; the same was inverted to allow housing construction only if specifically zoned by the local council. Today, in an emulation of the planning practices followed in the US and Europe, building in Spain has become extremely restrictive. 

Planning a major Spanish urban extension now depends on agreement from the municipality, the community (the regional government), the landowners, and, individually, each of the environmental, water, roads, electricity, public transportation, and social housing authorities. The result is that creating new city plans now takes an enormously long time. Creating the plan takes between six to eight years, while designing the streets and plots takes another three to seven… This is leading to high prices. Madrid asking prices are now nearly €6,000 per square meter, and Barcelona over €5,000, above Hamburg, Berlin, Frankfurt, Brussels, Milan, and Rome… But Spanish wages are low… This has left leading Spanish cities with some of the worst house price to income ratios in Europe.

Spain offers important lessons for cities in developing countries like India. Spain’s late development means that its experience has even greater relevance for us. 

Spain's cities are unusual not on any single dimension but on the combination - density, mixed use, mid-rise (not high-rise) apartments, walkability, cheap and abundant transit, high car ownership but low car use, infrastructure preceding development, and municipally planned street grids. Spain is unique in getting all the dimensions right. 

Indian cities, from metros to the lower-tier ones, are characterised by a far lower share of multi-tenement units, rigid land-use restrictions, high setbacks, poorly maintained or absent footpaths, infrastructure coming well after habitations emerge, and sorely deficient mass transit facilities (especially bus networks). 

In India, exclusive land-use zoning is the norm, with mixed-use permitted only beyond generally 15-18 m roads and above, which are present in a very small proportion of the localities. In the older areas, commercial facilities in residential areas have emerged informally over time, whereas in the planned colonies and new developments, mixed use is restricted. 

Indian cities have among the lowest share of urban households living in multi-tenement units, with Spanish cities being at the other extreme. Only 31% of urban Indian households live in flats (NSS 2018) compared to about 80% in Spanish cities, with Mumbai being the exception. The India NSS “flat” includes chawls, single-storey shared tenements, and informal walk-ups - so Indian numbers overstate what a Spaniard would recognise as a flat.

Similarly, Indian cities have among the lowest share of road network, not even a third of the UN Habitat norm. Most Indian metros are 6–12%, with only Delhi, the only Indian city with municipally planned extension, getting close.

I can think of at least a few big takeaways. Foremost, there’s no alternative to mixed-use, densified development for both greenfield and brownfield areas. 

Given its high share of detached housing, Indian cities have a great opportunity to reinvent themselves. This can be done by increasing FAR, and more importantly, doing it in a manner that allows upzoning adjacent to 9 m and 12 m roads. As I blogged here, the current upzoning deregulation, confined to plots with road width greater than 18 m, is largely superfluous. 

This must be coupled with planning norms like allowing for relaxations of setbacks, even dispensing with them and encouraging row housing, multi-tenement units, and mixed-use in terms of encouraging commercial amenities. The latter is about ensuring that people living in a locality should be able to buy their regular groceries and other household items and services from within there. Further, the local government fee and property tax regimes must consider lowering the layout development charges, building permission fees, and property taxes to encourage the realisation of these objectives. 

These policies and instruments must be deployed with a long-term perspective (as against expectations of immediate results). The objective should be that they would shape incentives and enable the gradual redevelopment of brownfield areas as densified communities. 

Second, we must use urban planning to lay down street network configurations that enable connectivity and walkability. Master plans and their development plans should keep this in mind. Minimising or even eliminating setbacks would be one step to enable such street networks. The prioritisation of walkability requires the infrastructure of footpaths and street connectivity to be able to walk, and the supply in terms of mixed-use amenities to create the demand. And all this must be combined with local campaigns to promote the culture of keeping footpaths free of encroachments. 

Third, the current dominant trend across Indian cities of the emergence of gated communities in the suburbs must be examined. These communities, while attractive for their residents and developers, go against all principles of sustainable urban development. These are largely monocultures of upper-middle and higher-income housing (the maids and drivers, and others, commute from distant places), with exclusive residential zoning, limited or no mass transit connectivity, exclusively car-based, and very poor external street connectivity (large gated enclaves with one or two entry/exit points). They impose massive negative externalities on the city and locality, while appropriating all the benefits. 

Fourth, mass transit must be at the core of all developments. All greenfield areas, in particular, must be planned around mass transit, in the form of transit-oriented development (TOD). This post discusses some principles for TOD in Indian cities, and this post outlines some of the challenges. This would require going beyond the current norm of merely giving higher FAR and offering significant incentives on fees and taxes to make it more attractive for developers to build inside the TOD zones. 

Like in Spain, the challenge is to get the combination more or less right. The good thing is that all of them lie with the states and mostly with the cities themselves. It is only required for 2-3 cities to take the lead and strike out on their own in following these principles and reinventing themselves. They can be the lighthouses that guide urban development in India. 

Saturday, July 18, 2026

Weekend reading links

1. Are people overreacting to small struggles?

When asked if they would consider someone experiencing typical fluctuations in mood (described as broad happiness but occasional moments of worry, frustration or loss of confidence) as having a mental illness, more than half of young Americans say yes, up from just a fifth 15 years ago.

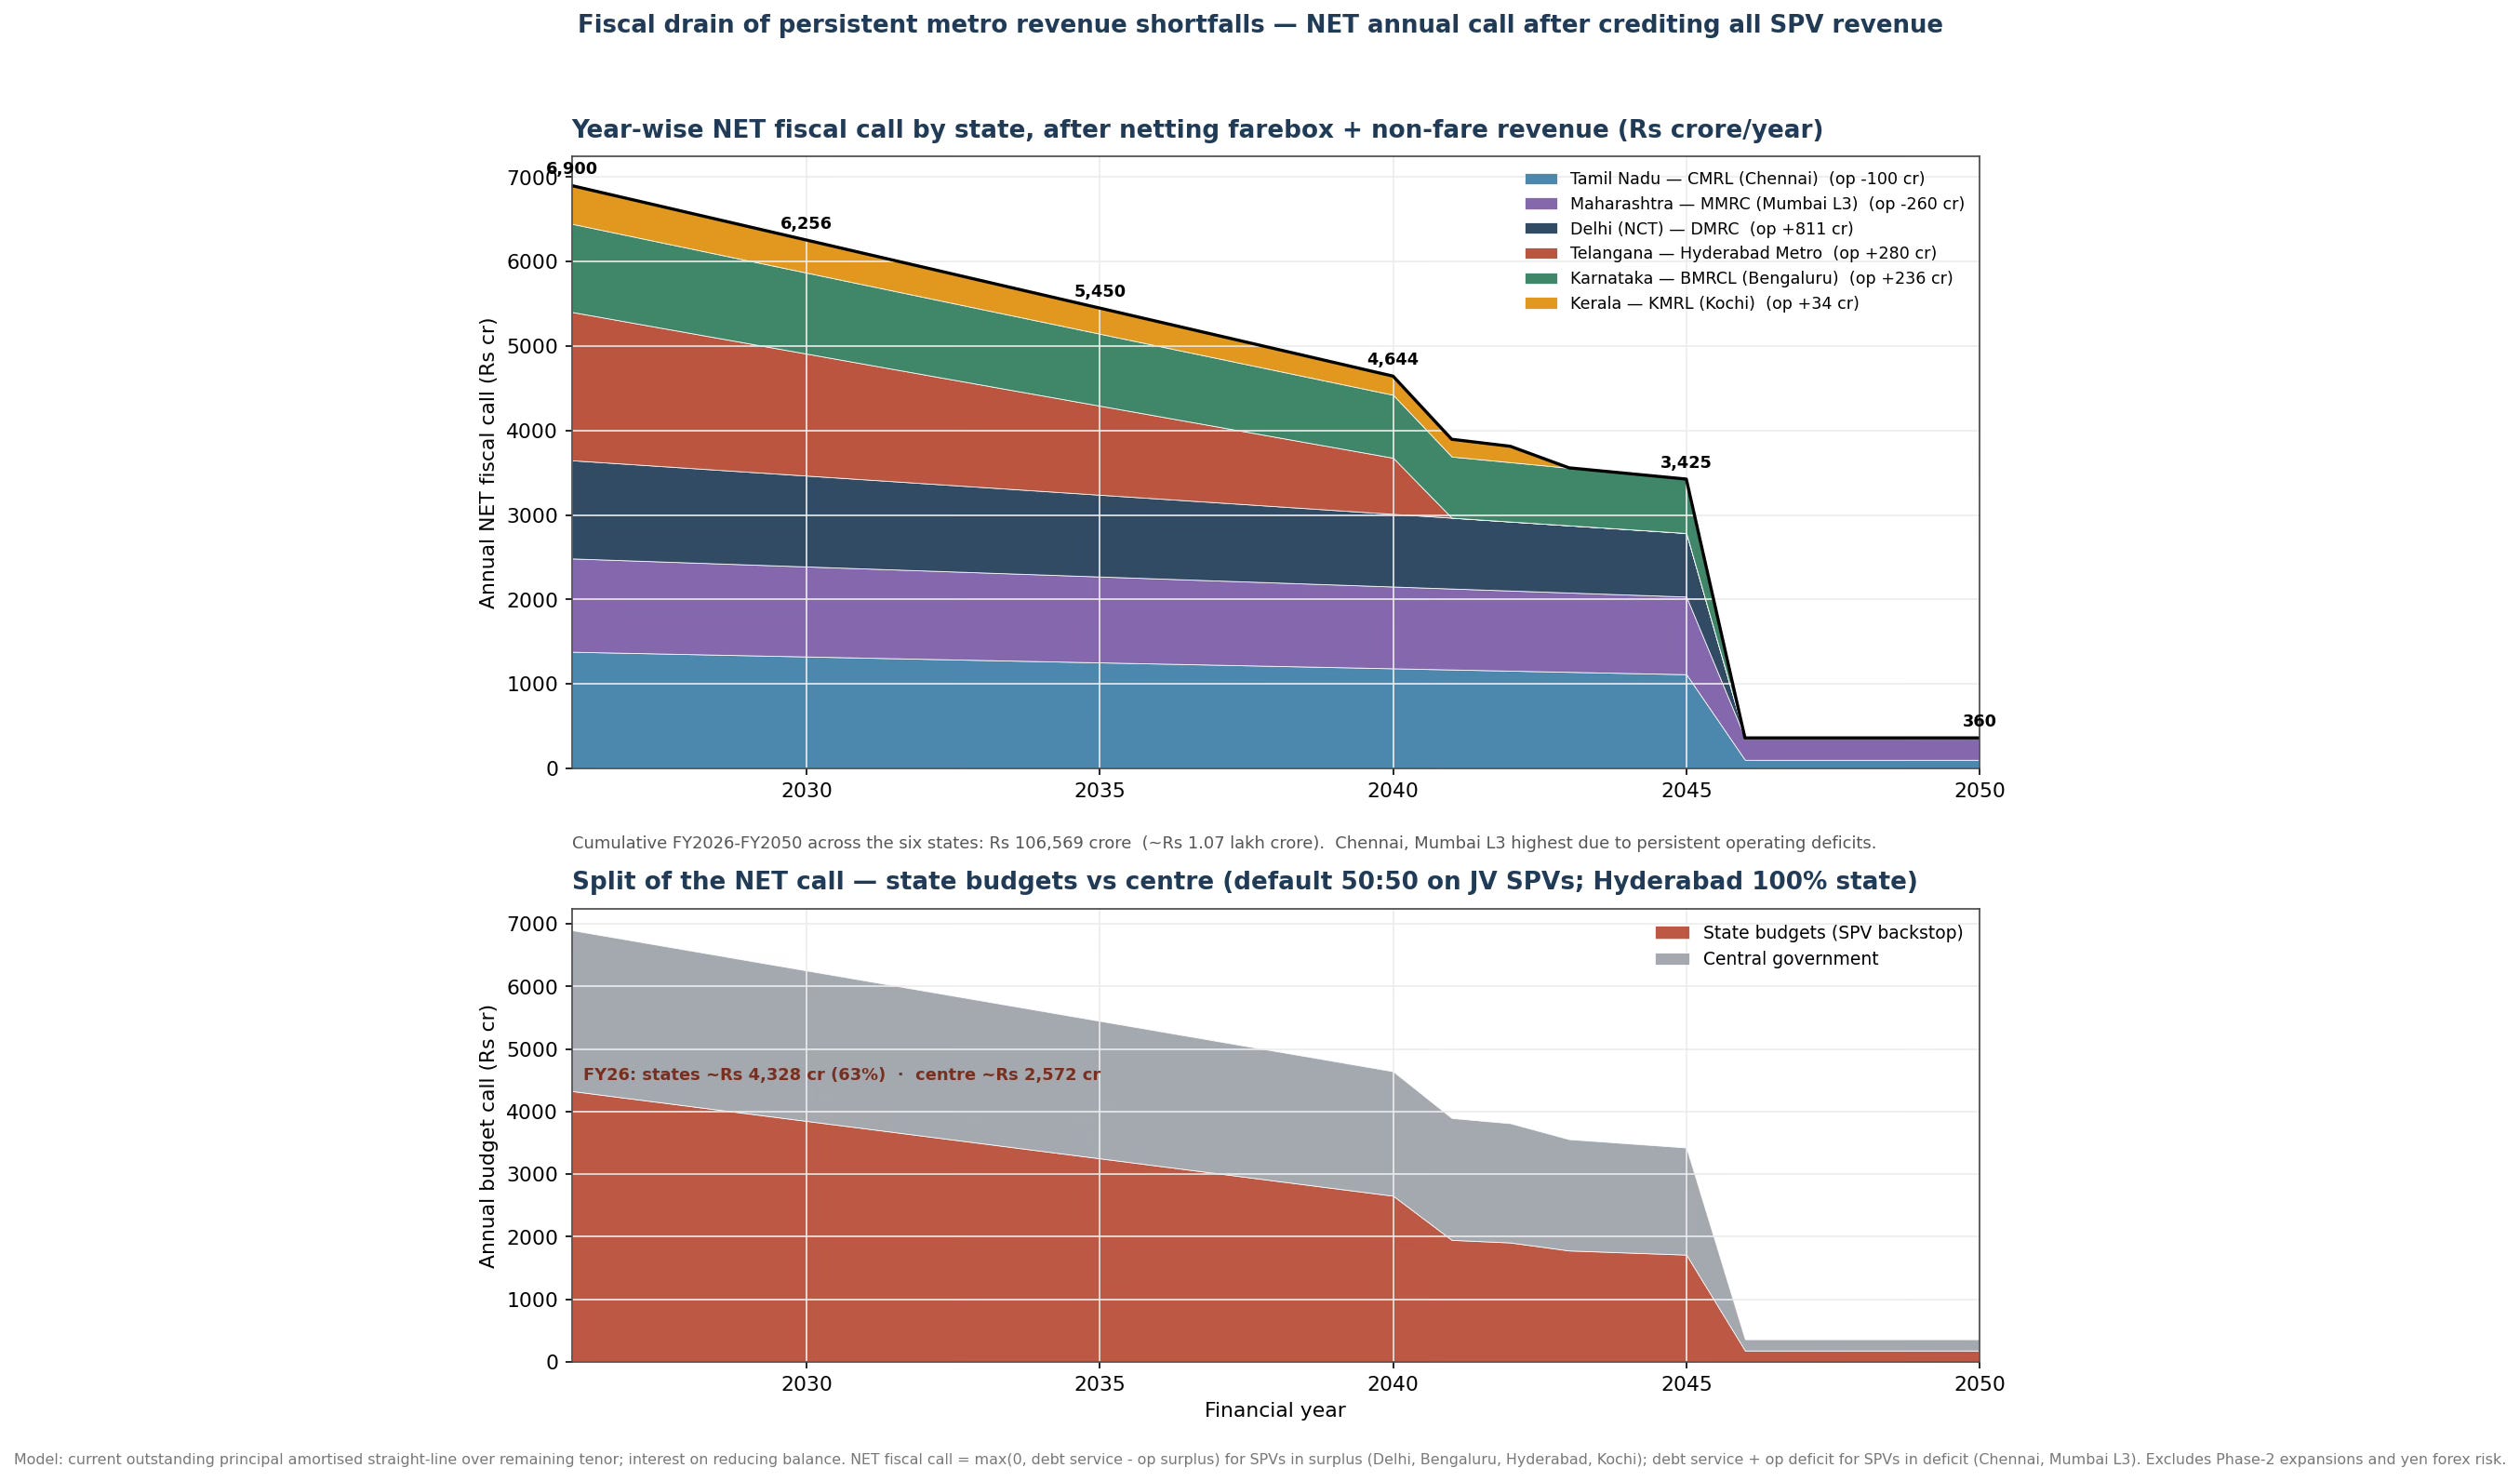
2. A picture of state finances.

3. The promise of quantum computing.
Quantum computers can transcend the limitations of the traditional binary computer bit, which can exist in two states, denoted by zero and one. By contrast, quantum bits, or “qubits”, can exist in both those states at once. This allows quantum machines to survey multiple potential solutions simultaneously, rather than dealing with them one by one like a conventional computer. One analogy is a maze. Where a quantum computer can examine the whole map to find a way through, a traditional machine will keep exploring dead ends until it finds the route. Quantum computers’ superior processing power should make them better able to generalise from small amounts of data and sift through multiple complex patterns...
But many companies are already experimenting with the technology because of its promised leap in capability, predicting early uses for the machines in areas such as chemistry and materials science. The idea is that because of their own workings and structure the computers will be better able to analyse and predict chemical behaviour determined by atomic and subatomic interactions governed by quantum rules. In a sense, they will be speaking the same language rather than translating an analysis into a string of ones and zeros as a traditional computer does. As a result, a sufficiently powerful quantum machine should in theory be adept at predicting the interactions between drugs and living cells that determine whether a new pharmaceutical will work. Such possibilities have already led tech companies to pair up with industrial groups.

4. India's trade account in a nutshell.

In 2025-26, its exports of services, at $421.3 billion, was close to the export of goods worth $446.1 billion. On the other hand, imports of goods ($783.4 billion) were way above the imports of services ($204.7 billion). Thus, while India recorded a merchandise trade deficit of $337.3 billion, it had a surplus of $216.6 billion on the services account.

5. Brilliant article by Simon Kuper on how football came to be dominated by Western Europe.

Western Europeans didn’t start by asking, “How can we win the World Cup?” Instead, they pursued a different goal: making amateur football cheap and widely available. The intended outputs were happiness, community and public health. Winning World Cups was a byproduct... I began playing football aged six, in 1976, after moving from London to Leiden in the Netherlands. Most Dutch boys I met belonged to a football club... The little Leiden region had dozens of football clubs. Some fielded 20 senior teams, seven teams of under-eights and so on. Many people built their identity and social life on being the right-back or linesman of the 14th team. The Netherlands in the 1970s reached two World Cup finals. Everyone played and understood how to play. Football is geometry — about creating space when you have the ball, and shrinking it when you don’t. That knowledge is all around you in western Europe, unlike in Asia, Africa, the US or Brazil... In 2017, the average Dutch person lived 1.6km from a football field. Neighbouring Germany’s football federation is the world’s largest sports association, with more than 7.7mn members...

As a father, I raised three footballers in Paris, now the game’s deepest talent pool. Almost all Parisian suburbs, or banlieues, have well-kept sports complexes, with artificial fields, used nonstop: at half-time of any amateur game, children storm on to the field for a kickaround. So structured is the system that my son had to earn a coaching diploma to train his little club’s under-eights. His own beloved coach, Mustapha Sangaré, who only joined a football club aged 15, now plays for Bulgaria’s Levski Sofia and Mali. He is far from an anomaly: almost 100 players across all squads in the current World Cup were born in France and just under 70 in the Netherlands.

In another article Tej Parikh looks at why China and India does so badly in football.

This is a striking statistic, pointing how globalised football has become and how the leading European clubs have become the feeding grounds for national teams. 

At this World Cup, more than 72 per cent of players appear for a club outside the country of their national team, and almost one in four are foreign born. (More than half of Cape Verde’s squad was born outside the nation and ply their trade in various European leagues.)

6. In what will prove to be a dramatic decision, DP World, which operates the Jebel Ali port that has been paralysed by the closure of the Strait of Hormuz, is reportedly planning to build a new port and a container terminal on the UAE's eastern coastal area of Fujairah. 

Shifting some of the port’s capacity outside Dubai marks a seismic change for the emirate, which has established itself as a global trade and finance hub partly off the back of Jebel Ali’s growth... But DP World’s plans align with a broader UAE government initiative to attempt to bulletproof its economy against future hostilities with Iran by reducing its dependence on the strait, where shipping has been disrupted by Iranian drones and missile strikes since the US-Israeli attack. The new project would deepen DP World’s presence on the Gulf of Oman, allowing containers to enter and leave the country without having to pass through the strait, before moving them on trucks overland to Dubai, Abu Dhabi and neighbouring Gulf countries. Since the war began at the end of February, Iran has fired nearly 3,000 drones or missiles at the UAE — more than any other country... DP World’s plans underline how the Iran war has forced governments and companies in the region to reconsider infrastructure and economic corridors developed on the premise that there would be uninterrupted passage through the strait.

7. Rote memorisation in schools is celebrated in China.

The guidelines to the gaokao, an exam for 18-year-olds and the world’s largest standardised test, describe memorisation as “the most basic level of ability”, placing it first among six traits that include comprehension, analysis and synthesis, appreciation and evaluation, expression and application, and inquiry. At the simplest level, the Chinese script itself, which operates at the level of the syllable and involves thousands of individually meaningful characters, requires years of memorisation... It is hard not to draw a contrast with the English-language west, where rote memorisation has taken on a faintly pejorative meaning. More than a century and a half ago, at the height of Britain’s industrial age, Charles Dickens was skewering the “facts alone are wanted in life” approach of fictional educator Gradgrind in the novel Hard Times.

8. Trump's makeover of the US State Department

Abandoning the precedent of the past 60 years, Trump has brushed aside the foreign service officers who have typically run at least two-thirds of embassies. Of the 101 nominations for ambassadorships in his second term, just nine were career diplomats. All this is against the backdrop of swingeing cuts to the department, whose workforce has shrunk by more than 3,000, over 20 per cent, since Trump resumed office.
9. China's remarkable success in reducing air pollution by 60% since 2013. 

10. Interesting that the IT sector explains half the difference in productivity growth between the US and EU.
Strikingly, even though the tech sector was only 9.2 per cent of US GDP, against 5.4 per cent of the EU’s, almost half of the difference in productivity growth between the two economies was explained by differences in the relative size of this one sector. Moreover, productivity growth in the EU’s (relatively small) tech sector was also measured as being lower than in the US one. So, overall, the tech sector alone accounts for well over half of the overall difference in growth of GDP per head.

This is important

Life expectancy for US men was 76.5 in 2024, against an average of 80.5 in comparable high-income countries. For women, it was 81.4 against 84.8. That is despite spending a far higher proportion of its GDP on health. The US homicide rate was 5.9 per 100,000 in 2023, against 1.3 in France and 0.9 in Germany. Its prison population was 542 per 100,000 in 2023, against 130 in France and 69 in Germany. Thus, if one takes a wider view of human welfare, the US is very far from superior.

11. China reports the lowest quarterly growth rate in decades at 4.3% for the second quarter of 2026. Industrial production and exports are propping up growth, even as consumption declines.

Retail sales added just 1 per cent in June from a year earlier, while fixed-asset investment was down 5.7 per cent year on year for the first half of the year, compared to 4.1 per cent in the first five months. Industrial production, one sign of strength, grew 5.3 per cent last month on a year earlier... Separate data on Tuesday showed exports soared 27 per cent year on year in June, adding to signs of reliance on trade to support economic activity... Julian Evans-Pritchard, head of China economics at Capital Economics, noted that the GDP data brought it “closer in line” with the consultancy’s alternative measure, which has been around 3 per cent.
Underlining the importance of exports, there was a surge in China's EV exports in June.
China’s monthly car exports rose to a record 1mn cars in June as part of an overall surge in trade that will heighten tensions with partners such as the EU. Shipments of cars rose 71.2 per cent from a year earlier to 1.06mn, putting the country on track to export more than 10mn cars this year, up from 7.1mn last year and more than double the 4.9mn in 2023. The surge in exports comes as domestic sales slow sharply following the phaseout of EV subsidies and a decline in demand for fuel-powered cars... The wave of Chinese exports has been driven by lower-cost cars boasting superior software, further threatening carmakers from Japan, South Korea, Europe and the US... China’s exports of rare earths in June fell 34 per cent year on year and 6.4 per cent in the first half, following tight export controls on the minerals, which are essential for high-technology products... The NBS’s Wang said China’s exports of green energy-related products such as lithium batteries and wind turbines increased 37.6 per cent and 35.6 per cent, respectively, during the first half.

And this highlights how production and exports have sustained growth.

Industrial production rose by 5.4 percent in the first six months of the year, versus the same period last year. High-tech manufacturing rose by more than 13 percent over that period. But fixed asset investment — which includes infrastructure, property construction and manufacturing — fell by 5.7 percent. Real estate development dropped 18 percent. The value of China’s exports surged by more than 20 percent in the first half. But consumer spending, which a Moody’s Analytics report said “remains the economy’s weakest link,” faltered. Retail sales of consumer goods increased by 1.3 percent over the first half of the year.
12. Ruchir Sharma holds that peak China was reached in 2021, and since then it has been a story of decline, papered over by exports and AI.

Since then, China’s share of global GDP has fallen in nominal terms from 18 to 16.5 per cent, while the US share has risen to 26 per cent. China’s growth rate has dropped below the rest of the world, including the US. In real terms, independent estimates now put China’s growth in real terms closer to zero than to the official target of 4.5 to 5 per cent... China’s population also peaked in 2021. Last year, births hit a record low, and deaths hit a record high. The working-age population is on pace to shrink by 75mn every decade this century... After adding little in the 2010s, net exports now account for about a third of the country’s growth, driven mainly by AI-related goods... And though every country now hopes for an AI-driven productivity miracle, the expected boost in China is about a third of a percentage point by 2030, hardly enough to halt its decline.

13. India agriculture statistics

If one looks at the growth areas in agriculture in the 12 years between 2011-12 and 2023-24, production of paddy and wheat rose by just 27 per cent. Fruit and vegetable production rose by 52 per cent, and milk production by 85 per cent, even though they did not receive any substantial support by way of subsidies or minimum support price procurement by the government. The true growth areas in agriculture are out of direct central government support and depend largely on producer enterprise... In 2023-24, the value of output of cereals (mainly paddy and wheat) was ₹8.5 trillion, while the value of the largely cooperative-controlled milk sector was ₹12.2 trillion.

14. Outbound corporate investments from India on the rise.

Indian companies have announced overseas equity investments worth more than $14bn in the first four months of the fiscal year that began on April 1, compared with $18.7bn in the previous 12 months. The outflows come as foreign investors flee India’s markets at the fastest pace ever this year, pulling out more than $23bn as of the end of June over a lack of AI champions.

15. Simon Kuper on Lionel Messi.
On the field, Messi sees everything. All his career, he ignored the ball for the first five minutes and instead walked around, memorising the position of each opponent and the spaces between them. But now he spends almost the entire game walking and scanning. When he breaks into a run, his teammates know he has seen an opening. They play to serve him. When he moved to the right wing against Egypt, seeing space there, the team remade itself around him. Argentina, two goals down after 78 minutes, won 3-2. Scaloni said afterwards: “We were not the ones who told him to go out to the right.” Messi moved right again against England and again Argentina came back to win.

16. The AI-boom is spilling over to energy sector.  

Initial public offerings for energy firms raised $12.6bn in the first half of this year, according to data firm Dealogic. That marks the highest half-year level since the peak of the dotcom bubble in late 1999 and the highest first-half figure on record. It is well above 2025’s full-year total of $4.3bn. The surge in fundraising comes as access to the vast amounts of energy needed to run data centres emerges as a bottleneck in a multi-trillion-dollar AI investment boom... US electricity demand is projected to increase 39 per cent between 2026 and 2035, according to consultancy ICF, in large part due to ballooning demand from data centres...
Companies that have been able to raise money on public markets include those involved in complex, capital-heavy projects such as nuclear and geothermal power plants, while investors have also been willing to back businesses trying to develop new technologies... “This is a moment in which speculative projects are being funded and underwritten,” said Julien Dumoulin-Smith, a Jefferies research analyst covering power, utilities and clean energy. “They’re not just limited to venture capital or private equity.”... Nearly two-thirds of the energy companies that floated this year and last are now trading below their offer price, according to Dealogic. That compares with less than 40 per cent of IPOs across all sectors that are underwater.

And Wall Street Banks are already AI trades

Four of the five big Wall Street banks reported yesterday: JPMorgan Chase, Bank of America, Citigroup and Goldman Sachs (Morgan Stanley chimes in today). The numbers were outstanding, as one would expect in a quarter when markets whipped around and big deals were done. In aggregate, equity and debt trading revenue at the four hit $38bn, up more than a third from a year ago and 60 per cent higher than two years ago. Investment banking fees, at $10bn on the quarter, have grown almost as much... It is AI that has markets churning and drives capital-raising. The banks are another example of the false “broadening” of the stock market that has also driven up industrial and utility stocks in the past few years. All these sectors have lived, and could die, with AI.

And their profits are not confined to the US, with even Asia becoming a major source.

Equities trading in Asia is helping power a record-breaking run from Wall Street’s banks, with the region on course to surpass Europe as the industry’s second-largest source of revenue behind the US. In the past 12 months, clients of large investment banks have ploughed into companies in Asia that provide critical infrastructure to the AI semiconductor industry, including South Korean SK Hynix, Taiwan’s TSMC and China’s Cambricon Technologies... In the most recent quarter, the largest investment banks collectively reported an unprecedented $25.7bn in earnings from equities trading and called out Asia as a crucial factor in the growth.

17. Even by the low standards of Trump 2.0, this is surely an outrageous example of private profiteering from public office

Donald Trump’s social media company has discussed charging traders and investors as much as $100,000 a month for faster access to the US president’s posts on his Truth Social platform. Trump Media & Technology Group (TMTG) has quoted the six-figure monthly sum in talks with prospective buyers of the “Truth API” data service, according to people familiar with the matter. Proprietary trading firms and hedge funds pay huge sums for ultrafast data feeds because every millisecond counts when reacting to market-moving news. Trump often makes major announcements on Truth Social that trigger huge fluctuations across global markets... TMTG, which is majority owned by the Trump family, controls Truth Social...
A pitch sheet circulated by TMTG to promote Truth API, seen by the FT, lists 10 “documented market-moving posts” from the president’s Truth Social account. On April 9 2025, for example, the document says Trump’s “THIS IS A GREAT TIME TO BUY!!!” post “restored” $4tn to the market capitalisation of the S&P 500. Trump’s post in early June that the US would hit Iran “very hard tonight” caused a 6 per cent intraday jump in oil prices, the document says. “When @realDonaldTrump Truths, the world reacts,” the document continues. “No comparable signal exists. No official API has ever been offered. Until now.” Trump has also touted specific stocks, complimenting companies such as Nvidia and Apple and fuelling rallies in their share prices. More recently after the outbreak of the war with Iran, Trump posted on March 23 that there had been “very good and productive conversations with Iran”, sending oil prices falling sharply.

Thursday, July 16, 2026

The probation problem in India's public sector

Public recruitments come with a one- or (mostly) two-year probation period. The idea is to correct a Type I error (a false positive recruit) in the recruitment process. 

Underlining its importance, the DoPT Master Circular on Probation/Confirmation of 2019 has this to say about probation:

‘Probation should not be treated as a mere formality. The existing powers to discharge probationers should be systematically and vigorously used so that the necessity of dispensing with the services of employees at later stages may arise only rarely.’ 

Unfortunately, while it is part of all recruitment rules, it is widely believed that there are few instances of discharge during probation in any local, state, or central government recruitments.

Before we analyse this, it must be clearly stated that data on this is very patchy in the absence of disclosures by either the DoPT, UPSC, state PSCs, or the central or state government cadre controlling agencies. Empirical evidence, or whatever can be gathered, shows that across every service - All-India Services, central Group A civil, central Group A technical, state civil services, state police officers, state medical services, the great mass of teachers, constables and healthcare workers - the discharge rate on performance grounds is effectively zero. 

This is what Claude gathered about central government cadres.

And this about state government cadres.

It must be disclosed that both the data are not validated, but conforms to the widely known anecdotal knowledge. 

The rare discharges that do occur are almost invariably for fraud (fake caste, disability, TET or degree certificates) discovered post-selection, or for medical/physical failure during pre-probation training. Fraud detection and physical fitness testing are legitimate filters, but they are not the probation function. This has been confirmed by every major civil-service review (Hota 2004, Yugandhar 2003, Second ARC, Baswan 2016). 

There are three examples of probation discharges outside of fraud and medical or physical ineligibility. An estimated 2-5% of the scientists and engineers recruited by the Department of Atomic Energy are discharged for non-completion of the academic curriculum. An estimated 3-15% of the police recruits by state and central government paramilitary forces are discharged for physical and disciplinary reasons (not deficiencies in the acquisition of policing capabilities). Thanks to supervision by the High Courts, an estimated 0.5-1% of every batch of state civil judges and munsiffs are discharged for failure to meet defined output and quality metrics during probation.

The absence of any discharge deterrent increases the stakes associated with the recruitment process itself. This most likely contributes to the fraudulent practices that are pervasive across recruitments at all levels. 

This is a comparative assessment of probation discharges globally and from India’s own private sector. 

The deterrent effect of even a few discharges can be significant. 

So what can be done about this?

The probation instrument has not served its purpose because the framework it operates within provides neither the assessment infrastructure (objective performance criteria linked to a role profile), disclosure requirement (not even DoPT publishes data on probations), nor the political-economy incentive (senior officers who discharge a subordinate invite litigation and administrative-tribunal action). In the circumstances, reforming the probation clause without reforming both the criteria and the incentive structure will change nothing. 

A low hanging fruit is to shine light on the problem and make it mandatory for all departments to disclose the status of probation confirmation, extensions of probation, and affirm that all the probationers met the requisite benchmarks for the same. 

The first step in any systematic effort would be to define a few objective and easily captured metrics of probation performance that are proximate to their roles. This would usher in transparency and shape expectations among probationers about their roles. 

Second, the probation performance evaluation should be made a mandatory exercise, by a committee consisting of the Departmental head (or representative), officer responsible for training within the Department, and the Director of the Training Academy. This would mitigate the political economy deterrent to discharges. 

Third, there could be a mid-way evaluation of the probationers by the same committee, which discusses any laggards and inform them about where they are falling behind. The same should be documented. This could shape expectations and ensure that the probationers are forewarned before any discharge. 

Fourth, the evaluation reports should be submitted every year by the Departments to DoPT (and its state government equivalents) and the UPSC/SPSC, failing which no recruitments by the Department should be allowed. This would bring departmental accountability to the process of probation confirmation. 

The aforesaid measures would constitute a simple and realistic start to addressing one of the most farcical features of the recruitment process. 

Wednesday, July 15, 2026

Higher FARs, but very few plots can avail them

Many state governments in India have issued executive directions increasing the permissible Floor Area Ratios (FARs) in their cities. However, these upzoning reforms are likely to struggle to meet the objective of densification due to restrictive conditions to avail the increased FAR. Specifically, three gate-keeping elements - minimums on road width and plot size, and a maximum on height - leave the upzoning reforms largely stillborn. 

To understand why, we need to keep in mind the street layout of the typical Indian city. The colony street widths are typically 9 m (30 ft) or less, and at best 12 m (40 ft). Even the connecting roads are no more than 12 m. In any city, a very small proportion of properties, and an even smaller proportion of residential land use, will have road widths greater than 9 m. Only the arterial roads, which are in any case mostly commercial and higher-valued, are above 12 m.

A comparison of upzoning reforms across the ten biggest states reveals some interesting insights. For a start, the upzoning itself is generally marginal, and even where significant, the higher FARs can be realised only on wider roads. In simple terms, the upzoned FAR apply to a tiny minority of parcels - greenfield layouts and edge plots on arterial roads. Every state except Gujarat, UP (individual) and Haryana (small plot) sets the FAR uplift threshold above 12 m - typically 18 m, 24 m or 30 m. But even for the three, the uplift is marginal and only for a few categories of properties. Also, none of the three touches group housing or vertical redevelopment on narrow-road plots.

Further, plot size and setbacks compound the problem of a minimum road-width gate. Even where a 12 m road technically qualifies, high-rise / group-housing rules require minimum plot sizes of 750–2000 sqm and setbacks of 6–12 m. In existing settlements, individual plots average 60–150 sqm, and assembling five to twenty of them is legally and commercially nearly impossible without a TDR/land-pooling instrument. Even then, practical challenges are daunting.

This also means that even the TOD zones cannot benefit from the upzoning. In existing town cores, which are where TOD catchments actually sit, FAR reform delivers almost nothing until the road-width and plot-size gates are lifted or bypassed. 

In other words, the upzoning reforms largely bypass the built-up city and are relevant only to the greenfield areas. In these areas, the uplifts linked to higher road widths end up benefiting only the large developers. They, in turn, build high-rise gated communities of higher-end housing, mostly unconnected to mass transit and with multiple car-users in each household. Ironically, this also ends up expanding the sprawl, flooding the roads with cars, thereby worsening traffic and increasing pollution.

On the other hand, it does nothing for the smaller developers who are likely to develop affordable mid-rises (say, 6-12 floors) inside the existing colonies. Instead, they end up constructing low-rises (up to 4-5 floors). Further, the unit economics given high land prices mean that even these low-rises gravitate towards the suburbs. 

It is these mid-rises that are likely to contribute meaningfully to expanding supply and addressing the affordable housing problem. Unless the upzoning covers the 9 m road width and smaller plots (which make up the vast majority of the potential developable properties in any city), there cannot be any significant impact on housing supply and the affordable housing problem. 

Further, to realise the full potential of such upzoning, it must be complemented with sharply increased mass transit services, especially buses, that cover these colonies. The quality, frequency, and connectivity of the bus network must be high enough to induce people to shift from car usage.

Monday, July 13, 2026

Workers and startups are helping train AI to replace them

Data annotation work is increasingly moving up the value chain, from tagging and labelling data to replicating the work of semi-skilled (on the factory floor) and skilled (consultants, analysts, lawyers, engineers, and doctors) workers. 

Startups sell data to AI labs, which use it to train and refine their AI algorithms and develop software products/solutions that replicate the work of these workers. In other words, the semi-skilled and skilled workers, or at least some among them, are feeding their time and skills into the AI algorithms that seek to replace them and their kind. Both the training startups and those workers offering their services to them are basically helping make themselves redundant. 

On this, the FT has a very good film about how Indian startups are paying factory floor workers and gig workers (and even people in their homes doing regular household chores) to use cameras and record their work. Data annotation is becoming the new BPO for India’s IT industry. 

The Ken has an article that raises the possibility that for all the attention and hype around robotics, Indian startups might remain stuck at the lowest end of the robotics value chain - data collection. 

India was the back office for the IT boom. It became the annotation and reinforcement-learning labour pool for the generative AI boom. It is now emerging as the behavioural data factory for the physical AI boom... Building the robot is only half the problem. Building the intelligence behind it is much harder. That requires data. Vast amounts of it. Unlike large language models, which were trained on the equivalent of hundreds of years of human reading scraped from the internet, robotics companies are working with barely a fraction of that in video... What they need is meticulous, first-person recordings of humans interacting with the physical world, carefully collected, annotated, and painstakingly structured. 

So the industry turned to India. Across the country, workers are recording themselves doing everyday chores for data-collection firms, which then sell that footage to companies such as Tesla, Figure AI, and Agility Robotics to train their humanoids. Indian startups see this as a moment to claim a seat in the global AI value chain. The country has over 260 robotics startups, and investors are beginning to pay attention... The footage being recorded by Indian workers becomes proprietary once it leaves the country. The datasets assembled from it are accumulating on foreign servers. The foundation models trained on them are owned by foreign companies.

The NYT has an article about how startups like Handshake, Mercor, and Surge in the US are paying skilled workers to collect data on their work. 

Mercor and a handful of similar start-ups are the primary middlemen in a supply chain of “human data” that may power the next generation of A.I. As OpenAI, Anthropic and other major ventures compete to become the industry’s dominant platform, the market for premium data that has been vetted by experts is exploding…They need mathematicians to annotate proofs, lawyers to mark up briefs and professors to grade essays… To use the parlance of the industry, data labeling has moved up the “value chain,” and the start-ups that offer this service have become some of the fastest growing in Silicon Valley… The data-training start-ups see a lucrative opportunity in recreating workplaces in miniature: controlled environments in which their gig workers can evaluate and reproduce emails, memos and slide presentations in context. The information emerging from such a setup, the companies boast, will help shrink the gap between what A.I. models can accomplish and what office workers actually do from one minute to the next, as ideas and instructions flow between meetings, documents and applications…

To keep improving their models — to make them more useful, more sophisticated, less prone to hallucination and mistakes — A.I. companies heavily refine what goes into them. That’s post-training, and it includes buying data from vendors like Handshake and its competitors… Deeptune, a start-up that makes “training environments” with simulations of the software programs, like Slack and Salesforce, that many workers toggle between all day long to get their work done. The idea is to painstakingly create a mirror image of, say, an investment bank so that A.I. can observe every interaction…

It may turn out that once OpenAI, Anthropic and others have taught their models to perform a certain job, their need for more training data in that area could sharply decline. In this way, Mercor, Scale, Handshake and their peers are much like the elite freelancers they employ: making money today, but in danger of being dropped tomorrow… People sign up for data-training gigs for a variety of reasons. The main one is, of course, money… Though the labor is unpredictable and rates vary… the workers who cobble together enough shifts can generate meaningful income. People might sign up because they have been laid off, or because they can’t find enough work in their field. They might do it because they’re eager to get “A.I.” on their résumé, or because they need extra cash in retirement… Many people who contract for these companies understand that this is a short-term opportunity, a brief chance to train the models to automate jobs before they themselves are automated out of the job of training models.

I asked Claude to generate a visualisation of this market landscape, including an assessment of the Indian landscape. The numbers are clearly estimates and must be validated (though at a ballpark they appear alright). 

The unit economics of the data chain shown below for a garment worker in India is instructive. She gets roughly ₹400 a day to wear the camera (or $0.60 per hour); the startup pays the factory ₹450–500 per hour; US-based startups like Human Archive price data at $1–10 per hour; and once annotated and packaged, it sells to global robotics labs at $15–50 per hour. That is a 25–85 times markup, and every rung above the worker is owned outside India.

The graphic also shows that the vast majority of AI workers are doing the BPO equivalent, whereas the vast majority of funding is going to those building the data centres. India has 170-odd AI startups that have raised $2.6 billion in total and over 260 robotics startups, but the genuine model/product builders are a tiny set, and the majority have rebranded annotation as an AI line of business (iMerit, Objectways, Awign, Karya, Deccan AI, Human Archive, Egolab, Neo Cambrian, Humyn Labs, RoBoEra, etc.). 

It must also be highlighted that in the majority of cases in India, the data goes from the garment worker to an Indian data aggregator to a robot-brain lab in San Francisco, and comes back as a robot/humanoid. The frontier LLM labs are not in that loop. This also means that none of the emerging governance conversations about frontier models - safety frameworks, export controls, model-access negotiations - touches the mainstream data collection work being done in India. India is negotiating hard for access to frontier language models while simultaneously handing over, for ₹400 a day, the training substrate for the physical models that will actually displace its manufacturing workforce. Those are two different conversations, and only one of them is being had.

Further, as the Times article highlights, while these annotation startups are flourishing now, they may not be sustainable ventures. Once experts teach the models to do something, their services are no longer needed in the same way, and the vendors themselves need the models to keep improving to show they add value, while needing them to remain imperfect so clients keep coming back. 

I asked Claude for historical precedents and got this:

Frederick Winslow Taylor’s explicit programme, from the 1890s, was for management to “gather in all of the great mass of traditional knowledge which in the past has been in the heads of the workmen.” Skilled machinists were stopwatched; the Gilbreths filmed them with chronocyclegraphs — a literal 1910s head-camera. Workers cooperated because they were paid piece-rate bonuses to do so. The tacit craft was decomposed into instruction cards and handed to cheaper, unskilled labour. Outcome: enormous productivity gains, the collapse of the craft wage premium, a machinists’ revolt, congressional hearings in 1911–12, and Taylorism banned in US government arsenals by 1915. It took roughly fifty years and the postwar labour accord before the gains were broadly shared… 

In the 1990s American hospitals routed physician dictations to transcriptionists in Bengaluru and Chennai; it was unglamorous work, but India was good at it. That corpus is precisely what trained speech recognition. The industry peaked and then largely evaporated. Compensation to the transcriptionists: zero… most startups in this space risk meeting the same fate as the transcription companies of the 1990s.

In this context, I am reminded of the claim made by Daron Acemoglu and Simon Johnson in their book Power and Progress that the trajectory of technological progress is a political choice made by society and should not be left to corporations and technocrats. Their central claim is that the direction of technology is a social choice, not a technical destiny, and that redirecting it requires countervailing power rather than better-intentioned technocrats. 

The problem, though, is that globally, and especially due to the Trump 2.0 regime, the rule makers have surrendered agenda-setting to Big Tech and AI Labs. Closer home, India has almost no leverage over the direction of frontier AI. Instead, its leverage is confined to the terms on which its labour and data enter the supply chain, and not to bending the technology’s arc. 

In the circumstances, what can a country like India do?

Here are some thoughts for consideration. One, a statutory floor rate for training-data contribution and an industry-led collective licensing body for data work are both administratively feasible and could increase value capture (from the worker’s current share of 1-2% of the value created) without banning anything. A comparator is the model of SoundExchange (US) or PRS (UK) in the music industry, which acts as a government-designated clearinghouse that collectively licenses music, collects usage fees, and distributes royalties to creators, effectively removing the burden of individual licensing. This model would also subtly frame the market in terms of treating data as labour, and not as mere raw material. 

Second, on the regulatory side, it may be useful to revisit the DPDP Act provision that permits employers to process worker data without explicit consent under “employment purposes”. Instead, there should be purpose limitation, or restrictions on repurposing training data for other activities, and consent requirements of all involved. 

Third, public spending on AI innovation and procurement preference could be made conditional on the recipient retaining licensing rights to datasets collected from Indian workers rather than doing work-for-hire. This would frame the collection of data as an input and not a product, and industrial policy could price it appropriately. Fourth, there is the argument about extending statutory instruments like the gig worker welfare boards or the Code on Social Security present in some states (Rajasthan, Karnataka, etc.) to cover data work. It could help build countervailing power. 

But pursuing these agendas can be costly. This being a global market, prohibiting or putting too onerous terms on value capture and the entry of data into the supply chain will backfire by moving the work to Vietnam, Ethiopia, or the Philippines. Besides, for the Indian workers, already facing an acute scarcity of jobs, the choice isn’t really on offer, and ₹400 a day is ₹400 a day. There is a collective action problem here which calls for multilateral engagement through a forum like the ILO. 

But this should not mean that we sit back helplessly and allow the market dynamics to play out. Instead, before enacting any of them, there must be a public debate on the merits or otherwise of these proposed measures. What are their respective costs, and what can be done to mitigate them? What versions, if any, of these measures should be enacted? Such debates are essential to make informed and collective social and political choices.

The public debate is important since the agenda-setting process here, like with any technology change, pushes certain considerations to the forefront while also marginalising certain others. Almost always, the former represents the interests of the corporations and elite beneficiaries of the change, and the latter represents those of the vulnerable and voiceless. Therefore, such agenda-setting debates are a purely political activity, with profound social implications. 

It is also important since there is the distinct likelihood that India could spend the next five years as the world’s back office for the third time, and when the juice has been sucked out and value captured, there could be nothing left standing that India owns. 

PS: In this context of collective action problems, it is worth taking inspiration from one very impressive and encouraging breakout (which has not received the level of attention it deserves) from South Korea. It is a tribute to the maturity and wisdom of the country’s corporate and political system and the robustness of its democracy that Samsung and SK Hynix agreed to share 10% of their windfall profits from memory chip sales, with no ceiling on payouts, with their employees for the next ten years. Sample this.

Samsung Electronics... agreed last month for employees to share the chipmaker’s blockbuster profits from an AI-led boom... SK Hynix... handed employees a similar profit-sharing deal last year... Samsung is also going to give Won500mn loans at low rates to employees... Samsung and SK Hynix together control much of the market for the advanced memory chips used in AI servers. Employees at both companies are in line for average annual bonus payouts of Won600mn, which compares with a national average salary of about Won50mn... district of Hwaseong... expected to gain corporate income tax receipts of Won1tn to Won1.3tn from Samsung alone this year, an extraordinary sum for a city authority whose annual budget is about Won3.5tn.