Substack

Thursday, February 29, 2024

The Norwegian economy proves the norm

National economies and their policies are a bundle of paradoxes and contradictions. While one can discern the broad direction of policy-making, simplistic labels like free market capitalist or green economy conceal more than they reveal. As the cliche goes, the world is rarely black or white. 

Norway is an interesting exhibit in this regard. It is perceived as a free market economy, has a special reputation for promoting peace globally, is a vocal supporter of the decarbonisation and green economy movement, and so on. Here is a more complex reality,

Norway, a nation of 5.5 million people, where energy represents about a third of economic output and where, not unlike Saudi Arabia, the government owns not only the oil and gas fields but also large stakes in companies extracting them. By increasing demand for this energy, the war in Ukraine has helped add about $100 billion to Norway’s oil and gas earnings... Energy companies made adjustments that increased gas production at the expense of oil. The result was an 8 percent increase in gas production last year, which made Norway the source of about one-third of the gas consumed in Europe...

Norway has reaped handsome financial rewards for coming to Europe’s aid. Just as energy companies like Shell and BP pulled in record profits last year, Petoro earned about $50 billion in 2022, almost three times what it made in 2021, and Equinor reported record adjusted earnings of $75 billion. Revenues from oil and gas contributed $125 billion to the Norwegian state in 2022, according to government estimates — about $100 billion more than in 2021. That money flows into a $1.3 trillion sovereign wealth fund formally called the Government Pension Fund Global but known to many as the oil fund. It holds, on average, 1.5 percent of 9,000 listed companies worldwide, and the government can tap its expected annual earnings to finance almost 20 percent of the state budget. This arrangement helps shield the Norwegian economy, which grew 3.3 percent in 2022, from the ups and downs of oil and gas prices... In 2020, the government put into effect temporary tax changes to ensure that the pandemic did not halt investment in the industry. These incentives have led to a burst of new drilling and development, worth an estimated $43 billion. An oil and gas company based outside Oslo, Aker BP, plans to invest $19 billion to increase output by a third by 2028... Hilde-Marit Rysst, the leader of SAFE, a union that represents 12,000 energy workers, said working on petroleum platforms was more stimulating and rewarding than the work available in the renewable energy industry. “You use your brain, your education and your experience,” she said. “It doesn’t look like you are going to get that from wind turbines.”

Consider these snippets

1. Norway's SWF contributes about 20% of national budget revenues!

2. All the oil and gas fields are owned by the government, and it also owns major shares in the oil companies!

3. Norway has been increasing its investments and capacities in oil and gas exploration, even as it has been at the forefront of the green movement!

4. For all its green signalling, Norway is as much an oil-gas economy as Saudi Arabia!

5. Finally, it may not be incorrect, in the final calculus, to argue that Norway may be the biggest financial beneficiary of the Ukraine invasion!

These paradoxes capture the messy realities of our world. As Ha Joon Chang and others have described eloquently with examples, examine the policies of any developed free-market economy today and you'll see traces of very active state involvement everywhere. It's disingenuous to prescribe privatisation of the extraction of your primary natural resources (mostly to foreign mining companies) as the only option, instead of encouraging the creation of effective governance arrangements. It can be argued that corruption from failed governance systems may be slightly less worse than corruption by mortgaging the country's natural resources to foreign interests. 

The irony about the reliance on oil and gas and its capacity expansion in the face of all talk about a green economy is stark. This dissonance between talk and actions is emblematic of many things about the energy transition. At a macro and global level, the ESG investing craze and its countless problems are the manifest examples. At the national level, the unrealistic push towards decarbonisation glosses over the bitter realities of social and economic adjustment costs associated with such shifts. 

That Norway may perhaps be the biggest beneficiary of the Ukraine invasion is the most striking irony. Europeans accusing India of buying Russian oil already overlook that the same refined oil finds its way back to Europe from India. This is just another reality check. 

Monday, February 26, 2024

Thoughts on Affordable Housing VII

Affordable housing is a very big problem across cities of the world. While there are several targeted policies to address it, including the construction of public housing, there’s enough evidence (see this), especially in the context of developed countries, to show that an increased supply of housing tends to benefit all income segments and increases housing choices for everyone

But there are two big constraints to increasing the supply of housing - restrictive zoning regulations and neighbourhood opposition to redevelopment permissions (or the NIMBY phenomenon). The former is a problem across cities of developed and developing countries. Since zoning regulations are highly centralised in many developing countries, NIMBYism is less of a problem in their cities. 

I have blogged in earlier posts in this series (hereherehereherehere, and here) about how cities and countries across the world have been trying to address the problem of affordable housing. This post will point to an Israeli innovation that combines the easing of building regulations and local participation but with an opt-out provision to overcome NIMBYism. It’ll also discuss the successes in Texas and elsewhere due to liberalised planning regulations. 

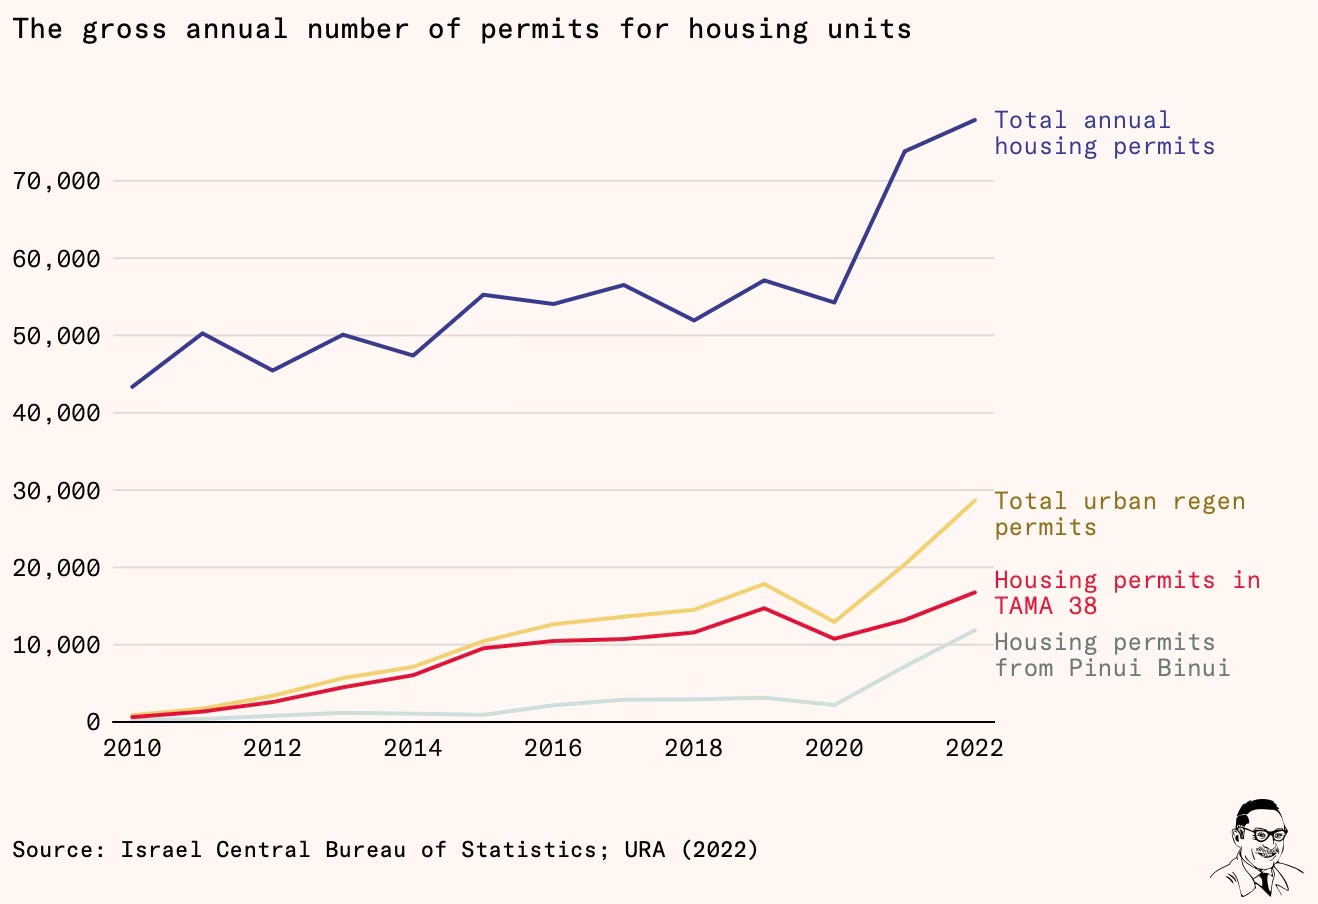
In the latest edition of Works in Progress, Tal Alster points to two housing schemes in Israel, known together as urban regeneration or UR, that have spurred densification by delivering one-third of the country's new homes and more than half of new homes in Tel Aviv. Being in earthquake zones, many Israeli homes need to be rebuilt to increase resilience. This has created opportunities for regeneration. 

Urban planning is more centralised in Israel than in many countries and the zoning approval process is lengthy. In 1999 the government enacted a program to incentivise redevelopment of dilapidated buildings and older buildings without earthquake resilience, called Evacuate and Rebuild, or Pinui Binui in Hebrew. In 2005 it introduced a second program, TAMA 38, that allowed apartment owners in buildings built before 1980 to collectively opt to let their buildings be rebuilt with extra floors and larger land footprints, with new apartments in the building being sold to fund the redevelopment. The main objective was to reinforce earthquake resilience in older buildings. The combined impact of the two programs has been dramatic.

From just two percent in 2010, urban regeneration programs – TAMA 38 and Pinui Binui combined – now account for 37 percent of Israel’s annual housing production. The data is even stronger in high-demand areas. In the Tel Aviv district, Israel’s economic heartland, more than 50 percent of new construction is now achieved through the densification and demolition of existing housing stock. Both schemes – Pinui Binui and TAMA 38 – at heart are based on an agreement to develop between homeowners and developers. Under TAMA 38, homeowners need only make an agreement with developers; under Pinui Binui, they must also go through a zoning and planning process with the municipal, or even the regional, government.

TAMA 38, historically and currently the more productive of the two programs, offers by-right development for buildings constructed before 1980 provided the existing property owners agree, making it relevant for tens of thousands of residential buildings in Israel. There are two main versions of the scheme: TAMA addition, in which the existing building remains, but is reinforced, and extra floors are added on top, along with added floorspace on the existing floors; and TAMA demolish and rebuild, where the entire existing building is demolished and replaced by another. Developers can also propose projects through TAMA 38 that apply to several adjacent buildings, requiring consent from each, but most schemes involve single buildings. Development done through TAMA 38 usually adds three floors to each building, including one set-back top floor, normally referred to as 2.5 floors. But article 23 of the plan allows municipalities some flexibility in adjusting the limits upward or downward to meet the local context. Some municipalities allow TAMA redevelopments to add more floors, while others (mostly in high-demand areas) have limited the number below 2.5.

The scheme works mainly through property developers who contract with the landowners. The article writes about the mechanism for mobilising landowners and obtaining consent and the incentives provided.

The core mechanism in both schemes – TAMA 38 and Pinui Binui – is an agreement between a developer and the homeowners (but not renters) of one or a group of apartment buildings. In both cases, the agreement specifies the size and interior specification of the new apartments, plus what other amenities such as parking and storage space will be built, along with expected timelines and withdrawal conditions. Usually, before a developer is selected, a representative body of homeowners is elected by a general assembly of the homeowners. These representatives have the mandate to choose a developer based on criteria such as the size of the new apartments they offer, the apartments’ specifications, the developer’s experience and past developments, and its financial abilities. After a developer is selected, a legal agreement written by the developer is offered to all homeowners, who can sign it, comment on it, or refuse to sign, using their own legal advice.

If two thirds of homeowners sign, the developer can proceed with the planning and permitting process. Technically, all homeowners need to sign, but the developer can sue them to force them to do so if two thirds are agreed – so long as the objectors don’t have a very strong legal case not to sign. This generally only extends to unfair deals that don’t benefit all residents, cases where the developer hasn’t provided temporary accommodation during development, or risky cases where the objectors don’t have strong enough guarantees that the developer won’t disappear or go bankrupt. The majority have a strong bargaining position, as only a narrow set of grounds are accepted for refusal, and if the court rules that the refusal to approve the deal is unreasonable, it can even force reluctant homeowners to compensate the others for delaying or preventing the deal. Initially, rules required 80 percent of homeowners to agree on a deal. Lawmakers reduced the threshold to two thirds, in order to streamline the process and lower the bargaining power of holdouts – especially those who hope to extract surplus profits from the project, on top of that available for the rest of the owners...

When the agreement reaches a sufficient majority of support to be approved, then apartment owners are effectively trading their rights over their building, and the land underneath it, with a developer. Usually this is for a new, improved, and bigger apartment, often with additional amenities such as a balcony and underground parking. The developer, on the other hand, gets to sell the additional units added to the building. Regulators encourage developers to offer to enlarge the current owners’ apartments by an extra room each, or about 12–13 square meters. But this can vary enormously... Pinui Binui projects normally add as many as four or five new apartments for each existing one, meaning much bigger windfalls for homeowners, after the slower and riskier approvals process... Typically when developers or homeowners use new planning permissions they have been granted, they pay a 50 percent betterment levy on the increased value paid to the local authority, so the local community can capture some of the benefits. Under TAMA 38, owners are completely exempt from the betterment levy; under Pinui Binui it is usually set at a reduced rate of 25 percent.

The critical thing here is the role of qualified majorities which ensures that certain hardcore recalcitrant individuals cannot hold out in the hope of bargaining a higher price or for some other reason. It removes their veto and encourages developers. Such vetos can be overturned and redevelopment facilitated through two means.

Either development can be approved directly by the central government, cutting out the veto players that gum up the process locally, as New Zealand recently did in the rebuilding of Christchurch, and like the Établissement publics d’aménagement development corporations in France that built, among other things, Paris’s La Défense skyscraper-heavy financial district. The other option is to establish, at the central government level, rules that allow existing residents to overrule objectors locally and approve development directly. A similar sort of mechanism exists in most countries with so-called strata title for apartment buildings, such as Australia, Canada, Japan, and Singapore. Strata title is a legal construct that allows residents to own their own property outright, plus a share in a sort of company, which manages the building, charges fees, carries out repairs and maintenance, and more. Previously, owners in a strata corporation had to get unanimity if they wanted to dissolve it – most often because they wanted to redevelop the land. This was generally insurmountable due to holdouts, but strata owners can now usually agree by supermajority to drag along objectors, if those are small in number.

The Israeli government has adopted an iterative approach to the urban regeneration program.

Every year, the national legislation process tweaks the TAMA 38 and Pinui Binui programs in response to the needs of owners, developers, and municipal governments by shifting supermajority requirements, adjusting tax exemptions, creating compensation mechanisms for legitimate objections and for vulnerable groups such as elderly owners, and improving the rules to protect homeowners from mis-selling, fraud, and predatory pressure. The supermajorities for Pinui Binui and TAMA 38 demolish and rebuild were reduced from 80 percent to two thirds in 2021 and 2023, respectively. In 2018, in response to the unique needs and interests of elderly owners in Pinui Binui projects (that can easily last over a decade from start to finish), lawmakers amended the law to require developers to offer them alternatives to the new apartment. For owners above the age of 75, the developer must offer three choices in addition to the new apartment – to fund a stay in a senior home during the construction of the new building, to purchase an equivalent apartment instead moving to a temporary unit and then back to the new building (in order to avoid two moves), and to offer cash payment instead of a new apartment. Mis-selling has also been a problem. Less-informed and less-well-off owners sometimes agreed to unfair deals with developers... A 2017 law introduced the obligation to include timelines in agreements, and the need to inform the owners of the agreement in a meeting that includes at least 40 percent of the owners. The law also obliges developers to translate the agreement into any relevant languages.

The public agencies governing the schemes have evolved too. The Urban Regeneration Authority, which began as a department in the Ministry of Construction and Housing, became an independent authority in 2016, making it less political, more professional, and more powerful. It manages the yearly legislation to streamline and improve the process, actively promotes specific Pinui Binui plans (usually in less-affluent areas), tries specifically to encourage urban regeneration in Arab and ultra-Orthodox communities (where it is currently almost nonexistent), and publishes up-to-date data on the state of urban regeneration. The Israeli Ministry of Finance, usually considered to be fiscally hawkish, nearly tripled the Urban Regeneration Authority budget between 2020 and 2022, indicating that the government believed the programs were working well. Municipal regeneration agencies, working inside the municipalities and supervised by the national Urban Regeneration Authority, were established to mediate between developers and homeowners, and are generally considered to have succeeded in getting municipal governments to be more committed to urban regeneration. Alongside these public interventions, some practices have developed incrementally via markets. For example, it is now standard for owners to hire a lawyer and a construction supervisor specializing in TAMA 38 in order to help them decide among interested developers – the developer that wins pays them a standardized fee.

Alster proposes making more changes to make UR schemes attractive for tenants and renters too.

Renters are practically invisible in the Israeli urban regeneration process, despite the fact that around a third of them have been living in their current apartment for five years or more… If Israeli policymakers want to retain the urban regeneration schemes, they should consider making them work for tenants more directly. Other options exist, such as relocation assistance for the displaced renters (available in Washington, DCSeattle, and Chicago), or more radical steps such as a right to a home in the new project (as happens in California). Perhaps the most obvious option is to include tenants in the vote on whether to implement the project (as happens with public housing tenants in London).

This is a very strong conclusion

The data suggests that the NIMBY/YIMBY debate is not really about economic or cultural ideology, race, or class – it is about veto players and incentives. If incentives are closely tied to the decision about whether to upzone, and homeowners can make the choice for themselves, then developers can offer strong-enough incentives for new development to make homeowners the most powerful political engine in support of densification... give homeowners the right powers and incentives, and you have a good chance of delivering a lot more housing – with the enthusiastic support of locals.

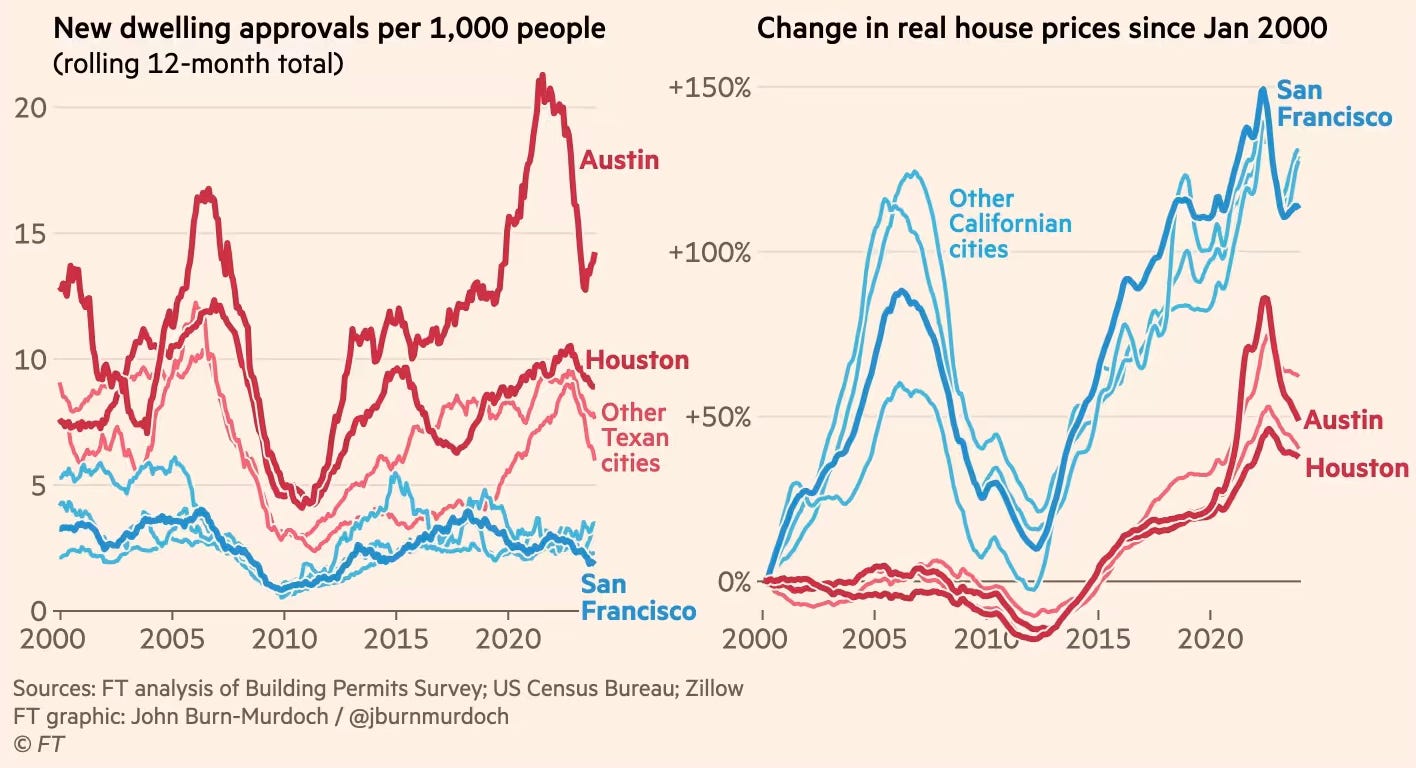
John Burn-Murdoch in FT has a brilliant article where he points to the success of Texas in keeping housing prices affordable through increased supply from liberalised planning regulations. 

In the year ending March 2023, construction began on 72,000 new homes in Houston, Texas, population 7.5mn: more than three times the 20,500 new homes started in London, whose population is considerably larger… Swap Houston for Austin, and London for San Francisco or New York, and the disparity would be even larger. Unsurprisingly, these wildly divergent rates of housebuilding have an impact on prices. You would have to pay $1.2mn dollars for the average property on sale in the San Francisco/Oakland area today, around $800,000 for the typical homes in London and New York, but just $300,000 in Houston. 

The disparities only become more striking if you consider the local context. New York, San Francisco and London are led by progressives who wring their hands publicly over their acute and long-running housing crises. Texas, meanwhile, is a red state, not generally given to pursuing socially beneficial projects. But actions speak louder than words. Homes in Texan cities are cheap and their populations soaring because the state has made urban development easy. California, New York and London are overheating and squeezing out young families because their planning systems place artificial constraints on supply, making urban development extremely difficult.

Burn-Murdoch points to how cities like Houston and Auckland have overcome local opposition with creative opt-outs and focusing on smaller developments.

In Houston, a 1998 change to planning laws empowered landowners to turn one home into three — instantly creating space for new families in the heart of the city, while generating a tidy profit for themselves. A crucial detail was the inclusion of an opt-out for individual neighbourhoods whose residents wished to keep things as they were, increasing the scheme’s durability. Auckland’s 2016 upzoning plan worked in a similar way, creating new defaults that facilitate modest densification in areas close to the city centre and transit stations while keeping carve-outs for neighbourhoods of historical significance. In both cities, construction has soared and prices stayed much lower than elsewhere. Crucially, by focusing on what urbanists call “gentle density” — involving developments of anywhere from three to six storeys, designed with local character in mind — and building in exceptions, both plans have endured political upheaval.

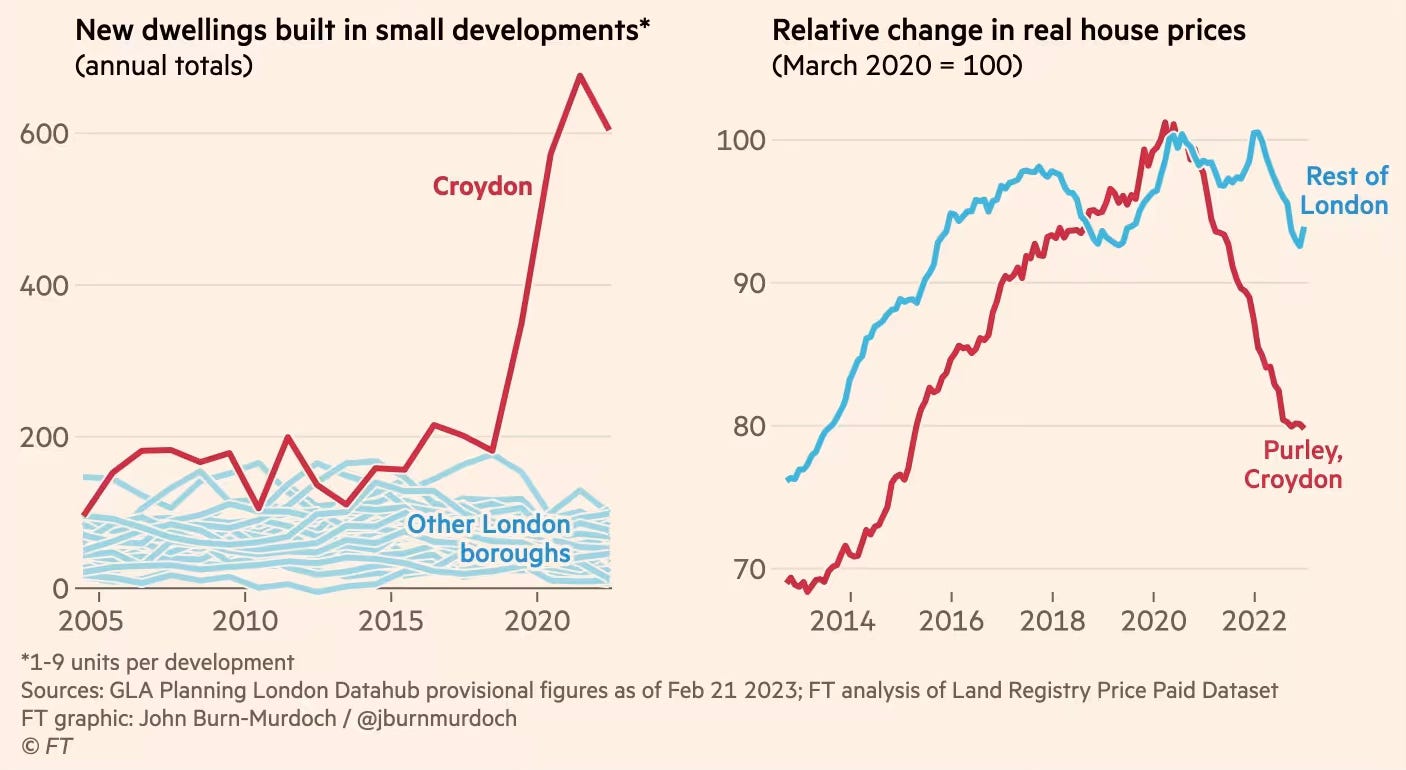
He also points to the success of London suburb Croydon’s brief experiment which allowed homeowners to convert large homes into multiple apartments, that increased supply and lowered prices. 

In 2018, the borough of Croydon published new planning guidance allowing homeowners to redevelop their large single-family homes into medium-rise apartment buildings containing multiple units, provided the new designs were broadly in keeping with the form and building materials of the local area. The policy applied to the whole borough, with no carve-outs. The number of these small developments rocketed, adding hundreds of new apartments selling at prices far below the previous norm. Both supply and affordability improved dramatically almost overnight. But it didn’t last. The new policy became a key focus for anti-development campaigners in a fiercely fought mayoral election, and the borough’s new Conservative mayor repealed it just four years after it was announced. With that, the small densification projects came to an abrupt halt.

Some observations with relevance to the Indian context:

1. The Isreali example is very relevant for India. Mere incentivisation by way of higher FAR or lower building fees will not be sufficient to encourage landowners to redevelop in significant numbers. There’s also the need to overcome the financing (the financing required to redevelop) and co-ordination (to mobilise owners in a multi-tenament unit or bring together adjacent lands) problems. Policies that facilitate builders and developers address this problem is the crucial innovation in Israel. 

The success of such policies depend on how attractive it is to both the landowners and builders. The former should be able to get a larger and higher-valued property without being significantly inconvenienced during the transition. The latter should find the deal commercially attractive - they get enough additional units to make up for the units foregone to landowners and get a handsome profit. The credibility of this scheme will depend on whether the landlords generally abide by the provisions of the contract and deliver the houses at good quality and within the stipulated timelines. 

This can be a challenge given the widespread presence of unscrupulous practices in the real estate sector in the country. It’s therefore important that any such scheme and registered developments be tightly regulated. 

2. The Israeli example also highlights the importance of iteration with complex policies like TAMA 38 and Pinui Binui. There will be several emergent problems once the first version of the scheme is announced, necessitating several iterations before the scheme stabilises. One of the big problems likely in the Indian context would be concerning the possible exploitation of landowners by unscrupulous builders in connivance with the local politicians and officials. Therefore the use of qualified majorities will have to be phased in very carefully. 

3. Another problem with such renewal is the strong likelihood of displacement of the existing lower-income owners and the resultant gentrification. The redeveloped units will be bigger and better, and have maintenance costs. They will also fetch a much higher market price. The owners are therefore likely to find it attractive to sell the redeveloped property to higher-income households. The longer-term consequence of such gentrification is that even blighted and older areas of a city become out of bounds for all but the well-off households. The city becomes less inclusive. Such policies will therefore have to address this problem by iterative evolution. 

4. As I have blogged here, I’m not convinced that easing regulations alone will be sufficient to increase affordability in any meaningful manner. The reason is that the relationship between eased regulations, supply, and affordability is far from linear. For one, the easing has to be very significant (especially in terms of much higher FAR) to trigger meaningful increases in supply. There’s also the possibility that the eased regulations and increased supply will end up being consumed by the pent-up demand from the well-off households without triggering any cascade of displacement of demand that would transmit the supply across all income groups.

Saturday, February 24, 2024

Weekend reading links

1. The Times has an article on the spectacular rise of BYD as the world's leading electric vehicle manufacturer. 

The Swiss bank UBS found last year that a BYD Seal electric hatchback sedan cost 35 percent less to make than a slightly smaller Volkswagen ID.3 of similar quality made in Europe. The savings came only partly from the cheaper lithium iron phosphate batteries. BYD makes three-quarters of the Seal’s parts. Like Tesla, BYD uses only a few electronic systems in each car. By contrast, VW outsources up to two-thirds of its components. BYD also has benefited from lower labor costs in China, although those have risen as factories compete to hire skilled workers.

Interesting that BYD uses iron and phosphate batteries and mostly sells cheaper and plug-in hybrid vehicles with lower ranges. Plug-in hybrids make up nearly half of its sales. In contrast, Tesla sells costlier and purely electric vehicles for larger ranges. Given the smaller ranges of typical urban commuters, Indian electric car manufacturers should focus on hybrids with lower ranges that are cheaper and can be used to expand the demand for these vehicles. 

2. Some facts about the Indian equity markets

Currently, we have about $35 billion entering the markets from domestic investors (mutual funds, insurance, Employees Provident Fund Organisation and National Pension System ). This number will rise to at least $60 billion in the next five years. Combine this with a normalised $20 billion from foreign portfolio investors and we have a structural bid of $80 billion annually for equities.

3. China may never match TSMC in its domestic semiconductor chip manufacturing mission.

At the forefront of the many incredibly complex supply chain challenges Chinese companies will need to overcome is photolithography equipment. Arguably, ASML’s EUV machine is not one but three separate technological challenges - light source/laser, optics, and the instrument worktable - all of which combine to create a machine with over 450,000 components. In etching a semiconductor, a laser in a photolithography machine does not just have to be capable of firing an accurate beam. To create a 13.5nm chip, the laser must hit its target (30 millionths of a meter in diameter) at 50,000 times a second while the target is traveling over 200mph. The many lenses used in the machines must be smooth on the atomic level. Zeiss, the leading (and only) German optical manufacturer capable of providing lenses and mirrors to ASML, likens the challenge of creating mirrors for ASML to “enlarging the mirror to the size of Germany, with elevations no greater than 0.1 mm”. The last major component of an EUV machine is the precision instrument worktable, which in an ASML machine takes over 55,000 components to control the transistors' carving into the silicon accurately.

Shanghai Micro Electronics Equipment (SMEE) is the most advanced Chinese photolithography company, founded in 2002. It’s advanced for China but not for Taiwan or South Korea: its current SSA600 series machines can be used to create 90nm, 110nm, and 280nm chips, generations behind ASML technology. SMEE previously announced plans to release a machine capable of manufacturing 28nm chips, with the initial release scheduled for 2021. As of January 2024, it has still not released a device... Contrary to the Chinese government's goals of establishing an indigenous semiconductor manufacturing industry, SMEE's suppliers depend on foreign parts, with Chinese companies UP Optotech, Focuslight Technologies, and MLOptic Corp sourcing equipment from abroad. In 2022, UP Optotech revealed that German company iC-Haus was their second-biggest supplier. Doubtlessly, there will be dozens of other examples demonstrating the very high barriers to an entirely de-Westernized semiconductor supply chain... Attaining its own semiconductor industry or leapfrogging TSMC or ASML to become the leader in fabrication or photolithography are both extremely unlikely. 

4. Very good article in Livemint about restrictive building regulations limiting the extent of land utilisation of factory lands. It points to a study of regulations in 10 states by a think tank Prosperiti that finds factories can lose over 50% of their land to comply with them. The full report is here. Setbacks, parking, ground coverage, and FAR are the four reasons for the loss of land. 

The restrictions vary across states in their degrees.

The opportunity costs of these restrictions are prohibitive,
An industrial entrepreneur has to shell out large sums of money to keep part of their plot fallow forever. Based on Prosperiti’s estimates, factories in these 10 states stand to lose between ₹2.67 lakh in a micro-factory to ₹3.16 crore in a mega factory. These regulations may be driving an irrational location of factories. Factories should ideally go where land prices are lower. However, restrictive regulations in cheaper areas may drive factories to more expensive locations... Even if the land loss on account of regulations was halved, states could generate between 30-74 jobs in a medium-sized factory. These losses at the factory level can compound to millions of job opportunities lost. For instance, large factories in Maharashtra could have space for 563,000 more industrial jobs had the state reduced the land lost by half. This is 38% of the factory workers currently employed in Maharashtra generating more than ₹500 crore per month in additional wages.

I'm not sure about some of these numbers, but the scale of losses from such restrictions are nevertheless very high. 

5. The warmest winter on record coupled with surging production (which hit a record 105 bn cubic ft a day in December) has left US natural gas prices close to their lowest levels since 1995 at $1.61 mmBTU. 

US natural gas production has mirrored petroleum production, driven by shale gas.
6. FT reports that the EU is set to announce a nearly 500 million euro penalty on Apple for placing restrictions on Apps that inform iPhone users of cheaper alternatives to access music subscriptions outside the App Store. The action follows a complaint by Spotify in 2019. 
The Commission will say Apple’s actions are illegal and go against the bloc’s rules that enforce competition in the single market, the people familiar with the case told the Financial Times. It will ban Apple’s practice of blocking music services from letting users outside its App Store switch to cheaper alternatives. Brussels will accuse Apple of abusing its powerful position and imposing anti-competitive trading practices on rivals, the people said, adding that the EU would say the tech giant’s terms were “unfair trading conditions”. It is one of the most significant financial penalties levied by the EU on big tech companies... Companies that are defined as gatekeepers, including Apple, Amazon and Google, need to fully comply with these rules under the Digital Markets Act by early next month. The act requires these tech giants to comply with more stringent rules and will force them to allow rivals to share information about their services.

7. A new renewable energy race has begun - the tapping of naturally available hydrogen, estimated at 5 trillion tonnes in underground reservoirs. While only a small proportion is likely to be available for tapping, even a small percentage share will be enough to meet the annual demand of around 500 million tonnes for centuries. 

The demand for hydrogen as a fuel and industrial raw material, particularly to make ammonia for fertiliser production, has been mainly met so far by chemically reforming gas that is made up largely of methane, known as “blue hydrogen” when the carbon emissions are captured or “grey hydrogen” when they are not. A smaller amount is made by splitting water through electrolysis using renewable energy sources, known as “green hydrogen”. But Mengli Zhang of the Colorado School of Mines said tapping natural hydrogen — also known as geologic or gold hydrogen — would be cleaner and cheaper than blue or green hydrogen. “A gold rush for gold hydrogen is coming,” she told the conference. The prospect is beginning to attract interest from investors. US start-up Koloma raised $91mn last year from funds including Bill Gates’s Breakthrough Energy Ventures... Previous scientific opinion held that little pure hydrogen was likely to exist near Earth’s surface because it would be consumed by subterranean microbes or destroyed in geochemical processes. But geologists now believe hydrogen is generated in large quantities when certain iron-rich minerals react with water

8. China's spectacular rise as the world's leading automobile exporter and its dominance of the global EV value chain may well be a defining moment in the world trade agenda for the coming decades. 

Chinese companies today dominate the entire value chain of EVs - EV chassis, autonomous driving software, CoNi batteries etc. - as well as the vehicle production itself.  
Paul Li, founder of Chinese electric vehicle parts supplier U-Power, claims working with the country’s EV sector, which is by far the world’s biggest, can mean foreign companies developing cars years faster than they have traditionally and reducing costs by as much as half. As evidence that foreign carmakers are realising the advantages, he points to Volkswagen’s $700mn tie-up with Chinese rival Xpeng last year. That deal was soon followed by a €1.5bn investment in Chinese EV start-up Leapmotor by Stellantis, which makes Jeep cars in the US and owns the Fiat and Citroën brands in Europe... Li’s company... designs and sells EV chassis — known as skateboards. U-Power last month signed a deal to supply New York-based EV start-up Olympian Motors with its skateboards. The company is also working with Singapore-based FEST Auto to sell EVs to the European logistics market. In another example, Shenzhen-based Appotronics, which provides laser projectors for nearly half of China’s cinemas, will supply BMW with laser technology for some of the German group’s latest in-car displays. And Shenzhen-based DeepRoute.ai, which already has a US office, is now setting up one in Europe to sell its mapping technology for driverless cars.

This is a defining moment for US and European trade policy. Corporate interests will mount pressure to allow them to tap the Chinese suppliers for their EV businesses. But this in turn will only end up amplifying the leverage China already has on the global EV industry. The Chinese firms are trying to overcome US restrictions by establishing factories in Eastern Europe and Mexico and then exporting to the US. Some are even establishing JVs with European manufacturers. 

9. Nvidia's $740 share price is nuts? FT Alphaville hints it might be.

This week Nvidia’s market cap passed the $1.8tn mark, leapfrogging Alphabet — whose 2023 net income was greater than Nvidia’s 2023 revenues — to become the third most valuable US company after Microsoft and Apple... To get to a $740 share price simply requires that the company maintain a monopolist-like operating profit margin of 55 per cent for the next decade, while also growing sales tenfold, from $60bn a year to more than $600bn. For context, the entire industry sold $527bn worth of chips last year, according to the the Semiconductor Industry Association. Over the past decade Nvidia did admittedly achieve a similar level of growth: in 2014 its sales were a mere $4bn... Nvidia’s unusual profitability is a recent phenomenon related to the very high prices pushed through in response to overwhelming demand: The EBIT Margins were all over the place from 2014-2023 (range of 12-37 per cent) and certainly nowhere near a steady 55 per cent... At a 15 per cent growth rate and 30 per cent sustainable margins his antiquated model cranks out a share price of $176!

The share has since surged following its latest quarterly earnings report. It added $277 bn in market capitalisation in a single day, which is bigger than the entire market capitalisation of Reliance Industries of $243 bn!

10. A health check of Indian banks presents some very promising numbers.

Believe it or not, 21 of 32 listed banks, including SBI, HDFC Bank, ICICI Bank, Bank of Baroda, Axis Bank, Kotak Mahindra Bank, IDBI Bank and IDFC First Bank have less than 1 per cent net NPAs. Indian Bank has the lowest net NPAs (22 basis points), followed by HDFC Bank and CSB Bank (31 basis points each). One basis point is a hundredth of a percentage point. Lower bad loans have led to lower provisions. In fact, provisions in the December quarter Y-o-Y have dropped 39.51 per cent, from Rs 38,852 crore to Rs 23,503 crore. As a result, collectively the net profit of all listed banks has grown 15.29 per cent to Rs 74,976 crore even though the operating profit growth is just 2.05 per cent at Rs 1.31 trillion.

11. Cory Doctrow has an excellent essay on how social media platforms have degenerated through a process that he describes as enshittification

It’s a three-stage process: first, platforms are good to their users. Then they abuse their users to make things better for their business customers. Finally, they abuse those business customers to claw back all the value for themselves. Then, there is a fourth stage: they die... Facebook arose from a website developed to rate the fuckability of Harvard undergrads, and it only got worse after that. When Facebook started off, it was only open to US college and high-school kids with .edu and K-12.us addresses. But in 2006, it opened up to the general public. It effectively told them: Yes, I know you’re all using MySpace. But MySpace is owned by a billionaire who spies on you with every hour that God sends. Sign up with Facebook and we will never spy on you. Come and tell us who matters to you in this world. 

That was stage one. Facebook had a surplus — its investors’ cash — and it allocated that surplus to its end users. Those end users proceeded to lock themselves into Facebook. Facebook, like most tech businesses, had network effects on its side... But Facebook didn’t just have high network effects, it had high switching costs... So Facebook’s end users engaged in a mutual hostage-taking that kept them glued to the platform. Then Facebook exploited that hostage situation, withdrawing the surplus from end users and allocating it to two groups of business customers: advertisers and publishers. To the advertisers, Facebook said: Remember when we told those rubes we wouldn’t spy on them? Well, we do. And we will sell you access to that data in the form of fine-grained ad-targeting. Your ads are dirt cheap to serve, and we’ll spare no expense to make sure that when you pay for an ad, a real human sees it. To the publishers, Facebook said: Remember when we told those rubes we would only show them the things they asked to see? Ha! Upload short excerpts from your website, append a link and we will cram it into the eyeballs of users who never asked to see it. We are offering you a free traffic funnel that will drive millions of users to your website to monetise as you please. And so advertisers and publishers became stuck to the platform, too. 

Users, advertisers, publishers — everyone was locked in. Which meant it was time for the third stage of enshittification: withdrawing surplus from everyone and handing it to Facebook’s shareholders. For the users, that meant dialling down the share of content from accounts you followed to a homeopathic dose, and filling the resulting void with ads and pay-to-boost content from publishers. For advertisers, that meant jacking up prices and drawing down anti-fraud enforcement, so advertisers paid much more for ads that were far less likely to be seen. For publishers, this meant algorithmically suppressing the reach of their posts unless they included an ever-larger share of their articles in the excerpt. And then Facebook started to punish publishers for including a link back to their own sites, so they were corralled into posting full text feeds with no links, meaning they became commodity suppliers to Facebook, entirely dependent on the company both for reach and for monetisation... Facebook now enters the most dangerous phase of enshittification. It wants to withdraw all available surplus and leave just enough residual value in the service to keep end users stuck to each other, and business customers stuck to end users, without leaving anything... But that’s a very brittle equilibrium.

They argue that in the pre-enshittification era, there were restraining forces like competition, regulation, self-help and worker power that prevented uncontrolled enshittification. over time each of these constraints have eroded and enhittification has been happening unchecked. The author argues in favour of restoring each of these restraints to reverse the process of enshittification. 

This is a good example,

When Diapers.com refused Amazon’s acquisition offer, Amazon lit $100mn on fire, selling diapers way below cost for months, until Diapers.com went bust, and Amazon bought them for pennies on the dollar.

12. The post-Cold War peace dividend enjoyed by Europe

Estimates suggest the continent would have spent an additional $8.6tn on defence over 30 years had they maintained cold war levels of military expenditure.

This, as JD Vance writes, is also an implied tax on US citizens to ensure European security.

13. Amidst geopolitical uncertainties, crackdowns on foreign consultancies and an increasingly hostile environment for foreign firms, foreign investment in China has fallen to its lowest level in 30 years

China’s direct investment liabilities, a gauge of foreign capital flowing into the country, totalled about $33bn in 2023, according to data released late on Sunday by the State Administration of Foreign Exchange. This was an 82 per cent decline from the previous year and the lowest annual figure since 1993.
14. Good set of graphics about the struggling Pakistani economy. This is about the very large share of revenues going into debt-servicing.
15. The Red Sea ship attacks have imposed large costs and increased shipping times, thereby creating shipping fleet shortages.
Diversions to a route round the Cape of Good Hope have added 10 days to two weeks to each voyage between Asia and north Europe and vastly complicated the task of serving some parts of the world... The 102-day time required to complete a loop between Asia and north Europe and back via the Cape of Good Hope means a line needs to deploy 16 ships for a weekly service, instead of the normal 12.
17. This week the Nikkei surpassed the level it reached 34 years back in 1989. The FT article describes the changes in Japan over this time.

The IMF expects Japan’s ratio of public debt to gross domestic product to reach 256 per cent in 2024, compared with 65 per cent in 1989... In 1989 Japanese companies, particularly banks, dominated the global top 10 by market capitalisation. No Japanese companies make the top 10 now. Today, Toyota has risen to become the world’s largest carmaker by sales and the most valuable company in Japan. Sony, which is now more famous for its entertainment business and PlayStation games than the Walkman portable music player, is ranked third while semiconductor equipment maker Tokyo Electron is fifth... In 1989, six of the world’s 10 richest people were Japanese. At the top of the list was Yoshiaki Tsutsumi, the former owner of Seibu Railway, whose wealth Forbes estimated at $15bn. Now, only three Japanese people are ranked among the world’s top 100 billionaires, with Tadashi Yanai, founder of Uniqlo owner Fast Retailing, and his family ranked 30th with an estimated net worth of $40bn... Decades of deflation and economic stagnation, however, have also sapped the appetite for investment, leaving companies sitting on a massive cash pile of ¥343tn... 

By 1989, Japan had also begun to make its name as one of the world’s pre-eminent exporters of soft power, and of the idea that Japan as a country and a culture had something unique to share with the world. Hello Kitty, Mario, Gundam and Sonic enthralled, and Japan’s power to entertain became one of its best-known superpowers. As the stock market neared its peak, Nintendo released the handheld Game Boy console — a machine that would go on to sell more than 100mn units worldwide and physically put Japanese games, a Japanese pop-culture aesthetic and Pokémon in pockets around the world. Just three days before the Nikkei peak, US audiences had their first glimpse of Akira, the seminal anime that would create a global generation of Japanese cartoon fans. In 2024, Japan retains much of this soft power and a significant store of wealth but has lost much of its pre-eminence.

Arguably the biggest change has been with the country's demographics - nearly 30 per cent of the population is over the age of 65!

18. Finally, David Solomon's unreasonable 24% pay rise as Goldman CEO while presiding over one of the firm's weakest performances has naturally triggered discontent within the firm. The firm has already seen several high-profile bankers leave and is now facing the threat of more departures. 

Thursday, February 22, 2024

Industrial growth facilitation and government role

The economic orthodoxy on industrialisation has it that once governments put in the enabling requirements - liberalised regulations, ease of doing business, low taxes, and infrastructure - industrial growth will follow. But both the history and realities of industrial transformation show that this is hardly a sufficient condition for industrial growth. Several other considerations and factors determine the trajectory of industrial growth. These require an active government role. 

For a start, there’s the controversial argument on providing a level playing field for domestic businesses. The history of policies with this objective tending to degenerate into protectionism and inefficiency does not take away from the requirement for a level playing field. All advanced countries of today and the North East Asian economies have extensively used such policies in their development trajectories. For a massive country like India, ensuring that its labour-intensive manufacturing sectors are not swamped by cheap imports is an essential requirement. 

In this context, the competition from cheap Chinese imports is especially relevant. In the last three decades, we have seen that globally across industries cheap Chinese imports have squeezed out competitors. Even manufacturers from the advanced economies struggle to be competitive against the Chinese. It’s therefore compelling to argue that if India had embraced orthodoxy and lowered tariffs across the board, the Chinese imports would have swamped the domestic market and seriously eroded the country’s manufacturing base. Even with the higher tariffs, Chinese imports have seriously dented local manufacturers in several sectors. Active government role, even with all its risks, is unavoidable. 

Then there’s the process of getting large investors, especially foreigners, into making the actual investments. Let’s be clear, no large investor is going to invest just because the business environment is great, especially when they have global choices. In the context of India with its fierce competition among states, no investor is going to walk in and invest just because you are the top-ranked state on ease of doing business or has superior logistics. States court investors aggressively. So if you are not doing the same, no matter how robust the business environment, there’s little chance of getting the investment.

This is where things get interesting. The decision point for a state government is this - what’s the most cost-effective strategy to convince the investor to choose the state over others? 

A few things would be essential requirements like land, expedited statutory permissions, the provision of utilities (like electricity, telecommunications, and water), and access to connectivity infrastructure like roads, airports, and ports. The differentiators would revolve around tax concessions, input subsidies, ease-of-doing business (EoDB) facilitators, and proactive engagement. The EoDB facilitators would also include the strength of the state’s manufacturing base. 

States choose to present a package that combines these elements. This choice presents some problems.

What’s the least expensive combination that can help swing the investment decision? What’s the most attractive combination of business environment facilitators that’s both credible and generates enough confidence? Can the EoDB attractions and high-level courting offset some of the financial incentives? 

I’m inclined to argue that for the bigger states, a strong EoDB offering and aggressive high-level courting of the investor are sufficient to make up for any lower financial incentives. The important thing here is the quality of the EoDB offering and the credibility and commitment of the investor engagement. States should be encouraged to pursue this strategy instead of the current ruinous bidding wars with financial incentives. 

In any case, whatever the combination of offerings, this strategy is front-and-centre about picking winners - both the sectors and the specific firms in those sectors to back - and pursuing them aggressively. It runs contrary to economic orthodoxy. 

There’s another aspect to the realisation of actual investments. Large manufacturing investments require some pre-existing manufacturing base or an ecosystem. But India’s limited manufacturing base means it’s not blessed with many such ecosystems. They have to be created (I think it’s fair to say that almost all industrial clusters of today were created through active government role in triggering and sustaining their initial growth). And this too requires active industrial policy and co-ordination by the government. 

Tamil Nadu is a good example. Its initial successes with its automotive manufacturing base have provided a strong foundation for its recent achievements in attracting Apple’s iPhone contract manufacturers, electric vehicle investments etc. It has at least three or four such well-developed clusters with ecosystems that are attractive enough for large investors. And to the state’s credit, it has been building on these strengths

The creation of new ecosystems is hard. A realistic strategy to create the ecosystem is to have a large investment and build the ecosystem around it. However large investors are reluctant to invest in areas without the manufacturing base. There’s a chicken-and-egg gridlock. It then is a massive leap of faith from the investor to make the investment decision. This, in turn, will require both financial incentives as well as huge confidence in the state’s business environment and also the commitment of the host government.

It’s especially in such investments where proactive government engagement can swing things. Several examples from across the country of such successes exist where large global firms have chosen to invest in areas without the ecosystem. Governments have actively partnered with the investors to create the ecosystem and make the investment successful. Such investments generally end up creating some kind of an industrial cluster in the area. 

Apart from generous financial incentives, such successes require a combination of both the highest level of political commitment (in terms of the Chief Minister’s interest) and strong bureaucratic leadership and painstaking follow-up. 

Monday, February 19, 2024

Some thoughts on India's economic challenges

Every country, at least the larger ones, faces its unique development challenges. India is striving to reach the upper middle-income status in the coming decade. But it has to realise this while also encumbered with a low capital base - human, physical, and financial - and poor quality of human resources. All this has created an economy with a very narrow productive base and not broad-based enough economic growth. 

This context appears to have created the conditions for an economy that will continue to grow at a fair pace but on two tracks - a small highly productive world-class economy that powers ahead at a rapid rate, creating its own relatively big consumption class; the vast majority of the economy, with a predominant informal sector, grows at a much slower pace and whose transition to the former will follow the trickle-down trajectory. The China or North-East Asia-type growth will require the latter to transition much faster to the former than what’s happening now. 

Against this backdrop, what are the possible drivers of high and rapid economic growth? 

I can point to some important factors that could drive rapid growth in India. One, its macroeconomic fundamentals are strong, much stronger compared to its peers. Two, when compared to all its peers and many higher-income countries, it has a very good track record of balanced macroeconomic management and fiscal prudence, and this looks most likely to continue. Three, it has largely pursued prudent growth-enabling policies, and those like Production-linked Incentives (PLIs), for all its critiques, may just have done enough to shift manufacturing to a productive and scale growth trajectory. 

Four, its banks have recovered from their stresses and are well-capitalised and the corporate sector by and large is in very good health. Five, it has pockets of business dynamism which are large enough to contribute significantly to aggregate growth - a group of high productivity and high growth companies, a high-skills services sector exemplified by the Global Capability Centres, a large and growing IT sector, a vibrant start-up ecosystem, an emerging landscape of large contract manufacturing etc. Six, it has a small group of national champions with access to finances, risk appetite, and capabilities to rapidly scale up its infrastructure. Seven, it’s well placed to benefit from the geo-political tailwinds arising from US-China tensions and the trend of diversification away from China. Finally, it’s well positioned to reap the significant collateral benefits (like FDI and portfolio capital flows) from being a massive economy and also being the fastest-growing big economy for the foreseeable future.

In this context, this post will point to some issues that will be important factors for the country’s economic prospects and growth trajectory. 

1. Limits to formalisation. An important focus of India’s macroeconomic policy in recent years has been the aggressive push to formalise the economy. The demonetisation, the Goods and Services Tax, and digital payments have been high-profile policies in this direction. A feature of this focus has been its reliance on the supply side, i.e., creating the conditions to ensure supply is formalised. 

While this formalisation push is undoubtedly required, there are also limits to it. In theory, formalisation increases productivity, which in turn leads to efficiency improvements, technological upgradation, higher wages etc. But this supply-side focus overlooks the demand-side. A formal supply side requires the demand side that can absorb that supply. But formality ends up increasing prices, thereby making the product unaffordable for a very large segment. 

It’s for this reason that formalisation has historically been a slow process and closely linked to economic growth. Therefore, instead of forcing the informal firm/sector to become formal, the objective should be for new activities to start formal and thereby shrink the share of the informal over time. It also means there’s a need to ensure that economic growth is broad-based and productivity-enhancing so that there’s a proportionate increase in the consumption class.

In simple terms, the push to formalise supply should be complemented with demand-broadening economic growth. 

2. Green transition. A strategy similar to formalisation has been adopted for green transition. The belief is that India can leapfrog the green transition, shifting rapidly from internal combustion engines to electric vehicles, fossil fuels to renewables, and old energy to new sources like green hydrogen. 

But like with formalisation, there are several problems with this strategy. The green transition comes with costs and financing requirements. Who bears the costs of the transition - the phasing out of the current investments before their economic life-cycle, the adoption of more costlier and rapidly evolving technologies, taxes on climate change causing externalities etc? How can companies, banks, and governments absorb the losses and finance the new investments, and households afford the higher-priced green products and services? 

Again, like with any economic transition, the green transition too will have to take its time. For sure, it can and should be expedited. But only to the extent that the economy can support - the supply side can meet the requirements, and the demand side can absorb the supply. This means it’s required to be practical and opportunistic and phase the transition in all aspects, including the adoption of appropriate technologies (natural gas, plug-in hybrids and small battery vehicles, nuclear fuels etc).

3. Size of the productive economy. As I have blogged here, arguably the biggest concern about the Indian economy is whether it has the base to sustain high growth rates for long periods. But on the positive side, it can be argued that despite its narrow productive base, the continental size of the Indian economy might mean that this narrow base is large enough in absolute value to provide the momentum for attaining a high growth path. Once it attains this path, it can ride opportunistically on tailwinds to sustain the growth trajectory. 

However, this would depend on the absolute value of the productive slice of the economy - the number of people, the segmentation of their purchasing power, the types of economic activities they are engaged with, the geography of these people and their economic activities etc. Unfortunately, there are no reliable data on any of these. In its absence, we can only speculate based on anecdotal evidence. 

In any case, it’s hard to refute that the Indian economy has a skewed structure - a high-productivity small. segment co-existing with a predominantly low-productivity economy. This skew has widened since the liberalisation. It can be argued that while economic growth has largely improved all lives, its gains have been very disproportionately concentrated in a small segment (relative to the population). 

4. Anchor industries to trigger manufacturing scale. India’s efforts through Make in India and Production-linked Incentives (PLIs) at catalysing manufacturing have not yielded expected returns in terms of an increased share of manufacturing in economic output. But the PLI scheme may be a catalytic game-changer not because of the magnitude of the financial incentives it offers, but in terms of generating investor interest and bringing focus on a few prioritised sectors. PLI Scheme is the policy instrument to complement the marketing campaign of Make in India. Its most important success to date may be the platform it has provided for the intense courting of Apple and Foxconn in mobile phone manufacturing. Similar anchors in solar and wind power generation, electric vehicles and their batteries, and electronic equipment may just about be enough to push the economy into a higher trajectory in manufacturing. 

Investments to establish a handful of mega global-scale manufacturing facilities including the creation of their supplier ecosystems may be the most practical strategy to give a significant boost to manufacturing. It creates the conditions for economy-wide productivity improvements and technology diffusion through learning by doing. Contrary to orthodoxy, it’s about picking winners at both the sectoral and firm levels. This has to be followed with highest-level courting, and long-drawn and credible facilitation of the preferred investors. Apple and Foxconn is the best example. 

However, this policy needs to be pursued with care, especially given the high tariff barriers erected against inputs to protect domestic manufacturers against cheap Chinese imports. In the case of mega-brands like Apple, quality and global competitiveness is not a problem. But in the case of others, industrial policy must incentivise export competition or risk ending up supporting mediocrity protected by high tariffs. The global competitiveness-reducing effects of high import tariffs on inputs can be offset by subsidies like the PLIs which are linked to exports. 

5. Services-led structural transformation. The spectacular success of India’s IT sector has created a belief that India’s structural transformation pathway lies through the services sector. There are several well-known reasons to doubt this strategy. I have blogged here. Services are mostly non-tradeable, therefore not amenable to benefit from technology diffusion and productivity improvements, and also constrained by limited demand. Manufacturing is an essential pathway for large-scale structural transformation, especially for a massive economy like India’s. Increasing manufacturing should be the primary pursuit of public policy. 

6. An industrial policy that supports jobs over capital-intensive manufacturing. It’s becoming increasingly evident that technological advancements have the potential to automate many, even a majority, manufacturing shop-floor jobs. The only reason for retaining shop-floor workers is the favourable unit economics in terms of the availability of cheap labour. This will change with time in favour of automation. 

Against this backdrop, in time it may become necessary to design an industrial policy to disincentivise automation and subsidise labour-intensive manufacturing. But its implementation will be challenging. For example, how to incentivise labour-intensive manufacturing without discouraging technological upgradation? Then there’s the challenge of its implementation.

7. Overcoming human capital constraint. There’s nothing more important than human capital quality in determining the economic growth trajectory of a country. But arguably the biggest constraint to India’s economic growth is the poor quality of its human capital and the acute deficiency of good-quality senior talent. Improving learning outcomes and creating a genuinely educated workforce is perhaps the most wicked of problems. While there’s a clear realisation of the importance of improving student learning outcomes in schools and colleges, I’m not sure we are doing anywhere enough to address the problem in any significant manner. 

This constraint binds across the economy. Large manufacturing firms struggle to access skilled and (at least nearly) employable labour at the scale they require. There’s an acute scarcity of good enough quality middle and senior managers, product managers, designers, scientists etc. Further, the large supply of new labour market entrants from technical institutions should not be conflated with good quality of supply. There are no easy answers to solve this constraint. And it can bind very quickly as the economy starts to grow at very high rates.
Saturday, February 17, 2024

Weekend reading links

1. On the Taylor Swift economy

It’s been estimated Swift’s Eras tour generated US$5bn in the US economy; the US Federal Reserve even singled her out for stimulating the national tourism industry. “If Taylor Swift were an economy,” said Dan Fleetwood, the president of QuestionPro, the research company that made that estimate, “she’d be bigger than 50 countries.” 

Her impact can already be felt in Australia, where Sydney and Melbourne are busy preparing for her arrival next week. It is expected that Swift’s seven concerts in the two cities – three in Melbourne and four in Sydney – will generate $140m, according to state government modelling. More than 85% of the hotels and motels in Melbourne city are booked during her first two shows; a similar capacity is expected in Sydney. Qantas added an extra 11,000 seats on flights to both cities. Australian bead sales are reportedly through the roof, as Swifties prepare friendship bracelets to exchange at her shows.

On her marketing strategy,

While the Eras tour was moving through the US, one estimate suggested that while every US$100 spent on a live performance would typically result in US$300 in ancillary spending on things like hotels, dining, merch and transport, Swifties were spending US$1,300. Part of this stems from their devotion to her, but also her practice of releasing multiple versions of one item: there are more than 20 versions of her album Midnights available to buy, for instance, with extra tracks and different covers. “If any other artist sold eight different vinyl versions of the same album, people would think they were ripping us off. When it is Taylor, it’s like, ‘amazing, I’ll buy them all’. It’s part of the fan identity in a way that nobody else has really mastered,” says Caroll.

This statement by the Japanese embassy in Washington reassuring fans that Swift would be able to complete her last Eras concert in Tokyo and still be able to make it to cheer her boyfriend Tavis Kelce at the Super Bowl final exemplifies the phenomenon she has become. 

2. As India opens up its G-Sec market to foreign portfolio investors in June, this snapshot of the foreign ownership of Indian bonds.

It's being estimated that with the activation of the inclusion of India into the JP Morgan Bond Index, about $18-22 bn in portfolio flows are likely in the last three quarters of 2024-25. 

3. Tamal Bandopadhyay captures the governance issues at the heart of Paytm Payments Bank Ltd (PPBL).
When a payments bank is being punished for “persistent” non-compliance with regulations, nowhere are its managing director (MD) and chief executive officer (CEO) to be seen. Instead, its majority stakeholder has taken up the responsibility of doing everything – convincing customers to stay put, the regulator to go slow and even the finance minister to influence the regulator.

The RBI's actions are the culmination of a long series of defaults and non-compliances by the Bank despite clear directions by the regulator. 

Serious irregularities have been found with respect to the KYC norms and how much money a payments bank can keep as day-end balance in a customer account. Besides, the RBI has found several instances of a single PAN linked to thousands of customers for transactions worth crores of rupees. This even raises concerns of money laundering as an unusually high number of dormant accounts are prone to be used as mule accounts. On many occasions, PPBL has allegedly submitted false compliance reports, fooling the regulator. Finally, it has not stayed at an arm’s length with the promoter group entities and got involved in significant intra-group and related-party transactions, which have reportedly not been disclosed. Who knows if bank customer data was shared with the group companies?... A diluted KYC norm was followed for people involved in P2P transactions, but many of these transactions turned out to be P2M transactions. They have overshot the limit many times. Ideally, the bank should have filed suspicious transaction reports to the financial intelligence unit, which collects financial intelligence about offences under the Prevention of Money Laundering Act.

The article is an excellent primer om the whole issue.

4. Hong Kong stocks are back to the levels of the 1997 handover!

In the spring of 2019 at the onset of the democracy protests, the Hang Seng index was trading at nearly 30,000. It is now more than 45 per cent below that level at 15,750... a three-year bear market that has taken China’s broad CSI 300 index down more than 40 per cent from its spring 2021 peak. Reflecting collateral damage on Chinese enterprises listed in Hong Kong and the city’s China-sensitive services sector, the Hang Seng has fallen 49 per cent over the same period.

And things are likely to get worse. FT reports that the second largest global law firm, Latham & Watkins is cutting off automatic access to its international databases for its HK-based lawyers. HK is effectively being treated by global firms as the same as mainland China. 

5. Meanwhile Chinese deflation, as seen in their export prices, are at their highest since the financial crisis.

BYD, China’s biggest carmaker, recently announced price cuts of between 5 and 15 per cent for its electric vehicles in Germany, after Mercedes-Benz warned late last year that its profits were being hit by a “brutal” price war in electric vehicles. Nearly every other manufacturing company in Germany surveyed by the Bundesbank in the past year relied on Chinese supplies for critical intermediate inputs whether directly or indirectly, the central bank said in a report last month. “China spent 20 years destroying emerging-market competitors in the manufacturing space, or at least squeezing them out of global markets. Now it’s threatening to do the same to advanced economies’ manufacturers,” said Charles Robertson, head of macro strategy at FIM Partners.

5. US market frothiness on the rise, as seen by the Rule of 20 (which suggests market is fairly value when P/E + CPI year/year is equal to 20)!

6. Shyam Saran has a good summary of the economic and political headwinds facing China.

7. David Solomon, the controversial CEO of Goldman Sachs, is rewarded with a compensation of $31 million, and increase of 24%, despite the bank reporting its lowest profits in four years.
Last year was the most challenging of Solomon’s five-year tenure leading Goldman. He faced a string of critical news articles about his leadership style, while the bank also cut thousands of jobs and suffered from a slowdown in investment banking activity... His remuneration was up from $25mn in 2022, making 2023 his second-most lucrative year running Goldman behind the $35mn he earned in 2021. Solomon’s pay rose more than overall expenses on remuneration at Goldman, which were up only 2 per cent last year. The bank’s headcount fell by 3,200 employees in 2023 to just over 45,000 and average pay expense per employee was up almost 10 per cent... Net income at the bank fell 24 per cent in 2023 to $8.5bn, the lowest since 2019. Goldman also reported a return on equity, a key gauge of profitability, of 7.5 per cent, well short of the bank’s target of 14 per cent to 16 per cent.

What was the justification for such increase despite the poor performance?

But the board rewarded Solomon for paring back a lossmaking push into retail banking, re-emphasising Goldman’s strategy around its core investment banking and trading business and expanding in asset and wealth management... “While these strategic actions negatively impacted short-term performance, the compensation committee believes that the actions of senior management were critical to reorienting the firm with a much stronger platform for 2024 and beyond,” Goldman wrote in the filing announcing Solomon’s pay.

How did other banks reward their CEOs?

JPMorgan’s Jamie Dimon, whose bank reported record profits for 2023, had his pay rise about 4 per cent to $36mn, while Morgan Stanley’s James Gorman, who stepped down as CEO at the start of 2024, was paid $37mn, up 17.5 per cent. Bank of America cut the pay of its top executive Brian Moynihan by 3 per cent, or $1mn, to $29mn.
One executive compensation in the top US companies has nothing to do with performance. It's more a cartel of price fixing where the compensation stays in a small band. 

Instead of free-market and talent competition, the market for executives is a closed cartel of price fixing with no correlation with outcomes.

8. FT has an article which points to the reversal of trend in the covid-induced shift towards online apparel retail in the UK. Since the pandemic though the trend has reversed - physical shops have rebounded and the fortunes of the online retailers have dipped. This is reflected in the sharply dipped share prices of online retailers (Asos, Boohoo, Sosander, Zalando) and strong increases in that of physical stores (Marks & Spencers, Fraser). Offline-online apparel retail share is 60:40.

Nobody knows with any reasonable certitude as to the fate of the online-offline battle.
“What we’re seeing is a rebalancing of the online and in-store channels,” says Tamara Sender Ceron, a fashion retail analyst at Mintel. That has left all retailers with questions about which channel will be more profitable and where to prioritise investment. Even Next, a UK mid-market operator that has been more successful than most at combining stores with online operations, admits it is hard to predict where things will settle. “Our view is that we don’t know,” says its long-serving chief executive Lord Simon Wolfson. “But we don’t want to precipitate a retreat from [physical] retail necessarily, because, you know, it does appear to be stable for now.”... Sender Ceron believes that Generation Z and millennials’ shopping habits were transformed by the pandemic. “They’re hot between channels, so it’s not as clear cut as online and in store anymore . . . They’re using smartphones to compare prices and check stock availability while they’re actually in store.”
... The substantial fixed costs of operating stores have in the past been a millstone for traditional retailers. But many areas in the UK have experienced steep falls in store rents in recent years while business rates — a property tax linked to rents — were recalibrated last year, resulting in reductions for many. At the same time, online retailers have been hit with higher prices for everything from freight to marketing. “Online is a much more expensive place to trade than it’s ever been,” says John Edgar, chief executive of department store group Fenwick. “That’s the Google costs, the logistic costs, and those costs vary with sales.”

The rapid surge in online retail, turbo-charged by the pandemic induced lockdowns, is a feature of new markets. But once the pent-up (or latent) demand is met in a surge, reality sets down. 

But as these companies reach maturity, they face a series of challenges that raises questions about the scalability and longevity of their business models. As physical shops reopened, online orders in Europe’s main markets slowed down for likely the first time in modern retail history, according to Forrester Research. It expects overall online sales in major markets to remain flat in 2023.

9. I have blogged earlier that interest rates will not go back to the pre-pandemic ultra-low levels.

The so-called neutral rate of interest — the borrowing rate that keeps economies growing steadily, with full employment and inflation around 2 per cent. After falling to rock-bottom levels before the pandemic, the neutral rate has, by some measures, edged up more recently. This could suggest official rates will not head as low as their pre-pandemic levels, even as inflation eases... The neutral rate is not directly set by central banks, and they cannot reliably observe where it is. But for many economists the inflation-adjusted neutral rate — known by a range of other labels including the natural or equilibrium rate or R-star — is a valuable guiding light. If the official interest rate sits above it, central bankers consider policy to be restricting economic activity; below it, policy is deemed to be expansionary. The neutral rate’s value is highly contested...
 
The lower neutral rates of recent decades were driven by a range of long-term factors, including subdued productivity growth, a glut of savings swilling around the world and an ageing population that boosted the stockpiles of cash stored away for retirement. One widely used estimate, from the New York Fed, points to a multi-decades-long decline in inflation-adjusted neutral rates in both the US and euro area that shows no sign of reversing... This put R-star in the US at the third quarter of last year at 0.9 per cent before inflation — a big fall from levels approaching 4 per cent at the start of the millennium. Canada’s inflation-adjusted neutral rate was 1.5 per cent and the eurozone’s was -0.7 per cent, according to their model. Other methodologies for estimating the neutral rate point to similar declines... Directly before the pandemic, the so-called “central tendency” estimates for the longer-run federal funds target range lay between 2.4 per cent and 2.8 per cent, implying policymakers believed R-star lay between 0.4 per cent and 0.8 per cent when taking into account the Fed’s 2 per cent inflation goal. But the most recent projections show a range between 2.5 per cent and 3 per cent, or 0.5 per cent and 1 per cent for R-star.

In Europe, the neutral rate appears to have risen more than in the US. 

ECB executive board member Isabel Schnabel told the Financial Times this month: “There are good reasons to believe that the global R-star is going to move up relative to the post-financial crisis period.” She predicted that higher investment to tackle climate change, increased defence spending, the fragmentation of the global trading system and higher government debt would all push up the neutral rate of interest... ECB officials published a paper this week outlining how the median of the various measures of the neutral rate that it tracks had risen 0.3 percentage points since before the pandemic hit in 2020.