Substack

Monday, January 30, 2023

The Big Tech break-up litigation begins

In its latest salvo at the Big Tech and the first definitive action to break-up large companies, the US Department of Justice (DoJ) has initiated anti-trust action against Google for exercise of monopolistic control of the digital advertising market. The suit requests the Court to adjudge and decree that Google has acted to violate Section 2 of the Sherman Antitrust Act 1890 and unlawfully 
... monopolize the publisher ad server market in the United States... monopolize, or, in the alternative, attempt to monopolize, the ad exchange market in the United States ... monopolize the advertiser ad network market in the United States... tying AdX and DFP. 
Its plea,
Order the divestiture of, at minimum, the Google Ad Manager suite, including both Google’s publisher ad server, DFP, and Google’s ad exchange, AdX, along with any additional structural relief as needed to cure any anticompetitive harm; Enjoin Google from continuing to engage in the anticompetitive practices described herein and from engaging in any other practices with the same purpose and effect as the challenged practices; Enter any other preliminary or permanent relief necessary and appropriate to restore competitive conditions in the markets affected by Google’s unlawful conduct.

The suit's argument goes like this,

Every time an internet user opens a webpage with ad space to sell, ad tech tools almost instantly match that website publisher with an advertiser looking to promote its products or services to the website’s individual user. This process typically involves the use of an automated advertising exchange that runs a high-speed auction designed to identify the best match between a publisher selling internet ad space and the advertisers looking to buy it... One industry behemoth, Google, has corrupted legitimate competition in the ad tech industry by engaging in a systematic campaign to seize control of the wide swath of high-tech tools used by publishers, advertisers, and brokers, to facilitate digital advertising. Having inserted itself into all aspects of the digital advertising marketplace, Google has used anticompetitive, exclusionary, and unlawful means to eliminate or severely diminish any threat to its dominance over digital advertising technologies.

Google’s plan has been simple but effective: (1) neutralize or eliminate ad tech competitors, actual or potential, through a series of acquisitions; and (2) wield its dominance across digital advertising markets to force more publishers and advertisers to use its products while disrupting their ability to use competing products effectively... Google, a single company with pervasive conflicts of interest, now controls: (1) the technology used by nearly every major website publisher to offer advertising space for sale; (2) the leading tools used by advertisers to buy that advertising space; and (3) the largest ad exchange that matches publishers with advertisers each time that ad space is sold. Google’s pervasive power over the entire ad tech industry has been questioned by its own digital advertising executives, at least one of whom aptly begged the question: “[I]s there a deeper issue with us owning the platform, the exchange, and a huge network? The analogy would be if Goldman or Citibank owned the NYSE.”

By deploying opaque rules that benefit itself and harm rivals, Google has wielded its power across the ad tech industry to dictate how digital advertising is sold, and the very terms on which its rivals can compete. Google abuses its monopoly power to disadvantage website publishers and advertisers who dare to use competing ad tech products in a search for higher quality, or lower cost, matches. Google uses its dominion over digital advertising technology to funnel more transactions to its own ad tech products where it extracts inflated fees to line its own pockets at the expense of the advertisers and publishers it purportedly serves. 

Google’s anticompetitive behavior has raised barriers to entry to artificially high levels, forced key competitors to abandon the market for ad tech tools, dissuaded potential competitors from joining the market, and left Google’s few remaining competitors marginalized and unfairly disadvantaged. Google has thwarted meaningful competition and deterred innovation in the digital advertising industry, taken supra-competitive profits for itself, and prevented the free market from functioning fairly to support the interests of the advertisers and publishers who make today’s powerful internet possible.

The harm is clear: website creators earn less, and advertisers pay more, than they would in a market where unfettered competitive pressure could discipline prices and lead to more innovative ad tech tools that would ultimately result in higher quality and lower cost transactions for market participants. And this conduct hurts all of us because, as publishers make less money from advertisements, fewer publishers are able to offer internet content without subscriptions, paywalls, or alternative forms of monetization. One troubling, but revealing, statistic demonstrates the point: on average, Google keeps at least thirty cents—and sometimes far more—of each advertising dollar flowing from advertisers to website publishers through Google’s ad tech tools. Google’s own internal documents concede that Google would earn far less in a competitive market.

Google corners 35 cents of each advertising dollar that flows through its Ad-tech tools!


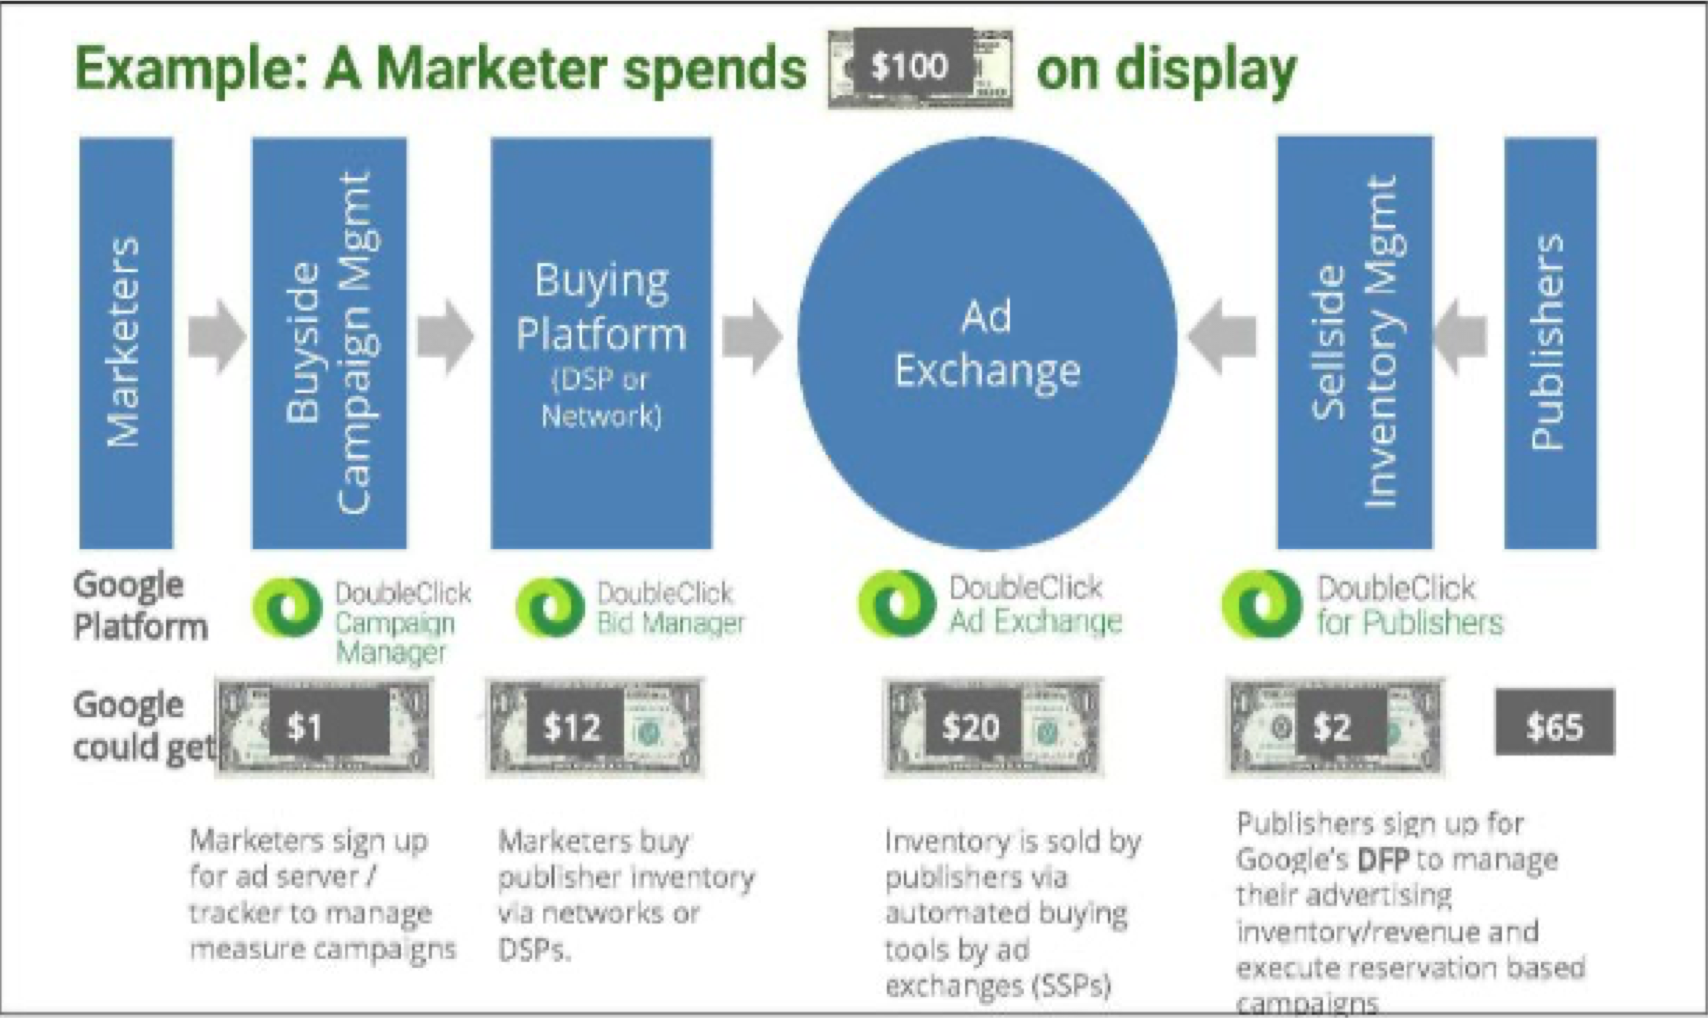
The scale of monopoly power and its pervasiveness across the entire chain is staggering

Bloomberg has a good summary article. See also this

As I blogged earlier here, I'm inclined to draw comparisons between modern digital platform companies and the earliest railroad and other transportation companies. Imagine the earliest railway operators using their  ownership of railway tracks and first-mover advantage to erect entry barriers on everything related to the industry - railway carriage operation, passenger and freight transport, operational services like signalling and track maintenance, support services like ticketing, commercial activities in railway stations, electricity and telecommunication lines along tracks etc. 

Imagine Cornelius Vanderbilt being allowed to build a railway empire that gatekeeped all these activities in the guise of being a platform company. No wonder that the Woodrow Wilson administration nationalised railways in the US in 1917 under the Federal Possession and Control Act, and regulations have since firmed up globally in the brick-and-mortar economy around such platforms which are considered natural monopolies and common carriers. 

While it's cognitively easier to imagine the harmful impacts on consumer welfare and innovation in case of an industry like railways, it's no less so in digital technology platforms. 

The consumer welfare argument against anti-trust actions (which underlies the assessment of anti-trust actions by courts in the US) in case of internet search, e-commerce, and social media is deceptive since all these basic activities are offered free of cost. This argument obscures the real problems with Big Tech and provides a convenient fig leaf and ideological basis for them. In fact their commercial value comes from the network of consumers in their platforms and the data generated from them. This network of consumers forms the basis for newer business lines like advertisements, own-brand sales, payment services etc where the platform ownership also provides unfettered market power. In fact, the consumer welfare assessment of big technology companies should be based on these second-order activities. 

But the real test on competition issues in case of Big Tech should come from assessment of their impact on innovation. Given their almost general purpose nature, each of internet search, social media, and e-commerce platforms, become gatekeepers to a massive economy of numerous emerging digital services. It's simply unacceptable that the platform company should exercise so much control over the emergence of these new services. Again the aforementioned parallels with railways is instructive. This assessment of impact on innovation would involve prospective assessment of the likely costs from lack of competition in these new services. This requires considerable expansion of the scope of anti-trust actions. 

Fortunately, regulators in Germany have taken the lead in this area through Section 19a of the German Competition Act which became law in January 2021. 
Section 19a prohibits conduct in areas where platforms are not yet dominant and leaves the door open to tackling future anti-competitive behaviour that has not yet been identified. If companies are ruled to be of “paramount significance for competition across markets”, then the regulator can prohibit them from ranking their own services ahead of rivals, from denying rivals access to data, and from preventing users from taking their own data to other competing services. Since Section 19a came into effect, Germany’s antitrust watchdog has opened high-profile investigations against the world’s largest tech companies. The Federal Cartel Office’s investigation into whether Facebook grants an unfair advantage to users of its social network platforms on its VR glasses has already brought benefits to consumers, even as it continues. The German watchdog has ensured users can use the headsets without a Facebook or Instagram account. It is also investigating Google Maps over potential anti-competitive restrictions to the detriment of rivals and opened two separate probes into Amazon’s marketplace practices over concerns that the platform is disadvantaging the position of third-party sellers.
Roadways, railways, pipelines, telecommunication cables, newspapers, magazines, banks, stock exchanges etc are example of platforms. Since their emergence, they have gradually come under various forms of regulation that separates platform ownership from services delivery on the platform. 

e-commerce marketplaces, digital payment channels, digital advertisement exchanges, social media sites etc are examples of such platforms belonging to the digital industry. Like with the railways, these technologies are emerging and their markets are in the early stages of development. It's only natural that the initial land grabbers have become monopolists. 

The technology platform companies have enjoyed their period of regulatory forbearance that's characteristic of any new industry. They have grown so big now and their anti-competitive actions are so obvious (see this and this). They should have been regulated yesterday. 

The companies will invariably protest and mobilise massive efforts and resources to maintain status quo and stall regulation. This should be seen as the natural process in any emerging industry. Since  public opinion can be misled by the first order consumer welfare arguments of supporters of Big Tech and since governments are already behind the curve in regulating these companies, commentators and opinion makers should take the lead to explain the case for increasing regulation and mobilising public support. 

Saturday, January 28, 2023

Weekend reading links

1. On top of opaque lending practices which have led to debt crises in many countries, it now emerges that poor quality of construction may be another problem with at least some of the Belt and Road Initiative (BRI) projects. Some samples,

Thousands of cracks have emerged in the $2.7 billion Coca Codo Sinclair hydroelectric plant, government engineers said, raising concerns that Ecuador’s biggest source of power could break down. At the same time, the Coca River’s mountainous slopes are eroding, threatening to damage the dam... In Pakistan, officials shut down the Neelum-Jhelum hydroelectric plant last year after detecting cracks in a tunnel that transports water through a mountain to drive a turbine... The head of the country’s electricity regulator, Tauseef Farooqui, told Pakistan’s senate in November that he was concerned the tunnel could collapse just four years after the 969-megawatt plant became operational...

Uganda’s power generation company said it has identified more than 500 construction defects in a Chinese-built 183-megawatt hydropower plant on the Nile river that has suffered frequent breakdowns since it went into operation in 2019. China International Water & Electric Corp., which led construction of the Isimba Hydro Power Plant, failed to build a floating boom to protect the dam from water weeds and other debris, which has led to clogged turbines and power outages, according to the Uganda Electricity Generation Co., or UEGC. There have also been leaks in the roof of the plant’s power house, where the generators and turbines are located, UEGC said. The plant cost $567.7 million to build and was financed mostly through a $480 million loan from the Export-Import Bank of China... In Angola, 10 years after the first tenants moved into Kilamba Kiaxi, a vast social housing project outside the capital of Luanda, many locals are complaining about cracked walls, moldy ceilings and poor construction. The project, built by China’s CITIC Group, was initially funded through a $2.5 billion, oil-backed credit line from the Industrial and Commercial Bank of China that was later refinanced by the China Development Bank.

2. Gillian Tett writes that 4% may be the new inflation norm for central banks.  

3. Business Standard writes about the demand-supply gap for dialysis in India,

Dialysis in India costs $25 a session compared with $300 a session in the US. India, however, with its high hypertension- and diabetes-prone population, remains a growing market for dialysis service providers. Every year, the country adds 600,000 to 700,000 patients in need of dialysis. Given that some 40 per cent die, the net patient addition is 350,000 to 400,000, which translates into an incremental requirement of 55 million dialysis sessions every year, more than double the current number of 21-22 million. The country has 50,000 dialysis machines, 5,000 centres for dialysis and about 3,000 practising nephrologists.

Clearly the demand-supply gap is large enough to keep the supply growing at high double digits for several years. Sample this

Vikram Vuppala, founder and CEO, NephroPlus, said the market will continue to grow at 20-25 per cent over the next three or four decades and predicts that the share of organised private sector players in the dialysis market — there are several mom-and-pop centres run by doctors — will increase from 21-22 to 40 per cent in the next five years.

I'm inclined to argue that such growth rates will not persist beyond a few years and what prevents that from happening are two-fold - affordability (demand-side) and entrepreneurship and capital (supply-side). 

4. NYT article on the tuition industry at Kota

“There are two types of students in Kota — rankers and bankers,” Amit Gupta, a coaching-center biology instructor, told me. “One ranker will attract thousands of bankers. This is our modus operandi. We are in the business of selling dreams.” By Gupta’s definition, rankers are students with the potential to get into elite colleges, while bankers, who are in the majority, are students whose ambitions outrank their capacities. “A ranker was always going to get selected,” Gupta told me. “If he gets good teachers, his rank may improve, but he was already capable of selection. The business model of the coaching industry relies on the banker. We show him a dream — ‘You can also become an I.I.T.-ian or a doctor’ — even though we know all along that he would never be selected because there are just not enough seats.”

5. Noah Smith makes a very interesting observation about the link between depreciating real estate prices in Japan and the country's practice of constant tearing down and rebuilding of property once every 30 years or so.

Japan’s fervor for constant scrap-and-build construction is a major reason why rent there is so affordable, and why local politics haven’t halted dense development as they have in the West... Because Japanese people don’t use their houses as their nest eggs, as they do in much of the West, there is not nearly as much NIMBYism in Japan — people don’t fight tooth and nail to prevent any local development that they worry might reduce their property values, because their property values are going to zero anyway. As a result, Japanese cities like Tokyo have managed to build enough housing to make housing costs fall, even as people continued to stream from the countryside into the city... Even more amazingly, Japan managed all of this while increasing the size of the average person’s home...

When property tends to depreciate, it means that houses don’t cost as much to buy in the first place; that lower price frees up household cash that can be put into stocks and bonds. Basing wealth on productive assets instead of unproductive land is good for the economy — housing scarcity might pump up prices and build individual wealth for homeowners, but at the national level it simply holds back economic growth. And as it turns out, it’s good for middle-class wealth as well — in 2022, Japan’s median wealth per adult was about $120,000, compared to around $93,000 in the U.S. (And this is despite the fact that Japan’s once-legendary household savings rate has collapsed!) So Japan’s somewhat unusual choice not to tie middle-class wealth to housing prices seems like a smart one. Over the past two decades, the country has done better in terms of housing policy, construction, landscaping and urbanism than just about any country in the West. And it did this by embracing constant change rather than the physical stagnation that has prevailed in Western cities.
Noah's post is a brilliant takedown of a goodbye article by BBC's long-time Tokyo correspondent Rupert Wingfield Hayes who characterised Japan as a society resistant to change. 

6. The Big Mac Index appears to show that the Rupee is among the most undervalued currency.
7. The Economist profiles "scripted one-size-fits-all instruction" offered by NewGlobe in public schools in Nigeria's Edo state,
The government has provided tablets and training to more than 15,000 teachers. They in turn have given the new lessons to more than 300,000 children, most of them in primary schools. On any given day pupils throughout the state receive identical lessons, as dictated by the tablet... The scripts enforce instructional practices that are routine in many rich-country classrooms but often neglected in poor ones. These include techniques such as pausing frequently to pose questions to the class, instead of delivering long lectures at the blackboard, or encouraging pupils to try to solve a problem by chatting to the child sitting next to them. 

Detailed, prescriptive lesson plans are also supposed to relieve teachers of the burden of having to write their own... In Edo, tablets register when teachers arrive. They can tell if a teacher has scrolled through a lesson faster than appropriate, or if they have abandoned one halfway through. Beneath lies a low-tech foundation: a team of officials—about one for every ten schools—that observe lessons and coach teachers, helped by data from the tablets... In the past few years the approach has been applied in Gambia, Ghana, Nepal and Senegal. One programme in Kenyan government schools helped push up the number of children reaching the national standard in English by 30 percentage points... teachers sometimes bristle at the constraints that scripts impose... 

Sceptics often come round, she says, when they see kids making swift progress... other expensively trained professionals, such as pilots and surgeons, also have procedures that they must follow to the letter. After some initial complaints (similar to those expressed by dubious teachers) such regimented approaches have become widespread in those fields. They help reduce mistakes, and spread better ways of doing things.

For school systems stuck at very poor baseline instructional quality and low learning levels, scripted pedagogy of the kind that the likes of Bridge International Academies did offers promise. 

8. Livemint has a fascinating set of infographics comparing budgets over the years on a host of variables.

9. Vivek Kaul has an excellent set of graphics on the changing nature of India's banking sector. Three graphics stood out for me. The first is the stagnation in banking sector credit.
The lending of banks has remained around 50-53% of the GDP since March 2009 (with 2020-21 being an exception due to covid-19), and deposits have remained between 67-70%.

Second, in a reversal of their lending targets, banks now lend out more to individuals than businesses.

Finally, the variation across states in credit to deposit ratios - the ratio of total loans given out in the state to the deposits mobilised from the state.

The interesting story in the list is that of Bihar. The credit-deposit ratio of the state has increased from 0.32 to 0.45. Further, the credit-deposit ratio of India’s most populated state, Uttar Pradesh, has barely moved up from 0.44 to 0.45. Andhra Pradesh, Tamil Nadu and Telangana have a ratio of greater than 1, implying that banks need to import deposits from other states in order to meet their lending requirements in these states.

Wednesday, January 25, 2023

Trends on geographic concentration in global trade

One of the most important issues of concern today is the increasing concentration of global supply chain risks. Kaushik Basu raised the point about risks from vertically serrated industry in a recent oped,

In a standard oligopoly, as described by the nineteenth-century economist Augustin Cournot, a few firms produce the same good, but this is no longer the case. For example, cars had once been produced in their entirety by a single manufacturer. Today, however, many firms manufacture the different parts separately – one company makes the chassis, another the wheels, and so on – creating what I have called a vertically serrated industry. These intricate production processes have led to greater vulnerabilities. In a classic oligopoly, if a war or a pandemic broke out and 10% of manufacturers stopped producing cars, 10% fewer cars would be produced. Nowadays, however, if the world’s wheel manufacturers shut down, car production would fall by 100%. This is precisely what is happening today, as a chip shortage has disrupted the global car industry, leading to sharp price increases. A vertically serrated industry could also be weaponized. Governments could, for example, threaten to shut down production of a critical component, such as computer chips, knowing that this would bring global production to a halt. 

China's control over the supply of rare earth minerals is a case in point. Martin Wolf sums up the problems with global concentration,

Europe’s reliance on Russian gas has proved a paradigmatic case of a dangerous dependency. Lithium, rare earths, and graphite are extracted from three or fewer countries and mostly refined in China. The most sophisticated computer chips come from Taiwan.

The McKinsey Global Institute have an informative paper on the issue of trade concentration (pdf here). A few snippets.

1. Global trade concentration arises either from the presence of only a few global suppliers as a whole (global concentration) or due to some countries relying disproportionately on a handful of suppliers (economy-specific concentration). As an example, soybean trade belongs to the former group, with Brazil and US accounting for 90% of global traded supply. Wheat is an example of the latter since about 15 economies provide 90% of the global traded supply, though most countries buy wheat mainly from two or three countries among the 15. Taken together, in 40% of global trade in products (by value), the importing economy relies on three or fewer nations for the supply of a given product.

Analysis of all 128 economies for which 2021 data were available reveals that every economy sources at least 20 percent of imports (by value) from three or fewer partner economies, and at least 5 percent from two or fewer economies.
In general, agriculture and food products exhibit economy-specific concentration while minerals (especially iron, bauxite, nickel and rare earths) exhibit global concentration.
Global concentration is largely found in resources where natural endowments play a role and in some manufactured goods where a few countries have achieved a significant comparative advantage. 

2. This is a good description of the driver of concentration in manufacturing

In manufactured goods, two drivers of comparative advantage may historically have led to global concentration: reinforcing scale advantages that are difficult to replicate, and proprietary technology advantages. China established a significant comparative advantage in laptop production in part through lower factor costs and an enabling human capital, infrastructure, and policy environment. Over time, a local ecosystem of suppliers developed that may have enabled China to reinforce competitive advantages. Based on proprietary technology, Japan and South Korea established comparative advantages in many types of advanced machinery. They are the main global suppliers of the machinery used to manufacture flat panel displays, for example, representing almost 80 percent of globally traded supply.
In case of economy-specific concentration, the drivers are geography and transportation costs, consumer and business preferences, market structure, and preferential trading arrangements and barriers. 

3. While economic concentration is universal, larger economies appear to have lower levels of concentration, on average 50% lower concentration than smaller ones. 
4. But larger economies have higher concentration on specific goods.
5. This graphic about India's import concentration is very useful
India’s most concentrated sector is food and beverages, largely due to vegetable oils, which account for about 80 percent of its imports in this sector. India depends on imports to meet domestic demand and is the world’s largest importer of vegetable oils, with significant imports of palm oil, 90 percent of which is supplied by Indonesia and Malaysia, and sunflower oil, 75 percent of which came from Ukraine. This concentration fingerprint proved problematic after Indonesia banned palm oil exports and the war impeded Ukrainian sunflower oil exports... In 2021, India received about 80 percent of its supply of unworked diamonds from Belgium and the United Arab Emirates these two economies.

The impressive achievement over 2016-21 was the reduction in trade concentration in important sectors like electronics and food and beverages. In fact, the concentration has remained largely stable across the 14 sectors analysed. 

Monday, January 23, 2023

The need to broaden the base of Indian economy

I have long argued that despite its massive population, India's economic foundations are built on an extremely narrow base. This means that the country needs to focus on broadening its economic base across all dimensions, and in its absence the limits to economic growth will become apparent very soon. 

The digital economy, which has been the basis for a good part of the high growth enthusiasm about India, may not be as large as is being imagined. No matter how disruptive the technology, the net addressable market of customers who are meaningful enough consumers may be far smaller than is believed. This can expand only with broad-based economic growth. 

The latest data point concerns the plateauing of mobile data users in India. The Economist has a recent article,

All but a tiny proportion of Indian internet users get online using their phones. Yet the number of wireless broadband connections is flat. In October last year, the latest month for which figures are available, the telecoms regulator counted 790m wireless broadband connections, barely exceeding the previous peak of 789m, which was recorded in August 2021. Smartphone sales are down. After growing for a decade, sales peaked at 161m units in 2021, according to IDC, a market researcher, which reckons that last year the number fell to 148m. Meanwhile the average smartphone price has surged, from $163 before the pandemic to $220 in 2022... manufacturers no longer find it worth their while to sell ultra-cheap phones, says Navkendar Singh of IDC. The market share of smartphones costing less than $100 dropped from 30% in 2019 to 12% last year, according to Counterpoint, another research firm. Before the pandemic some 5m people traded up from a dumbphone to a smart one every month. That dipped last year to about 3m, says Shilpi Jain, an analyst with Counterpoint. Mobile subscriptions are getting dearer, too. In the year to June 2022, prices rose 28%. The number of converts, from dumb to smart, is expected to fall again this year.

A Business Standard oped had this to say

The sweet spot for people in the middle and lower end of the market to upgrade from an ordinary phone to a smartphone was Rs 8,000. Thanks to the chip shortage triggered by the pandemic and the resulting supply constraints, there are no smartphones available in that range. The average selling price is Rs 16,000-Rs 20,000, say analysts.

In other words, while the global average selling price for smartphones is above $300, the majority of Indian smartphone users can only afford one for $100. 

The stagnation and decline, even at the low baseline, points to a very limited market segment which can afford these devices and services. The flush of low prices to capture the market is over and telecoms providers (and smartphone makers) realise the need to improve profitability. And when prices rise, the price sensitive nature of Indian consumers become apparent and demand tanks quickly. The Ken has a nice graphic which captures the smartphones trend

These numbers are skewed by the fact that many users have multiple connections and smartphones, thereby making it difficult to identify the true number of consumers with smartphone connections. 

The Ken has another striking statistic on the number of wireless subscribers, including those on feature phones and those not subscribed to internet usage.

In its latest report, as of October last year, TRAI puts this number at 1,144 million users. In September, it was more or less the same. Go back to January. Still the same. If you go back one full year, to January 2021, this number was a bit higher, at 1,159 million users. But essentially, this has been flat. It seems like this is the natural limit... January 2017—1,151 million users... For half a decade, India has seen almost zero growth in its mobile phone users. So while India’s mobile internet users have stopped growing for the last year or so, there’s an even deeper trend—India’s mobile users stopped growing since much, much earlier. 

The article gets to the heart of the problem,
If India needs more mobile data users, it needs to raise income levels. Cheaper smartphones will help, but only to a point.

This is important since as another Ken article here points out the number of active internet users, the addressable market for internet customers, in India too may have become stagnant. The article describes these annual active customers (AAC), 

These are the users who have access to the internet through a smartphone, use mobile apps, have some disposable income, and have bought something online at least once a year. E-commerce. Shopping. Food Delivery. Rides. Subscriptions. This is the customer base of most Indian internet companies. These are the users who pay for stuff online... if you really stretch it, it’s about 70 million users (realistically, it’s closer to 40-50 million, but more on this later)... A great proxy is the number of postpaid mobile users in India, which is around 50 million, who form the bulk of this base... Essentially, if you want to make money online in India, you’ll need to take it from these 70 million users... (who) can be broken down into three categories... 

At the lowest level, with the broadest base, comprising roughly 40 million users. These users are the ones who have bought something online, but have done it very sparingly. Maybe once or twice last year, and they have done it because they heard that one gets a good deal online for a really important purchase, which is usually a mobile phone... Also, these users are extremely price-sensitive. You’ll find it hard to persuade them to pay even a delivery fee... At the middle level, comprising roughly 20 million users. These users may buy something online, but will venture outside online shopping very, very sparingly. Think of users like our moms and dads, who spend money online to get food from Zomato as a treat, or maybe take an Ola once a month if they are feeling particularly generous. College students also form a part of this. It’s a base that’s somewhat comfortable online, but can’t be relied on to spend regularly... At the highest level, comprising 10 million users... (they) buy nearly everything online—from products, to groceries, to food... may even have a Netflix subscription... are the elite user... 

This is the customer everyone desperately wants... They may be just 15% of the active transacting customer base, but according to one founder I spoke to, they account for nearly 40% of the money spent by this pyramid... In its recent pre-IPO report, Zomato, which is a food delivery service and had a strong use-case during a pandemic, reported an average monthly transacting user base of...10 million users. Netflix has about 3 million subscribers in India (and has started tapping out) CRED claims to have about 6 million. Amazon Prime has 6-7 million users... That’s the population of Sweden... Take China for instance, which has a per capita GDP of around $10,000. That’s five times of India. Alibaba, their largest online horizontal commerce platform, has an active transacting customer base of 800 million users. India has just a tenth of that, assuming the best case scenario.

India's internet businesses are primarily locked in a battle to grow at the intensive margin by differentiating and expanding their offerings to the 10 million consumers. At the extensive margin, it's more a long-haul to get the occasional consumers to spend more and expand the base itself. The 10 million market is enough to support several unicorns, but not large enough to support a $100 billion company. 

The last part of the limits of the digital economy comes from a third article in The Ken which shines light at the very narrow pool of high quality and experienced digital technology manpower. The article puts the number at 10,000. The article points to anecdotes of the extraordinary lengths startups go to attract and retain good quality engineers. Since the pool of good quality engineers is small and since everyone is fishing in the same pond, the salaries of these engineers rocket up also pulling up salaries of others too.

However, the number of engineers absorbed by the largest ten tech unicorns is very small.

In other words, ten largest startups with a combined valuation of $116 bn employ just 8871 engineers! This also points to another insight about the technology startup industry - it's limited role in addressing the country's employment crisis.
When it comes to the top 10 Indian startups, the average engineering strength per billion dollar valuation is 77. In other words, if a company wants to increase its valuation by a billion dollars, on average, it needs 77 more engineers.
This about Byju's (and Edtech) is interesting, 
Byjus, which has built its valuation on a series of acquisitions and does not necessarily depend on a tech moat, has the lowest ratio of engineers per billion in valuation—38. This partially explains why edtech companies are able to suck up funding like crazy. They need tech to a certain point, but beyond that they don’t need engineers to scale.
In any case, the point to be made is the small size or base of India's consumer class, digitally addressable market, and skilled engineering work-force. This is far smaller than widely believed. 

Saturday, January 21, 2023

Weekend reading links

1. The Economist points to a quiet energy transformation happening in the North Sea region involving large wind farms, hydrogen storage banks, CO2 capture and storage, and LNG terminals.

In 2022 North Sea countries auctioned off 25 gigawatts (GW) in wind-power capacity, making it the busiest year by far. Nearly 30 GW-worth of tenders have already been scheduled for the next three years... At a meeting in Esbjerg in May the European Commission and four North Sea countries agreed to install 150 GW by 2050, five times Europe’s and three times the world’s current total. In September this group and another five countries raised the number to 260 GW, equivalent to 24,000 of today’s largest turbines. This ambition is made possible by wind’s version of Moore’s law, which described the exponential rise in computing power. Three decades ago the world’s first offshore wind farm—Vindeby in Denmark, comprising 11 turbines—had a total capacity of five MW. Today a single turbine can generate 14 MW, and one farm may contain more than 100 of them. More robust cables and transformers at sea to convert wind power from alternating into direct current, which can travel over long distances without big losses, enable more electricity to be generated farther away... Economies of scale are driving down costs, making offshore wind competitive with other sources of power. In July Britain awarded contracts to five projects, including Dogger Bank, at a price of £37 ($44) per megawatt-hour—less than a sixth of the British wholesale electricity price in December...

With average wind speeds of ten metres per second, the North Sea basin is one of the gustiest in the world... The North Sea floor is mostly soft, which makes it easier to fix turbines to the seabed (the floating kind have yet to be deployed at scale anywhere in the world). It is also typically no more than 90 metres deep, which allows wind farms to be placed farther away from the coast, where winds are more consistent... offshore turbines work at up to 60% of capacity, compared with the 30-40% that is typical onshore.

2. As Union Budget nears, The Ken has an article on India's complex capital gains taxation system.  

Capital gains vary across asset categories based on tenure of holding, indexation, exemptions, and tax rates. 

3. Fascinating profile of Robert Habeck, the former leader of German Greens and the current Economy Minister. Amidst the Russian invasion of Ukraine and related supply disruptions, Habeck has had to preside over several decisions that Greens strongly oppose. They include the establishment of Germany's first LNG terminals; reopening of some closed coal power stations; deal with RWE allowing it to bulldoze Lutzerath, an abandoned Rhineland village, to make way for an opencast coal mine so that it could operationalise two thermal plants; allow Germany's three remaining nuclear plants stay operational till April 2023; and reversal of German position to not send troops abroad. 

Habeck's pragmatism runs the risk of diluting the Greens' ideological strength. 

4. Ruchir Sharma on Xi Jinping's apparent reversal,
Aiming to revive the economy after the congress, Xi’s government started sounding less Maoist. It has dropped the “three red lines” on borrowing by developers, and announced that the “rectification” campaign against fintech firms is nearly complete. After tightening state control for years, it is sending out messages of support to the private sector, even offering details of its new global data market that suggest respect for private data ownership... within weeks, Xi’s government has reversed its efforts to control Covid-19, Big Tech companies, the property market and more. It has shown signs of reduced support for Russia’s war in Ukraine while easing tensions with the US and in its territorial disputes in the South China Sea.
... a transformation of Singapore that is becoming a proxy for the way in which one segment of China is dealing with geopolitical tension and decoupling. Chinese individuals, their families, their companies and their advisers, according to a wide range of bankers, lawyers, accountants, investors interviewed by the Financial Times, now see Singapore as the vessel that can navigate them through a series of expected storms. At the same time, they add, it is becoming an increasingly vital place for outposts of Wall Street and the global financial industry to interact with them. For many years, Singapore has liked to sell itself as the Switzerland of Asia. The new cold war, says one former top official, is finally turning that pitch into a reality. The big question, though, is how far Singapore will tolerate being Switzerland with Chinese characteristics...
The change on the ground in Singapore is palpable. Property deals by mainland buyers are the dominant transaction, the international schools are bursting at the seams, with hundreds of Chinese applicants for a vanishingly small number of places. Chinese Michelin-starred restaurants might — just — be able to find diners an available dinner booking next April. Singapore’s status as an Asian financial hub has been doubly enhanced by the Chinese influx. The number of Chinese family funds in Singapore has soared from a handful a few years ago to an estimated 600 today. At the same time, some 500 Chinese businesses have registered in the city in the past year, preparing to use their Singapore-based status to venture more boldly into India and other jurisdictions where they face obstacles... he cost of living has soared in Singapore, angering locals who see danger and division in the soaring rents, the bursting schools and the growing number of Rolls-Royces. Meanwhile, the inflow of so much capital so quickly also exposes Singapore to the potential for bad actors using it as a spot to hide money... Roughly three-quarters of Singapore’s 3.5mn citizens are ethnically Chinese, making it culturally an easy fit for the newest arrivals.

The biggest loser in this transformation, Hong Kong.

6. Good article in The Economist examining the reasons behind the slowdown or reversal of globalisation and rise of protectionism. 

In a speech in September America’s national security adviser, Jake Sullivan, spelled out the basic tenets of this beggar-thy-neighbour approach. Merely retaining a technological lead over China and other rivals was no longer enough, he argued. Instead, he said, America had to pursue “as large of a lead as possible” in chipmaking, quantum computing, artificial intelligence, biotechnology and clean energy... Mr Sullivan described two main ways to ensure American supremacy: using subsidies and other forms of industrial policy to shift supply chains away from geopolitical rivals, and stricter investment screening and export controls to keep advanced technology out of unfriendly hands. As America, once the world’s loudest advocate of free trade and open economies, adopts and reinforces such policies, other countries are mimicking its approach. The result is a proliferation of obstacles to international trade and investment at a time when both were already stagnating.
7. The fascinating story behind the origin of European foods,
... trdelnik is no local snack at all. Nobody in Prague recalls seeing this supposed Czech staple for sale until about a decade ago. Even today, trdelnik scent blankets the touristy bits of Prague like a smog, but is hard to find anywhere else. Food sleuths place trdelnik as a delicacy from Romania or Slovakia... Take ciabatta. Italy’s now-ubiquitous bread is paraded as a timeless Italian classic, perhaps once baked in the earthen ovens of ancient Rome. In fact the elongated loaf was devised in 1982 by Italian bakers trying to fend off the French baguette. Belgian beers top global league tables, known for their alcohol content, which can exceed that of wine. Is that distinctive feature the outcome of brewing traditions devised by the various monks and friars featured on the beers’ labels? Pish. The strength of low-country beer is a modern regulatory dodge. In 1919 Belgian taverns were banned from selling spirits, a prohibition that lasted until 1983. Drunks in search of an efficient tipple nudged breweries towards making dubbel-strength beers. Tripels followed soon enough.

The dairy lobby is a keen fabricator of heritage. It is largely down to Big Cheese’s Swiss arm, the Schweizerische Käseunion, that fondue has emerged as Switzerland’s national dish. Facing a glut of Gruyère and Emmentaler in the 1930s as exports melted, cheese-peddlers proclaimed the Alpine virtues of a dish consisting overwhelmingly of cheese. British farm labourers of yesteryear were unfussy about their mid-day meals. Nevertheless in the 1960s the Milk Marketing Board revived the idea of a cheese-laden Ploughman’s Lunch, now a pub staple. As skimmed milk gained popularity in Ireland in the 1970s, a new way to use surplus cream was needed. Thus Bailey’s Irish Cream (a sickly mix of whiskey, cream and cocoa extract) was born. An Irish meadow on its label suggests centuries of heritage; in fact it is younger than Liam Gallagher.

Governments trying to nudge the populace towards new foods are nothing new. The potato went from South American curio to European favourite thanks in part to 18th-century French efforts to diversify away from wheat. Antoine-Augustin Parmentier, its keenest promoter, stationed armed guards around a potato patch to make it seem valuable and removed them at night so that peasants would steal and plant the tubers. Polish authorities in the 1940s started peddling carp—a bottom-feeding fish that tastes like muddy pond—in the absence of more flavourful fish. “A carp on every Christmas table” was advised; the fish (previously mostly a Jewish delicacy) was handed out to workers as festive bonuses. It has endured as a holiday staple. An even more ambitious fish-peddling scheme was later devised by Norway. In the 1980s supply of salmon exceeded domestic demand. Japan seemed an obvious market, but only tuna and sea bream were considered acceptable to eat as sushi and sashimi: at the time, the Japanese were as likely to eat raw salmon as an Italian to dip his spaghetti in mayonnaise. One marketing blitz (and a few discounted consignments of Norwegian salmon) later, a new tradition of orange sushi was born.

8. Sweden discovers rare earth deposits of more than 1 million tonnes. 

9. A new paper by Alexander Dyck, Adair Morse and Luigi Zingales has found that corporate fraud in the US is more pervasive than thought, with only one-third actually being detected. 

We estimate that on average 10% of large publicly traded firms are committing securities fraud every year, with a 95% confidence interval of 7%-14%. Combining fraud pervasiveness with existing estimates of the costs of detected and undetected fraud, we estimate that corporate fraud destroys 1.6% of equity value each year, equal to $830 billion in 2021... We find that two out of three corporate frauds go undetected, implying that, pre Sox, 41% of large public firms were misreporting their financial accounts in a material way and 10% of the firms were committing securities fraud, imposing an annual cost of $254 billion on investors.

See also this

10. MGI graphic informs that only 59-72 tomatoes grown in developed countries reach the retailer. 

In fact, 19-27 are lost/left in the field at harvest itself. 

11. On the issue central bank's role in climate change policy making, Jerome Powell feels they should stick to their knitting,
Today, some analysts ask whether incorporating into bank supervision the perceived risks associated with climate change is appropriate, wise, and consistent with our existing mandates. Addressing climate change seems likely to require policies that would have significant distributional and other effects on companies, industries, regions, and nations. Decisions about policies to directly address climate change should be made by the elected branches of government and thus reflect the public’s will as expressed through elections. 

At the same time, in my view, the Fed does have narrow, but important, responsibilities regarding climate-related financial risks. These responsibilities are tightly linked to our responsibilities for bank supervision. The public reasonably expects supervisors to require that banks understand, and appropriately manage, their material risks, including the financial risks of climate change. But without explicit congressional legislation, it would be inappropriate for us to use our monetary policy or supervisory tools to promote a greener economy or to achieve other climate-based goals. We are not, and will not be, a “climate policymaker.”

12. Finally, Martin Wolf points to a new McKinsey report on global flows

Thursday, January 19, 2023

Incidence of indirect taxes illustrated

Econ 101 informs that indirect tax incidence is higher on the poor and therefore are regressive and encourages a greater share of national tax revenues come from direct taxes. However, in countries like India revenues from indirect taxes are almost equal to that from direct taxes (in 2021-22, direct tax to GDP ratio was 6.1%, compared to 5.6% for indirect taxes). 

A new Oxfam report has a hugely informative table on what proportion of indirect taxes is contributed by different income categories.

As a corollary, the share of income spent on indirect taxes is orders of magnitude higher for the bottom half compared to the top decile. 

The report also points to high levels of wealth inequality in India

By 2020, the income share of bottom 50% was estimated to have fallen to only 13 per cent of the national income and have less than 3 per cent of the total wealth... This is in stark contrast to the top 30 per cent who own more than 90 per cent of the total wealth. Among them, the top 10 per cent own more than 80 per cent of the concentrated wealth. The wealthiest 10 per cent own more than 72 per cent of the total wealth, the top 5 per cent own nearly 62 per cent of the total wealth, and the top 1 per cent own nearly 40.6 per cent of the total wealth in India.

Monday, January 16, 2023

Land value capture and metro railways

I have blogged earlier (here and here) on the application of land value capture instruments to mobilise tax revenues. 

The central point is that public investments like metro railways increase land values, which being an unearned increment for the land owner, should be partially captured by the government and used to finance the investment itself. 

An excellent new working paper (abstract here) presented at the annual American Economic Association Conference by Maureen Cropper and Palak Suri examined the impact on land prices of the first subway line in Mumbai (the 11.4 km Metro Line 1) which became operational in June 2014. Their findings on its impact is striking

To estimate the effect of Line 1 on property prices we use administrative data on assessed prices in 725 sub-zones of Mumbai from 2011-18 for residential, commercial, and industrial land use categories. Using difference-in-differences in an event study framework, we compare areas that are within 1 km of Line 1 with control areas between 1 and 3 km from Line 1 before and after Line 1 opened. We find that up to two years prior to the opening of Line 1, the change in property prices in areas within 1 km of Line 1 was about 5-6% higher than the change in areas between 1 and 3 km from Line 1, reflecting anticipatory effects of the policy. After 2014, prices for residential and commercial properties within 1 km of the Metro increased between 17% and 13% compared to the control group... The magnitude of increase in prices goes down as the size of control group is expanded to include regions beyond 3 km, reflecting changes in other parts of the city. The increase in residential, commercial office, and open land- use prices was greater than the increase in industrial and commercial shop prices.  

They also examine the contributors to this increase in land values,
To study the factors affecting residential prices, we estimate hedonic price regressions using data on 3,000 houses in a 2019 World Bank survey. Log price depends on distance from the nearest rail station and on an employment accessibility index, in addition to housing and other neighborhood characteristics. Employment accessibility is measured using a commute-time- weighted average of wages obtainable across the city, estimated using a gravity equation. A house that is 1 km closer to a rail station sells for 5.6% more than an other wise identical house. A one standard deviation increase in employment accessibility raises house price by 4%. We also compute the employment accessibility index for 2004, using a 2004 World Bank survey to study the changes in sub- zone level employment accessibility. The employment accessibility index within 1 km of Line 1 increased faster over this period than in other parts of Mumbai. Improvements in employment accessibility and access to rail stations are plausible channels underlying the observed capitalization effects.

They even make an assessment of the aggregate increase in property values just due to this one investment,

How large are the increases in property values within 1 km of Line 1 and how do they compare with the aggregate benefits due to commute time savings? Lacking precise data on floor space within 1 km of Line 1, we conservatively approximate the increase in property values after the opening of Line 1 to be $20 billion (PPP). Annualizing this over 30 years using a 10% interest rate yields a value of $2 billion (PPP). This is approximately twice as large as Suri’s $1 billion (PPP) estimate of the value of travel time savings, highlighting the need for a more comprehensive framework to study the benefits of infrastructure projects.

The paper referred above examined the impact of commute time savings due to Metro Line 1 finds,

I value travel time savings due to: (i) Line 1 (11.4 km), operational since 2014, and (ii) three upcoming lines (92 km), scheduled to open during 2021-22. The value of short-term benefits for an average beneficiary under either project is Rs. 71-99 per month (9-14% of the average out-of-pocket cost). The medium-term benefits are over twice the short-term benefits for Line 1, and 6-7 times the short-term benefits for the upcoming lines. Women, college educated workers, and high-income households receive greater benefits...

The average medium-term values are an order of magnitude higher, valued at Rs. 189 and Rs 618 for Line 1 and Lines 2, 3 and 7, respectively. This is about 2-6% of the average monthly rental price. In the short-term 19% of commuters have a positive willingness to pay for Line 1, while 51% of commuters have a positive willingness to pay for Lines 2, 3 and 7. In the medium-term, virtually every household experiences positive benefits. Therefore, in terms of aggregate benefits, the implied annual medium-term benefits for Line 1 (Lines 2, 3 and 7) are 5-10 times (10 times) the short-term benefits.

Both are excellent papers, rare ones with immediate public policy relevance. The first paper brings hard evidence in quantitative terms from a very salient Indian example. Land value capture is gradually becoming accepted as an important means of municipal finance in India, as is seen from this policy framework. But its widespread adoption remains a step away. Such papers can be very useful in the internalisation of the idea among important policy makers and expediting the adoption of land value capture policy instruments. 

This goes to the heart of an important insight to increase municipal finance, one which has been a constant in this blog. Instead of scatter shot trying several approaches and struggling in everything, the focus should be just two-fold - increase property tax revenues and collections (shift from the opaque rental value to capital value based property taxation system, and target a gradual increase in PT as a share of GDP); and tap the full potential of all LVC instruments. To this one can add the idea of fixing a basic FAR with property right and having the rest purchased. 

Saturday, January 14, 2023

Weekend reading links

We find immigrants represent 16 percent of all US inventors, but produced 23 percent of total innovation output, as measured by number of patents, patent citations, and the economic value of these patents. Immigrant inventors are more likely to rely on foreign technologies, to collaborate with foreign inventors, and to be cited in foreign markets, thus contributing to the importation and diffusion of ideas across borders. Using an identification strategy that exploits premature inventor deaths, we find that immigrant inventors create especially strong positive externalities on the innovation production of their collaborators, while natives have a much weaker impact. A simple decomposition illustrates that immigrants are responsible for 36% of aggregate innovation, two-thirds of which is due to their innovation externalities on their native-born collaborators.

2. Latest status on world nuclear forces (HT: Adam Tooze)

This on India's nuclear force

Finland... with a population of 5.5 million and a GDP roughly equal to the state of Oregon experienced what looked like a high tech-led productivity revolution. Real GDP per capita in local currency terms rose 55 percent from 1995 to 2007—nearly double the US increase... but from 2008 to 2019 real Finnish per capita income declined... large part is due to Finland having many of its growth eggs in a single basket: Nokia. Nokia’s handsets and related telephony equipment accounted for 20 percent of Finnish exports at peak, driving Finland’s current account surplus to nearly 7 percent of GDP. When the Apple iPhone launched in 2007, Nokia’s handset market collapsed, exports fell by half, Finland’s current account swung into deficit, and a decade plus of economic stagnation began.

This Nokia Risk is raised in an article by Herman Schwartz, who says there are other countries facing this risk,

A larger group of seven countries—all of them relatively small, rich, and with stable governments—are similarly exposed. In Denmark, Israel, South Korea, Sweden, Switzerland, and Taiwan a handful of firms account for a hugely disproportionate share of both profits and R&D spending. The firms which dominate these seven economies have all been extraordinarily successful in the knowledge economy of the past three decades... For the decade of 2011–2020, these firms have had large shares of cumulative profits both domestically and abroad. It is largely thanks to these profits that these small countries have such a significant share of global profit (larger than their share of global GDP) and, in turn, a relatively high per capita income.

The economic and political risks borne by the companies in these countries are captured in the table.

4. Kanika Datta writes about Indian billionaires and their companies,
Of the Big Two Indians at the top end of the rich list only one of them can boast a Global Fortune 500 ranking — Mukesh Ambani’s Reliance Industries — which is based on the hard fact of revenues rather than the ephemerals of market sentiment... Reliance remains outside the top 100 with a rank of 104... Among the Indian private sector companies on the Global 500 list are Tata Motors (370th), Tata Steel (435th) and Rajesh Exports (437th)... there are some 145 Chinese corporations in the Fortune 500 to India’s nine (four of them in the private sector). Though Chinese businesspeople do not feature as high on the global rich lists as Indians do, more of them run corporations that have a global arc...

Despite India’s reputation as an IT powerhouse, it is the Chinese technology companies that can claim durable global leadership. The four Indian IT majors mostly predate the Chinese tech giants by a decade or more — Infosys in 1981, TCS 1968, Wipro’s IT services division in 1980 and HCL in 1991. The oldest of the Fortune 500 Chinese tech majors is Hon Hai, started in 1974. But Huawei was founded in 1987, Alibaba in 1999 and Tencent in 1998.

5. R Gopalakrishnan on corporate governance issues in India's private sector

Two major banes found among many Indian corporate groups are (i) too many subsidiaries, accompanied by (ii) related-party transactions.

6.  FT points to the story of an abandoned German village of Lutzerath in the country's industrial Rhineland, which has become the ground zero for protests against coal mining and a stern test for the German coalition government which includes the Greens. The energy giant RWE plans to raze the settlement and dig up lignite underneath. Lutzi has both wind turbines and coal-fired power plants, thereby exposing the difficulties and contradictions with a Green climate policy. 

RWE has been given permission to mine coal as part of an agreement brokered by the German government to keep two lignite-fired power plants running longer than planned to compensate for the sudden loss of Russian gas after Gazprom slashed supplies. 

7. The appreciation of US dollar in the current US rate hike cycle has been the highest in over 40 years, thereby imposing steep debt service costs on dollar debts.

The steep and rapid rate hikes in the US have led to a 17 percentage points rise in spreads on sovereign borrowing in foreign currencies of commodity importing countries with weak credit ratings in 2022, thereby shutting them out of markets. 
8. FT has an article which discusses whether China is undertaking a reset on its economic, domestic, and foreign policies to win back friends and shed its recent belligerent and insular image. 
As it seeks to repair ties with European powers, Beijing is insisting that its European counterparts agree to repeat a “no decoupling” mantra — marking a clear difference with Washington, which is seeking to limit US commercial ties with China in certain areas, particularly with regard to sensitive technologies. “China has realised that it has antagonised too many countries at the same time, particularly among developed countries which still today are its main trade and economic partners,” says Jean-Pierre Cabestan, a China expert at Hong Kong Baptist University. “So it is trying very hard to reach out to the EU and key European nations — Germany, France, Italy and Spain — as well as America’s Asian allies, such as Japan and South Korea and US partners such as Vietnam.”

It's the relations with Europe that China appears most intent to reset, 

China’s desire for a diplomatic reset with Europe appears to be yielding significant results. Visits to Beijing in November by Olaf Scholz, the German chancellor, and Charles Michel, president of the European Council, are set to be followed early this year by French president Emmanuel Macron and Italian prime minister Giorgia Meloni. Macron is expected to follow Scholz in voicing opposition to “decoupling” from China, thereby ceding to Beijing some ground in its long-running strategy to sow division between European powers and the US. Although he has also talked about reducing dependency on China, Scholz made clear during this visit that Berlin not only rejects “decoupling” but also sees China as an “important economic and commercial partner”. “Macron, like Scholz, is opposed to decoupling. He is still promoting engagement,” says Cabestan. “China will try to utilise Macron’s strategic autonomy ambitions to drive a wedge between Europe and America.”

See also Mihir Sharma here

9. Is Germany at the vanguard of the anti-trust movement?

Regulators in Germany argue that Section 19a of the German Competition Act is years ahead of the EU’s landmark piece of antitrust legislation, the Digital Markets Act, and with the potential to capture even more illegal conduct by being less prescriptive on what constitutes anti-competitive behaviour. The Section 19a law, which came into force in January 2021, places Berlin at the vanguard of Europe’s attempts to clamp down on the power of big tech, where the US and EU have so far failed or are still running behind. Like the DMA, the law gives antitrust authorities in Germany powers to go after so-called gatekeepers such as Meta, Google and Amazon — including the ability to impose sanctions like forced divestments against companies and the possibility to break them up. But while EU regulators are only now working out the details on how the DMA, which became law in November, will be implemented, Berlin has both designated who the gatekeepers are and is already pursuing them. 

The rules in Brussels are prescriptive and give a list of specific actions that are illegal, including a ban on platforms ranking their own services ahead of rivals. Section 19a does all this but also prohibits conduct in areas where platforms are not yet dominant and leaves the door open to tackling future anti-competitive behaviour that has not yet been identified. If companies are ruled to be of “paramount significance for competition across markets”, then the regulator can prohibit them from ranking their own services ahead of rivals, from denying rivals access to data, and from preventing users from taking their own data to other competing services. Since Section 19a came into effect, Germany’s antitrust watchdog has opened high-profile investigations against the world’s largest tech companies. The Federal Cartel Office’s investigation into whether Facebook grants an unfair advantage to users of its social network platforms on its VR glasses has already brought benefits to consumers, even as it continues. The German watchdog has ensured users can use the headsets without a Facebook or Instagram account. It is also investigating Google Maps over potential anti-competitive restrictions to the detriment of rivals and opened two separate probes into Amazon’s marketplace practices over concerns that the platform is disadvantaging the position of third-party sellers.

10. Livemint has a good infographic which highlights the growth of EV industry in India

The extent of government regulatory engagement in the last couple of years is very impressive. It's a very good example of facilitating market growth through enabling policies. 

While four-wheelers are where the action today globally is on the EV industry, it's likely to shift more towards two and three-wheelers in the years ahead. 
And it's here that Indian companies are well-placed to assume leadership. Will Ather Energy, for example, emerge as the new Hero Motors?

11. Good set of graphics in Livemint comparing Swiggy and Zomato the duopoly that controls the country's online food delivery market. 

12. What does it say about the startup company when some its investors, also globally reputed VCs with some of the biggest risk appetites, are looking for exit, even at steep valuation discounts, and that too in a sector which is considered one of the most promising and that too in one of the world's largest markets? 

More on Byju's and some of its investors here

Exports of garments and textiles exceeded a record $45bn in the 12 months to end of June 2022, more than 85 per cent of total export earnings.

The article is a very good read, pointing to the animosity between President Sheikh Hasina and the founder of Grameen Bank, Mohammed Yunus.