One of the most important issues of concern today is the increasing concentration of global supply chain risks. Kaushik Basu raised the point about risks from vertically serrated industry in a recent oped,
In a standard oligopoly, as described by the nineteenth-century economist Augustin Cournot, a few firms produce the same good, but this is no longer the case. For example, cars had once been produced in their entirety by a single manufacturer. Today, however, many firms manufacture the different parts separately – one company makes the chassis, another the wheels, and so on – creating what I have called a vertically serrated industry. These intricate production processes have led to greater vulnerabilities. In a classic oligopoly, if a war or a pandemic broke out and 10% of manufacturers stopped producing cars, 10% fewer cars would be produced. Nowadays, however, if the world’s wheel manufacturers shut down, car production would fall by 100%. This is precisely what is happening today, as a chip shortage has disrupted the global car industry, leading to sharp price increases. A vertically serrated industry could also be weaponized. Governments could, for example, threaten to shut down production of a critical component, such as computer chips, knowing that this would bring global production to a halt.
China's control over the supply of rare earth minerals is a case in point. Martin Wolf sums up the problems with global concentration,
Europe’s reliance on Russian gas has proved a paradigmatic case of a dangerous dependency. Lithium, rare earths, and graphite are extracted from three or fewer countries and mostly refined in China. The most sophisticated computer chips come from Taiwan.
The McKinsey Global Institute have an informative paper on the issue of trade concentration (pdf here). A few snippets.
1. Global trade concentration arises either from the presence of only a few global suppliers as a whole (global concentration) or due to some countries relying disproportionately on a handful of suppliers (economy-specific concentration). As an example, soybean trade belongs to the former group, with Brazil and US accounting for 90% of global traded supply. Wheat is an example of the latter since about 15 economies provide 90% of the global traded supply, though most countries buy wheat mainly from two or three countries among the 15. Taken together, in 40% of global trade in products (by value), the importing economy relies on three or fewer nations for the supply of a given product.
Analysis of all 128 economies for which 2021 data were available reveals that every economy sources at least 20 percent of imports (by value) from three or fewer partner economies, and at least 5 percent from two or fewer economies.


Global concentration is largely found in resources where natural endowments play a role and in some manufactured goods where a few countries have achieved a significant comparative advantage.
2. This is a good description of the driver of concentration in manufacturing
In manufactured goods, two drivers of comparative advantage may historically have led to global concentration: reinforcing scale advantages that are difficult to replicate, and proprietary technology advantages. China established a significant comparative advantage in laptop production in part through lower factor costs and an enabling human capital, infrastructure, and policy environment. Over time, a local ecosystem of suppliers developed that may have enabled China to reinforce competitive advantages. Based on proprietary technology, Japan and South Korea established comparative advantages in many types of advanced machinery. They are the main global suppliers of the machinery used to manufacture flat panel displays, for example, representing almost 80 percent of globally traded supply.


India’s most concentrated sector is food and beverages, largely due to vegetable oils, which account for about 80 percent of its imports in this sector. India depends on imports to meet domestic demand and is the world’s largest importer of vegetable oils, with significant imports of palm oil, 90 percent of which is supplied by Indonesia and Malaysia, and sunflower oil, 75 percent of which came from Ukraine. This concentration fingerprint proved problematic after Indonesia banned palm oil exports and the war impeded Ukrainian sunflower oil exports... In 2021, India received about 80 percent of its supply of unworked diamonds from Belgium and the United Arab Emirates these two economies.
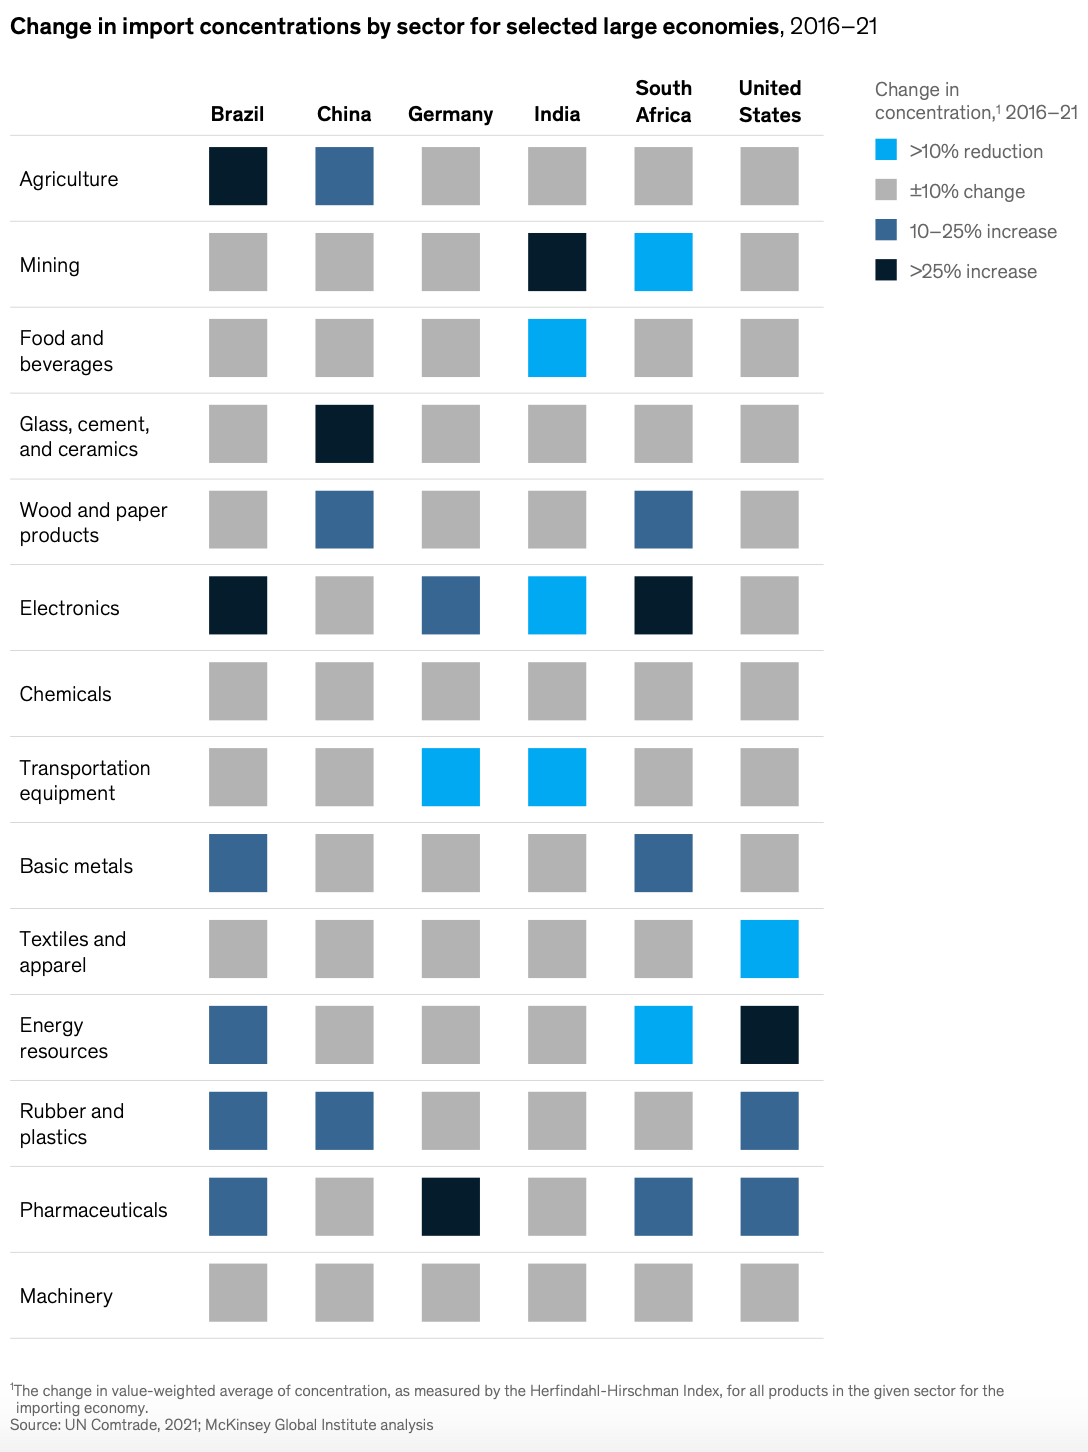
The impressive achievement over 2016-21 was the reduction in trade concentration in important sectors like electronics and food and beverages. In fact, the concentration has remained largely stable across the 14 sectors analysed.
No comments:
Post a Comment