1. New Zealand bans cigarette smoking,
New Zealand unveiled a plan on Thursday to eventually ban all sales of cigarettes in the country, a decades-long effort unique in the world to prevent young people from taking up smoking. The proposed legislation, which is expected to become law next year, would leave current smokers free to continue buying cigarettes. But it would gradually raise the smoking age, year by year, until it covers the entire population. Starting in 2023, anyone under age 15 would be barred for life from buying cigarettes. So, for instance, in 2050 people 42 and older would still be able to buy tobacco products — but anyone younger would not.
The calibrated and long-drawn nature of the policy is interesting.
2. Like in many areas, European Commission has taken the lead in greater regulation of technology platforms by unveiling draft rules that, if implemented, would require "companies like Uber to consider their drivers and couriers as employees entitled to a minimum wage and legal protections."
The new labor rules follow a landmark case in February, when Britain’s top court ruled that Uber drivers should be classified as workers entitled to a minimum wage and holiday pay. In the Netherlands, a court ruled in September that Uber drivers should be paid under collective rules in place for taxi drivers... The new European rules would require companies to disclose more about how their software systems made decisions affecting workers. For those who may remain independent, the new rules would also require companies to grant more autonomy that self-employment entails... Spain offers a preview of the potential effects of the E.U. proposal. The country’s so-called Riders Law, enacted in August, required food delivery services such as Uber and Deliveroo to reclassify workers as employees, covering an estimated 30,000 workers.
3. Nice listing of behavioural biases.
4. A sub-plot to the global supply chain disruptions induced shortages,
Medical device manufacturers have this year spent an estimated $6.4 billion on computer chips, according to Gartner, a research firm. The automotive industry has spent $49 billion. Makers of wireless communications gadgets like cellphones and tablets have purchased nearly $170 billion worth of chips — more than 26 times as much as medical device manufacturers, according to Gartner. The shortages are assailing every industry. But much as airlines prioritize their most frequent fliers in the face of a flight-canceling blizzard, chip makers are in many cases favoring their largest customers, expert say.
This on what caused the disruptions,
The shortages are in large part the result of botched efforts to anticipate the economic impact of the pandemic. As Covid-19 emerged from China in early 2020, it sowed fears of a global recession that would destroy demand for a vast range of products. That prompted major buyers of chips — especially automakers — to slash their orders. In response, semiconductor plants reduced their production. That proved a colossal mistake. The pandemic shut down restaurants, movie theaters and hotels, while slashing demand for cars. But lockdowns imposed to choke off the virus increased demand for an array of products that use chips, like desktop monitors and printers for newly outfitted home offices. By the time global industry figured out that demand for chips was surging, it was too late. Adding chip-making capacity requires as much as two years of lead time and billions of dollars.
This about the transmission of disruptions in one part of the supply chain throughout the entire chain,
Once a company like ResMed gains regulatory clearance to use a supplier, it cannot simply seek out a new one that might have a ready stock of chips without first going through a time-consuming approval process. That meant that ResMed had to figure out how to squeeze more chips out of its existing supply chain... Faced with the prospect of getting shut out, Mr. Farrell rooted through his supply chain, identifying the suppliers of his suppliers, in the hopes of persuading them to prioritize ResMed’s factories. Mr. Farrell soon realized that a primary reason that his chip supplier could not meet his demand was that — five levels up the chain — a Taiwanese manufacturer of silicon wafers had exhausted its inventory.
Because that plant could not deliver extra products, the next link in the chain — a company that combines wafers and circuitry — could not produce more of its components. That meant that another company that buys those components and packages them into clusters was unable to make more of them. And that meant that ResMed’s supplier of circuit boards could not buy enough of those clusters, leaving ResMed’s factories in Singapore, Sydney and Atlanta short of circuit boards.
See also this excellent FT series on supply chains in times of Covid 19.
5. By Beata Javorcik, Chief Economist at EBRD, in the FT on the possibility of shifts in the prevailing ideology on supply chain management,
The quest to find the most cost-effective suppliers has left many companies without a plan B. More than half of firms surveyed by the Shanghai Japanese Commerce and Industry Club reported their supply chains were affected by the outbreak. Less than a quarter said they had alternative production or procurement plans in case of a prolonged disruption... Businesses will be forced to rethink their global value chains. These chains were shaped to maximise efficiency and profits. And while just-in-time manufacturing may be the optimal way of producing a highly complex item such as a car, the disadvantages of a system that requires all of its elements to work like clockwork have now been exposed... Resilience will become the new buzzword. Firms will think harder about diversifying their supplier base to hedge against disruptions to a particular producer, geographic region or changes in trade policy. This means building in redundancy and perhaps even moving away from the practice of holding near-zero inventories. Costs will certainly rise but, in the post-Covid world, concerns about supply chain fragility will come right after those over cost. Firms will be expected to assess resilience of their second and third-tier suppliers, too. We may see some reshoring as automation reduces labour costs.
6. John Thornhill argues that the mathematics of animal populations may have important insights for the prospects of digital networks. He points to the work of Andrew Chen, a partner at the VC firm Andreessen Horowitz who claims that the Metcalfe's Law, which states that the systemic value of communicating devices/nodes grows as a square of their number, is misleading.
To take two obvious objections: no two networks are the same, and the value of individual connections varies... In Chen’s view, it may be more useful to study the mathematics of animal populations, including meerkats, sardines, bees and penguins, to understand the life cycles of networks. His insights largely derive from the work of Warder Clyde Allee, a pioneering ecologist from the 1930s who devised the “Allee threshold” to explain the growth and contraction of social animal populations. For example, when mobs of meerkats are too small then they are easily picked off by predators because there are not enough lookouts to scan the skies for raptors. When they pass the “Allee threshold” they multiply and thrive. But when they grow too populous they eat too many bugs and fruits and deplete their surrounding environment. “Allee’s population curves describe a sort of ecological version of the network effect,” writes Chen.
Look at Uber, for example. Although it would appear to be one global network benefiting from vast economies of scale, it is more accurately understood as a network of networks. As Chen describes in his book, Uber’s war room in San Francisco focused on hyperlocal competition in each and every one of its locations, figuring out ways to outsmart rival taxi firms and exploit regulatory loopholes. But now that Uber has achieved critical mass in most of its markets and is nudging up prices to recoup its massive investments, it is in danger of overeating bugs and fruits. “They are focusing on efficiency and profitability. But if you are a city-by-city network you can be picked off by competitors,” says Chen, pointing to the threat from hungrier food delivery rivals, such as DoorDash and Gopuff.
7. Good table of anti-trust cases globally filed against big technology companies here.
8. Since over two decades, the central government has set aside 5% of its receipts from telecommunications sector to a Universal Service Obligation (USO) fund to bridge market failures in the sector. The fund collection till date exceeds Rs 1 trillion. However, its utilisation remains poor, with nearly Rs 60,000 Cr of un-utilised amount.
The Comptroller and Auditor General has repeatedly pulled up the government for how it is managing the fund. In the past, the statutory obligation to pass dues on to the USO fund has not always been observed in a timely manner; as a consequence, the money has remained in the Consolidated Fund of India while the Union Budget’s mathematics are being worked out, thereby artificially reducing the fiscal deficit. But, even more worryingly, the CAG has also pointed out that the fund, even when topped up, has been only half used.
9. Neelkanth Mishra has an informative oped with figures on the residential construction industry in India. The argument is simple - the country has too few of houses of the required sizes and good quality, and with increasing incomes this will get addressed and attract massive investments.
India also has fewer houses than households (in comparison, China has 20 per cent more houses than households; and the US 10 per cent more), and still has “mixed-use” dwellings, like a shopkeeper’s family sleeping in the shop at night... the average American house is five times the size of an average Indian house, and has expanded by more than a third since the 1980s... Even though more than 80 per cent of India’s houses are now pukka, either the roof, the walls or the floor for many still need better quality material. Moreover, the pressure of a growing population means taller buildings. Today, 93 per cent of India’s houses are in buildings of one or two storeys and only 0.2 per cent in buildings with more than 10 storeys. In the latter set, which is growing rapidly, construction cost per square foot is nearly 10 times the cost of building a one-floor house in a village.
Rising land prices has been an important constraint to growth of housing,
The value of dwelling construction was more than a sixth of gross domestic product (GDP) in 2012, and rent is the single largest component of the consumption basket after food. However, growth has been less than 6 per cent annually since 2012 in nominal terms, and nearly zero once adjusted for inflation. Its share of GDP has fallen by 5 percentage points to at least a 17-year low. Why did this happen? The reason may lie in land price movements: On average, they have risen by 10 per cent to 12 per cent a year in the last few decades, but between 2002 and 2013 urban land prices rose 19 per cent annually, and likely well over 25 per cent a year between 2006 and 2013. This overshoot meant that a correction was necessary: The pace slowed to less than 4 per cent a year between 2013 and 2019.
This is a positive trend,
In the last four years, rents have grown faster than real-estate prices, even as the share of rents in overall consumption has fallen from 11.5 per cent in 2012 to 9.5 per cent now.
10. Mahesh Vyas points to the index of consumer sentiments, a barometer of the well-being of households and their income growth perceptions.
The index of consumer sentiments in November 2021 was 16.1 per cent higher than it was during the pandemic-affected November 2020. What is important is that it was a substantial 43 per cent lower than it was during the pre-pandemic month of November 2019, or in fiscal 2019-20... we are today worse off today compared to where we were two years ago by as much as 43 per cent. The index had reached its nadir in May 2020, when it was over 60 per cent lower than the 2019-20 level. From there, it has scaled back 44 per cent... In November, 39 per cent of the households reported that their income was lower than it was a year ago, and 37 per cent expected their income a year ahead to be worse than their current income. Only 6 per cent of the households believed this was a better time to buy non-durables compared to a year ago compared to the over 50 per cent who believed this was a worse time...
Rural India saw a much faster improvement in sentiments compared to urban regions. The index of consumer sentiments grew by 18 per cent in urban India between June and November 2021. It grew by a much faster 30 per cent in rural India in this period. With this, the gap between rural and urban sentiments has widened. What is remarkable about this starkly divergent improvement is that even the better-off regions are significantly worse off than they were before the pandemic struck India. Rural sentiments in November 2021 were 40 per cent worse than their level in 2019-20. In urban regions, sentiments are 49 per cent lower than in 2019-20... Only about 8.5 per cent of the households report income levels that are better than a year ago and even lesser expect these to improve in the coming 12 months. Even fewer, about 6.5 per cent, expect economic conditions in general to improve over the next one year—or even five years. As a result, less than 6 per cent of the urban households feel that this is a better time to buy non-essentials.
11. Striking figures on the economic contribution of migrants,
The next 25 years will see 33m people retiring with no replacements, thus shrinking the combined UK and EU workforces from 240m to 207m... Migrants usually create far more wealth abroad than if they’d stayed home. When the mass exodus from Syria and its neighbours sparked Europe’s “migrant crisis” in 2015, a study reported that migrants’ worldwide economic contribution was $6.7tn, about 40 per cent more than their likely domestic value. Although only 3.4 per cent of the global population, they accounted for 9.4 per cent of its gross domestic product.
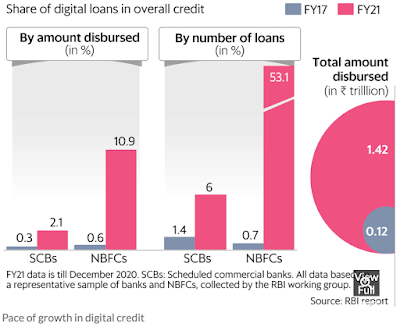
12. Indian stock markets are the frothiest
13. Sharp increase in the pace of
digital credit growth of banks and NBFCs
14.
The Economist has a briefing on the rise of a movement against the use of personal transport vehicles in global cities.
In New York Eric Adams, the incoming mayor, though famous for flouting parking rules, has promised to implement congestion-charging in Manhattan at last. In Boston Michelle Wu, another newly elected mayor, promises to make several important bus routes free for the next two years. In Cleveland, Ohio, Justin Bibb, the mayor-elect, promises to put “people over cars”, and to encourage more people to bike and walk, largely by turning traffic lanes into protected bike lanes. Cities as diverse as Buffalo, New York, and Minneapolis, Minnesota, have begun to ditch “parking minimum” rules, which required developers to provide ample free parking at new buildings. Even in California, a state where driving is practically a way of life, state-assembly members have proposed bills to ban cities from imposing parking minimums near public transport. la Metro, Los Angeles’s transport authority, is studying congestion pricing.
European cities have been doing this in some cases for decades. London established its congestion charge in 2003. The leading city now is arguably Paris, the capital of France. Under Anne Hidalgo, the socialist mayor, and her predecessor, Bertrand Delanoë, cars were banned from the left and then the right banks of the Seine in 2013 and 2017. On the right bank, an expressway named for Georges Pompidou, who proudly opened it in 1967 when he was prime minister, has been converted into a sort of urban park. Ms Hidalgo, who achieved this despite lawsuits led by the right, called it a “reconquest” of the city for its residents. Bars now line the open sections of the road, while families on bicycles zoom through the eerily quiet (and now unpolluted) tunnels. Ms Hidalgo has been a vocal proponent of “15-minute cities”, the idea that almost everything a person needs for daily life ought to be within a 15-minute walk or cycle...
Britain’s government gave local councils the power to close roads to create “low-traffic neighbourhoods” (ltns) without the usual consultations with residents that block them. Planter bollards have proliferated across England’s cities, blocking off residential streets to all but bicycles (typically, residents can enter and exit with their cars, but cannot drive through). When lockdowns started, Amsterdam temporarily banned cars from Spuistraat, Haarlemmerdijk, and Haarlemmerstraat, three central boulevards. The change now seems likely to be made permanent. As Glasgow, Scotland’s biggest city, played host to cop26 last month, city leaders announced plans to ban all cars from the centre over the next five years, in the hope of reducing carbon-dioxide emissions. In New York City, as in many places, street parking was converted into outdoor dining space, so that restaurants could stay open. Chicago has unveiled plans for a further 160km of segregated cycle lanes.
The results have been impressive, with car ownership in Paris dropping from 60% of households to 35%. But these municipal government measures, apart from raising local opposition from vehicle owners, also come up against the incentives of politicians at the national and provincial levels, who prefer the expand vehicle manufacturing (for revenue generation and job creation) and ownership (for feel-good income effect).
15. Shyam Saran has a very good oped about the latest political trends in China in the build up to the 20th Party Congress in October 2022 which will also decide on President Xi Jinping's tenure extension. In particular, the recently organised annual Central Economic Work Conference which sets the overall policy guidance for China's economic managers within the overall framework of the 14th Five Year Plan, stressed on "maintenance of macroeconomic stability in 2022". It identified three risks - declining demand, supply shocks, and weakening outlook for future growth. Saran has a good summary of the challenges facing China,
The country is clearly on a slowing growth trajectory. Even Chinese analysts expect the GDP to grow by 4.5-5 per cent per annum during the 14th Five-Year Plan. The economy is likely to become more domestic-oriented and inward-looking. If the pandemic lingers, the domestic orientation will become more pronounced. China is aware of the headwinds it will be confronting, most importantly the rapid aging of its population and the declining competitiveness of its manufacturing sector. It is betting on technological innovation to avoid a middle-income trap. However, keeping wages low and resisting the secular increase in the exchange value of the Chinese currency slows down the transition of the Chinese economy towards a higher value-added and more service-oriented economic activity. It is not clear how China’s leaders will deal with such contradictions.
We find that, for five consecutive sugar seasons, from 2014-15 to 2018-19, India provided non-exempt product-specific domestic support to sugarcane producers in excess of the permitted level of 10 per cent of the total value of sugarcane production. Therefore, we find that India is acting inconsistently with its obligations under Article 7.2(b) of the Agreement on Agriculture.
However, in the absence of a functional appellate tribunal, means that if India decides to appeal, the DSB's decision is unlikely to take effect anytime soon.
18. Scott Galloway has some stunning data on the rise of Apple.
It took 42 years for Apple to reach a $1 trillion valuation — the first ever company to do so. But it took just 2 years to add another $1 trillion in value. Today, Apple’s market cap is roughly equal to all the world’s unicorns combined!
19. The Union Cabinet in India has
approved a five-year
Rs 76,000 Cr ($10 bn) production linked incentive (PLI) scheme to catalyse a semiconductor manufacturing eco-system in India. It aims to support firms in semiconductor fabs, display fabs, compound semiconductors/silicon photonics/sensors (including MEMS) fabs, semiconductor packaging (ATMP/OSAT), semiconductor design.
20. It's remarkable that the
US Fed FOMC meeting decision to take a more aggressive stance against inflation by indicating that they expected to raise rates thrice in 2022 instead of spooking the markets evoked a 2.2% rise in Nasdaq Composite. The Fed also announced that it would cut its bond purchases by $30 bn a month in January, double its previous pace.
FT points to this market rationalisation,
Investors were not put off by the prospect of reduced direct market stimulus from the Fed, and instead focused on the message that the central bank would not let inflation spiral out of hand. James McCann, deputy chief economist at Abrdn, the asset manager, said: “The Fed really had to demonstrate that they’re willing to move faster and go further to tighten policy more than previously planned as they’ve slipped behind the curve over recent months. It was vital that the Fed acted now to protect its credibility on inflation.”
This is an example of markets collectively suspending logic and preferring to believe that the stock market boom will continue no matter what.