Substack

Showing posts with label Economic Geography. Show all posts

Wednesday, October 14, 2026

Mass transit and land use planning drives economic clusters

Large urban agglomerations are engines of national economic growth. The fuels that power these engines are the transportation infrastructure and mass transit, supported with enabling land use and development control regulations, value capture and revenue sharing, and institutional architecture. This is the topic of the post.

Such urban agglomerations are characterised by clusters of dense, specialised nodes of employment connected to residential nodes by commuter networks. This is the classic model of metropolitan downtowns connected with densified suburban satellite towns that coordinates agglomeration economies at the centre for high productivity job creation.

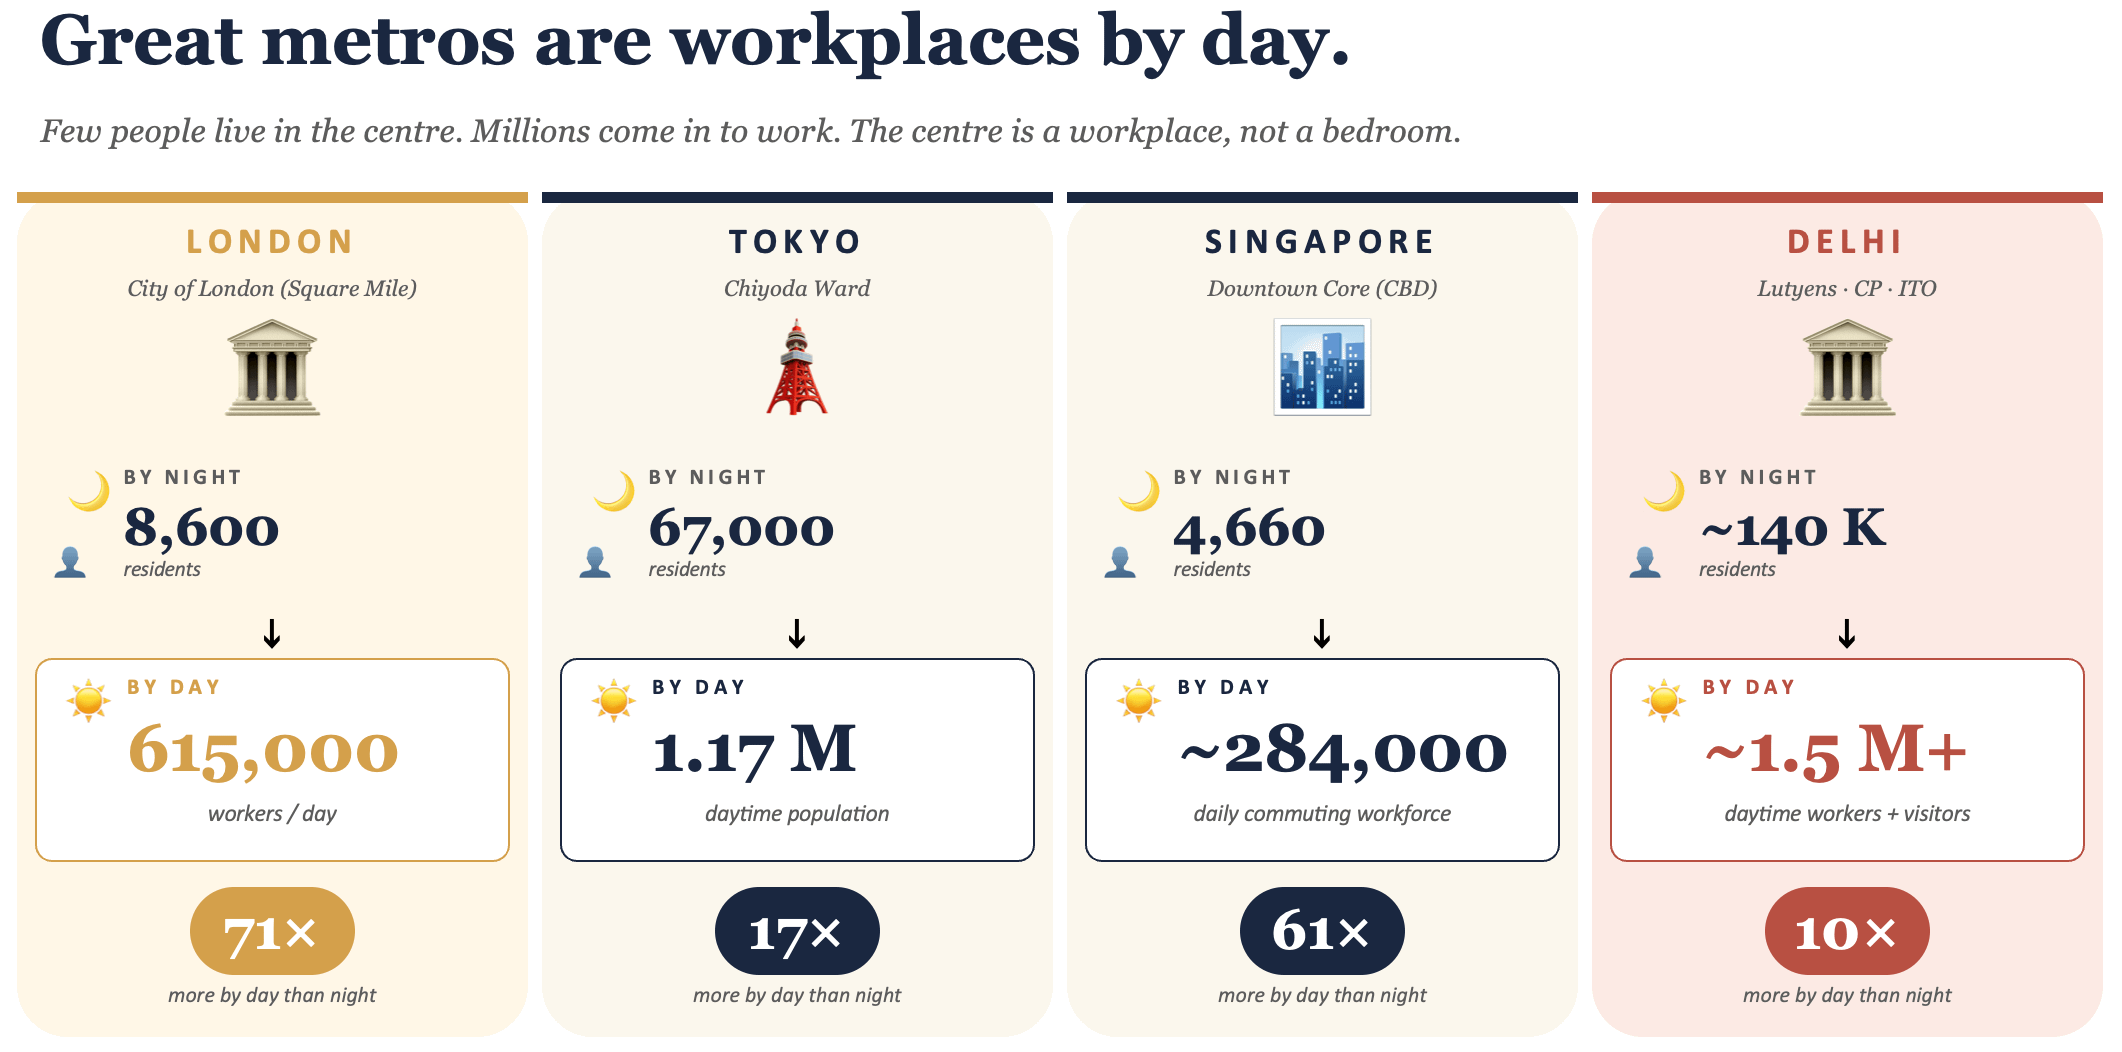
Accordingly, the central parts of major metropolitan cities of the world are predominantly workplaces, with people commuting to work from suburban areas on commuter railway systems. Mumbai, London, and New York are great examples. This is in keeping with the economic logic of ensuring the most productive use of the highest value lands in the city.

It also unlocks affordable housing supply by locating them predominantly in those areas with lower land prices, thereby relaxing the biggest constraint to affordable housing.

The ingredient that binds the nodes together and creates a dynamic regional cluster is a well-connected mass transit network. In cities globally, commuter and metro railway systems have played this role.

High-volume mass transit systems connect the nodes and bring people closer to jobs. They reshape the geography of what an hour reaches. This trip-shortening effect — making longer distance commutes faster than shorter car trips — is especially powerful in India, where the spatial mismatch between jobs in metropolitan cores and job-seekers in the hinterland has been found to be unusually large. They shrink the distances, thereby increasing the pool of jobs available for people in the hinterland, and expanding the talent accessible for employers in the core.

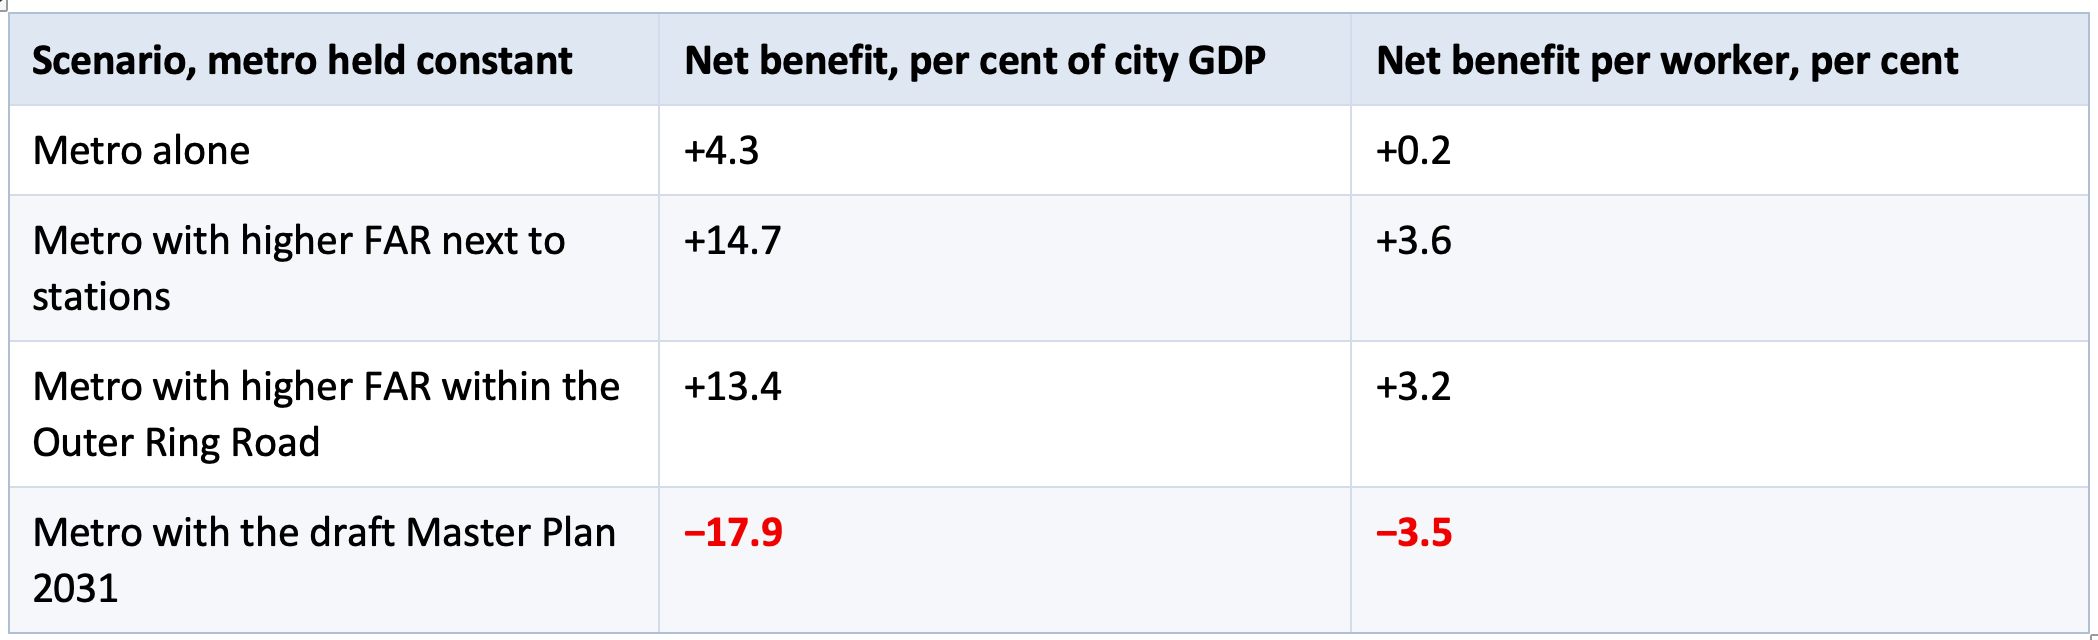
But evidence also informs us that merely laying the mass transit network is not sufficient. This study by Rana Hasan et albuilt a spatial model of Bengaluru and run the metro against alternative land-use policies and came up with the following quantified impacts. 

Holding the metro investment identical, the difference in net benefits between the best and worst land-use plans is roughly 32 percentage points of city GDP. In other words, the land-use plan determines whether the transit investment creates value or destroys it.

The requirement is to locate sufficient density of homes and workplaces within conveniently accessible distance from the stations, either through walk or feeder services. This is transit oriented development (TOD).

TOD is about commuting using mass transit by walking to/from station (to/from home and workplace) or feeder services. A big collateral benefit from TOD is that it avoids the use of cars, thereby decreasing traffic congestion, reducing productivity losses from long commutes, and lowering air pollution.

As I blogged here, TOD also increases the commercial viability of the massive investments made in mass transit systems (~ Rs 8 lakh Cr and counting, with 20-30% ridership realised, and massive debt repayment fiscal burden looming). It induces traffic by creating new trips (by locating more people within the transit zone influence area), shortening trip distances (thereby expanding the effective commute catchment), and mode shifts (from cars to mass transit).

Effective implementation of TOD requires addressing three constraints. One, relaxing development control regulations to make it attractive to build density in the vicinity of the stations, and creating the complementary pedestrian infrastructure. It also requires appropriate mixed land-use planning that allows the market to respond in the most efficient manner to order commute patterns and shape spatial growth. 

Two, funding of the mass transit capex, especially by enabling with the right kind of value capture instruments, with the right sequencing, and also the appropriate revenue sharing between the rail company and the local government/UDA. Try to capture value too quickly, before value gets created, and the cluster remains still born.

Three, an institutional architecture that aligns the incentives between those constructing the transit system (and repaying the debt mobilised) and those responsible for the land use and other decisions that determine the commercial viability of the system. This could, for example, entail the radical change of making the urban development authorities the owner of metro railway systems in metropolitan areas.

Monday, August 31, 2026

Some thoughts on the Hyderabad model of urban growth

This is a long read, triggered by a recent article in The Economist lauding Hyderabad’s vertical growth-enabling policy. 

It is an opportunity to think more broadly about the drivers behind Hyderabad’s spectacular urban growth over the last three decades, one with few precedents in India. Also, to avoid drawing the wrong lessons from the city’s success in economic growth and real estate development, this post will provide some qualifications. It will point to the role of the government, the political economy and the role of large developers, and the consequences of deficient urban planning. Finally, it will offer some comparison between the Hyderabad model and those of Gurgaon and Shenzhen.

The Economist article lauds Hyderabad’s vertical growth and the enabling policy of the government. 

Hyderabad, unique among India’s cities, abolished fsi in 2006. And then, miraculously, life went on. NIMBYs foretell all sorts of doom the moment anyone talks about building anything. They warn of Gothamesque ghettos with gridlocked streets, dry taps and overflowing sewers. Nonsense. Today tall residential blocks line the highways in Hyderabad’s western suburbs and traffic still flows faster than in most major Indian cities. Dozens more towers, including the Trump ones, are sprouting in a neighbourhood called Kokapet that was not long ago full of custard-apple orchards and is now a forest of construction cranes. 

There are two reasons Hyderabad has not descended into dystopia. One is its 160 km-long orbital motorway, the first bit of which opened in 2008 and is now an arterial road in the new skyscraper belt. The other is that abolishing the arbitrary cap on FSI did not mean the abandonment of all rules. Regulations covering minimum street widths and required setbacks still apply. Aviation authorities impose restrictions around air-traffic funnels. The effect is that developers can build high only if they have a large enough plot next to a wide enough street somewhere far enough from an airport. Markets decide the rest. The cost of construction rises with height, so a builder’s decision about how much to pay for land and how tall to go rests on whether potential buyers of flats will cough up enough to make the project profitable. That has prevented a housing bubble.

For a start, Hyderabad’s spectacular urbanised growth over the last three decades owes primarily to government actions. Four, in particular, stand out. 

1. The spurt of IT services industries locating to Hyderabad provided the economic anchor to sustain the spectacular property development that followed. Its emergence owes all to government policies. From having nothing apart from a small software cluster at Mythrivanam, the spectacular boom in the IT industry was catalysed by the conscious efforts of the then government of Andhra Pradesh in the mid to late nineties. It established the 158-acre HITEC City at Madhapur through a PPP between APIIC and L&T, with Cyber Towers being the iconic building. The then Chief Minister, Mr Chandrababu Naidu, toured the US and Singapore extensively, wooing software firms, and his efforts culminated in Bill Gates's visit in 2001 and the announcement of Microsoft’s largest R&D centre outside Redmond. It was followed by GE and ICICI and a flood thereafter and continues to this date, expanding to all kinds of sectors and innovations. The Cyberabad brand took off. 

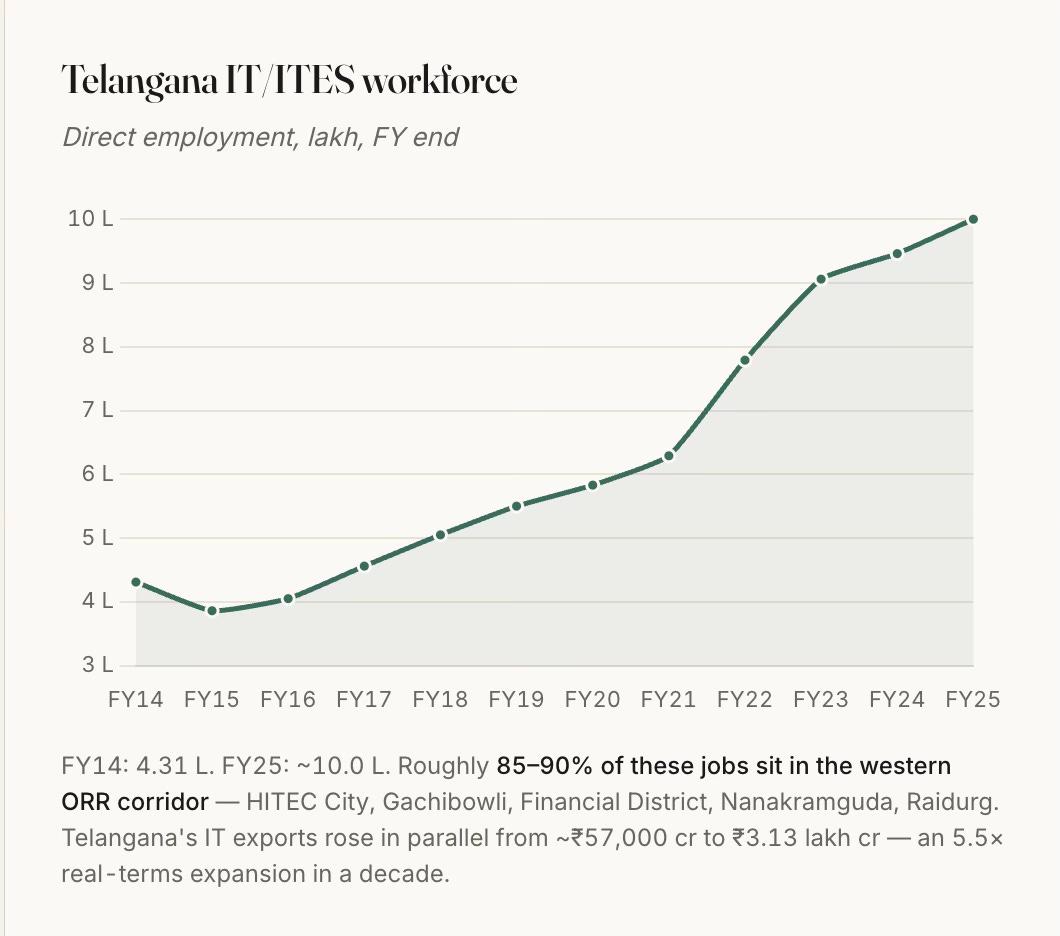
Starting with a few hundred in the early nineties, Telangana state’s IT employment has moved from 0.4 million in FY14 to about a million in FY25, and 85–90% of that sits in the western Hyderabad corridor. 

2. The state’s IT services push was supported by the Andhra Pradesh Infrastructure Investment Corporation (APIIC)’s model of acquiring land, developing trunk infrastructure (transport and utilities), and leasing/selling with clear titles through a single window at concessional rates to incoming firms. This too, like with the ORR, had its set of controversies and scandals.

Apart from the L&T HITEC City, APIIC developed the initial 100-acre Financial District at Nanakramguda, and several others. HMDA has been the price-discovery mechanism for the entire premium belt through its periodic auctions that have unlocked vast extents of government lands. The high premium commanded by these auctions is also because the state layout provides serviced plots with clear title. This is closer to a Chinese SEZ-style state land-lease model than to Gurgaon's private-land-assembly model.

3. The Outer Ring Road (ORR) has been transformational to the urban growth in the western part of the city. Notwithstanding all the controversies on the alignment finalisation, land acquisition, contracts, and tolling, the Hyderabad ORR should count as a totemic example of high growth-catalysing infrastructure investment in India’s history. It unlocked value by enabling the vast hinterland of barren and rocky lands to become productive centres. It was a truly visionary project when conceived in the early 2000s and even when its execution started in 2005. 

The ORR enabled orbital and radial access to the city, thereby resetting the commute dynamics and unlocking vast barren lands, reducing times by multiples. It is no surprise that every land price in the corridor is capitalised against ORR access time. HMDA’s designation of a 1-km high-density buffer on either side of the ORR effectively unlocked about 316 sq km of premium-development-eligible land, the value created from which dwarfs the ₹6,700 cr cost of the road itself.

The ORR did the work of several economic growth crowding-in instruments, and produced the pattern of intense capitalisation of access to it, and (on the flip-side) the neglect of everything it does not touch.

4. The last enabler, the subject of The Economist article, is the deregulated development control regulations, specifically the unlimited FAR adjoining wide roads brought in by the GO Ms No 86 of 2006. In fact, even among the DCR, the GO’s success was only in its deregulation of the FAR. The high FAR manifests in the most salient aspect of Hyderabad’s real estate growth, the skyline of massive high-rises. 

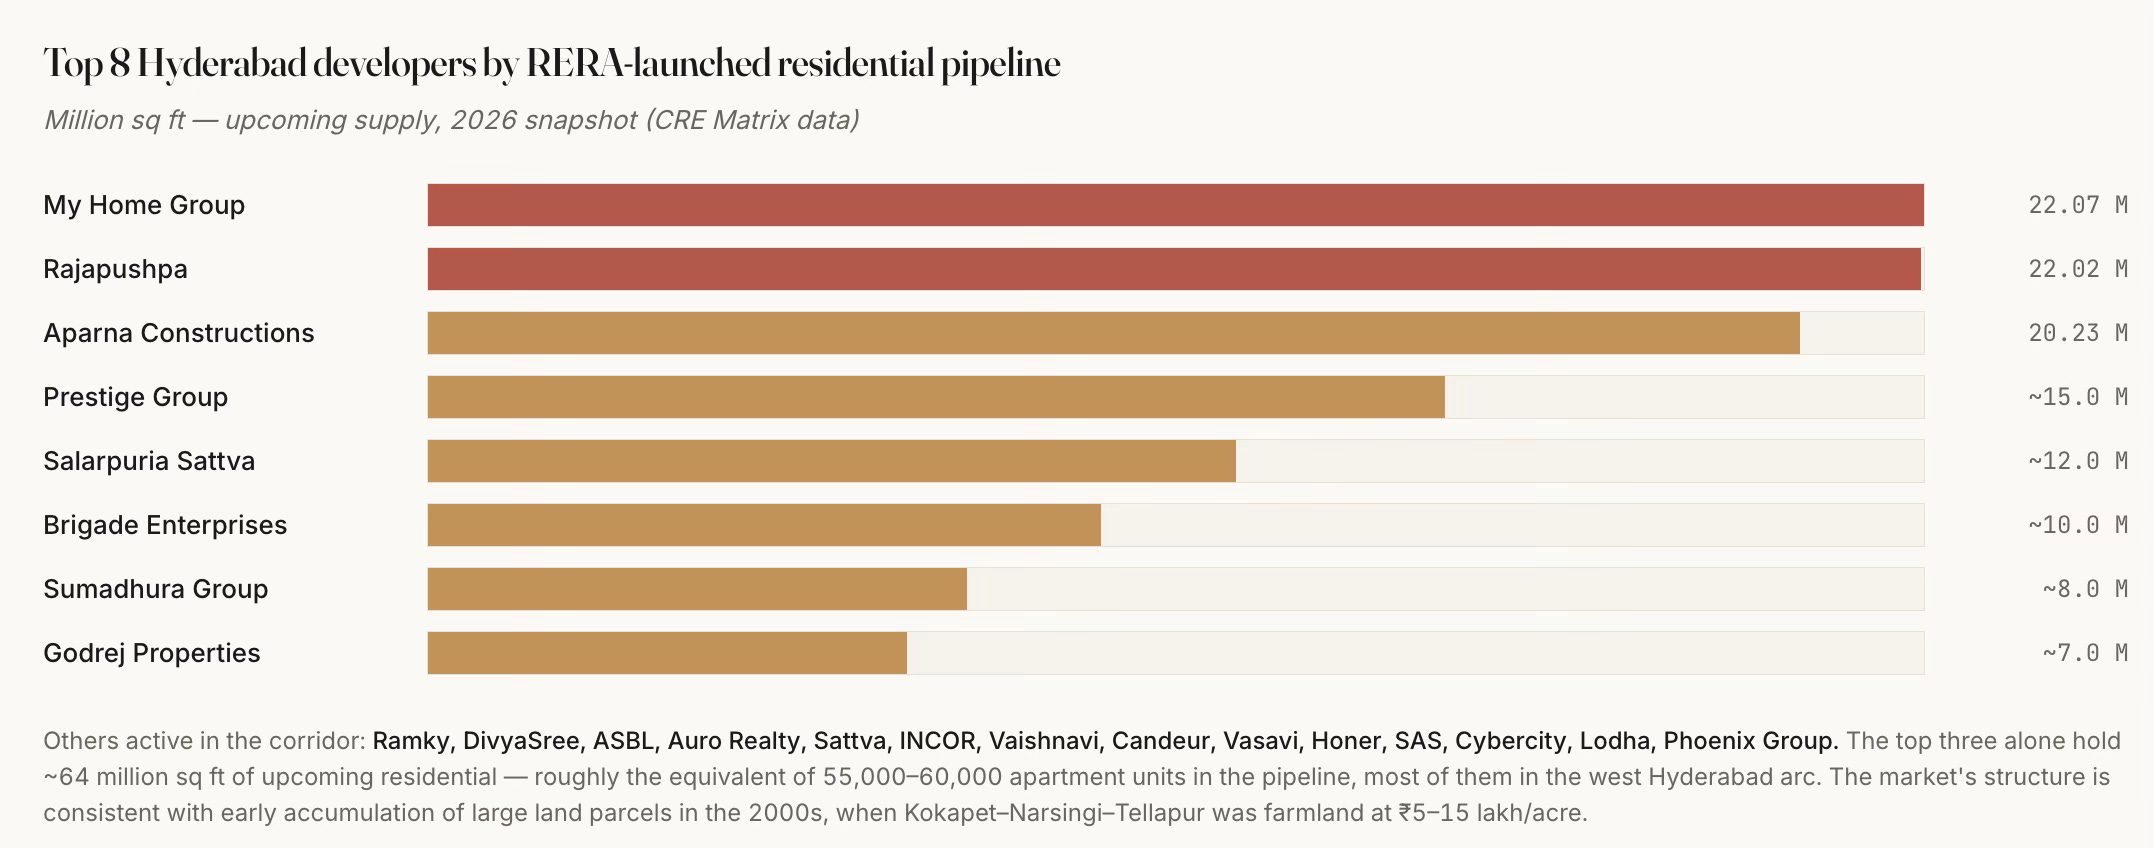
Even with all the above, it also critically required the enterprise, vision, and risk appetite of a handful of local real estate developers (My Home, Rajapushpa, Aparna, etc.) who hoarded large land banks in anticipation of the developments since the late nineties and early 2000s in the run-up to the boom. Only large real estate developers could afford to take the risks that lock up huge upfront capital and endure the vagaries of business cycles. 

However, it has managed to escape the market concentration that characterises markets like Gurgaon. The nature, scale and pace of development have also ensured that while a dozen developers account for the bulk of Grade-A supply, and the top three alone control about 64 million sq ft of upcoming pipeline, there is a long tail of over 30 mid-tier local names.

Such entrepreneurship could also flourish only in a political economy and social milieu which condoned the often questionable overlapping of public and private interest, and deep-rooted corruption. Governments changed, but the underlying model and ongoing work continued unhindered. It is a very good example of Mancur Olson’s stationary bandit at work. 

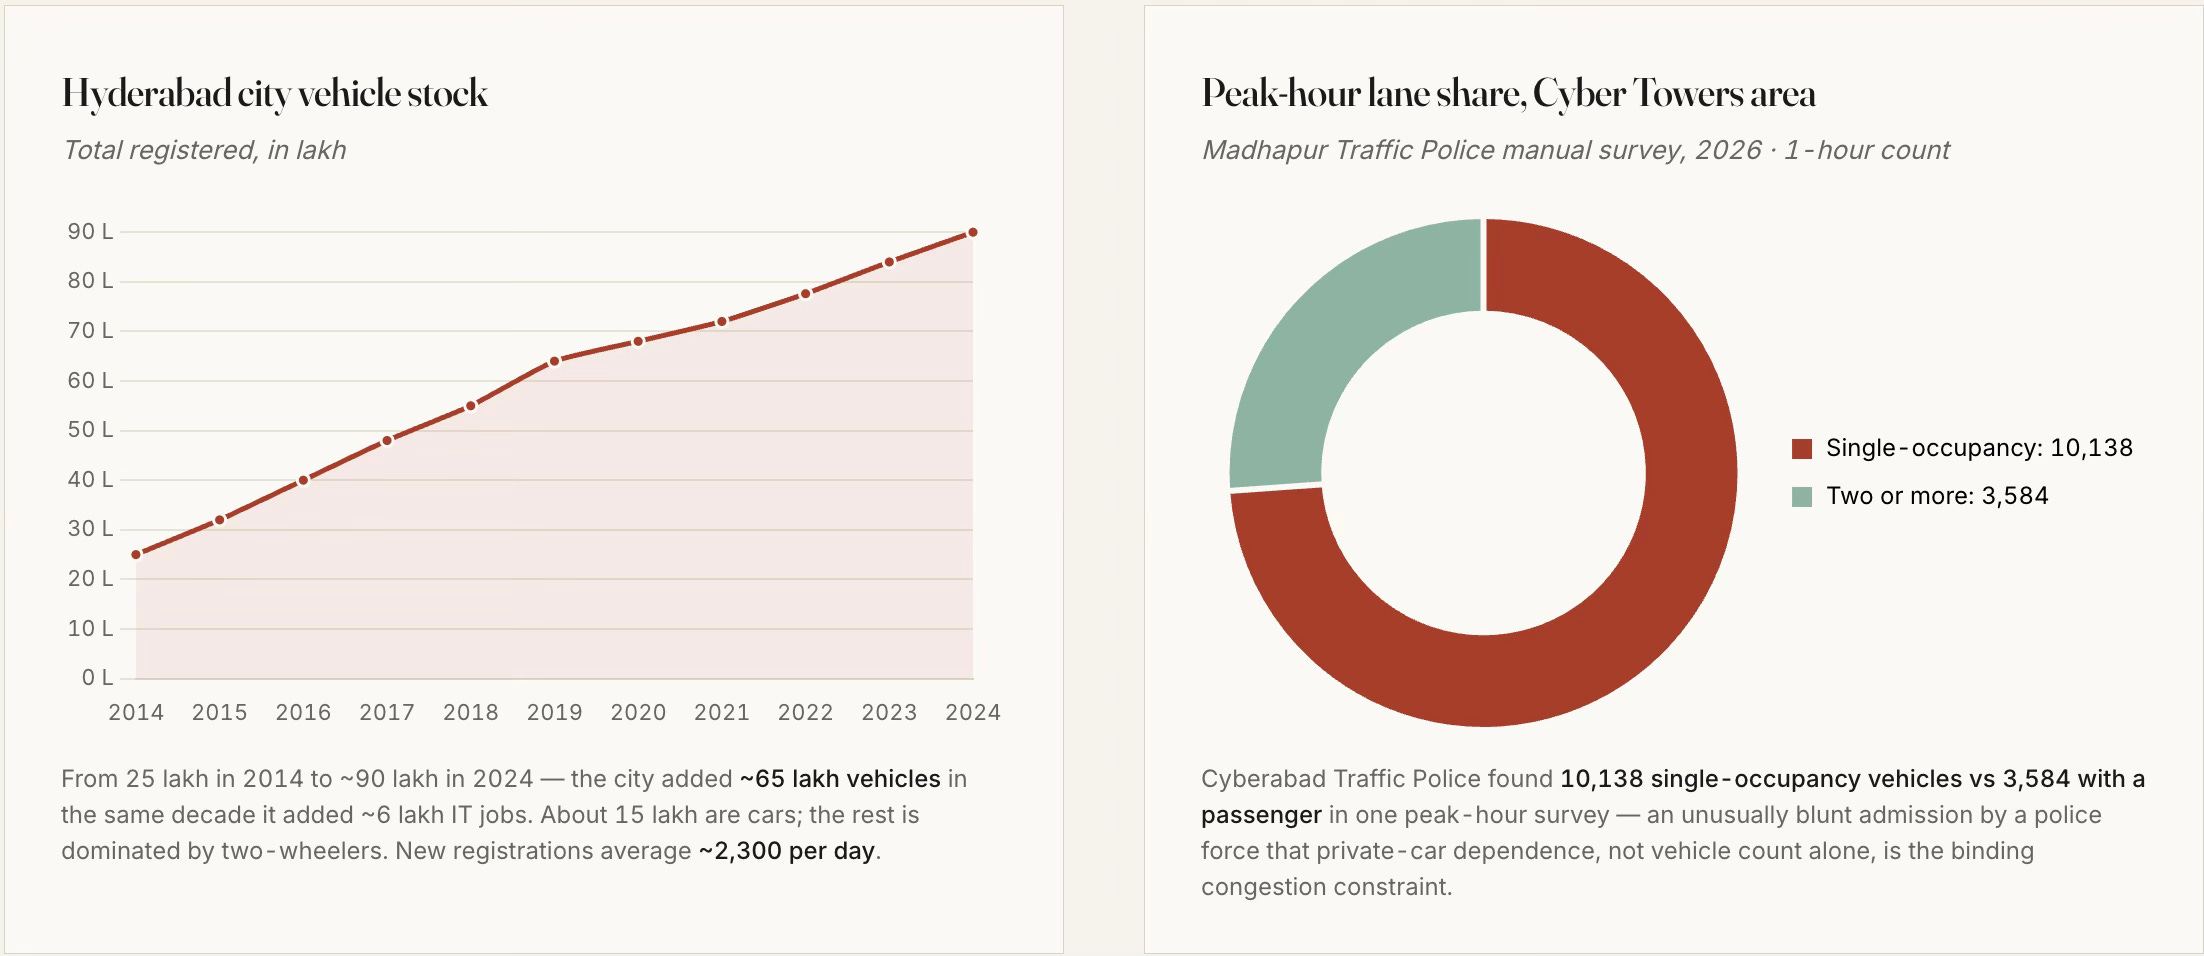
The combination of the 158-km Outer Ring Road, an unlimited-FSI building regime, a hospitable IT policy, and a handful of developers with 2000s-era land banks has added roughly a mid-sized city's worth of office, housing and vehicles to a 200-square-kilometre arc of west Hyderabad in about a decade-and-a-half. The public sector supplied the foundation. The private sector built on it. What emerged are pockets of car-dependent, single-use, higher-income, gated communities, with limited mass transit or affordable housing. 

This brings us to the issue of urban planning. 

Here, apart from the single instrument of unlimited FAR in the development control regulations, it is notable that the state fell short on the critical aspects of urban planning - master-planned mixed-use, walkable street grids, timely metro and mass transit access, transit-oriented density transfer, affordable housing, and vibrant public spaces and community life (apart from those in the gated communities). Even the unlimited FAR has its set of problems. 

However, it can also be argued that more than state failure, these outcomes were the result of private incentives and the political economy overwhelming urban planning imperatives. The reality of developers with large land banks near the ORR and their close relationships with both politicians and bureaucrats trumped all other factors. 

In any case, they have had several undesirable long-term consequences. Here are a few.

1. Residential real estate development has almost completely taken the form of high-rise gated communities and villas, all serving the upper middle-class and above. Affordability has been the casualty. 

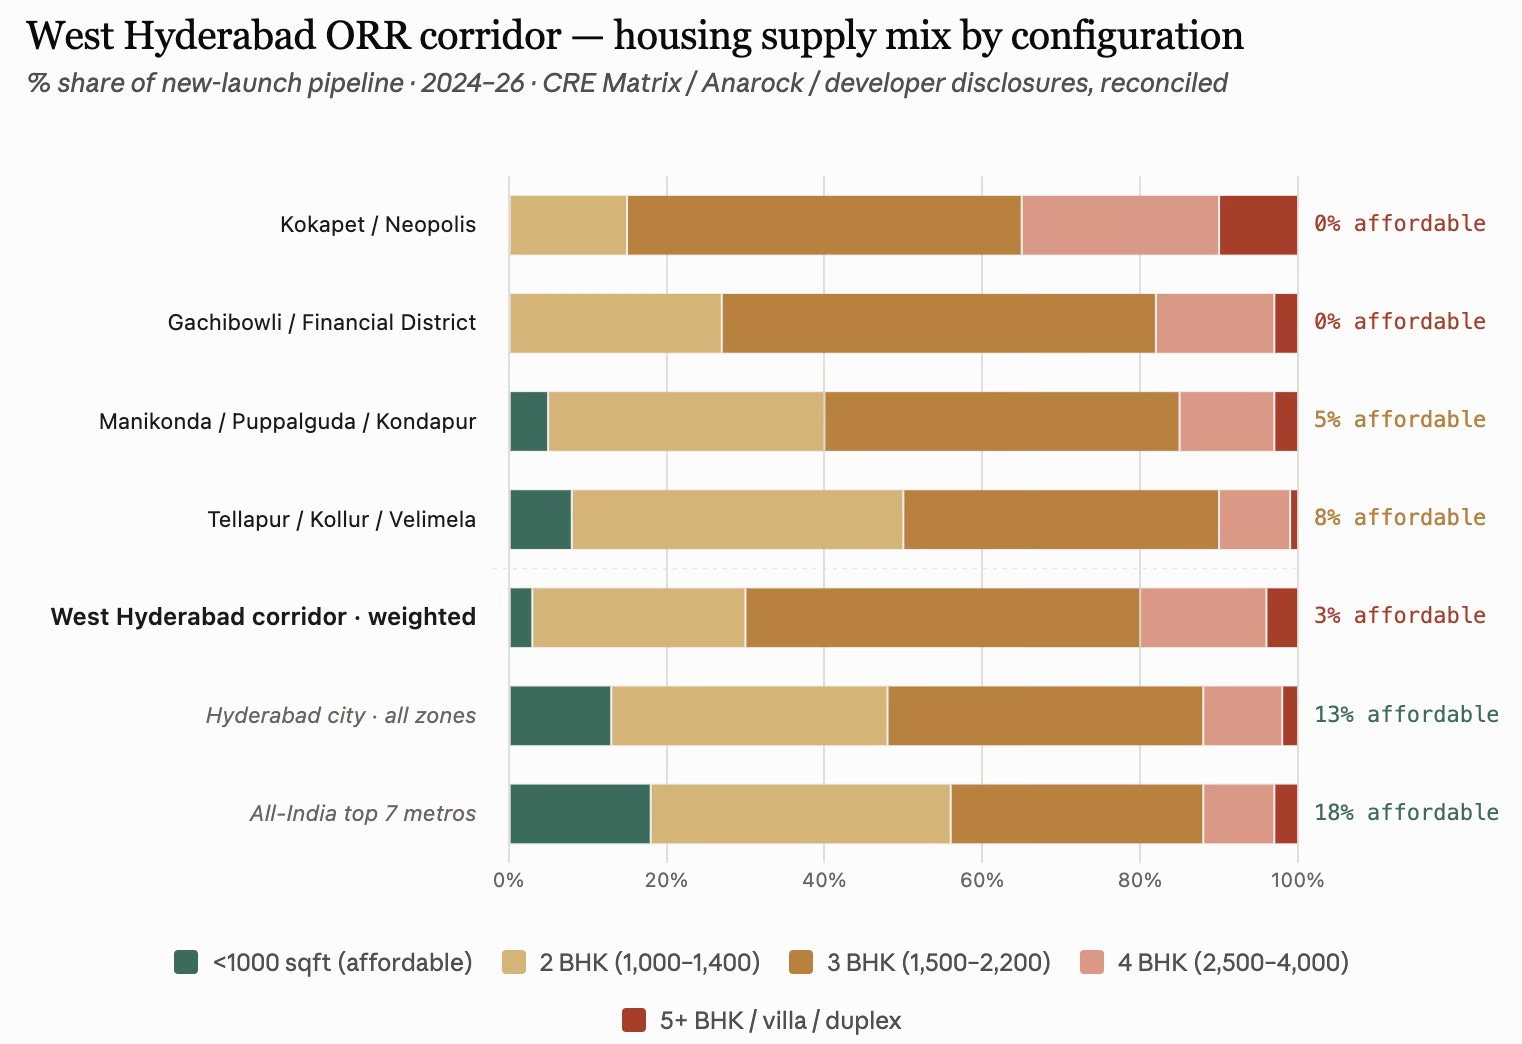
The sub-1000 sqft supply is a mere 2–4% of the west corridor’s pipeline, versus 13% for Hyderabad city and 18% at the all-India top-7-city level. Apart from public housing under various government schemes, it will be a big surprise if there is even one development of housing in the 600 sqft range and below, catering to the lower-income class. The corridor’s default product is a 1,500–2,200 sqft 3 BHK, forming half of everything built, and easily catering to the upper-income class. 

This is a resounding nod to the reality that even in the most deregulated contexts and rapidly growing economic regions, affordable housing and lower-income housing will remain heavily under-supplied. It must be acknowledged as an area of market failure, requiring policy action. 

A ₹10 lakh household income supports roughly a ₹65–80 lakh home, which puts everything from Kokapet, Financial District, Gachibowli, Madhapur, and Raidurg out of reach for a typical mid-career IT professional. Even a ₹25–30 lakh household income (senior IT / GCC AVP) is stretched at ₹2 Cr pricing in Financial District. What this means is that the corridor is now selling primarily to senior tech and finance executives, NRI, and dual-earner-tech/finance households. Junior and mid-level tech workers are being pushed to Tellapur/Kollur/Miyapur. Even in these peripheral areas, sub-1000 sqft housing reaches only about 8%. 

2. The revenue bias of the state government may have compounded the problems. The massive premiums commanded in the land auctions, coupled with the restrictive DCR (on setbacks and open space requirements), have distorted the real estate market and skewed it significantly upwards. For illustration, at ₹150 cr/acre for Neopolis land, the input land cost alone works out to ₹8,000–10,000 per saleable sqft (assuming 2.5–3.5 FSI usable given the large setback and open-space rules). Add construction (₹3,500–5,000/sqft for a premium tower), financing costs (typically 12–18% of project cost), developer margin (20–30%), and GST and other statutory levies/fees, and the total cost comes to ₹13,500–17,000/sqft. This land economics forces ₹4 Cr and above units. In contrast, in Velimela, where land is still ₹5–10 lakh/acre (not for long, one would imagine), 2 BHKs can come at ₹40 lakh. 

In fact, it can be safely said that the entire land-use regime consisting of the ₹150 cr/acre Neopolis land price, the setback rules that make sense only for large plates, the developer economics that require more than ₹80 lakh units to sustain the ORR-belt cost stack, has displaced sub-1000 sqft out of the ORR corridor. The real affordable-format supply in Hyderabad now exists outside the ORR corridor’s western arc, in Miyapur, Bachupally, Nizampet, Kompally (north-west), Kukatpally (central), Uppal, Nagole, LB Nagar, Ghatkesar (east), and Rajendranagar, Shamshabad, Adibatla (south). These are outside the ORR corridor’s western arc. Anarock’s Q3 2025 Hyderabad realty breakdown indicates that 87% of the new supply added was in the premium, luxury, and ultra-luxury segments, priced upward of ₹80 lakh, a figure which rises to more than 95% in the ORR corridor. These are figures that point to a serious housing crisis. 

3. This has been despite the HMDA having a 5% of developable area mandate for each of the Economically Weaker Section (EWS) and Lower Income Group (LIG). Builders have the flexibility to construct it on alternative land within a 5 km radius. However, there is not even a single instance of any developer having built physical units using this option. Instead, they have preferred to use the cash-out loophole of paying a shelter fee, which was carved by amending the Special Development Regulations for the ORR Growth Corridor. It allows developers to pay a capitalisation fee equivalent to 1.5 times the basic land value to HMDA. The low basic land value means this becomes a cheap option, one immediately capitalised into the cost of construction. 

This must count as one of the biggest missed opportunities of Hyderabad’s ORR-based growth, and adds to the list of planning and policy failures. More importantly, the amendments to the EWS/LIG mandate underline the dominance of real estate developer interests. 

4. Also, given the lack of any public transport connectivity linking them, these gated communities are car communities. The very large enclosed boundaries of these communities mean that they are not walkable localities, thereby further isolating the communities and increasing the reliance on cars.

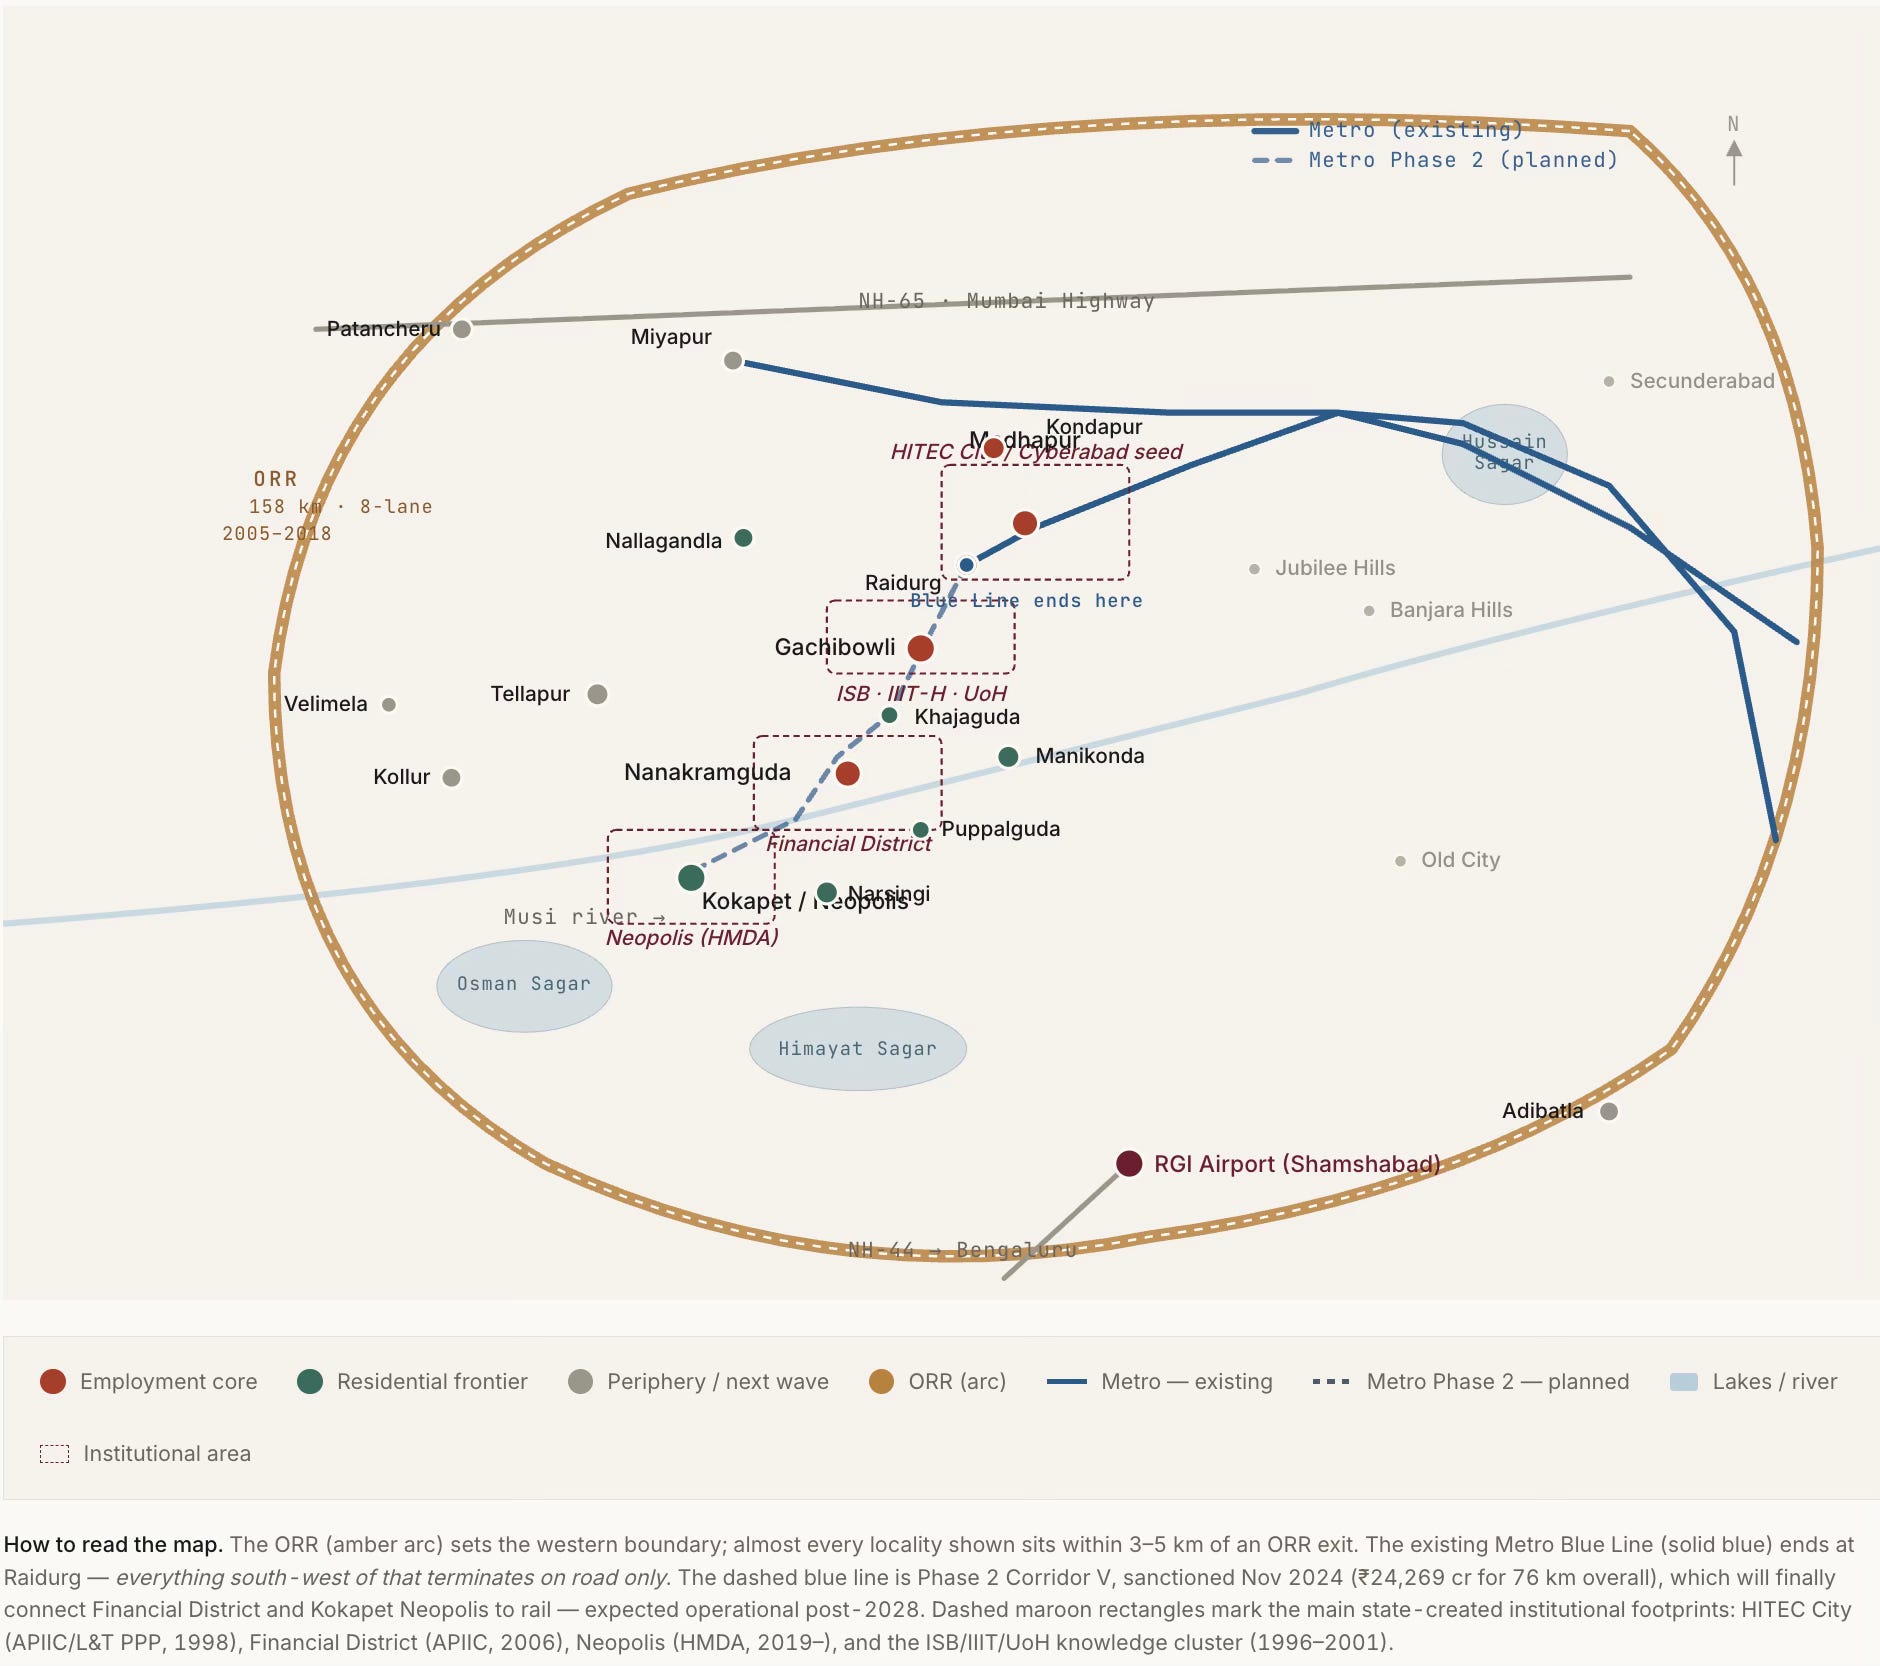
The Phase 1 Blue Line of the metro terminates at Raidurg, on the eastern edge of HITEC City, whereas the next 5–6 km, as in the schematic, contains the highest concentration of new office and residential capex in the corridor, and it has no rail transit at all (though they are included in the Phase 2 corridor of 11.6 km whose work has just started). They are also served sparsely by a fragmented bus network. Even when completed, the configuration and the nature of the development in the area make it sub-optimally useful. 

The metro gap is perhaps the single most consequential planning failure of the western corridor. Hyderabad, like others in India, are seeking to fit the metro into a built-form, instead of shaping the built-form around a built or planned metro. 

5. Furthermore, they are also not mixed-use developments (the institutions/offices, residences, and commercial areas are distinct), thereby forcing households to commute to buy their groceries and vegetables. To some extent, the basic requirements are met by having small shops inside each gated community selling groceries and vegetables/fruits. But outside of this, all commutes are long and car-based. It is unsurprising, therefore, that, like elsewhere in India, there is not one example of Transit Oriented Development (TOD) among the current stations. 

6. The absence of lower-income housing, coupled with the redevelopment and gentrification of even the erstwhile villages, has meant that West Hyderabad must rely on distant areas for various household services. Housemaids, drivers, and other help must travel long distances using autos and bikes to come and work in these communities. Apart from the costs on their lives, this creates their own set of problems (like getting a housemaid early morning or having a driver stay back late, or even their reliability). 

7. The “unlimited” FAR also meant that the government has foregone large revenues in the form of sale of purchasable FAR permitted over a base FAR (which comes with the property right). It can, however, be said that its absence has lowered the cost of construction and boosted supply. For now, the foregone revenues have been recovered many times over in various forms of economic activities, thanks to all the complementary actions that confluenced in the region’s development. 

All this means that West Hyderabad has made its choice of a pattern of living that revolves around secluded gated residential communities and is car-based, instead of the walkable, mixed-use, mass-transit and outdoor public-spaces-based living that characterises many western cities. There are benefits and costs with each model. But once the choice is made, it is almost cast in stone. 

It is also pertinent that while West Hyderabad has developed at this pace, the same planning and development control regulations (DCRs) have had no impact on the rest of the city. Economic growth over the last two decades has largely bypassed the existing twin cities of Hyderabad-Secunderabad and facilitated western suburban expansion. It is hard to think of even one example of meaningful-sized urban regeneration or redevelopment in the remaining parts of the city. It can even be argued that the development of the western ORR corridor has come at the cost of the rest of the city. 

This also reflects the restrictive nature of the existing DCRs, despite the unlimited FSI. Very few, or hardly any, plots in the built-up city can avail this unlimited FSI, thereby pushing development outside to the suburbs and benefiting builders. This is one more illustration of the fact I blogged here that reforms to DCRs across Indian states have largely bypassed the built-up city and benefit only the greenfield suburban developments. 

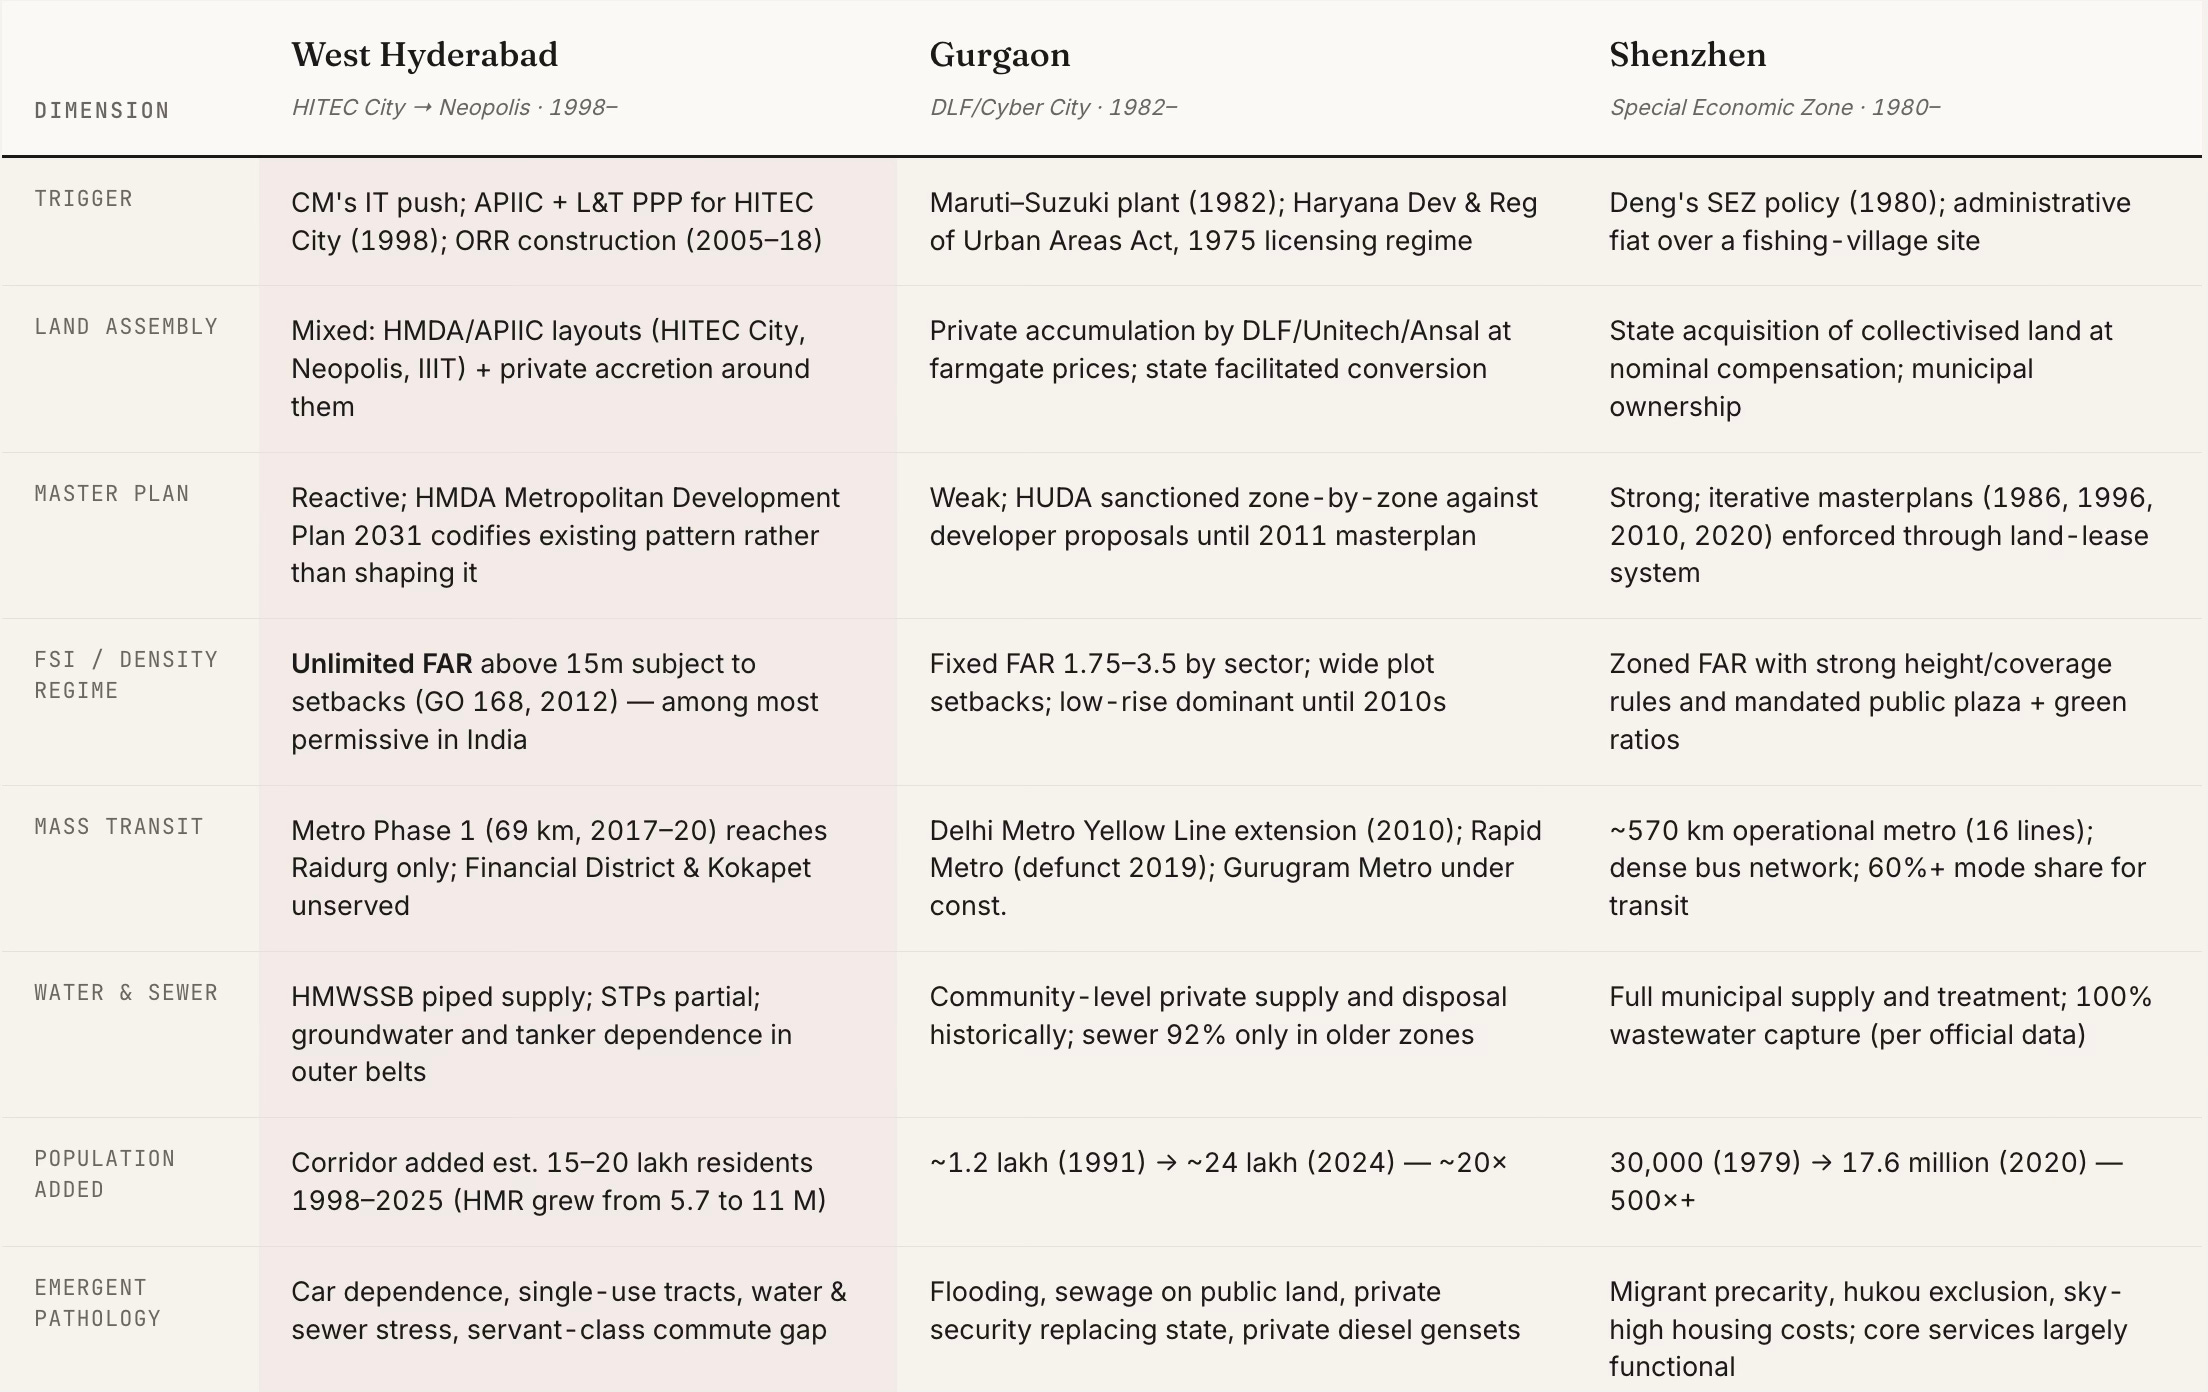
How does Hyderabad’s development compare with two similar examples of rapid growth to scale - Gurgaon and Shenzhen? 

Unlike Gurgaon, which emerged primarily on the back of private land assembly enabled by the licensing regime of Haryana’s Development & Regulation of Urban Areas Act (1975) and even private infrastructure development (e.g., CyberHub metro), the government had a big role to play in the development of the other two. In Hyderabad, as aforesaid, the government aggregated lands, allocated and auctioned them, while also developing the trunk infrastructure. 

Shenzhen is the extreme case of transformation of farmlands, with population rising from a mere 30,000 to 17.6 million in 40 years, and is instructive for its sequencing. It built the metro alongside, not decades behind, the office and housing pattern. Shanghai Pudong transformed farmland east of the Huangpu into finance-and-office from 1990 onward, but again with subway preceding the office boom. Songdo (Incheon) in South Korea is a smaller-scale but similarly planned-from-blank comparison.

Among the three cities, only Shenzhen retained state agency over the density and transit pattern of what it was building. West Hyderabad and Gurgaon both handed the pattern to developers who, rationally, given their incentives, built gated single-use tracts at the highest FAR they could get. The transit, water and sewer bill is what the state pays afterwards.

The best comparison for west Hyderabad is not Shenzhen (which had state agency), nor Gurgaon (which lacked any state trunk infrastructure). It is a distinct third pattern, created by strong state trunk infrastructure, state land assembly and allocation, weak state land-use and transportation planning, strong private densification, and remarkable entrepreneurship and risk-taking, all riding on a booming IT services industry. This third pattern deserves its own space in the Indian urban development literature.
Friday, October 29, 2021

Location is destiny - India edition

Branko Milanovic's seminal work illustrated the importance of location (country of residence) as the biggest determinant of global inequality. He argued that more than luck or effort or specific circumstances, people's economic outcomes are driven by the level and distribution of income within their country. 

The Opportunities Project work of Raj Chetty and Co highlights the importance of place of birth in determining future life outcomes of Americans. 

In the context of India, Prakash Loungani and others from the IMF have a paper that explores the role of location in determining living standards in India. 

Their headline finding,

It's not for, instance, caste or class that are really the dominant sources of your income. But as we were discussing, the fact of whether or not you were born in a poor rural community versus being born in an urban community, really is what determines 20, 25% of your income, just this one factor... we find that almost a third of living standards is likely to be determined by location alone.

Sunday, November 19, 2017

A primer on the rise of populism and a way forward

There are several narratives surrounding the rise of populism and events like the election of Trump and Brexit. I have written about it here, here, and here. This is an attempt at articulating the narrative based on news stories from the week.  

1. What is happening? The remarkable post-war economic, social, and political stability across developed societies, especially in the US, was built on an underlying consensus on certain values. This consensus revolved around the commitment to the values of free-market capitalism, liberal social order, and democracy. Political positions converged to reflect this consensus. 

But as the fascinating graphic below shows, this consensus has been breaking down and the median liberal and conservative positions in the US has diverged significantly over the past decade. 
2. Why is it happening? But this consensus was accompanied by a less benign bipartisan elite convergence (more of it latter) which effectively ended up capturing the economic and political establishment. 

The rapid and fairly inclusive economic progress achieved in the period helped underpin this consensus and paper over fissures that were developing due to forces like trade liberalisation, globalisation, de-unionisation, and skill-biased technological changes. But once growth started slowing, for a variety of factors, these fissures started to show up.

But mainstream political parties, captives as they had become of elite interests, failed to see the breakdown in social consensus. The liberal elites too became caught up in their rhetoric.    

Nothing has been more emblematic of this isolation of elites from the electorate than the staggering levels of economic inequality, which has been widening at a rapid pace since the millennium. As the graphic below shows, in the US, the share of national income going to the top 1% has nearly doubled from 11% in 1980 to 20% in 2014. 
While trade, technology, de-unionisation, immigration, business concentration etc played a role, Jonathan Rothwell argues, 
Almost all of the growth in top American earners has come from just three economic sectors: professional services, finance and insurance, and health care, groups that tend to benefit from regulatory barriers that shelter them from competition. The groups that have contributed the most people to the 1 percent since 1980 are: physicians; executives, managers, sales supervisors, and analysts working in the financial sectors; and professional and legal service industry executives, managers, lawyers, consultants and sales representatives. Without changes in these largely domestic services industries — finance, health care, the law — the United States would look like Canada or Germany in terms of its top income shares.
He also points to how the elite capture of institutions that sets the rules of the game have contributed to an elite premium and rapid widening of inequality,
The United States also stands out in terms of how much money its elite professionals earn relative to the median worker. Workers at the 90th percentile of the income distribution for professionals make 3.5 times the earnings of the typical (median) worker in all occupations in the United States. Only Mexico and Israel, which have very high inequality, compensate professionals so disproportionately. In Switzerland, the Netherlands, Finland and Denmark, the ratio is about 2 to 1. This ratio, the elite professions premium, is very highly correlated with income inequality across countries.
Others are noticing these trends. A new book, “The Captured Economy” by Brink Lindsey and Steven Teles, argues that regressive regulations — laws that benefit the rich — are a primary cause of the extraordinary income gains among elite professionals and financial managers in the United States and of a reduction in growth. This year, the Brookings Institution’s Richard Reeves wrote a book about how people in the upper middle class have shaped both legal and cultural norms to their advantage. From different perspectives, Joseph Stiglitz, Robert Reich and Luigi Zingales have also written extensively about how the political power of elites has undermined markets.
Problems cited by these analysts include subsidies for the financial sector’s risk-taking; overprotection of software and pharmaceutical patents; the escalation of land-use controls that drive up rents in desirable metropolitan areas; favoritism toward market incumbents via state occupational licensing regulations (for example, associations representing lawyers, doctors and dentists that block efforts allowing paraprofessionals to provide routine services at a lower price without their supervision).
Economic geography too has played a role. Richard Florida has documented the increasing trend of concentration of poverty, both across cities and within them. Defining concentrated poverty as neighbourhoods where 40% or more residents are below the US poverty line, he writes,
The number of people living in concentrated poverty has grown staggeringly since 2000, nearly doubling from 7.2 million in 2000 to 13.8 million people by 2013—the highest figure ever recorded. This is a troubling reversal of previous trends, particularly of the previous decade of 1990 to 2000, where Jargowsky’s own research found that concentrated poverty declined. Concentrated poverty also overlaps with race in deeply distressing ways. One in four black Americans and one in six Hispanic Americans live in high-poverty neighborhoods, compared to just one in thirteen of their white counterparts.
Similar concentrations can also explain Brexit. Sarah O' Connor has this fantastic essay on the declining fortunes of the once popular English seaside tourist resort town of Blackpool. The article shows how Blackpool has become "a net importer of ill health, unemployment, and precarious labour and a net exporter of good health and skilled labour". It talks about the "Shit Life Syndrome" that has contributed to a self-fulfilling downward spiral of despair and misery.
And this manifests in social problems that affect the current generation...
... and the future generation too.
See this commentary on the article by Ananth. The opioid epidemic that is sweeping large parts of the US mirrors Blackpool's problems across the Atlantic. And it affects all the similar groups of people.

3. So what can be done? The always incisive Dani Rodrik describes the political situation as a pooling equilibrium, recounts its consequences, and points to a solution to wean the electorate away from populist demagogues,
Conventional and reformist politicians look alike and hence elicit the same response from much of the electorate. They lose votes to the populists and demagogues whose promises to shake up the system are more credible... A pooling equilibrium can be disrupted if reformist politicians can “signal” to voters his or her “true type"... It means engaging in costly behavior that is sufficiently extreme that a conventional politician would never want to emulate it, yet not so extreme that it would turn the reformer into a populist and defeat the purpose. For someone like Hillary Clinton, assuming her conversion was real, it could have meant announcing she would no longer take a dime from Wall Street or would not sign another trade agreement if elected.


In other words, centrist politicians who want to steal the demagogues’ thunder have to tread a very narrow path. If fashioning such a path sounds difficult, it is indicative of the magnitude of the challenge these politicians face. Meeting it will likely require new faces and younger politicians, not tainted with the globalist, market fundamentalist views of their predecessors. It will also require forthright acknowledgement that pursuing the national interest is what politicians are elected to do. And this implies a willingness to attack many of the establishment’s sacred cows – particularly the free rein given to financial institutions, the bias toward austerity policies, the jaundiced view of government’s role in the economy, the unhindered movement of capital around the world, and the fetishization of international trade.
In other words, the most promising solution may be to let the house burn down completely!

Thursday, May 14, 2015

The power of economic geographies visualized

The Growth Economics Blog points to a paper by Roy Elis and Stephen Haber which claims that "economic and political institutions depend, to some extent, on the natural level of transactions supported by the hinterland surrounding the core area of different economies". One dimension of transactions levels they identify is the transportation catchment - higher levels of transactions are associated with lower transportation costs and areas with plain topography or waterways benefit.

In this context, they point to the examples of New York and Mexico City, represented by the following maps, about how far you could get from the center of each city using 40 megajoules of energy.
As can be seen, the hinterland for New York at a 40 megajoules energy budget is 93,300 sqkm against 13,320 sq km for Mexico City. While the authors make their inference in the context of agricultural economy, the seven times difference in the economic geography (or hinterland size) would translate into much higher economic activity in any economy.

Tuesday, April 10, 2012

India's urbanization trends

Excellent graphics from the recently released IIHS report (pdf here) on Urban India 2011. If we take into account larger villages, half of India's population is already living in urban areas or in areas with similar conditions.


Contrary to conventional wisdom, natural urban gorwth and not migration from rural areas is the major cause of urban population growth.


Despite the increasing importance of cities, urban development remains someway off from the mainstream development radar. The graphic below accurately captures the development priorities of governments in India. The Eleventh Plan (2007-12) allocation to various sectors reveals the low priority for urban development.


Cars and two-wheelers constitute 86% of all vehicles on the road, while accounting for just 29% of all trips. Walks and public transport together form 54% of all trips made. The case for massive investments in public transport is most compelling.
The High Powered Expert Committee (HPEC) appointed by the Planning Commission to estimate the financial requirements of cities has estimated that transportation requirements would form the major share of funds requirement for our cities in the 2012-31 period. However, the major focus of JNNURM has been on water supply and urban housing. In some sense, this is encouraging since it means that the funds requirement for providing the basic non-transport urban infrastructure - sewerage and water supply, solid waste management, and storm water drains - is a small share of the total estimated requirement.

Excellent snapshot (click to enlarge) of the cornucopia of urban social safety programs.

 
Despite the increased pace of urbanization over the past two decades, the share of informal employment as a share of total urban employment has remained stable in the 80% range. Jobs in trade and surprisingly, manufacturing, have been largely confined to the informal sector. 


Spatial clustering is defined as the ratio of the share of employment of a sector in an area divided by the national share of employment of that sector. Values greater than one signifies a relative clustering of that particular sector's employment in the particular region. The graphic below reveals a spatial clustering in the metros and million-plus cities for ICT services, high-tech industries, and fast-growing export sectors.

Tuesday, March 1, 2011

City-size and inequality

Are larger cities more unequal? Richard Florida points to an interesting paper by Nathaniel Baum-Snow and Ronni Pavan who investigated the effects of city size on wages (controlling for skill, industry etc) across the smallest rural areas to the biggest urban centers in the US between 1979-2004. They write,

"We find that one-quarter to one-third of the overall increase in hourly wage inequality in the United States from 1979 to 2007 is explained by city size independent of observable skill. While this influence has occurred throughout the wage distribution, the fraction of the increase in the lower half of the wage distribution explained by city size is at least 50% larger than that in the upper half of the wage distribution. More rapid growth in within skill group inequality in larger cities has been by far the most important force driving these city size specific patterns in the data. Differences in the industrial composition of cities of different sizes explain 19 to 32 percent of this city size effect."


In the chart above, the X axis is based on city or metro size (ranging from rural areas indicated by a 0 to the largest metropolitan regions) and the Y axis shows the level of inequality. The green line is for 1979, orange for 1989, magenta for 1999, and blue for 2004-07.

In 1979, the line was relatively flat, indicating that inequality was relatively the same regardless of whether you lived in a rural community, small city, or large metro. However, the slope gets steeper with each passing decade, indicating widening inequality with city size. City size "alone accounts for roughly 25 to 35 percent of the total increase economic inequality over this period over and above the role of effects of skills, human capital, industry composition and other factors". And compared to wage distribution at the top, city size explains 50 percent more of the increase in inequality for the low wage earners.

Examining the reasons for this trend, Richard Florida points to the growing advantages of geographic clustering or agglomeration for modern economic activity,

"The larger and more populous a city or region, the more likely it is to have the human capital and economic ecosystems required to support the most advanced — and hence the highest-paying — technologies and industries. Bigger cities attract more innovators, more entrepreneurs, and more highly skilled and ambitious people in general, and provide a fluid environment where these individuals can combine and recombine their skills. Big cities also generate powerful economies of scale and scope, resulting in higher rates of innovation, new firm formation, and productivity. They attract better-educated, better-trained, more-experienced workers, driving up wages.

At other side of the spectrum, manufacturing, which once clustered in and around large cities and metros, has shifted to less expensive suburban, exurban, and off-shore locations. And large cities have become home to a large and growing contingent of lower-skill, lower pay service jobs – from childcare and food preparation to retail sales and personal services. Taken together these factors have in effect divided or bifurcated the labor market in big cities into highly paid 'creators' and much lower-paid 'servers'."


In other words, despite offering better environment, opportunities and wages for less-advantaged and lower-skilled workers, than smaller cities, bigger cities exhibit much higher income inequality.

Sunday, February 20, 2011

An ode to cities!

I am waiting to read Edward Glaeser's new book. Till then, via Freakonomics, a few snippets

1. The density of cities generate network effects - "Being near smart people matters". Enrico Moretti has found that people’s wages typically rise by about 8 percent as the share of their fellow urbanites with college degrees goes up by 10 percentage points. He writes,

"I find that a percentage point increase in the supply of college graduates raises high school drop-outs’ wages by 1.9%, high school graduates’ wages by 1.6%, and college graduates wages by 0.4%. The effect is larger for less educated groups, as predicted by a conventional demand and supply model. But even for college graduates, an increase in the supply of college graduates increases wages."


Further, "globalization and new technologies have increased the returns to being smart, and we get smart by being around other smart people".

2. Educated cities grow faster and can better adapt to economic declines. Edward Glaeser and Albert Saiz write,

"Educated cities have grown more quickly than comparable cities with less human capital... We also find that skilled cities are growing because they are becoming more economically productive (relative to less skilled cities), not because these cities are becoming more attractive places to live. Most surprisingly, we find evidence suggesting that the skills-city growth connection occurs mainly in declining areas and occurs in large part because skilled cities are better at adapting to economic shocks."


A good school system that harnesses the urban advantages of competition and innovation adds to the strength of cities.

3. Cities with large numbers of smaller firms have become innovation hubs and have tended to create more jobs. Edward Glaeser, William Kerr, and Giacomo Ponzetto have written,

"Employment growth is strongly predicted by smaller average establishment size, both across cities and across industries within cities, but there is little consensus on why this relationship exists. Traditional economic explanations emphasize factors that reduce entry costs or raise entrepreneurial returns, thereby increasing net returns and attracting entrepreneurs. A second class of theories hypothesizes that some places are endowed with a greater supply of entrepreneurship. Evidence on sales per worker does not support the higher returns for entrepreneurship rationale. Our evidence suggests that entrepreneurship is higher when fixed costs are lower and when there are more entrepreneurial people."


4. Successful cities keep atrtracting migrants. One pre-requisite to keeping the flow of migrants going is to have affordable housing. As cities grow, vacant spaces get exhausted. In the circumstances, the only way for cities to keep housing affordable is to keep building vertically. As Ed Glaeser writes, "Chicago’s sea of cranes on Lake Michigan helps explain why average condo prices in the New York area are more than 50 percent more than condo prices in the Chicago area."

5. Densified and vertically growing cities are more environment friendly than suburban sprawl. Building up is also an environmentally sensitive alternative to building out. Edward Glaeser writes,

"People who live in cities do tend to emit significantly less carbon than people who live in the country... That’s coming mainly from driving, from the fact that there’s just a lot fewer carbon emissions associated with dense living. It’s not just the move to public transportation; it’s also the drivers within cities — they’re just driving much shorter distances. And then, of course, it’s because of much smaller homes. The higher price of urban space means that people are living in smaller homes, even with the same family size. And that leads to lower electricity usage, lower home heating usage — and those are the facts that I think make cities seem, at least to my eyes, significantly greener."


See this excellent article on skyscrapers.

Update 1 (8/3/2011)

A person’s earnings rise by more than 7 percent as the share of people in his or her metropolitan area with a college degree increases by 10 percent, holding that person’s own level of education constant. Educated neighbors are particularly valuable in dense cities, where contact is more common. Edward Glaeser writes,

"Before the industrial revolution, cities were centers of small, smart companies that connected with each other and the outside world. Small companies and smart people are the sources of urban success today. The industrial city now seems like an unfortunate detour during which cities exploited economies of scale but lost the interactive exchange of ideas that is their most important asset...

A great paradox of our age is that despite the declining cost of connecting across space, more people are clustering together in cities. The explanation of that strange fact is that globalization and technological change have increased the returns on being smart, and humans get smart by being around other smart people. Dense, smart cities like Seattle succeed by attracting smart people who educate and employ one another."

Thursday, April 2, 2009

Changing face of cities - sprawl is out, and densification is in!

After more than half a century of ideologies and policies that favored the sprawl over density in American cities, the latter appears to be getting back to favor.

Many factors appear to be working towards changing this dominant paradigm in urban planning. On the one side, the growing prominence of knowledge intensive businesses, with its dependence on "network effects", means that densely populated centers have inherent advantages. On the other hand, sprawls have led to the development of socially segregated communities - gated communities and suburban low-income housing estates - with attendant social and economic tensions and costs. Further, rapid urbanization has increased the size of sprawls and brought to the fore the challenge of providing civic amenities and the cost of providing them. It has been found that scatter eliminates the possibility of capturing economies of scale in provision of these civic utilities. The present economic recession, which threatens to be one of the worst in memory, coupled with the recent rise in energy prices, have also added to the pressures to change the thrust of urban planning and the car-culture dominated lifestyles.

The euphoria surrounding privatization and public private partnerships (PPP) in the provision of urban infrastructure and housing and the decade long boom in property prices had unleashed a wave of real estate development projects across cities in developing countries that sought to construct sanitized and self-contained cities, at the margins of existing ones. Underlying this was the premise that any city's renewal and re-development was best left to the designs and mechanisms of the market. Accordingly, the government started slowly disengaging from its traditional roles in the belief that the market would take over its role. The booming real estate market and proliferating integrated townships (with all basic utilities, including parks, recreation and shoppping zones), lend credence to this belief. Now with property prices declining, development activity coming to a standstill, and ongoing projects being sized back, this belief looks badly mistaken.

In an excellent article in the NYT, Nicolai Ouroussoff, examines the urban renewal plans in four major American cities - New Orleans, Los Angeles, Bronx, and Buffalo - that have been badly hit by emerging economic and social trends. The two distinctive features of all of them is the focus on re-development within the existing city (as opposed to development of satellite cities, once the fashion among urban planners) and the prominent role of government in both catalysing and developing the projects.