Substack

Saturday, August 31, 2024

Weekend reading links

1. On mangoes

India is the world’s biggest mango producer, with volumes greater than the next nine growers combined, according to Tridge, a data firm. Yet its share of the global export market by value is a meagre 7%. Mexico, which produces a tenth as much as India, accounts for a quarter. The reasons are many, writes Sopan Joshi in “Mangifera Indica”, a new book about mangoes. Chief among them are the delicate nature of the fruit, poor growing practices in India and strict standards in Western markets.

2. Interesting fact about the state where US companies are getting incorporated, Delaware stands out with over 70%.

3. Data does not bear out signatures of deglobalisation.
4. Some facts about Big Tech 
Since early 2019 the combined worth of the tech giants (Microsoft, Google, Amazon, Meta, and Apple) has more than tripled, to $11.8trn. Add in Nvidia, the only other American firm valued in the trillions, thanks to its pivotal role in generative artificial intelligence (ai), and they fetch more than one and a half times the value of America’s next 25 firms put together. That includes big oil (ExxonMobil and Chevron), big pharma (Eli Lilly and Johnson & Johnson), big finance (Berkshire Hathaway and JPMorgan Chase) and big retail (Walmart). In other words, while the tech illuminati have grown bigger and more powerful, the rest lag ever further behind...

Since 2019 the five tech giants and Nvidia have doubled their capital expenditures, to $169bn last year. Tot up the 25 next firms’ capex and it was just $135bn—up only 35%. As for brain power, over the same period, the big six added 1m jobs, doubling their headcount. No one can accuse them of resting on their laurels. They have invested in ai startups, ploughed fortunes into building large language models and, in Meta’s case, created open-source offerings that almost anyone can use. This year they are doubling down on their ai spending if only to protect their flanks.

5. Striking facts about the importance of immigrants to the US economy.

Immigrants are 14% of the population in America, 16% of inventors and directly produce over 23% of innovation, measured by patents, patent citations and the economic value of those patents, the authors estimate. Taking into account how they make their native-born collaborators more productive, they are responsible for a staggering 36% of total innovation.
6. Law of unintended consequences strikes at the Chinese government ban of tutoring centres for the gaokao entrance examinations.
Researchers at Peking University... analysed surveys of household spending before and after the tutoring ban and found that low- and middle-income families were, on average, spending less on after-school education. The richest families, though, were spending more. Tutors were still active. But because they were acting illegally, they charged more, pricing most people out.

7. Very good summary of the performance of State Bank of India under Mr Dinesh Khara who stepped down as CMD after four years. These are very impressive numbers

Between October 7, 2020 and last week, SBI stock has delivered a 328.36 per cent return to investors, compared to Bank Nifty’s 122 per cent return and Bankex’s 122.9 per cent. During this time, the Nifty returned 111.4 per cent, and the Sensex 103.3 per cent. The largest private bank, HDFC Bank Ltd, saw its stock rise 39.9 per cent, while ICICI Bank Ltd rose 214.6 per cent in this period. For SBI, the return on assets (RoA) moved from 0.43 in September 2020 to 1.10 in June 2024. During this period, return on equity (RoE) increased from 8.94 to 20.98, and earnings per share (EPS) from 19.59 to 76.56... While the bank’s assets have grown over the past three-and-a-half years at a compounded annual growth rate of 10.56 per cent, from Rs 43.58 trillion to Rs 61.91 trillion, its gross non-performing assets (NPAs), as a percentage of total assets, have more than halved, from 4.77 per cent to 2.21 per cent. After provisioning, net NPAs have decreased from 1.23 per cent to 0.57 per cent. Meanwhile, the net interest margin (NIM) — loosely the difference between what it spends on deposits and earns on loans — has risen marginally from 3.31 per cent to 3.35 per cent.
Who said public sector institutions must be inferior also rans compared to their private sector counterparts?

8. Since the pandemic, apart from the Bank of Japan and the Swiss Central Bank, the RBI has undertaken the least number of interest rate changes
It's also one of the very few that have not yet moved on reducing rates. 

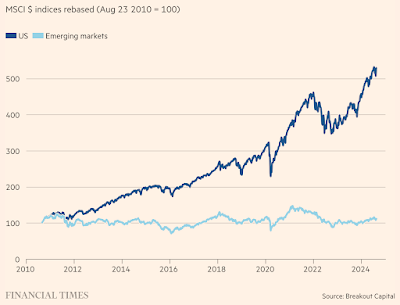
9. Ruchir Sharma talks about a return of emerging market economies in the coming years. For a start, corporate earnings are growing faster in EMs than elsewhere.
This means that we could see a reversion of the trend since 2010.
10. Some numbers to put in perspective why the US equity markets stand alone globally
At the beginning of the 20th century, the US accounted for about 15 per cent of world market capitalisation, second only to the UK, which was at 24 per cent. By 1910, the US had crossed the UK to become the largest equity market in the world. It has since retained this title, unchallenged except for a brief period in the late 1980s when Japan held the top position. Japan peaked in 1989 at 40 per cent of world market capitalisation, while the US was second at 29 per cent. Today, the US remains unchallenged, accounting for more than 62 per cent of world market capitalisation. The next largest market is Japan at 6 per cent, followed by the UK at 3.7 per cent, and China at 2.8 per cent (all based on the FT World Index and free float adjusted). Just 12 markets, including India, account for 90 per cent of world equity market capitalisation. Looking at the longest available data series on equity market performance (1900-2023), spanning 124 years, we see that the US has delivered the best real returns, with an annualised rate of 6.5 per cent. The only market even close is Australia at 6.45 per cent in dollar terms, though there is no comparison in terms of size or absolute market capitalisation created. The UK has delivered 4.9 per cent real return, while Germany and France lag with return profiles of only 3.3 per cent and 3.16 per cent, respectively. Japan delivered 4.2 per cent (all in dollar terms). Compared to the 6.5 per cent real return of the US, the world ex-US, delivered 4.3 per cent, a gap of 2.2 percentage points compounded over 124 years. This leads to huge differences in terminal value. The US has undoubtedly been the right place to invest. If an investor had been exclusively invested in the US for the entire 124 years, their return would have turned one dollar into $2,443 in real terms. The same dollar invested in non-US markets would have grown to only $191, not even one-tenth of the US investment portfolio.

And about India

Over this 30-year period (ending July 30, 2024), MSCI India has delivered a nominal annualised return of 8.65 per cent in dollar terms, compared to 5.3 per cent for MSCI.

11. FT has a nice report from Panyu, a suburb in the southern Chinese city of Guangzhou, which is nicknamed the "Shein village" for its centrality in the retailer's business. The $66 bn valued firm, due for listing at the London Stock Exchange, has shaken up fast fashion with its $5 dresses and $2 T-shirts. 

The article captures the reasons for Shein's competitive advantage.

But going to the heartland of Shein’s supply chain, it was clear that its low prices are in spite of, not because of labour costs, which have been rising in China as the working-age population shrinks and young migrant workers shun factory jobs for the lower-paid service sector. Factory workers that source to Shein typically get paid between Rmb7,000 ($982) and Rmb12,000 monthly, depending on how many clothes they finish. By contrast, the average wage for other blue-collar workers in the area is between Rmb5,500 and Rmb6,500. Part of the reason the clothes are cheap is, well, because they are cheap. One factory manager held up a baggy dress — probably destined for the US or UK — and joked that she would never sell such low-quality clothes to a more discerning Chinese clientele. She says she uses cheaper fabrics for Shein orders than for Alibaba’s Taobao, because the domestic platform gives more money to the factories to cover their costs. 

Shein has also cut out expensive middlemen by shipping goods directly from warehouses in China to shoppers in the west — a model that has the added benefit of the great majority of its packages bypassing import duties. Panyu highlights the attraction of Chinese manufacturing. Like other manufacturing hubs specialising in anything from socks to sex toys to steel pans, it has the entire supply chain concentrated in one district. That means factories can within half an hour place an order, take delivery of fabric or get an engineer to fix sewing machines with components made nearby... China’s migrant worker population also brings it an edge. While in Vietnam and Bangladesh workers tend to return home to their families at night, the labourers in Panyu sleep in nearby dormitories, cutting down commuting time and meaning they can work longer hours if a large order arrives.

12.  Good graphic that shows how the markets over-react to economic news.

Robert Armstorng writes in Unhedged in FT.

Here is the futures market’s expectations for what the federal funds rate will be in December 2024, as well as the Fed’s projections from its quarterly summary of economic projections (the last SEP was released in early June)... One cannot help but notice the pattern of overreaction and correction on the market side. It’s like a car on an icy road. There is a whole sub-industry — Unhedged is part of it — that spends its time arguing about why the Fed is too loose or too tight. But in retrospect we probably overstate the importance of the current and expected level of rates. What matters is keeping expectations anchored on the one hand, and avoiding an unnecessary recession on the other.

BCG has admitted it paid millions of dollars in bribes to win business in Angola, and agreed to give up more than $14mn in profits from contracts it won with the country’s economy ministry and central bank. The consulting firm sent money to offshore accounts controlled by middlemen connected to Angolan officials and members of the ruling political party, according to a US Department of Justice investigation made public on Wednesday. The bribes were paid by BCG through its office in Lisbon, Portugal, between about 2011 and 2017, the DoJ said... BCG agreed to pay an agent with ties to Angolan officials between 20 per cent and 35 per cent of the value of the contracts it won, routing the money through three different offshore entities, the DoJ said... The period of the bribes coincided with the end of the rule of the late José Eduardo dos Santos, who stepped down in 2017 after 38 years in power... In total, BCG won 11 contracts with the Angolan ministry of economy and one with the National Bank of Angola over the years in question, bringing in $22.5mn in revenue. The firm will return the $14.4mn in profits that the contracts generated.

14. But KPMG and UK validates the adage that the more things change, more they remain the same

KPMG has won a UK government contract worth up to £223mn to train civil servants, the second-largest public sector contract awarded to the Big Four firm and agreed before the Treasury set out plans to drastically reduce Whitehall’s reliance on external consultants last month. Under the 14-month deal with the Cabinet Office, which commenced this month, the consulting firm will manage learning and development services across Whitehall, including overseeing courses on policymaking, communications and career development. The maximum value of the contract represents close to 8 per cent of KPMG’s annual UK revenues, making it the second-biggest public sector contract awarded to the firm, according to data provider Tussell. The most valuable piece of public sector work awarded to KPMG was a separate learning and development deal with the Cabinet Office worth £237mn, Tussell said. That four-year contract, which expires in October, involves the firm overseeing technical training for civil servants, such as professional qualifications. The lucrative contracts demonstrate a return to positive relations between the government and KPMG. The Big Four firm stopped bidding for UK government contracts in 2021 following a threat by the Cabinet Office to ban it from winning public sector work after its involvement in a series of scandals. It resumed bidding for public sector contracts in 2022. They also come as the Labour government has committed to halving Whitehall spending on consulting firms during this parliament, with chancellor Rachel Reeves last month ordering departments to stop all “non-essential spending” on external consultants. A government spokesperson said the KPMG contract was agreed before July’s general election. The Conservative party also pledged to halve Whitehall spending on external advisory firms in its election manifesto. The Treasury estimated in July that reducing the government’s reliance on advisory groups would save £550mn in the 2024-25 financial year and a further £680mn in 2025-26, when the policy to halve total spending on consultants came into force. The savings would, in part, help fund significant public sector pay rises, the chancellor said.

15. Very good article on how Nvidia is working to protect its domination of the high-end chips design market. 

The key issue is when the main focus in AI moves from training the large “foundation” models that underpin modern AI systems, to putting those models into widespread use in the applications used by large numbers of consumers and businesses. With their ability to handle multiple computations in parallel, Nvidia’s powerful graphical processing units, or GPUs, have maintained their dominance of data-intensive AI training. By contrast, running queries against these AI models — known as inference — is a less demanding activity that could provide an opening for makers of less powerful — and cheaper — chips... Nvidia’s lead in this newer market already looks formidable. Announcing its latest earnings on Thursday, it said more than 40 per cent of its data centre sales over the past 12 months were already tied to inference, accounting for more than $33bn in revenue... But how the inference market will develop from here is uncertain. Two questions will determine the outcome: whether the AI business continues to be dominated by a race to build ever larger AI models, and where most of the inference will take place. Nvidia’s fortunes have been heavily tied to the race for scale... Yet it is not clear whether ever-larger models will continue to dominate the market, or whether these will eventually hit a point of diminishing returns. At the same time, smaller models that promise many of the same benefits, as well as less capable models designed for narrower tasks, are already coming into vogue. 

Meta, for instance, recently claimed that its new Llama 3.1 could match the performance of the advanced models such as OpenAI’s GPT-4, despite being far smaller. Improved training techniques, often relying on larger amounts of high-quality data, have helped. Once trained, the biggest models can also be “distilled” in smaller versions. Such developments promise to bring more of the work of AI inference to smaller, or “edge”, data centres, and on to smartphones and PCs... The range of competitors with an eye on this nascent market has been growing rapidly... The data centre market, meanwhile, has attracted a wide array of would-be competitors, from start-ups like Cerebras and Groq to tech giants like Meta and Amazon, which have developed their own inference chips. It is inevitable that Nvidia will lose market share as AI inference moves to devices where it does not yet have a presence, and to the data centres of cloud companies that favour in-house chip designs. But to defend its turf, it is leaning heavily on the software strategy that has long acted as a moat around its hardware, with tools that make it easier for developers to put its chips to use.

16. Finally, Japanese startup scene is finally waking up after long drawn persistent efforts by the Government.  

The ambitions are charged with the faith that start-ups can drive GDP growth and productivity, rescue the country from a long-term innovative tailspin and channel its talent in the right — or at least less wrong — direction. It has a belated, even desperate feel to it, but start-ups now seem to be Japan’s core industrial policy. The extent of both central and local government backing is striking. In addition to the many subsidies now on offer, state-backed entities like the Japan External Trade Organization have been drafted into the effort by providing acceleration programmes and other services. The government-backed Japan Investment Corporation has invested close to $1bn into 32 private venture capital funds. Under heavy government pressure, Japan’s three biggest banks have recently begun offering start-ups loans backed against current and future cash flow, breaking their long, entrepreneurialism-crushing habit of only lending against hard collateral such as the property of a would-be start-up founder. By many metrics, all this is working. In 2013, said the Ministry of Economy, Trade and Industry in a recent paper, the total investment into start-ups in Japan was a minuscule $600mn; a decade later, that had risen to over $6bn. Between 2014 and 2023, the number of university start-ups more than doubled to 4,288, with METI research showing that roughly half of university students would prefer to start their careers at one.

Wednesday, August 28, 2024

Some stylised facts about historical trends in FDI and trade

I blogged here about the WDR 2024 which, among other things, extols the importance of economic openness to improve domestic manufacturing competitiveness. However, this claim does not corroborate the empirical evidence on FDI among the North East Asian economies in their early high growth periods. 

There are two channels of economic openness - trade in goods and services, and foreign direct investments. The economic orthodoxy has been that openness on both fronts is essential for developing countries to increase competitiveness and productivity, and broaden their manufacturing base. This post will examine the trends among developing countries on each. 

The historically low penetration of FDI in North East Asian economies is captured nicely in this recent FT article about how corporate Japan is opening up to foreign investments. In the context of an attempt by Canadian retailer ACT to buy 7&I Holdings, the Tokyo-listed company that owns the 7-Eleven convenience stores, the article describes the challenges faced by foreign investors in Japan. 

For decades, would-be foreign buyers have despaired of getting anywhere with Japan, however obviously desirable (Yakult? Konami? Canon? Nintendo? Yamaha?) the list of potential targets. A market for corporate control, whether led by domestic consolidation or foreign takeover, has never properly evolved — in part because no one has forced Japanese companies to accept the primacy of shareholder interests. Absent the forces driving valuations higher, the Tokyo Stock Exchange twinkles with heavily undervalued brands and brilliance… Japanese companies are not rated as if they are profit-hungry, because the country’s long years of ultra-low interest rates means a great many are not. But Japan has also exuded — through fierce resistance, poison pill strategies and more — the message that its treasures were off-limits. Chief executives were not historically obliged, by law, best practice or feisty shareholders, to take unsolicited offers seriously, and conventional wisdom (along with the recommendation of financial advisers) was that only a fully agreed takeover could work.

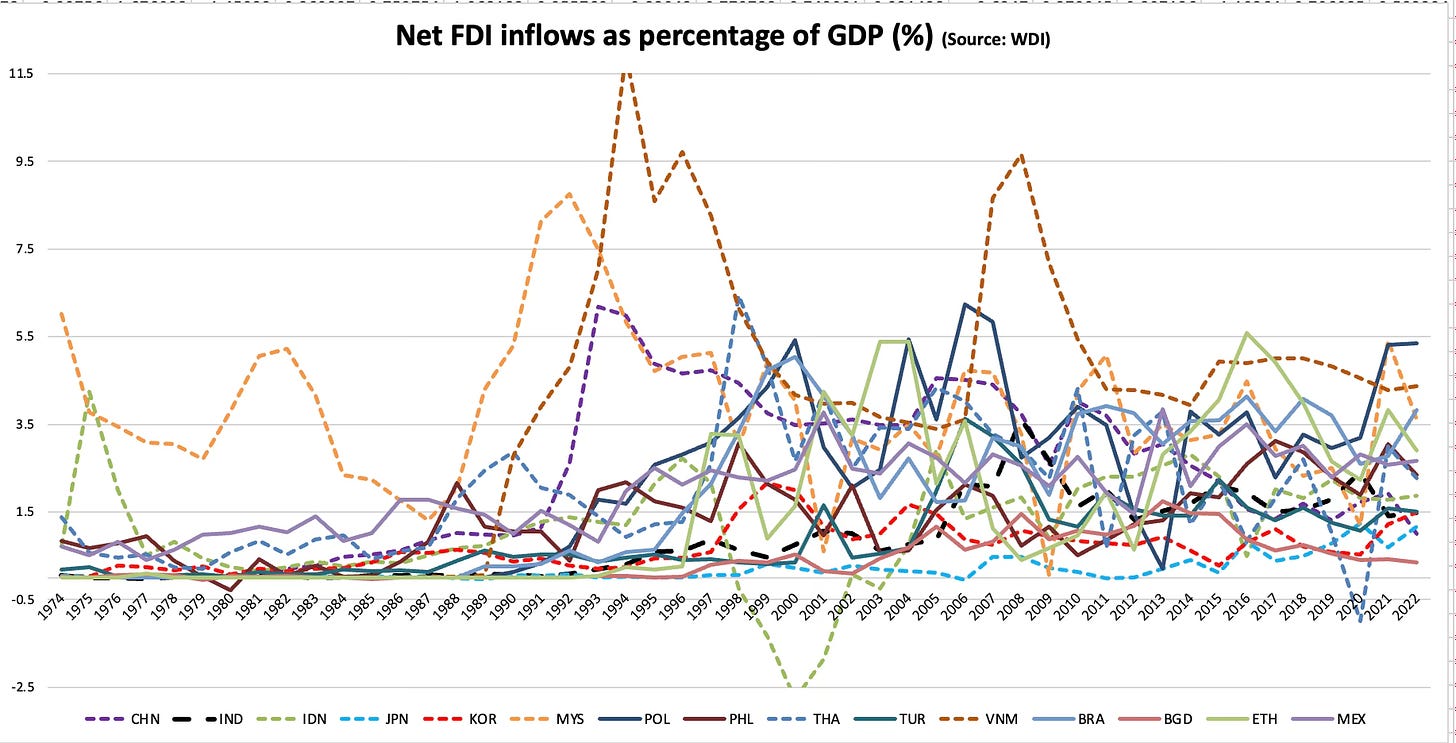
So what has been the historical trend of FDI inflows into the major developing economies? The graphic below compares 16 major developing countries for the period from 1974 to 2022.

This graphic removes Vietnam and Malaysia so that we can zoom into the trends.

There’s a very large diversity in the FDI experiences of these countries. At one end are Japan and South Korea. It’s remarkable how little of FDI Japan and South Korea received during their high growth periods. In both countries, FDI has been consistently less than 1% of GDP (apart from a brief period in late nineties for South Korea). Clearly foreign competition and FDI-based technology transfers had little to do with the classic North East Asian economic success. As Joe Studwell has nicely described in his book, these countries pursued the classic infant industry protection policies (that countries like the UK and the US pursued before them) with the strong disciplining force of export competition. 

In contrast, China is the star case for FDI. In the 1991-2012 period which coincided with the country’s spectacular economic growth surge, China received 3-5% of GDP every year. But since 2012, it has dwindled to less than 2% of GDP. China perfected the art of inviting foreign companies to establish manufacturing facilities, gradually form joint ventures, force technology transfers, and create local manufacturing champions across sectors using very generous doses of subsidies. But how many countries have the political discipline, resources, and market power to pursue this path?

Since the mid-nineties, the consistently higher FDI recipient countries have been Malaysia, Vietnam, Poland, Brazil, and Ethiopia, with Vietnam being the standout. Since the turn of the millennium, Thailand, Philippines, and Indonesia have received significant FDI, though it has been characterised by large volatility for Indonesia and Thailand. In the last quarter century, apart from Vietnam and Poland (whose case might be different), none of these countries who benefited from large FDI inflows can claim to have grown at high rates, and established diversified economies leave aside become manufacturing powerhouses. 

But for the first half of last decade, FDI has been a very small share of Bangladesh’s economic output, underlining the country’s struggles to go beyond textiles and diversify its economy. 

India has received FDI of about 1.5-2% of GDP for the last decade and a half. However, in its high growth period of the second half of the 2000s, FDI inflows went beyond 3% of GDP and stayed above 2% of GDP. This has not since been replicated. 

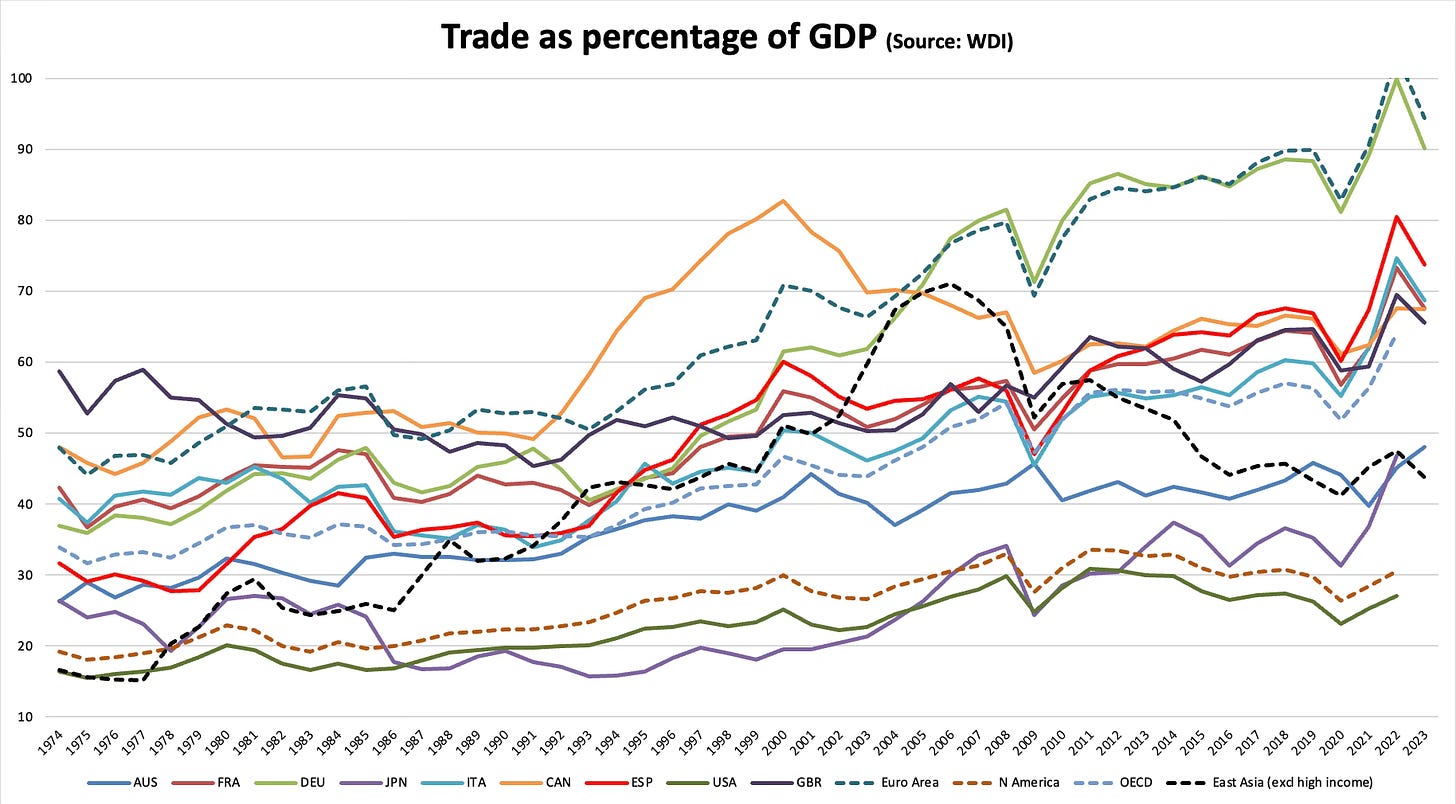
Now, let’s do a similar analysis for trade as a percentage of GDP. Let’s first take the case of today’s advanced economies - US, Japan, Germany, France, UK, Spain, Netherlands, Italy, Australia, and a few regions (E Asia, OECD, N America, and Euro Area - shown as dashed lines below). 

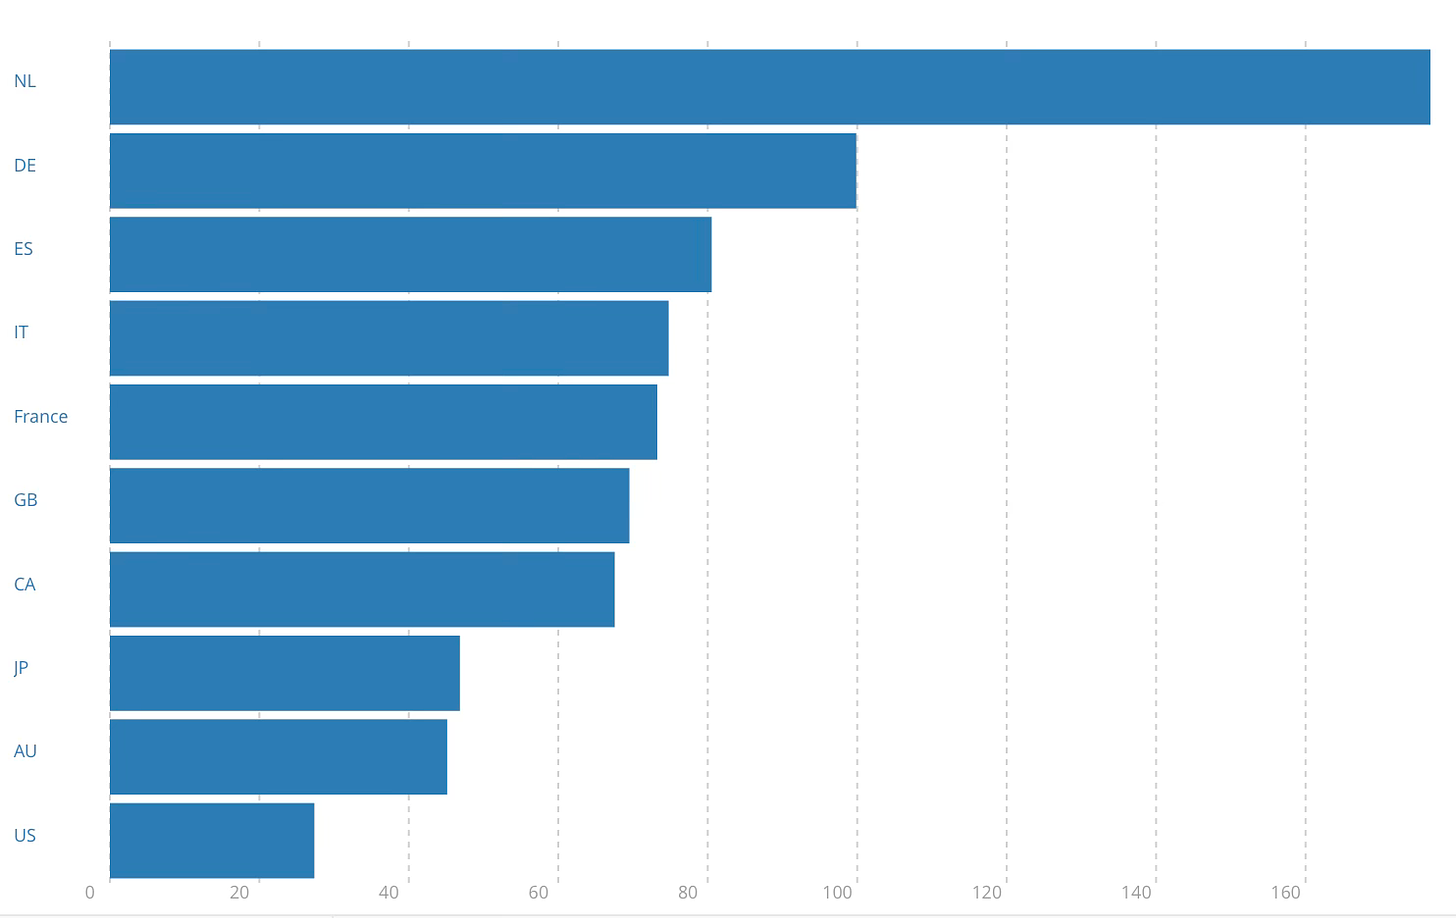
The clear outliers are the Netherlands (not in the graph) and Germany, whose large trade shares skew the number for the Euro area. For the US it has never touched 30% and Japan it has been below 40%. For the rest, the trade share has been in the 40-60% range for a long time, before rising gradually since the financial crisis and sharply since the pandemic to cross 70% (though it’s falling back now). The trade shares for 2022 are in the graphic below.

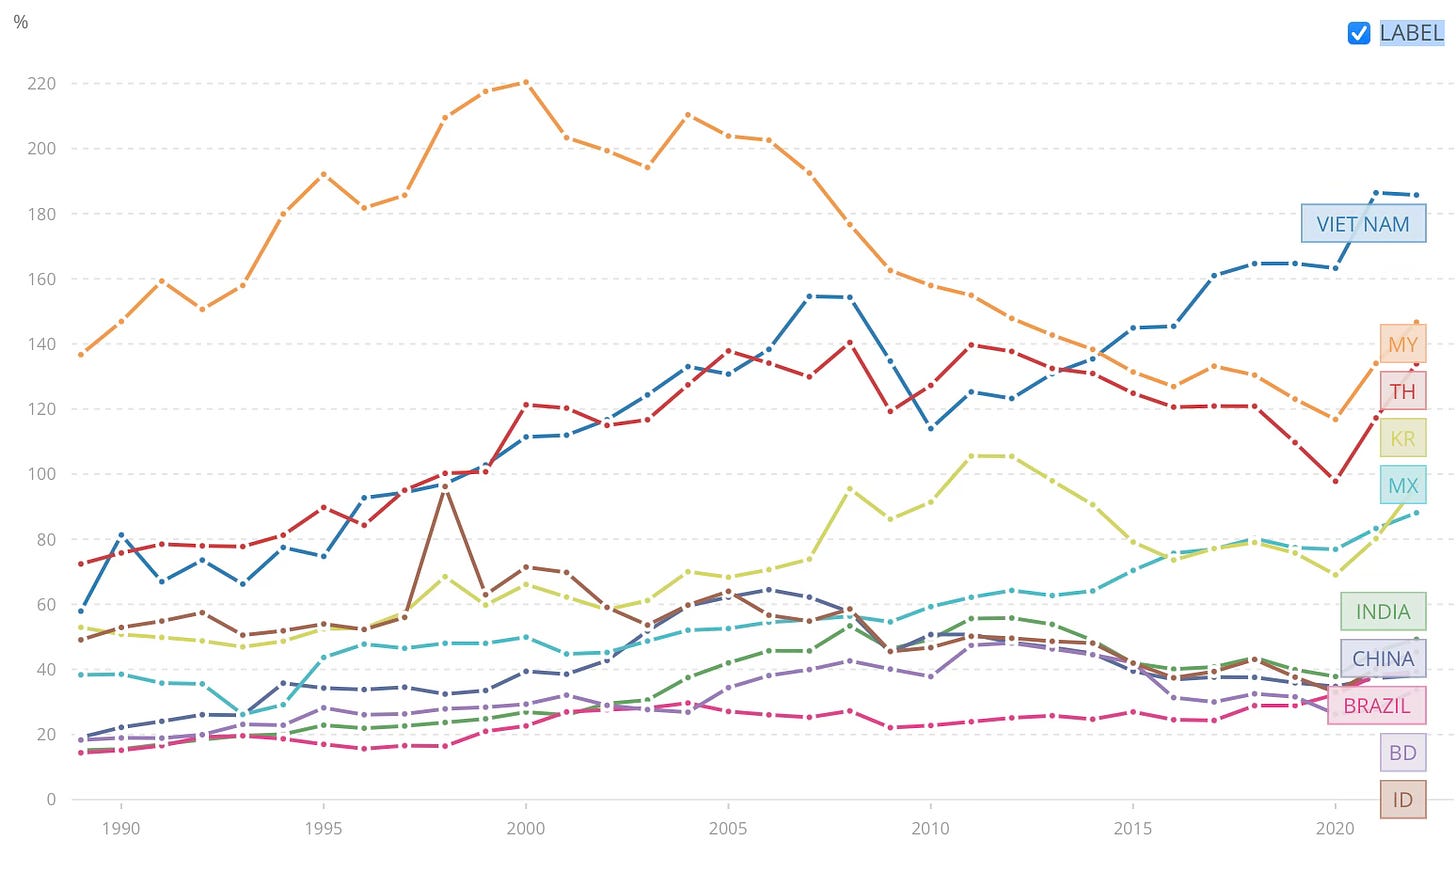
Now consider the case of developing countries, especially the East Asian and Latin American ones. The same trend comparison since 1989 shows the following.

The trade shares of the big economies - China, India, Brazil, and Indonesia - appear to have stabilised in the forties, after having risen from the twenties. They are in a much higher 100-150% of GDP range for the smaller East Asian economies, with Vietnam being a clear outlier among all economies.

Vietnam and, to a lesser extent, Malaysia and Thailand, are the standout performers. Vietnam’s history shows two phases of trade growth, from 1993 to 2007 and then from 2010 to 2022. South Korea has had trade share of consistently more than 60% since the mid-nineties. 

Interestingly, even in its peak growth periods, China’s trade share only touched 64% of GDP in 2006. India’s trade share rose from 30% in 2002 to reach 53% in 2008 and then to 56% in 2011 and 2012 before falling. But since the pandemic, it has been rising. 

The trade shares touched peaks of 220%, 140%, and 106% for Malaysia, Thailand, and Korea before declining. It’s important to note that trade share remains very low for both Indonesia and Bangladesh, especially striking for the latter given its oft-repeated image as a poster child for textiles exports. 

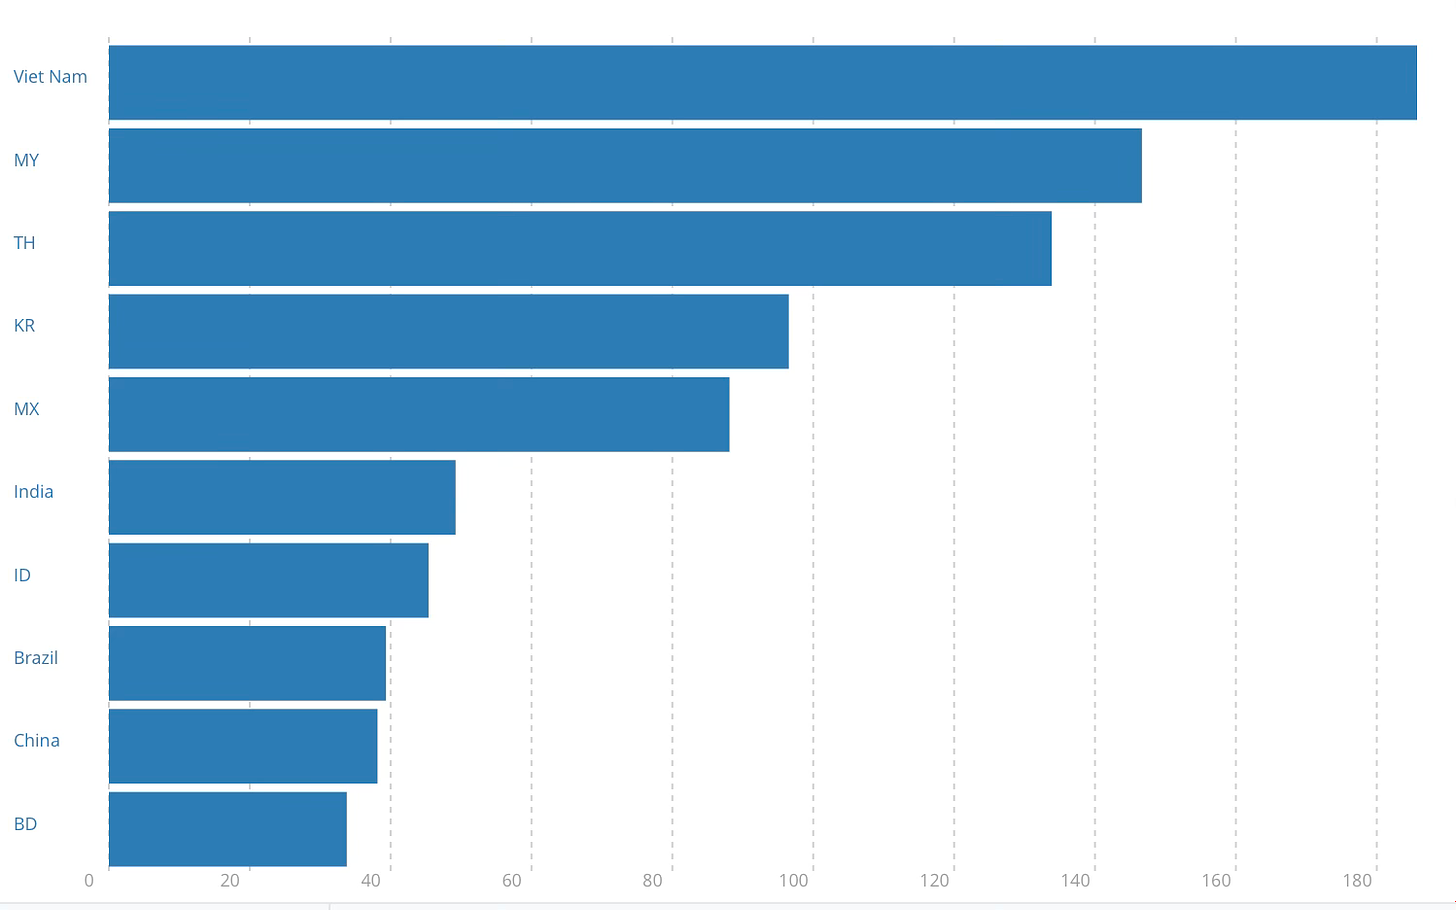
For the year 2022, the trade shares are as follows. 

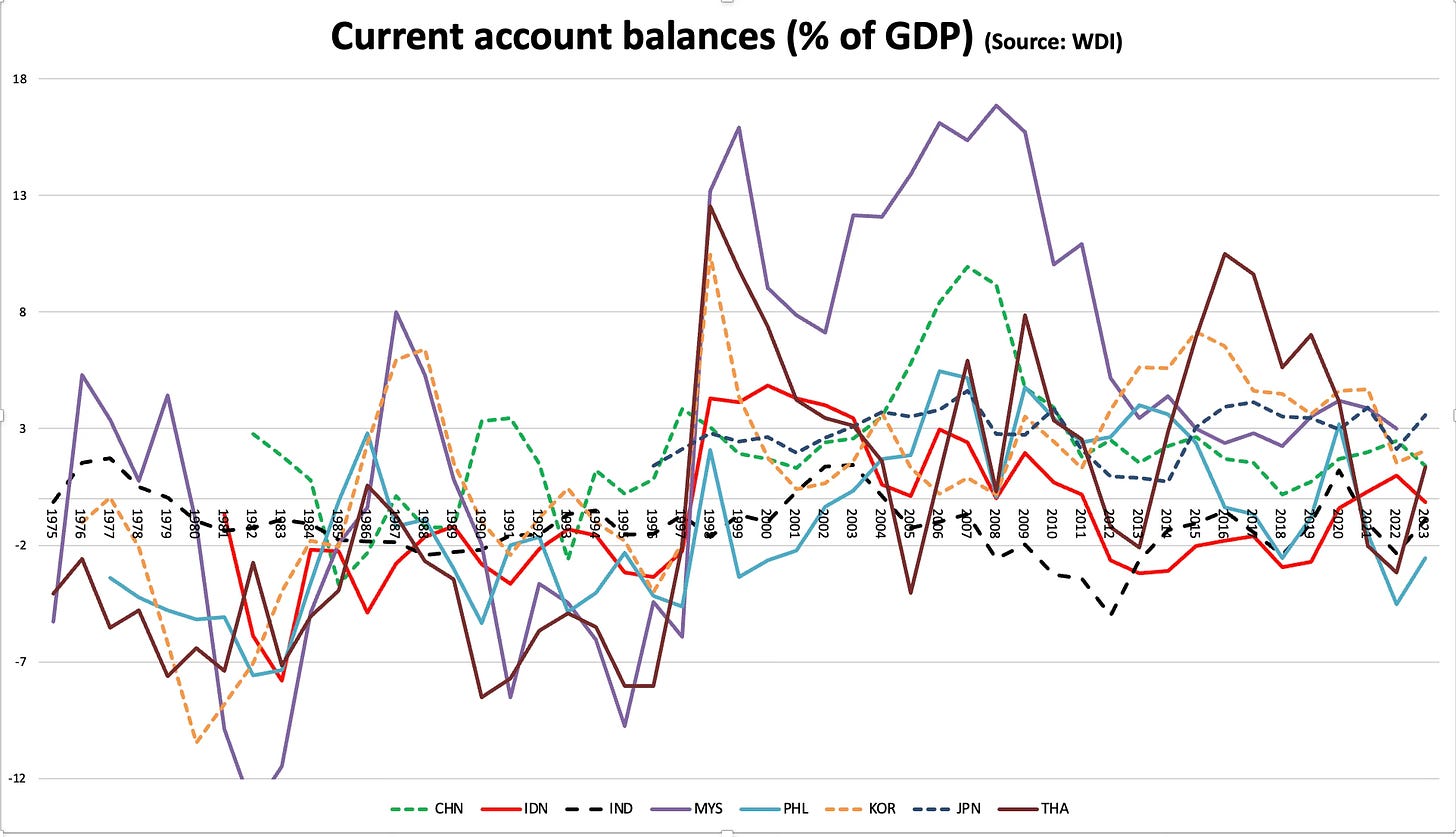
Again, like with FDI inflows, there’s a lot of heterogeneity among countries and it’s not possible to draw any broad generalisation. The high trade shares of the smaller Southeast Asian economies point to their high dependence on foreign trade for economic growth. Given their current account surpluses (the graphic below), these economies appear to have established themselves as input suppliers in the global value chains centring on China. 

The graphic below shows the current account balances of the East Asian economies since 1975. As can be seen, there was a structural break since the East Asian crisis of 1997 whence these countries flipped from running current account deficits to having current account surpluses. Some like Malaysia and Thailand have often run very high surpluses.

China, South Korea, and Japan have consistently run surpluses, at least since the early eighties (except for a brief period in the nineties for S Korea). In contrast, India has been running deficits, albeit mostly within limits, except the brief period in 2012-13. 

The graphics show that the trade shares of economic output for both the developed and developing large economies have been in the range of 40-60% (apart from the US and Japan, for whom it has been much lower) for the last fifty years. 

In sum, if we go by historical examples, India, with current FDI and trade shares of slightly below 1.5% of GDP and 50% of GDP respectively, can at most strive to move its shares to about 2.5% of GDP and 65-70% of GDP respectively. 

Monday, August 26, 2024

Institutionalise co-operative federalism to solve policy problems

India’s federal administrative structure presents its unique set of challenges. Many public policy issues require tightly coordinated action by the central and state governments to realise their objectives. The complex nature of the issues adds to the necessity of such coordination. 

Consider a few examples of public policy problems:

1. The continuously expanding expenditures on subsidy schemes like health insurance and tertiary education scholarships. 

2. Increase the revenue base of urban and rural local bodies and achieve full devolution of powers as required under the 73rd and 74th amendments to the Constitution of India. 

3. Reforms to the open-ended paddy procurement at the Minimum Support Price (MSP) which distorts incentives and results in the accumulation of rice stocks. 

4. Address the problem of poor student learning outcomes in schools and acutely deficient employability skills. 

5. Efforts to ensure the affordability of housing in the largest cities and expand the mortgage market. 

6. Maintenance of the decentralised water supply schemes established under the Jal Jeevan Mission. 

7. Introduce public-private partnerships (PPPs) in social sectors like health, education, skilling etc. 

8. The problems facing power distribution companies in reducing distribution losses and dealing with the distortions caused by free power to farmers. 

All these are complex problems with political economy implications that require the centre and states to work together. Besides, these problems bind with similar intensity across states and regions. Finally, they are also national challenges, and addressing them is essential for the country’s future. 

Each has its respective solutions and their implementation strategies. But even with the best technical solutions and strategies, the political economy challenges detract from their effective pursuit. There’s a need for a bipartisan consensus.

Therefore, it’s essential to proactively and institutionally co-opt the state governments as partners in the journey. One way to co-opt state governments would be to constitute institutional forums which bring together the states and centre at political and executive levels and empower them with the mandate to deliberate and arrive at a consensus on important implementation challenges. 

Such challenges may include overcoming the opposition of important stakeholders, mobilising additional resources by leveraging funds from different sources, adopting new approaches and practices (and shedding certain existing ones), compensating or mitigating those who suffer losses from their implementation, changing/revising associated laws and institutional structures, and so on. 

There can be a forum of the respective Ministers of the state and central governments, supported by another forum of Secretaries to governments. To make discussions fruitful, it may be useful to restrict this forum to 6-8 members, with state governments rotating every two years. To ensure bipartisan support for the decisions emerging from the forum, it must strive to ensure equal or more representation from opposition-ruled states.

The union ministers concerned could chair the forum. It could be convened at least once a quarter. It could create sub-committees of ministers and/or secretaries and entrust them the responsibility to work out the details on specific issues, and have the forum debate and take decisions. The decisions of the forum must be consensual and not binding on the state and central governments. All this will help assuage apprehensions among states about the intent behind establishing them. 

The force of moral suasion and collective support is often sufficient to tip the balance among fence-sitting states. Besides, even if there’s disagreement, the fact that such an inter-state forum discussed the problems in detail should provide sufficient impulse for interested states to push ahead with the implementation. 

Also, the discussions in these forums could trigger debates and strengthen the hands of supporters of reforms, thereby creating the space for progress in at least some states. Given the nature of these issues, it’s unrealistic to expect all states to implement them together and uniformly. Instead, the discussions could unleash dynamics that bring together a few states to implement the reform. The others would follow suit gradually based on the results of those at the vanguard. 

Further, the discussions would serve as a safety valve for all sides to express their opinions, be heard, and have decisions taken collectively. The chairpersons of each committee, representing the central government, could take extra care to steer its discussions away from becoming entrapped in political grandstanding. 

In the initial stages, such forums can confine themselves to issues where there’s a policy consensus on the objectives but there are differences in their implementation or where implementation is fraught with practical problems. Accordingly, it must be made explicit that the forum’s discussions centre on the implementation challenges and stay away from high-level policy issues. Once the institutional confidence increases, the scope of these forums can be expanded. The forums can become departmental platforms to deliberate and make recommendations that could form the basis for new policies and schemes. 

It can initially be experimented in a couple of departments and gradually expanded by incorporating changes based on emerging feedback. 

There are good precedents that point to the value of such forums. The GST Council is an outstanding example where the central government has achieved consensus on a complex issue, also through exemplary statesmanship by successive union finance ministers. 

Instead of creating new committees across departments, it could also be considered to have these as sub-committees to the Inter-State Council (ISC). The Council could decide on the issues to take up and also create sub-committees to deliberate and either decide or even recommend to the ISC.

The policy issues listed earlier are too complex to be easily amenable to even such well-intentioned institutional efforts. More importantly, the political differences and polarization are real, and it’s unrealistic to expect such neat institutional mechanisms to bridge those differences. It will therefore be a very messy journey. But this mechanism provides a good starting point to engage meaningfully on the problem with at least an intent of collective pursuit.

Saturday, August 24, 2024

Weekend reading links

1. Disturbing facts about India's PSUs.

From a capital outlay of Rs 3.32 trillion in 2013-14 (the last year of the Manmohan Singh regime), PSUs saw their total investment jump to Rs 8.52 trillion in 2019-20. In terms of its share in GDP, PSUs’ capital outlay rose from 2.9 per cent to 4.2 per cent in the same period. This rise was driven as much by trebling the government’s equity infusion as by the PSUs’ ability to generate more internal resources and raise more borrowing... In the five years following the pandemic, the PSU story has changed significantly. Indeed, by the end of 2021-22, capital outlay by PSUs fell almost by a fifth. The decline could be largely attributed to the PSUs’ inability to raise internal resources or even mobilise higher borrowing. The fall would have been sharper but for the government propping up the public sector with increased equity infusion, a trend that has continued since then. The capital outlay situation in the last two years has got better. At Rs 8.4 trillion in 2023-24, the declining trend has been reversed, but as a percentage of GDP (2.84 per cent) this is still lower than what prevailed 10 years ago (2.9 per cent in 2013-14)... infusing additional equity, which in any case is largely restricted to a handful of entities like Bharat Sanchar Nigam Limited, National Highways Authority of India, and Indian Railways, accounting for about 87-90 per cent of the total equity outlay announced in the last couple of years.

2. Some facts about food prices inflation index in India from the latest HCES report

Over the period from 2011-12 to 2022-23, the share of food in monthly per capita consumption expenditure (MPCE) declined from 52.90 to 46.38 per cent in rural and from 42.62 to 39.17 per cent in urban India. In rural India, the share of cereal declined from 10.69 to 4.89 per cent and pulses and pulse products from 2.76 to 1.77 per cent over this period. In urban India, the share of cereal declined from 6.61 to 3.62 per cent and pulses and pulse products from 1.93 to 1.21 per cent in the same period. Because households got free rice, wheat and coarse grains from the public distribution system (PDS), the decline in value share was more pronounced than the decline in quantity consumed. In 2022-23, a person consumed 9.6 kg and 8.0 kg of cereals in rural and urban India, respectively, in a month, compared to 11.2 and 9.3 kg in 2011-12. Given that the share of items consumed free from PDS in the index is 0.80 in rural India and 0.25 in urban India, there is no reason to expect that consumption from the PDS would have any effect on inflation per se. It is equally important to focus on other components of the food basket. The importance of beverages and processed food has crept up steadily over time. In 2022-23, its share in the overall rural and urban MPCE was 9.62 and 10.64, respectively, compared to 7.4 and 8.03 per cent in 2009-10. Hence, accurate measurement of the price of cooked meals and snacks purchased is now extremely important.

3. FT points to Hendrik Bessembinder's analysis of the best performing stocks of all time over their lifespans. Altria, formerly Philip Morris, is the best-performing stock of all time in absolute terms.

If we consider annualised returns of stocks which are older than 20 years a different list emerges.
The paper writes
This report describes compound return outcomes for the 29,078 publicly-listed common stocks contained in the CRSP database from December 1925 to December 2023. The majority (51.6%) of these stocks had negative cumulative returns. However, the investment performance of some stocks was remarkable. Seventeen stocks delivered cumulative returns greater than five million percent (or $50,000 per dollar initially invested), with the highest cumulative return of 265 million percent (or $2.65 million per dollar initially invested) accruing to long-term investors in Altria Group. Annualized compound returns to these top performers relatively were modest, averaging 13.47% across the top seventeen stocks, thereby affirming the importance of "time in the market." The highest annualized compound return for any stock with at least 20 years of return data was 33.38%, earned by Nvidia shareholders.

And FT writes

One pretty obvious factor stands out in Bessembinder’s list of superstonks: They’re all old companies that have been or were around for a very long time, and few (none?) are in what would now be considered glamorous industries. This hammers home the power of longevity and steady returns over racier stocks. Of the nearly 30,000 US stocks that appear in the CRSP database, the median lifespan is just 6.8 years. Only 31 companies are present across the 98 years it spans. Of the 30 greatest compounders compiled by Bessembinder almost all have over 90 years of stock market history under their belt. The youngest is Northrop Grumman, which went public in 1951. While the mean outcome over that near-century of data is a 22,840 per cent gain, the median outcome is a loss of 7.4 per cent, because over half of all the common stocks registered by CRSP have incinerated money.

4. As they emerge as among the biggest incremental consumers of energy with their energy-guzzling AI algorithms and data centres that host them, the Big Tech firms have embarked on a behind-the-scene mission to rewrite the accounting principles of measuring pollution from energy consumption in a manner that burnish their green credentials. This must count as the mother of all greenwashing!

Sample the numbers on the accounting miracle of net zero emissions achievement claimed by Big Tech firms.

Social media group Meta, for instance, says it has already hit “net zero” emissions in its energy usage. But FT analysis of its 2023 sustainability report shows that its real-world CO₂ emissions from power consumption the prior year were 3.9mn tonnes, compared to the 273 net tonnes cited in the report.

This is a description of the current accounting method and its problems.

Companies including Amazon, Meta and Google have funded and lobbied the Greenhouse Gas Protocol, the carbon accounting oversight body, and financed research that helps back up their positions... Each time a wind, solar or hydroelectric facility generates a unit of clean power, its owner can issue an energy attribute certificate, typically known in the US as a renewable energy certificate, or REC... Companies can purchase RECs “to buy-down their environmental impact”... Doing so helps buyers demonstrate the action they are taking to finance clean power and directs investment towards green energy development... Matthew Brander, a professor at the University of Edinburgh, says the system is akin to buying the right from a fitter colleague to say you have cycled to work, even though you arrived by a car that runs on petrol... At present, the certificates must come from the same defined geographic region as the pollution they are offsetting, such as Europe and North America, but not the same grid and not at the same time. That means the clean energy that offsets the emissions could be generated in a different country, at a different time of day — or even in the past...

But both timing and location matter in terms of real-world emissions. For example, one potential buyer hooked up to a coal-dependent grid and another on a much cleaner grid could buy the same certificate to offset one megawatt hour of power use — even though the emissions stemming from that usage will differ in each grid. The certificates are also very cheap. The average forward price of a single US renewable energy certificate to be bought in the next calendar year has been under $5 since at least 2022... Experts have questioned whether this is really enough to help incentivise the development of a new clean power project. Academics and experts... have shown that buying certificates typically did not drive either a new supply of renewables or a fall in emissions... Using certificates from one area while operating in another could allow buyers to understate their reliance on fossil-based electricity.

And this about the reform proposals proposed by the Big Tech companies

Google’s proposed solution is to only match energy consumption with clean energy and certificates from the grids where power is consumed, and to take the time of day of its electricity use into account... The company also argues that its approach incentivises engagement with local policymakers about how best to green their electricity grid and investments in a range of solutions, such as batteries... A rival perspective, spearheaded by Amazon, Meta and other members of the Emissions First Partnership lobby group, says that companies should be able to use certificates in a more flexible way with no restrictions at all on geographical origin.

Amazon and Meta thinks this same unit of power could be offset by certificates tied to renewable energy produced during the day in Norway, for example... also wants companies to get more credit for buying clean energy certificates from a dirty grid like India than a cleaner one like Norway’s, to reflect the carbon emissions that may have been displaced, or avoided, by the use of wind power... Academics say a crucial metric that neither approach addresses is ‘additionality’ — or checks that the clean power would not have been produced anyway without extra money from the sale of the certificates.

The stakes are very high

Large technology groups are already “by far” the biggest corporate buyers of RECs... They are also some of the “biggest players” in renewable power deals globally... Microsoft and asset manager Brookfield have teamed up to develop 10.5 gigawatts of generating capacity, enough to power the equivalent of about 1.8mn homes. The cost of adding 1GW of new capacity is around $1bn. Amazon, the largest corporate buyer of renewable energy, is also pouring money into wind and solar projects in countries, including India. It said “the majority” of its 100 per cent renewable energy goal was met in 2023 by investing in clean energy projects. It uses unbundled certificates to “bridge the gap” until some renewable schemes come online, but its use of them would “decrease over time”, it added. Meta said most of its power use was matched with renewable energy investments, including RECs, in the same grids as its data centres. It has invested in more than 8GW of operational renewable energy... 

Globally, the International Energy Agency has estimated that the electricity consumed by data centres will more than double by 2026 to an amount roughly equivalent to Japan’s current annual consumption. That expansion threatens the viability of Big Tech’s net zero targets. Microsoft’s emissions rose by 30 per cent between 2020 and 2023, while Google’s jumped by almost half between 2019 and 2023, increases that both companies blamed in part on the need for new data centres.
This is a serious smoking gun
The Bezos Earth Fund, Amazon founder Jeff Bezos’ philanthropic group, donated $9.25mn to the protocol last year and is also a major funder of the non-profit WRI, which co-administers the accounting oversight body.

5. FT reports that PwC China is about to be hit with a six-month business ban for its role in the audit lapses on collapsed property developer, Evergrande. The action comes after the country's securities regulator said Evergande had inflated its mainland revenues by almost $80 bn in the two years before its default in 2021 despite the audit certified by PwC which gave a clean chit to the company. It's expected that there would be fines in addition. 

6. Fascinating article about how TSMC is struggling to get American workers acclimatised to its intense work culture in its under-construction facility at Phoenix, Arizona. 

7. Matt Stoller has an article on abusive practices by the executives of Albertsons and Kroger, which are in the process of a controversial merger that's being litigated in courts. 

Kroger and Albertsons are both monsters, and the two of them combining would create the second largest chain in the country, after Walmart, with 15% of the national grocery business. Kroger/Albertsons would employ over 700,000 people, have over $200 billion in revenue and more than 40,000 private label brands, and own and operate brands such as Safeway, Ralphs, Smith’s, Harris Teeter, Dillons, Fred Meyer, Vons, Kings, Haggen, Tom Thumb, Star Market, Jewel-Osco, and Shaw’s.
8. Rental housing market intervention by the Labour government in the UK in an effort to encourage the building of affordable homes.
UK chancellor Rachel Reeves intends to introduce a 10-year formula in October’s Budget that will increase annual rents in England by the CPI measure of inflation — currently 2.2 per cent — plus an additional 1 per cent, according to government insiders. The move is aimed at encouraging the building of more affordable homes by providing certainty over cash flows to housing associations and councils — which are grappling with heavy debt burdens and large maintenance backlogs. In recent years local authorities have almost stopped building homes, leaving housing associations — not-for-profit organisations — to build most new social housing in the UK. The government sets rent levels in subsidised social housing using a national formula. Guaranteeing higher rents will delight housing associations but could worsen the cost of living for millions of tenants and could land the government with a much higher benefits bill... The previous Conservative government made a similar promise in the early 2010s but ministers subsequently ripped it up on several occasions. David Cameron’s coalition set a 10-year annual rent settlement in 2012 based on the retail price index, plus 0.5 per cent. But then-chancellor George Osborne reneged on the agreement in 2015 with four years of below-inflation increases in order to reduce housing benefit costs for the Treasury. More recently, the Conservative government announced a five-year settlement of CPI plus 1 per cent in 2020, but was then forced to cap rent increases at 7 per cent following a jump in inflation to more than 11 per cent in 2022. It extended the settlement for one further year this April.

9. Farm subsidies world over are cornered by the richer farmers.

But between 1995 and 2023, some 27 per cent of subsidies to farmers in the US went to the richest 1 per cent of recipients, according to NGO the Environmental Working Group. In the EU, 80 per cent of the cash handed out under the CAP goes to just 20 per cent of farms.

10. Interesting facts about US manufacturing jobs.
The US was once the world’s manufacturing powerhouse, producing more steel, automobiles and consumer goods than any other nation. Employment in the sector peaked at 19.55mn in 1979 when manufacturing jobs accounted for one in five American workers. But decades of outsourcing to lower cost economies in Asia and elsewhere have cost millions of jobs, particularly in rustbelt states such as Illinois, Indiana, Michigan, Missouri, New York, Ohio, Pennsylvania, West Virginia, and Wisconsin. As of May, there were 12.96mn people working in manufacturing jobs, less than 10 per cent of the US workforce and slightly up from 12.81mn in 2019, according to the Bureau of Labor Statistics. China overtook the US as the world’s biggest manufacturer in 2010.

And solar industry competitiveness of the US and China

Multiple firms estimate China produces more than double global demand for panels, and BloombergNEF has warned that rapid innovation in south-east Asia, where the US sources the bulk of its solar panels and cells, means US factories risk being uncompetitive by the time production comes online... The panels made overseas are far cheaper than domestic ones. US-made crystalline silicon panels generate energy at an average cost of 29.5 cents per watt, according to BloombergNEF. A panel sourced in south-east Asia, meanwhile, can cost under 16 cents per watt, and in China, it is 10 cents per watt.

11. Finally, amidst a takeover threat from a Canadian retailer, NYT has a good article on why 7-eleven stores are a national institution in Japan.

7-Eleven is “one of the best brick-and-mortar retail businesses in the world,” said Hiroaki Watanabe, an independent retail analyst. Selling 7-Eleven to Couche-Tard would be, for Japan, “equivalent to Toyota becoming a foreign company,” he said. In fact, 7-Eleven started out an American convenience store chain, operated by Southland Corporation, in Dallas in 1927. It opened its first store in Japan in 1974, featuring popular American items like hamburgers. It was an instant success in Japan and within two years had expanded to 100 stores. In 1991, a Japanese supermarket operator, Ito-Yokado, and 7-Eleven Japan acquired 70 percent of Southland’s shares. In 2005, 7-Eleven became wholly Japanese-owned through a holding company, Seven & i. Today, Seven & i has more than 21,000 7-Eleven stores in Japan and operates in 20 countries and territories. In the United States, Seven & i has been exploring ways to replicate the much-coveted Japanese convenience store experience... Today, Seven & i has more than 21,000 7-Eleven stores in Japan and operates in 20 countries and territories. In the United States, Seven & i has been exploring ways to replicate the much-coveted Japanese convenience store experience.

Tuesday, August 20, 2024

Some observations on WDR 2024 and increasing national incomes

The World Development Report (WDR) 2024 is out and it’s about avoiding the middle-income trap and presents a strategy for developing countries to reach high income status. The report has several useful insights and is a good documentation of the challenges associated with the middle-income trap. 

This post comments on the report and questions a few important assumptions and conclusions in the report. 

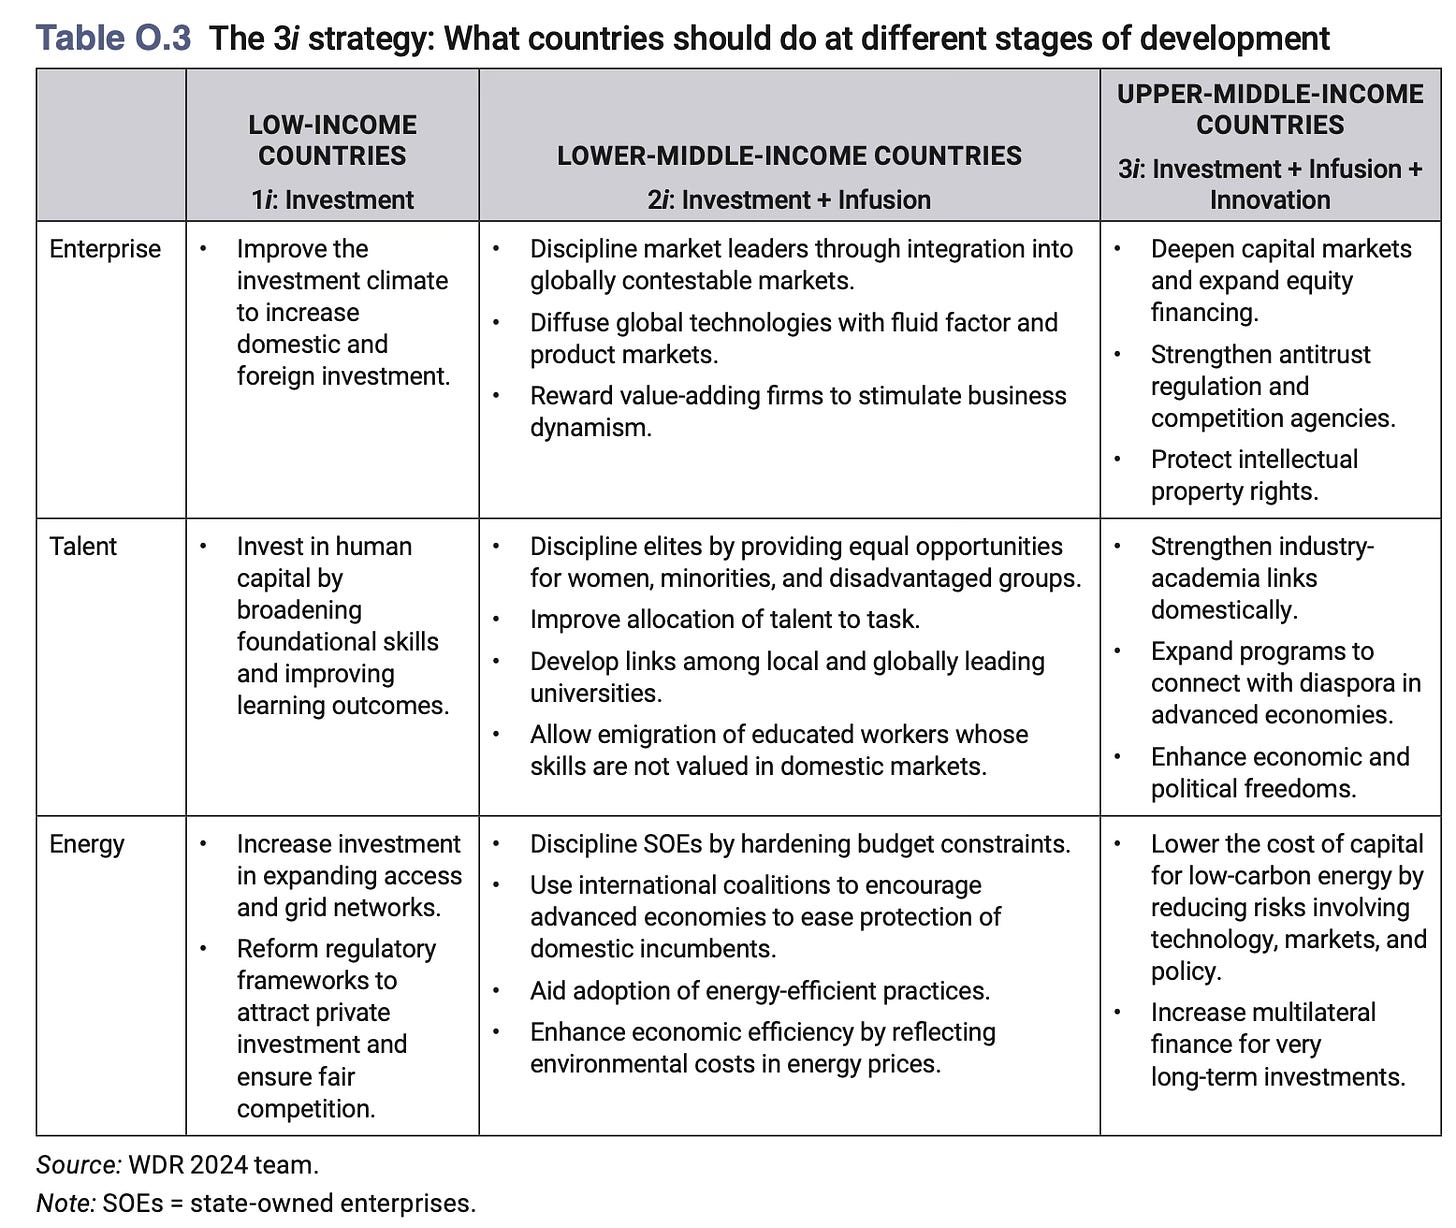
The report describes a three-stage path of transition to high-income status - investment, infusion, and innovation. Lower middle-income countries must transition from their predominantly investment-driven strategies to one where they “must also adopt modern technologies and successful business practices from abroad and infuse them across their economies”. This infusion is through the technology transfers embodied in the transfers of physical and financial capital. The upper-middle-income countries, in turn, should supplement infusion by adopting innovation and engaging at the global frontiers of technology. 

It uses the above framework to describe three processes essential for the Schupeterian creative destruction to play out - creation (where incumbents and entrants expand markets and technology frontiers), preservation (incumbents and elites tend to prefer the status quo and push back at change), and destruction (elimination of misallocated resources to free up the conditions that aid and resources required for creation). Middle-income countries currently face strong headwinds on all three processes. 

The report says that achieving a balance between the three processes requires a complement of policies that seek to discipline incumbent vested interests through competition regimes that encourage new entrants, reward merit by becoming better at accumulating and allocating talent across individuals and firms, and capitalise on crises by using the opportunities presented by the climate change to pursue greater energy efficiency and emissions intensity. The first weakens forces of preservation, the second strengthens forces of creation, and the third rides opportunistically to aid destruction. 

The table below captures the development strategy that the Report outlines. 

The report uses the case studies of three countries in particular to validate its case.

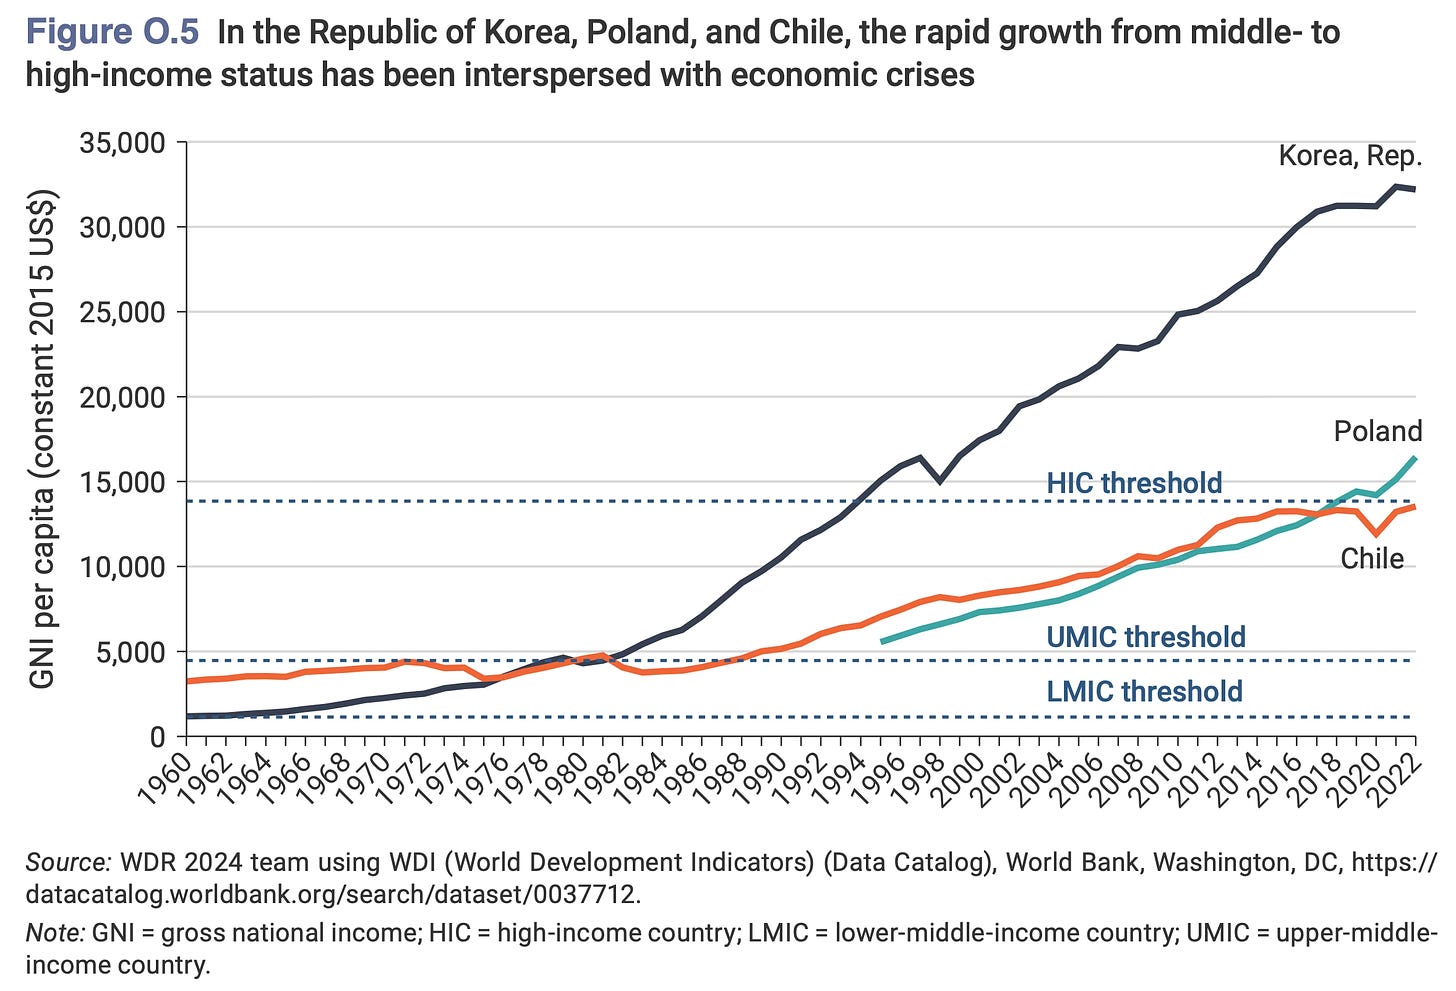
To the extent of the three case studies, the WDR 2024 is a ringing endorsement for industrial policy, albeit carefully calibrated and done in a very sophisticated and iterative manner. Sample this case study of South Korea

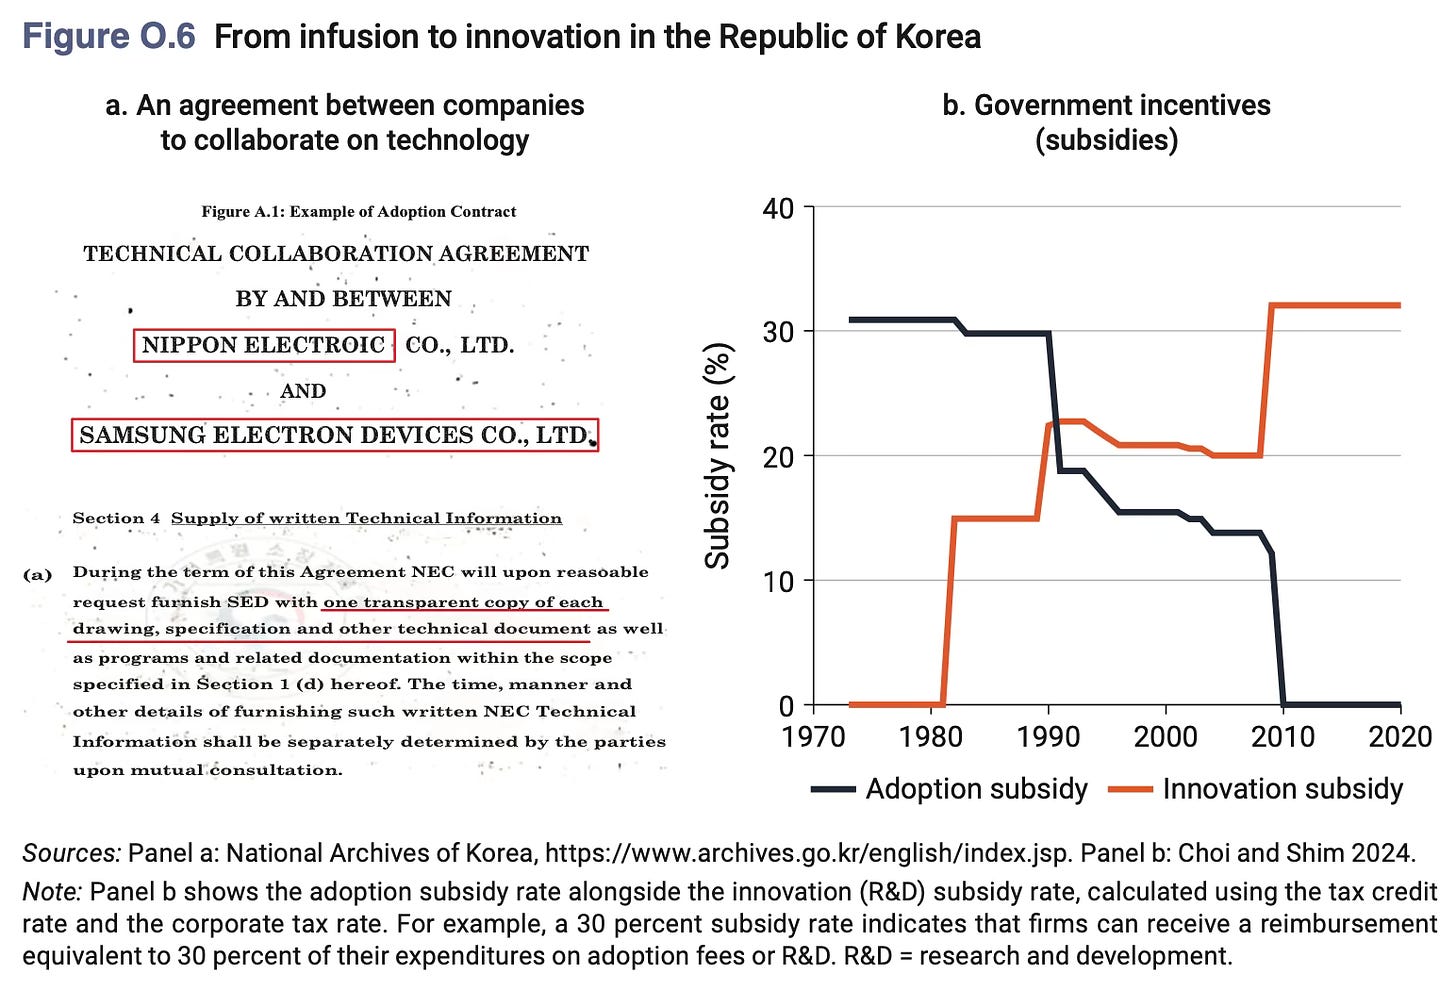
In the 1960s, a combination of measures to increase public investment and encourage private investment kick-started growth. In the 1970s and 1980s, Korea’s growth was powered by a potent mix of high investment rates and infusion, aided by an industrial policy that encouraged firms to adopt foreign technologies. Firms received tax credits for royalty payments, and family-owned conglomerates, or chaebols, took the lead in copying technologies from abroad—primarily Japan. As Korean conglomerates caught up with foreign firms and encountered resistance from their erstwhile benefactors, industrial policy shifted toward a 3i strategy supporting innovation. Then, as Korean firms became more sophisticated in what they produced, they needed workers with specialized engineering and management skills. The Ministry of Education, through public universities and the regulation of private institutions, did its part, setting targets, increasing budgets, and monitoring the development of these skills.

Or Poland

In the early 1990s, Poland underwent a transition from a planned economy to a market economy. It has since boosted its income per capita from 20 percent of the average for the European Union to 50 percent. What is Poland’s winning strategy? It began by disciplining the large state-owned enterprises (SOEs). It hardened their budget constraints by cutting subsidies, tightening bank loans, and liberalizing import competition—including at the iconic Stocznia GdaÅ„sk shipyard, where the Solidarność (Solidarity) movement began. This discipline paved the way for comprehensive reform. In Polish SOEs, managers shifted their focus from production targets to profitability and market share, and they upgraded firms’ capabilities to prepare for privatization. Poland then built on this foundation to attract investment, focus on infusion next, and turn to innovation last. It followed this sequence largely by raising productivity with technologies infused from Western Europe—a process accelerated in the 2000s by its entry into the EU common market, which spurred foreign direct investment. Poland also increased tertiary education rates from 15 percent in 2000 to 42 percent in 2012. Educated Poles put their skills to work across the European Union, opening another channel to infusing global knowledge into the Polish economy.

All this is good theory and offers several useful insights. But the framework that the WDR 2024 hangs on struggles when examined with respect to empirical evidence. This post will use the example of India to highlight the point. 

First some interesting insights. It does a good work of listing the policy requirements for middle-income transitions - exposure to global competition, connect local firms with market leaders, reduce factor and product market regulation, avoid coddling small firms or vilifying large firms, let go of unproductive firms, strengthen competition agencies, deepen capital markets etc. 

The report has a Box item that describes incumbents in a comprehensive manner - firms, technologies, countries, elites, and men. This is an important insight, often forgotten in the analysis surrounding development and economic growth. These incumbents exert significant force of preservation that prevents everyone else from accessing opportunities and contributing to economic growth.

Preservation insulates members of social elites from the forces of destruction that, in a more open society with meritocratic institutions, might dissipate their advantages in wealth and privilege. The same forces ensure that, beyond elites, few children will get the chance to climb to a higher rung on a country’s income ladder than that occupied by their parents. So, income inequality remains high and social mobility remains low, transmitting inequality across generations, exacerbating the inequality of opportunity. 

Three kinds of preservation forces perpetuate social immobility in middle-income countries, shutting out talent from economic creation. The first force is norms—biases that foreclose or limit opportunity for women and other members of marginalized groups. Next are networks—above all, family connections. And the last force is neighborhoods—regional and local disparities in access to education and jobs.

This is a very important insight to be kept in mind. Developing countries, and more so large ones like India, have little chance of sustained growth without broadening the base of those participating productively in the economy. This goes beyond firms and individuals to include gender, regions, castes, and religions.

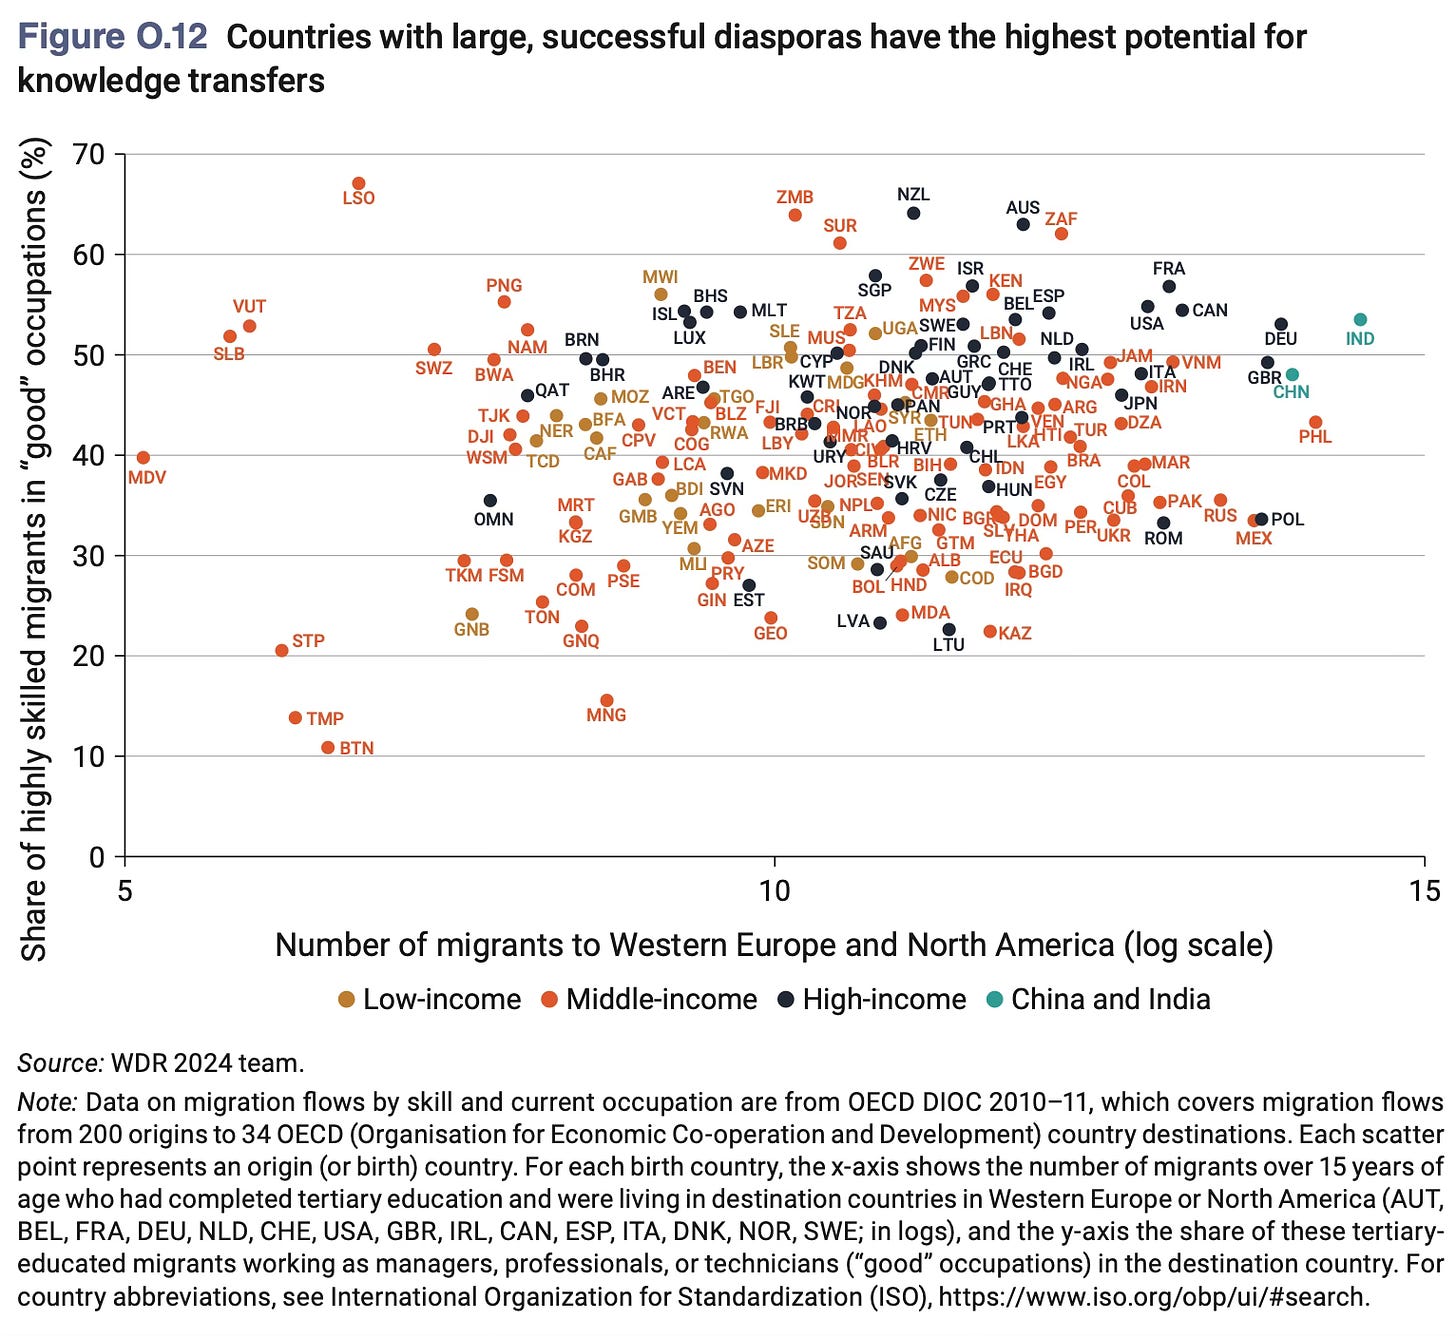
The report also points to the value of diaspora to a country’s growth prospects. An area where India appears well placed to capitalise is in the knowledge transfers from its vast diaspora. On this issue, it would be useful to cut through the clutter and get a sense of how much its large highly skilled and influential diaspora in the US, especially those in the highest echelons of finance and technology, have uniquely engaged with the Indian economy. What have been their contribution, over and above what would have happened anyways given the size of the Indian economy and its recent growth trajectory? What are the signatures of such engagement? How much of the high net-worth wealth and high-skill entrepreneurship have found their way back to investment and business creation in India?

While there are no studies that indicate so, despite its very large highly skilled and influential diaspora in the US, I cannot think of much by way of direct benefit to the Indian economy from the diaspora by itself. This contrasts with China, where many of the large manufacturing and industrial giants of today emerged from entrepreneurs who studied and worked in the US and elsewhere and returned to their homeland. As an illustration, while high levels of US corporate world is populated by a disproportionately high share of talented Indians, it’s striking that there are hardly any Chinese at those levels. Is it the case of the Chinese counterparts choosing to return to work in their country?

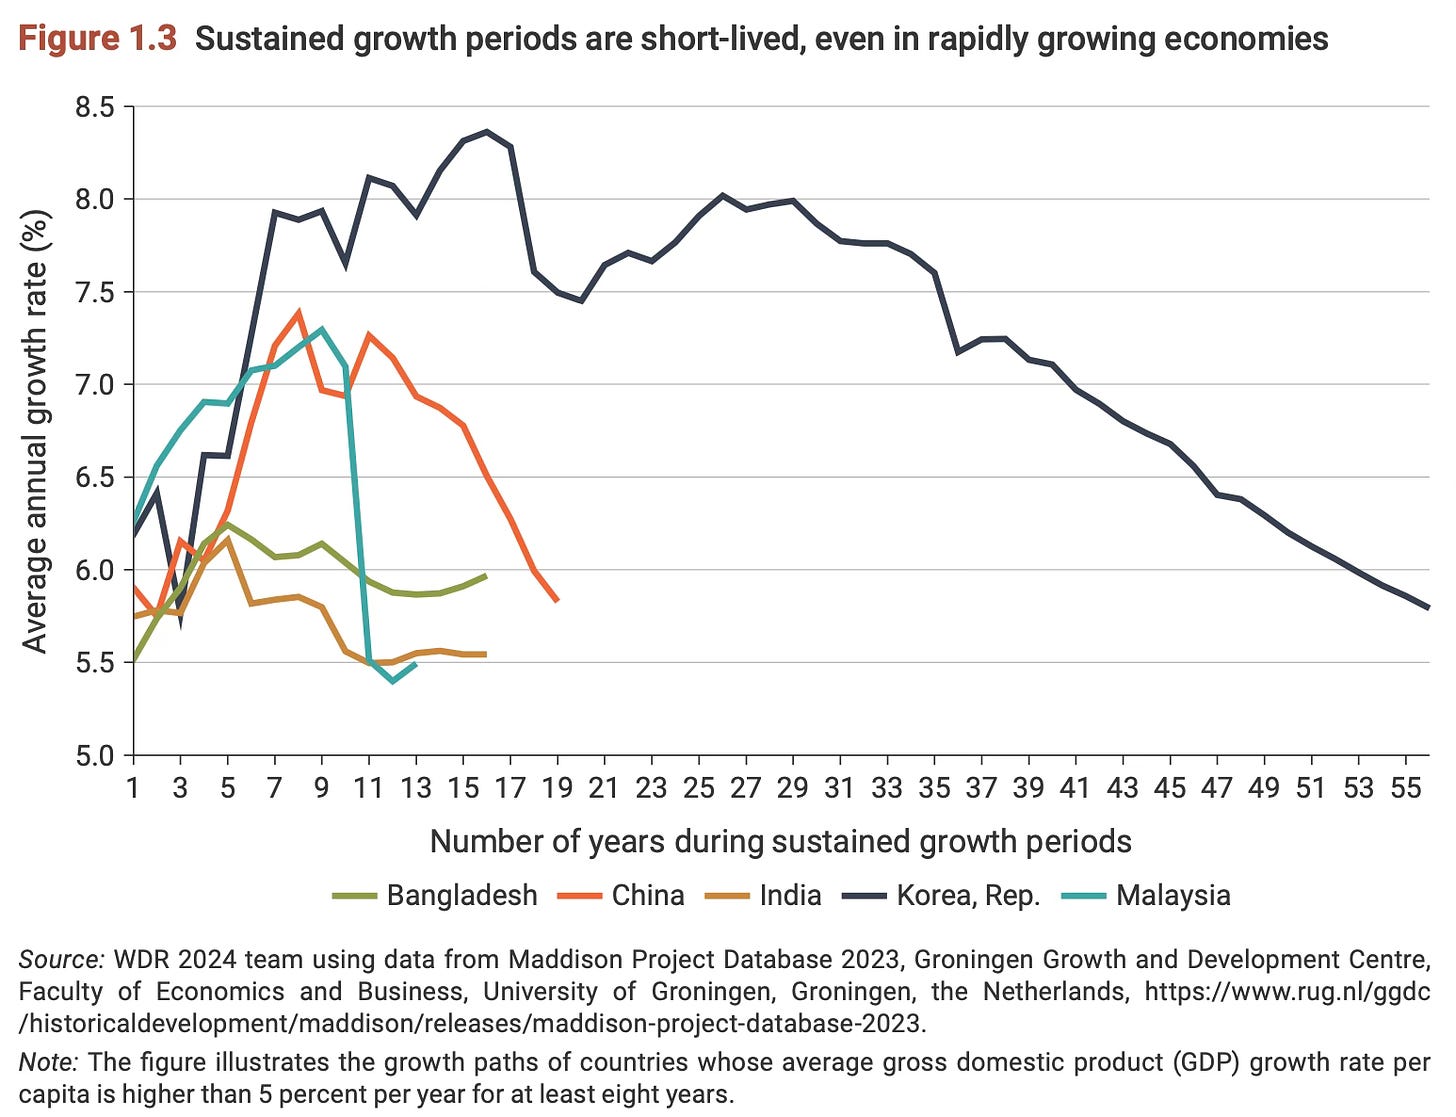
The report shows that sustained growth episodes are short. And India’s has so far been a lot shorter than that of others. 

Now some critical observations about the findings in the report:

1. For a start, India’s current challenge is not so much escaping the middle-income trap as crossing even the upper middle-income threshold. The same is the case with most of the other large middle-income countries. By positing the middle-income trap, we are getting far ahead of the game. 

2. I’m not sure about this

It is unlikely that industrial policy will enable countries to leapfrog from an investment- and manufacturing export–driven model to an innovation-oriented model or services-led model of economic growth. The development literature is littered with reports recommending a leap from investment to innovation, skipping the stage of painful reforms to attract foreign investment and ideas.

I’m not sure whether this argument has any empirical basis. There’s a strong element of ideology here, one where the orthodoxy of openness to foreign investment must be qualified with foreign investment that’s contingent on technology transfers and significant value addition. 

This becomes especially important given the presence of China and its beggar-thy-neighbour industrial policy. In fact, I’ll venture out and argue that instead of accusing developing countries of not pursuing orthodox openness, the WDR should be accusing them of pursuing openness which does not place adequate safeguards against the decimation of local manufacturing bases by cheap Chinese imports. As I have blogged here, the problem of gradual destruction of the domestic manufacturing base arising from openness to cheap Chinese imports is a major problem facing developing countries today. 

To put the China issue in perspective and the near impossibility of competing with them in many areas, consider this.

Starting production of solar panels in India from raw materials, such as quartz minerals, would be at least 40 per cent more expensive than in China. This cost difference reduces to 25 per cent if he uses imported polysilicon wafers and decreases to 3 per cent if he uses solar cells imported from China… producing solar modules from raw materials is too costly… This is similar to India’s smartphone sector, which relies on imported subassemblies, and the electric vehicle (EV) battery industry, which depends on imported lithium cells. Most manufacturing happens abroad in both cases, and more than 85 per cent of the components are imported. The high-cost difference between India and China is partly due to India’s higher cost of production inputs and China’s subsidies for its firms. For example, in India, the capital cost for businesses is 9-10 per cent, compared to 4-5 per cent in China. Industrial electricity in India costs $0.08 to $0.10 per kWh, while in China, it’s $0.06 to $0.08.

3. A related point made in the report is that about contestability of markets 

Contestable markets—and the institutions that enable them—are vital for middle-income countries that aim to become global supplier and sustain rapid economic growth through sophistication and scale… A key part of contestability is openness to foreign investors and global value chains that give domestic firms access to larger markets, technology, and know-how and allows them to add value and grow. And they are encouraged to make use of that access, thereby exposing domestic firms to competition, but also inspiration, from international firms that operate at or near the global technology frontier. Firms at home can seize the opportunity to infuse technology, increase the sophistication of their operations, and scale up, or they can keep doing business as usual and be eased out.

Again, there’s a nuance missing. Yes, contestability and competition are essential. But it’s one thing to open the country to foreign investments but an altogether different thing to open up for imports. While contestability arising from trade liberalisation invariably follows the opening up, the same cannot be said about investments. Investment liberalisation takes time and effort to realise actual investments, if at all. FDI does not come merely by opening up the economy and requires efforts at multiple levels to relax entrenched economic and other constraints. Further, as developing countries are finding out, contestability arising from trade liberalisation is double-edged in so far as it ends up swamping the country with cheap Chinese products and destroying the local industry. 

The examples of how Chilean and European companies in the period from 2000-07 benefited from Chinese imports are deceptive. For one, the Chinese competition was in its early stages then and not distorted to the same extent as now by subsidies. Besides, the Chinese competition then was in the less sophisticated products. And the European companies engaged from a position of high competitiveness given their strong manufacturing base. The situation is very different today and in the context of countries like India. 

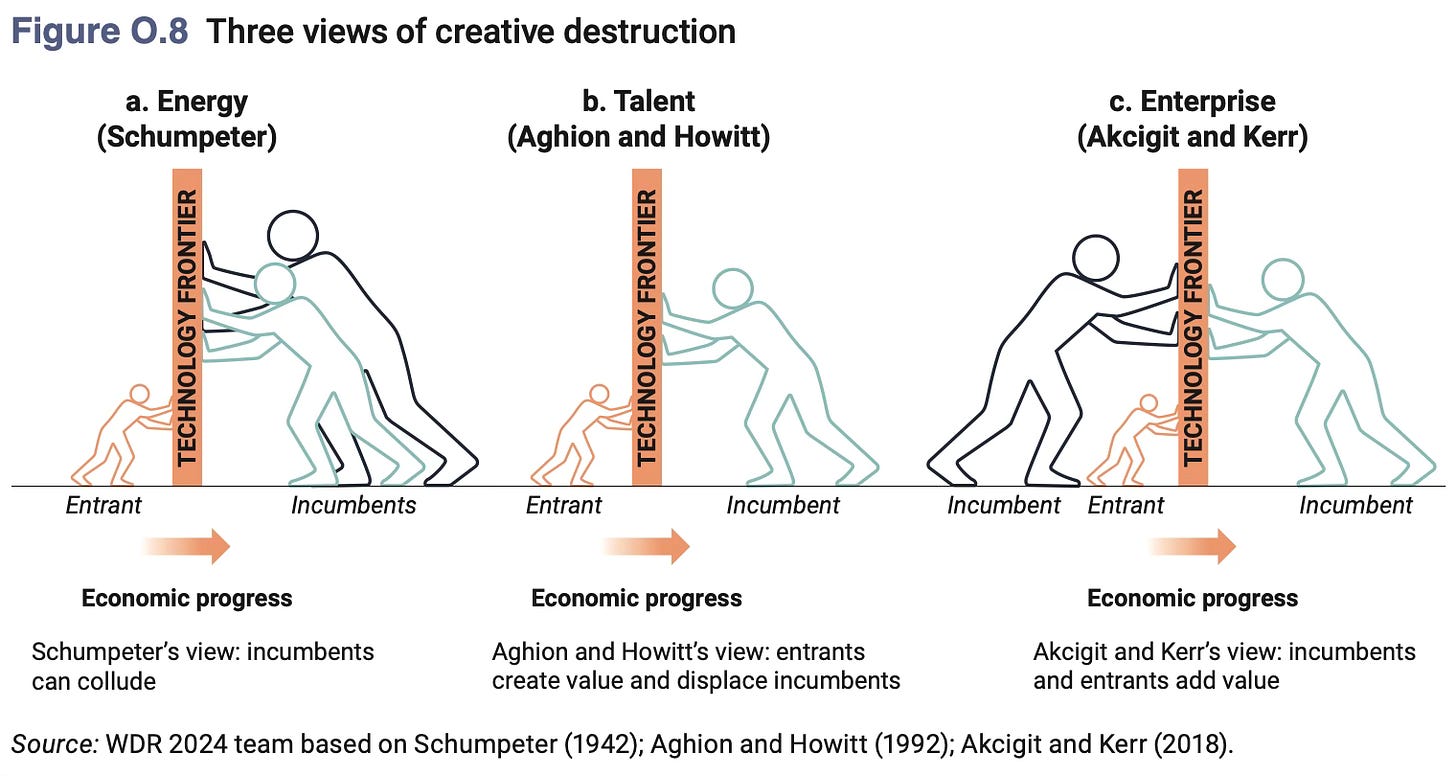
4. The report uses the Schumpeterian framework of creative destruction and the role that new entrants can play in triggering competition, creating value and displacing incumbents. 

There’s nothing inevitable or market-driven about this dynamic. Economies can get stuck in multiple equilibriums. Instead, this dynamic requires an active government role in co-ordination and relaxation of constraints.

Take the example of India’s textiles, footwear, food processing, consumer electronics and durables, capital equipment, automobile, and solar manufacturing sectors. While there are a few large domestic firms in some of these sectors, I cannot think of entrants over the last twenty years that have grown to become dominant firms in their sectors, leave aside become large exporters. How many entrants have emerged as competitors in India’s entire consumer durables or capital equipment or textiles or footwear market? How many entrants are there to validate the Aghion-Howitt thesis that they create value, displace incumbents, and become protagonists of economic growth?

The creation and innovation parts are very hard. In an acknowledgement of the problem, the report points to one of the most important problems with the landscape of manufacturing and industries, the low rates of productive business creation and deficient dynamism among incumbents. 

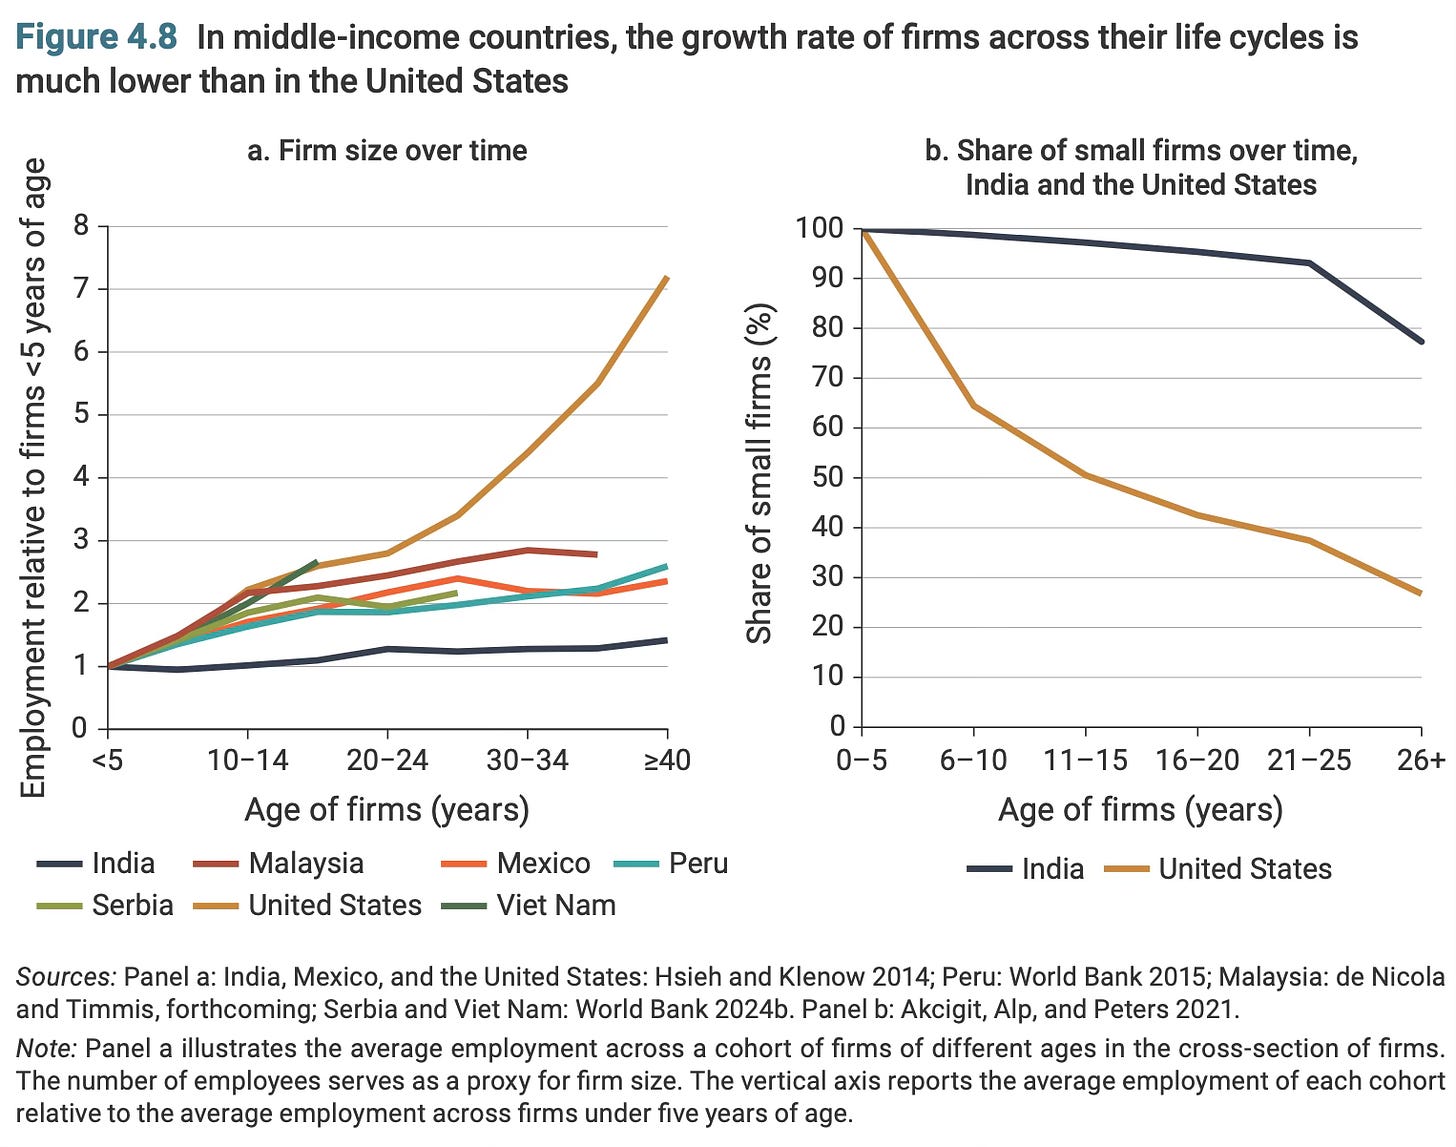
The forces of creation are weak in middle-income countries. In India, Mexico, and Peru, for example, if a firm operates for 40 years, it will roughly double in size. In the United States, the average firm that survives that long will grow sevenfold. For firms in middle-income countries, this implies a “flat and stay” dynamic: firms that fail to grow substantially can still survive for decades. By contrast, for US firms the dynamic is “up or out”: facing intense competitive pressure, a few entrepreneurs will expand their businesses rapidly, while most others will exit quickly. Among the majority who exit the market, many will become wage earners at the most flourishing firms. 

In keeping with the flat and stay dynamics, firms in India, Mexico, and Peru tend to remain microenterprises: nearly nine-tenths of firms have fewer than five employees, and only a tiny minority have 10 or more. The longevity of undersize firms—many of them informal—points to market distortions that keep enterprises small while keeping too many in business. For example, a high regulatory cost attached to formal business growth may inhibit an efficient firm from gaining market share and driving out inefficient competitors. Such policy-induced distortions in middle-income countries result in misallocated resources, hampering creation and infusion at scale.

Given this, I’m not sure also about the third-generation Schumpeterian Akcigit-Kerr view of incumbents being spurred by competition from new entrants and foreigners, and increasing their productivity and innovating to the technology frontier. This view sees incumbent market leaders as bringing scale and advancing domestic industry towards the technology frontier. 

As I have blogged here, India’s private sector incumbents (and startups) have been remarkably slow and deficient in operating at the technology frontier across sectors. This lag is reflected in their very low R&D spending compared to peers even among the larger middle-income countries. In fact, scale manufacturing (this and this) has been an enduring deficiency of India’s business landscape, and remains so. 

For example, despite the head start enjoyed in pharmaceuticals, the Indian drugs industry has not managed to move up to pharmaceuticals value chain to formulations and drug discovery, much less emerge as large contract manufacturers of APIs of the kind their Chinese counterparts have become. The behemoth IT firms have struggled to come up with any major software products and are virtually absent in cutting-edge areas like cloud computing, artificial intelligence, the Internet of Things, and data analytics. The established domestic manufacturing firms in areas like capital equipment, automobiles, and consumer durables operate distant from the global technology frontier. Finally, even the much-hyped startup ecosystem struggles to innovate at the technology frontier. 

In areas like consumer electronics manufacturing, it has taken active industrial policy and nudging by the government through the likes of Make in India and Production Linked Incentives (PLI) scheme for even the limited breakthroughs that have been made. 

Similarly, there’s nothing inevitable about the movement up the value chain. So, for example, the dynamics of market forces will not gradually push India up the manufacturing value chain of mobile phones or solar panels in terms of increasing domestic value addition. The Indian mobile phone and solar panel manufacturing industries can remain stuck in the low-value assembly part of the value chain for a long time. As the experience of the North East Asian economies shows, there’s a need for active industrial policy to guide and push industries and businesses up the value chain. 

Orthodox economists will blame entry barriers and other constraints that prevent competition for the above problems and failures. But in a reasonably well-managed, macroeconomically stable, continental-sized economy, as India is, even with all constraints, there should have been at least a few Schupeterian examples. So what gives?

One explanation is that ideas and their adoption will be contingent on real-world challenges and constraints, many of which will remain no matter what. In these circumstances, active government engagement will be an essential requirement even with the Schumpeterian framework. 

5. An area of ideological faith among opinion makers and commentators everywhere is the belief that there are large amounts of foreign and domestic private capital willing to invest in developing countries. The argument goes that it’s not so much the capital availability per se, but the absence of good projects and investment opportunities. 

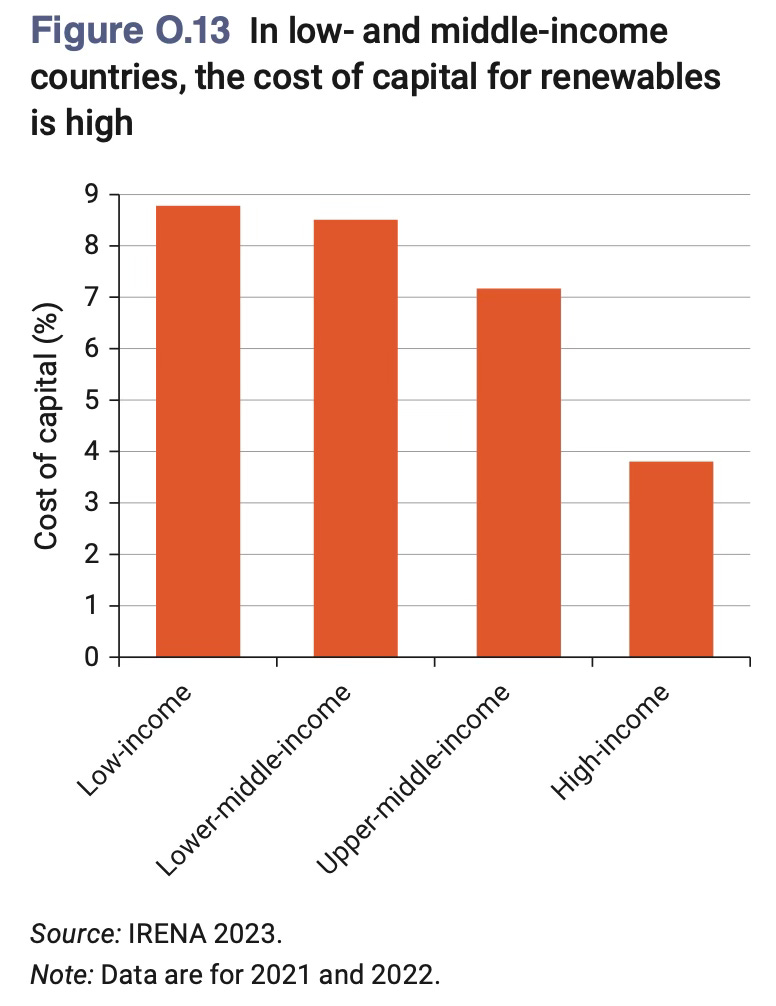
Instead, a more appropriate framing would be that private capital, debt and equity, and especially foreign capital, demand a rate of return that’s too high to be borne by the vast majority of investment opportunities available in any economy. There’s a circularity here - private investments are constrained by a lack of investment opportunities, and investment opportunities are limited by the prohibitive cost of capital and return expectations. 

It can therefore be said that one of the biggest impediments to accelerated investment in developing countries like India is their cost of capital and high return expectations of investors. As the graphic below shows, the cost of capital in low-income and lower-middle-income countries is more than double that in high-income countries. This will be higher once you add the layers of country and currency risks that foreign capital must bear. This 8-10 percentage points differential is huge and renders many investments unviable. 

Unfortunately, there are very few straightforward measures to bridge this gap. And, as I blogged here and here, the few that can bridge the gap somewhat require deep-rooted plumbing reforms. 

Projects and ideas/opportunities that routinely attract investments in developed countries struggle to find investors in developing countries. And that will remain a reality until those countries reach similar stages of development and incomes.

6. The report sees the climate change crises as an opportunity for developing countries. Yes, in theory, there’s an opportunity in so far as it provides these countries new investment opportunities and that too which can operate at the technology frontier. But in practice, this opportunity can be misleading. 

Consider the example of India’s solar industry. While the country has expanded its renewables generation capacity, it has struggled to gain even a toe-hold on solar and wind power manufacturing. And this is despite the leverage provided by the country’s massive capacity expansion potential. Econ 101 tells us that this context is ripe for the creation of domestic manufacturing facilities. Clearly, contrary to what’s being suggested in the report, openness and markets by themselves will not result in foreign investment and technology transfers. This example holds for several industries.

Then, there’s the issue of the costs associated with the green transition. I have written here in detail highlighting the serious limits to developing countries being able to use the green transition as an opportunity to boost their economic growth. 

In conclusion, developing countries face a Hobson’s choice. On the one hand, trade openness threatens to swamp the country with cheap Chinese imports, and destroy the local industry. The idea of import competition to improve the competitiveness of the domestic industry falls apart when faced with cheap Chinese imports. On the other hand, investment openness is a long route to change with several capabilities requirements and the national security vulnerabilities of relying on Chinese FDI, whose coming itself is questionable. 

I’ll argue that developing countries should pursue a three-pronged strategy, one shorn of any ideology or orthodoxy and which is grounded on strict prudence and realism. It’s also the one that Joe Studwell has very nicely articulated as the ingredients of the successful North East Asian economies. 

One, internally they should pursue an industrial policy that promotes domestic industries and businesses and disciplines them with subsidies and concessions that are linked to export competition. This would necessarily involve picking specific sectors and less so, firms, and supporting them and calibrating policy continuously to ensure that they keep moving up the value chain. This industrial policy should be cautious of being captured by domestic vested interests. 

Two, externally they should encourage foreign investment, but at terms that come with value addition and technology transfer. This would require policies that explicitly encourage joint ventures with big domestic companies, mandate domestic content requirements in the manufacturing investments and technology transfer conditions, and provide incentives that are linked to exports. 

Three, trade policy should be responsive to the threat posed by cheap Chinese imports and erect tariff and non-tariff barriers against them. While there’s a thin line here between protectionism and capture by domestic vested interests, this risk cannot allow the domestic industry to be invariably destroyed by cheap Chinese imports. 

There are serious limits to how smaller and even medium-sized countries can pursue such a strategy. But for large economies like India, there’s ample space to pursue the three-pronged approach indicated above. The danger though is its capture by vested interest and the lack of adequate state capabilities to implement them effectively.