As 2023 winds to a close, this post will highlight some graphics about the world we left behind during the year. The New York Times, Bloomberg, FT, The Economist, Goldman Sachs, McKinsey, Visual Capitalist, and World Bank have excellent graphics sections that cover the year in visuals and graphics.
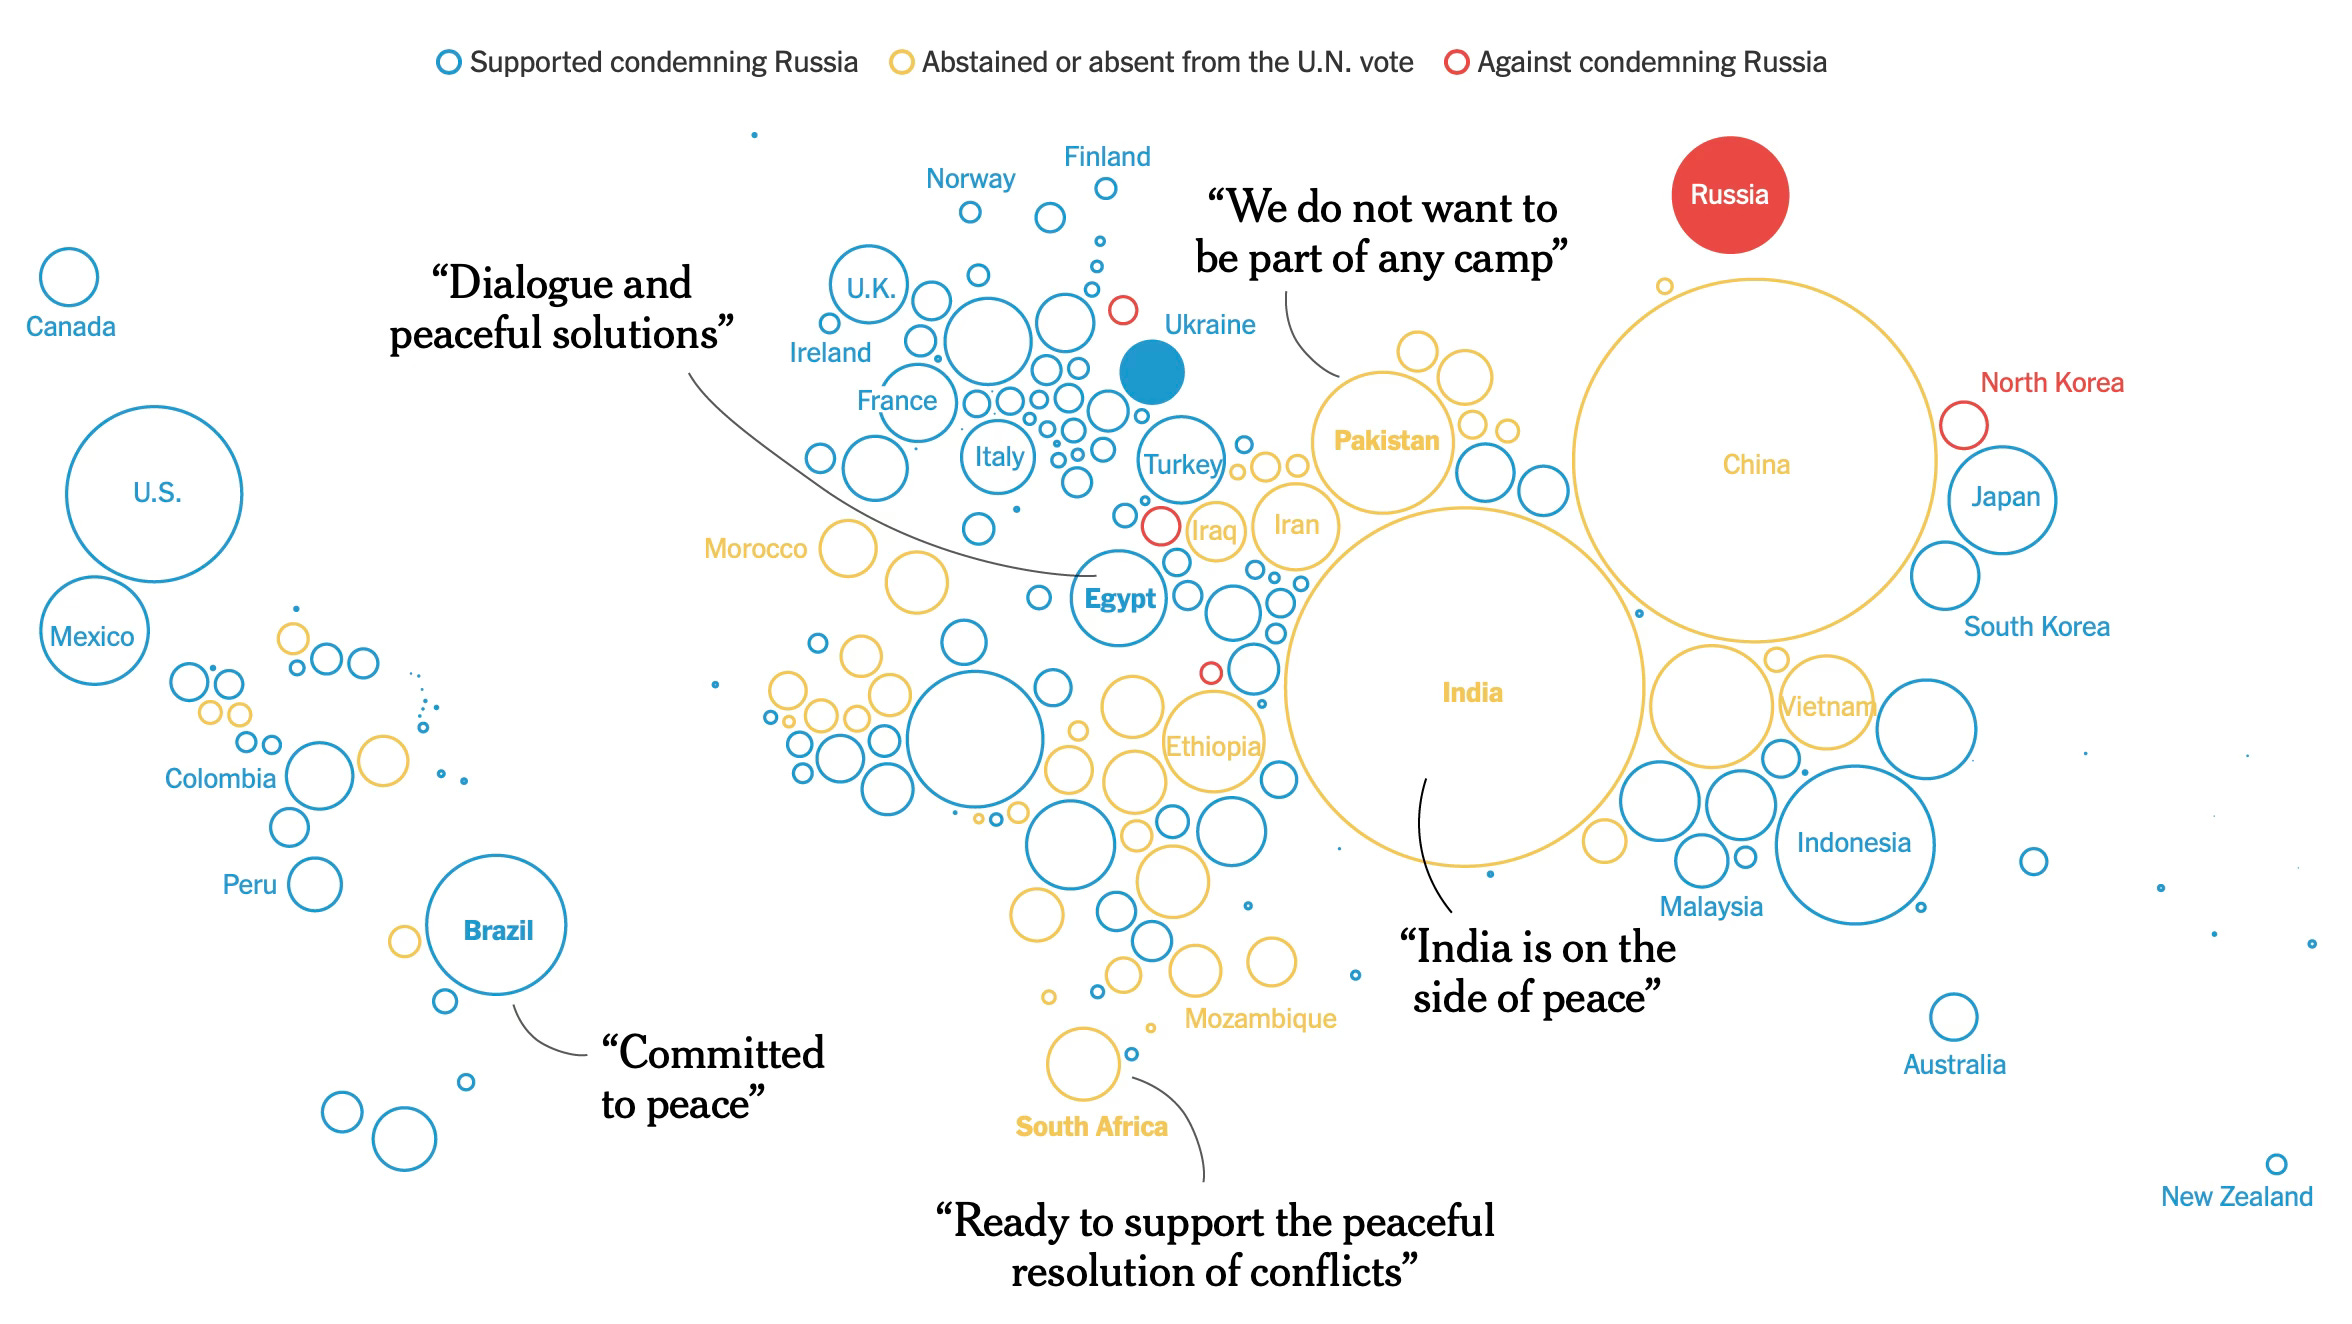
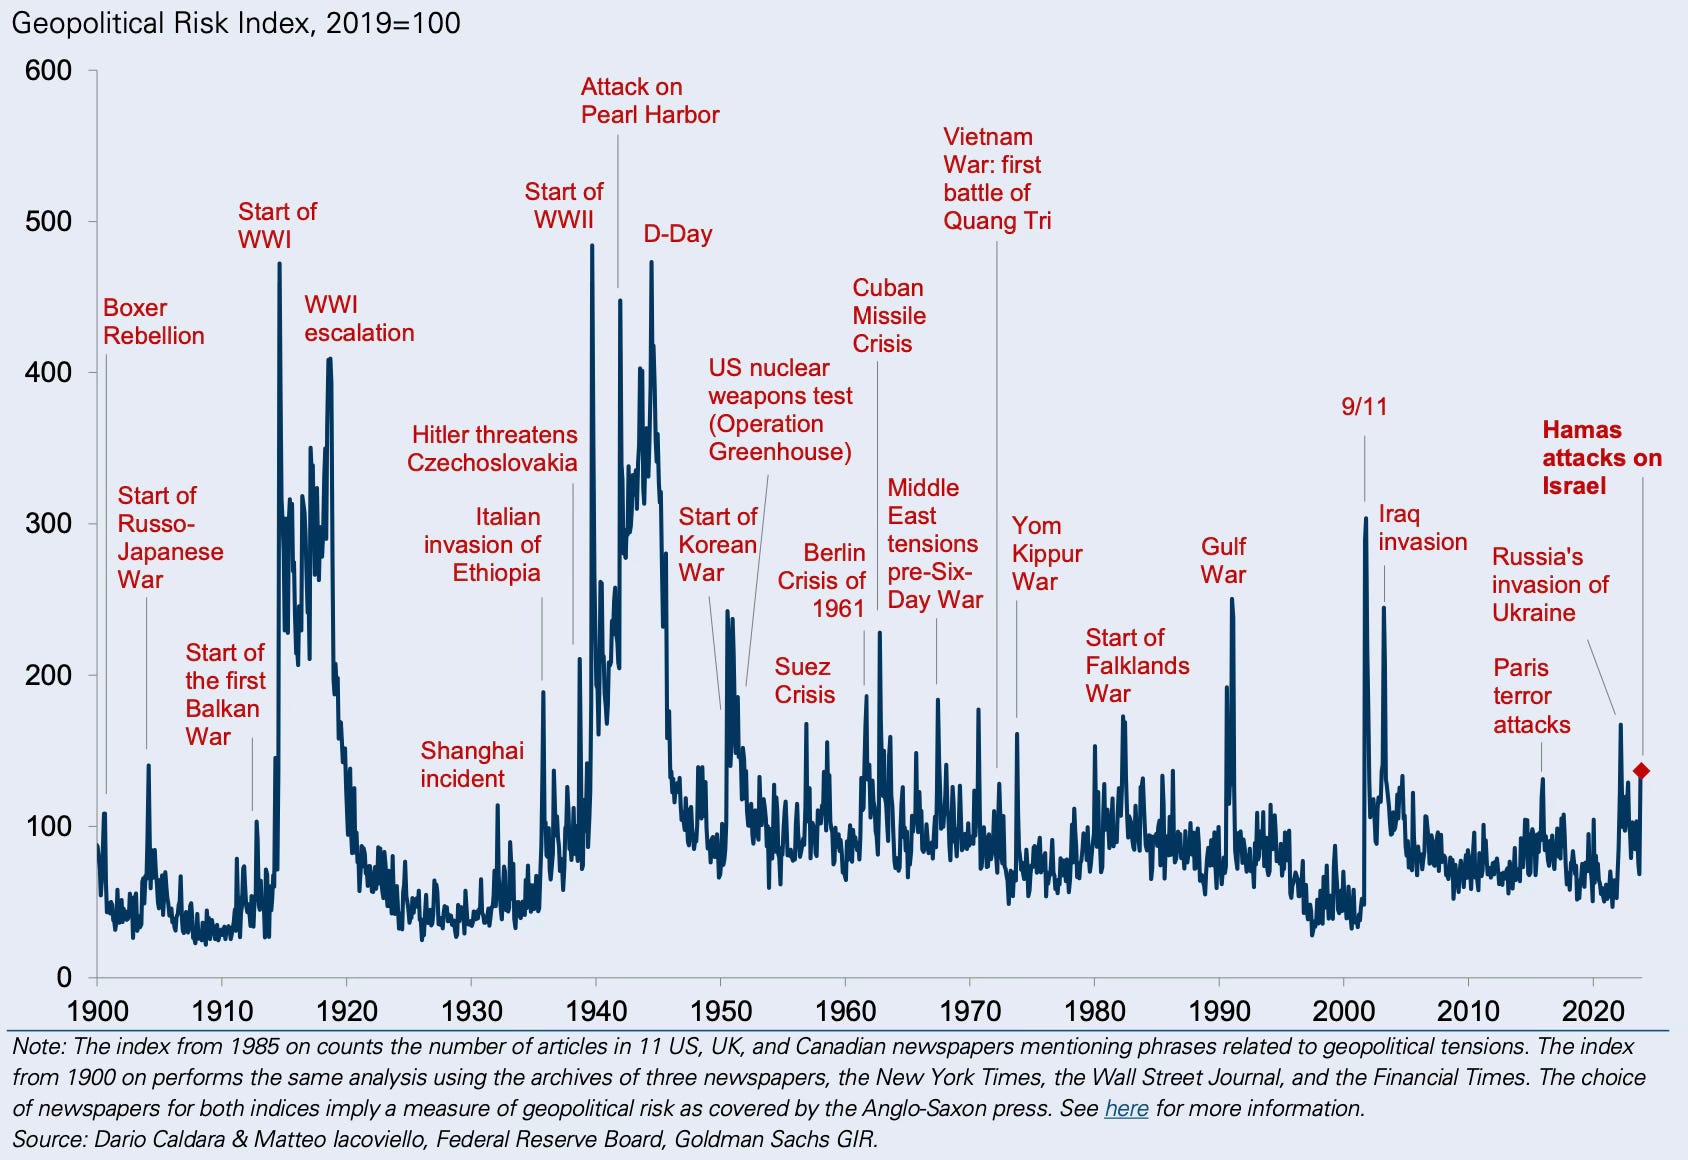
1. Arguably, the biggest event of the year should be the terrorist attack by Hamas in Israel and the latter’s genocidal bombings of Gaza Strip. The fatalities from the events already make it the deadliest in the region's bloody history, with the vast majority of victims being Palestinians. The global indifference, including within the Arab world, to a genocide of this scale is stunning.

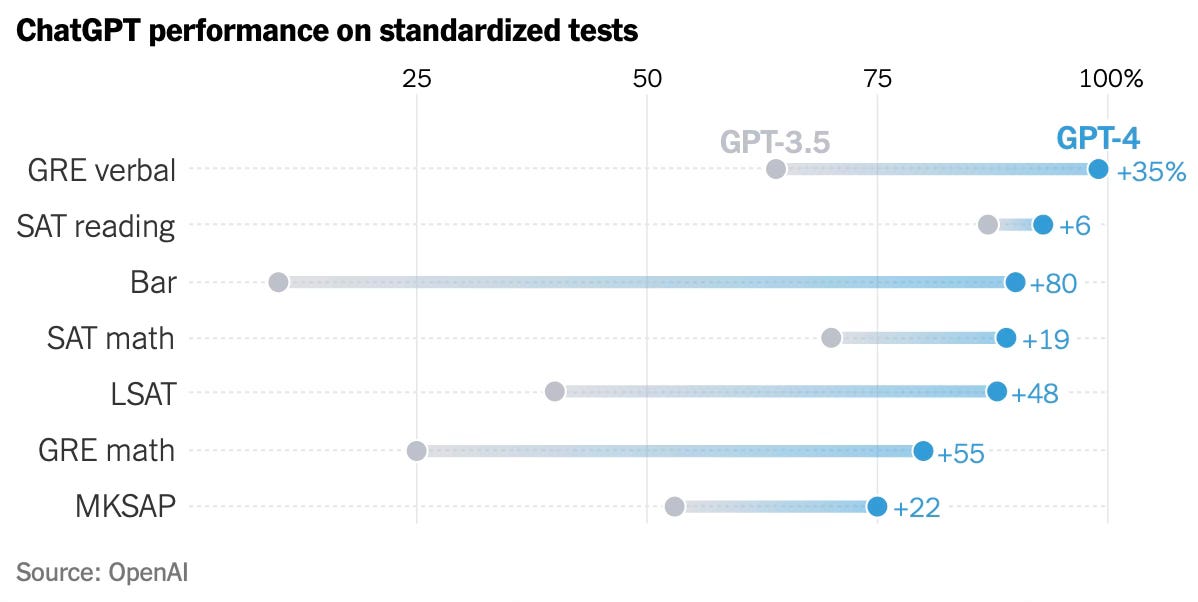
One study found that workers equipped with ChatGPT became 37 percent faster at basic writing and research tasks. The A.I. revolution showed no sign of slowing, either. The first version of GPT, developed in 2018, had 117 million parameters; 2020’s GPT-3 had 175 billion. GPT-4, released this year, has a trillion, according to a report by Semafor.
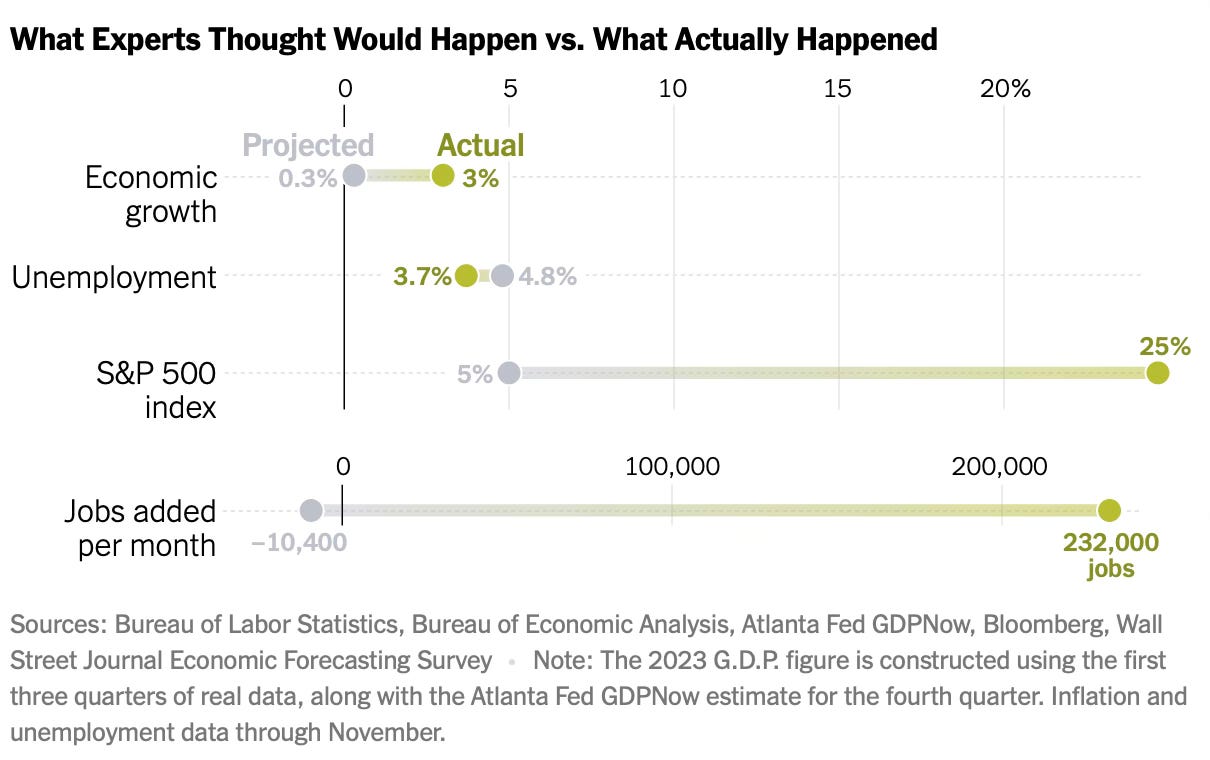
6. It’s also in line with how even central banks have got inflation forecasts so badly wrong in recent years (though the Fed did a good job with its 2023 predictions).
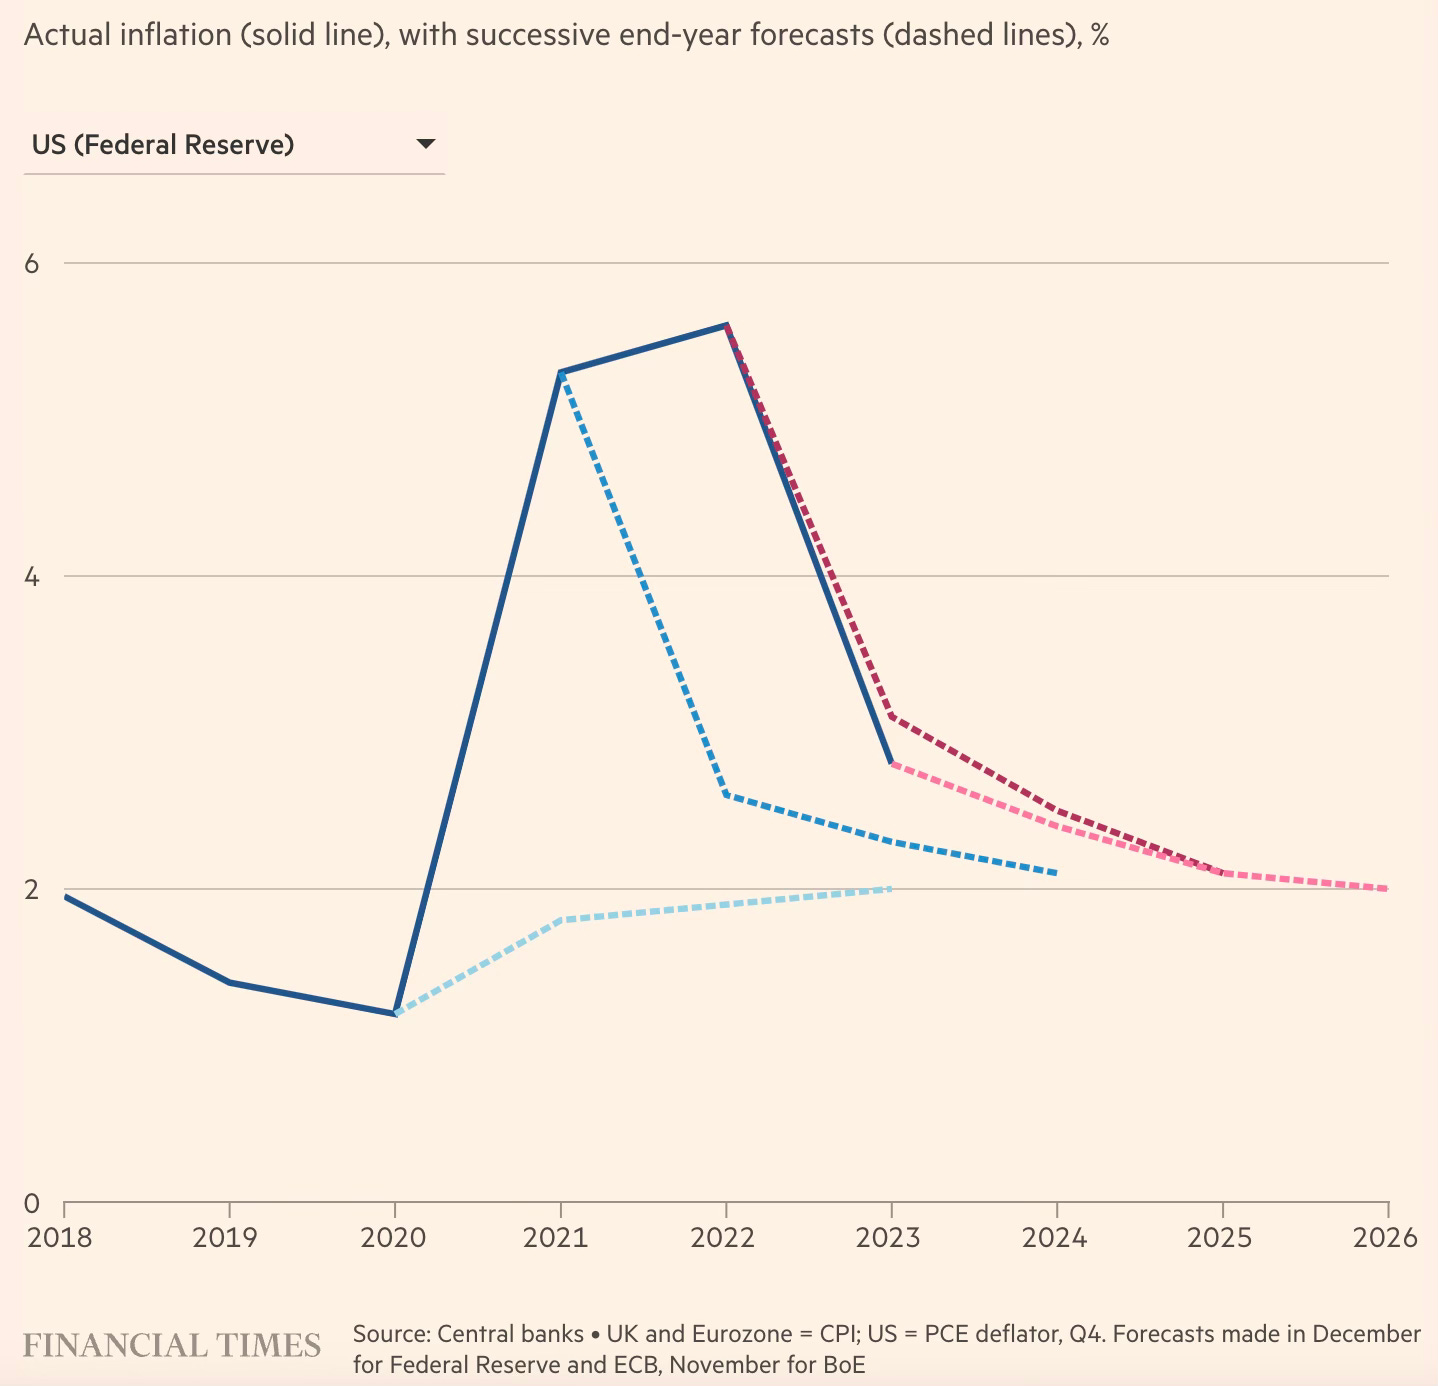
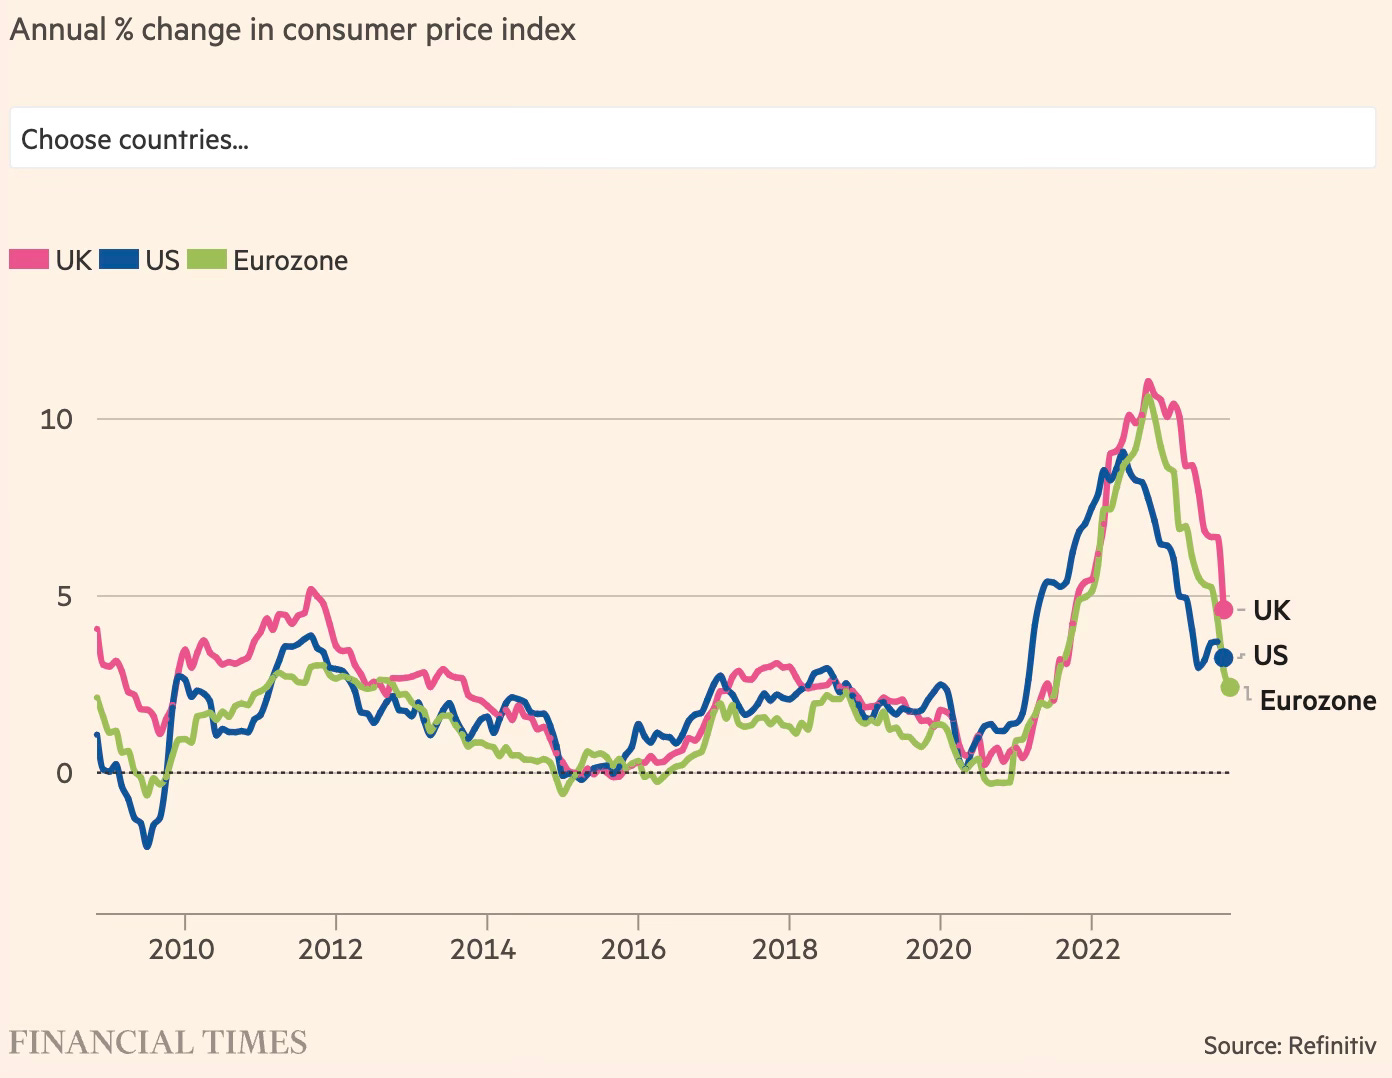
This is a good inflation tracker in the FT.
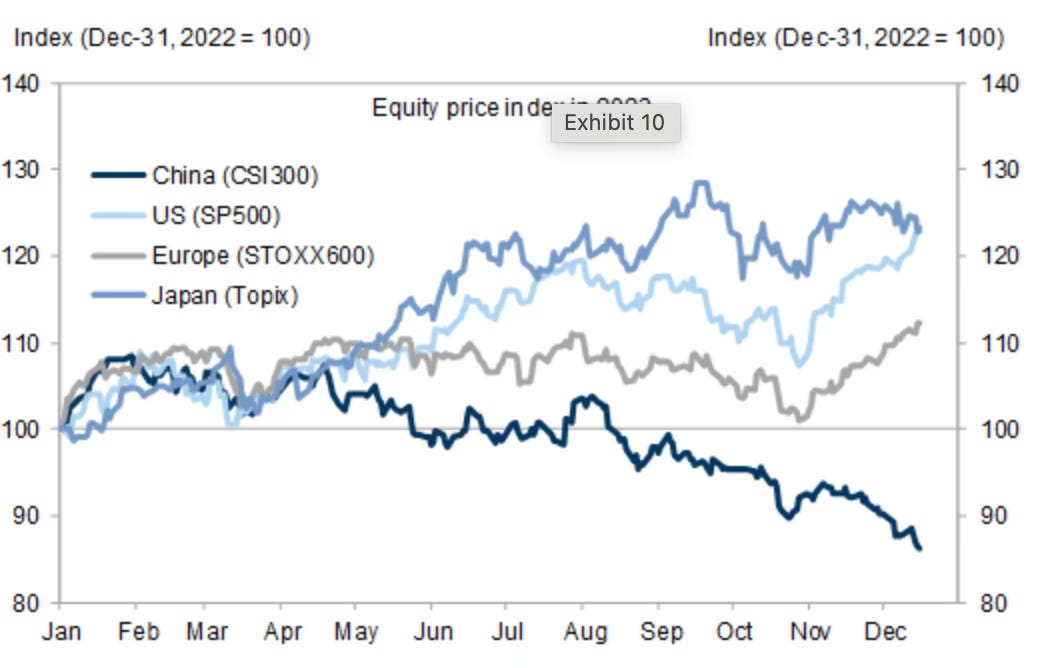
7. On equity markets, Japan was the standout while China was the laggard.

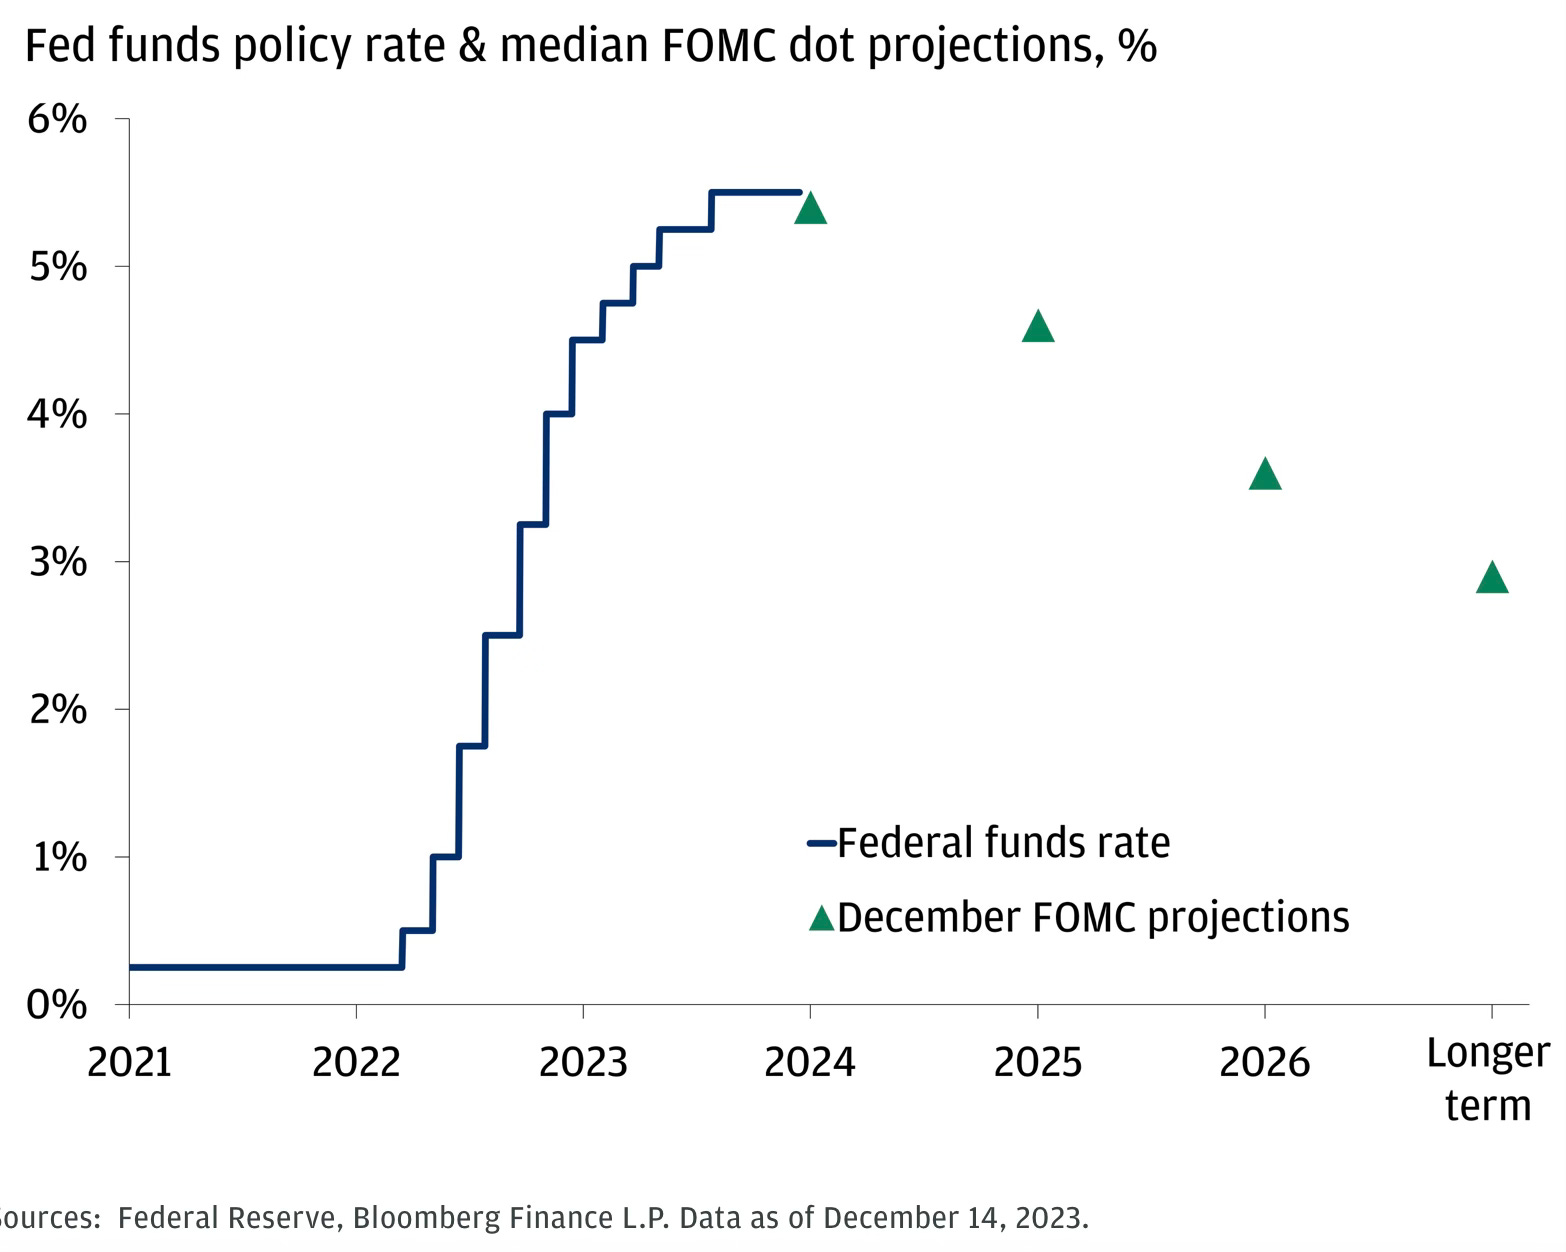
11. Accordingly, the US interest rates may have peaked.
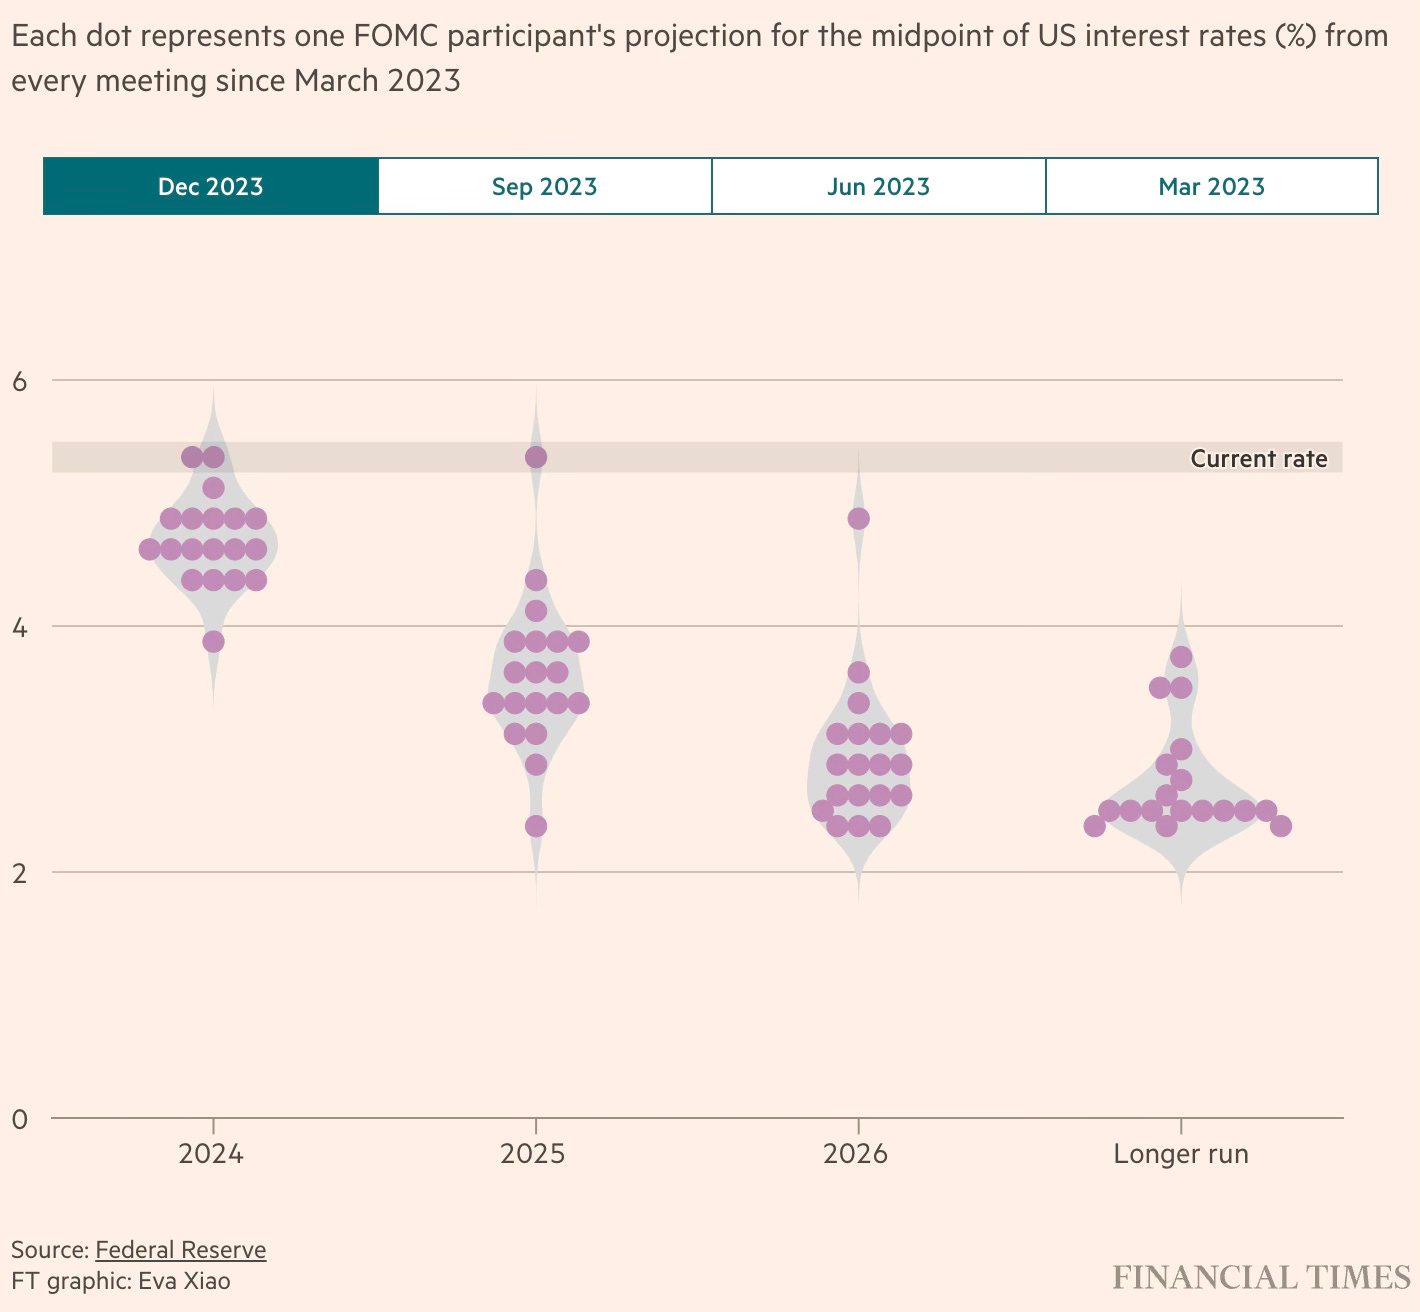
12. This represents the dot-plot forward guidance of US FOMC members in their last meeting on December 13, 2023.
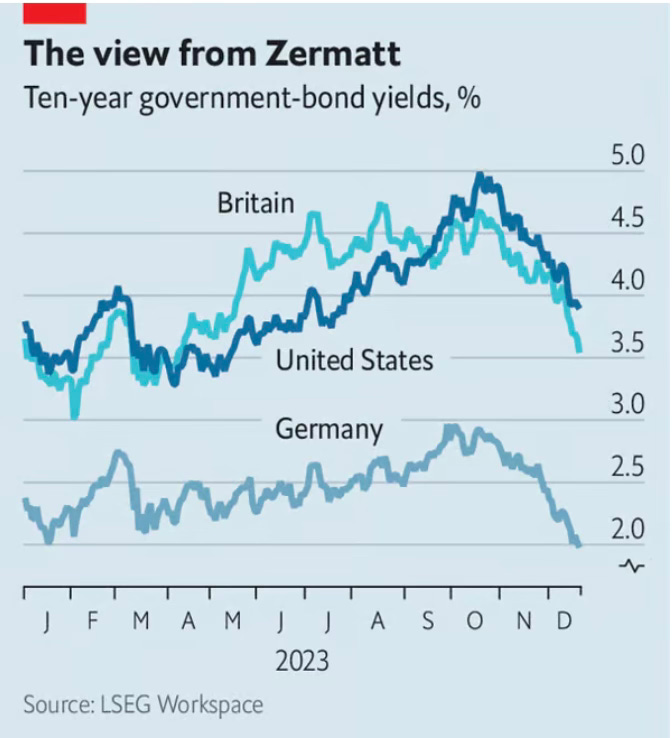
16. Amidst all talk of high interest rates, US Treasuries remain below their historical average and look set to decline further in 2024.


No comments:
Post a Comment