Substack

Monday, December 30, 2024

Year-end charts 2024

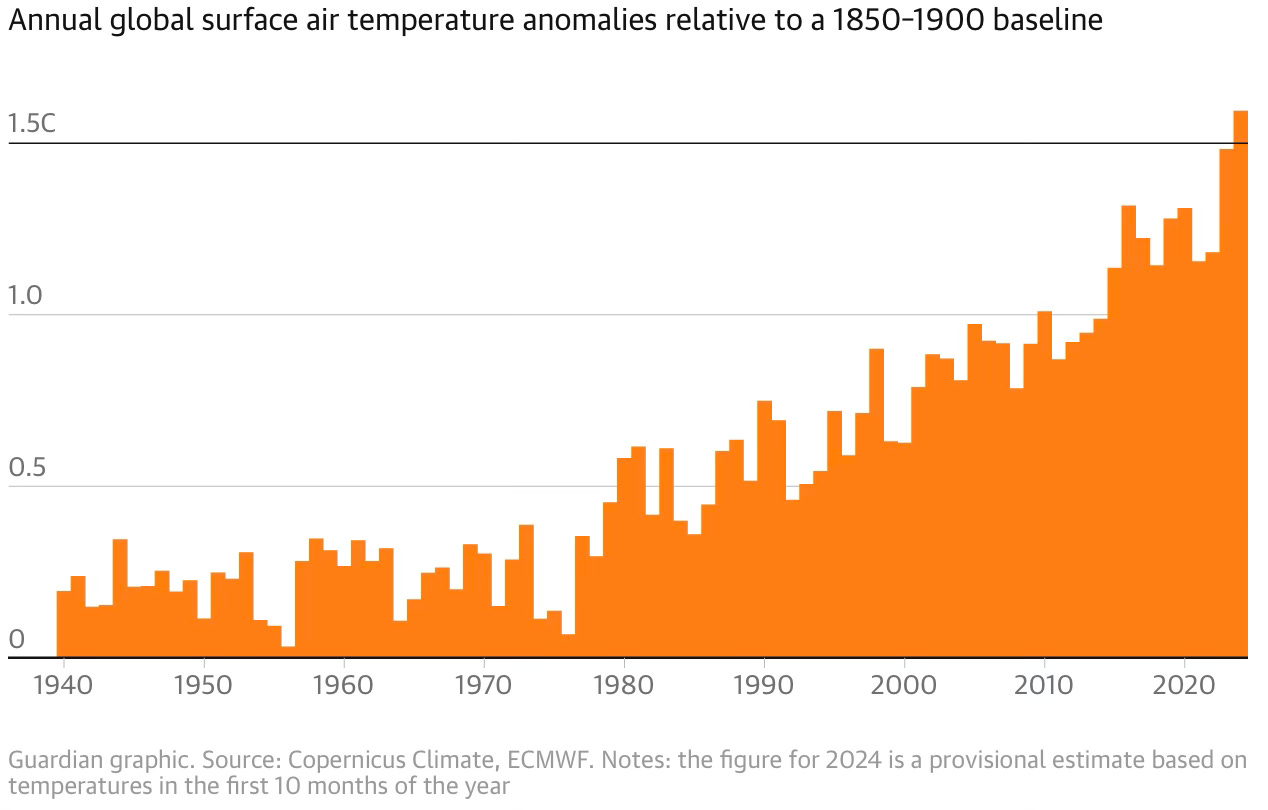
1. 2024 is the first year to surpass 1.5 degrees of warming above pre-industrial temperatures. 

2. The S&P 500 hit record highs 57 times!

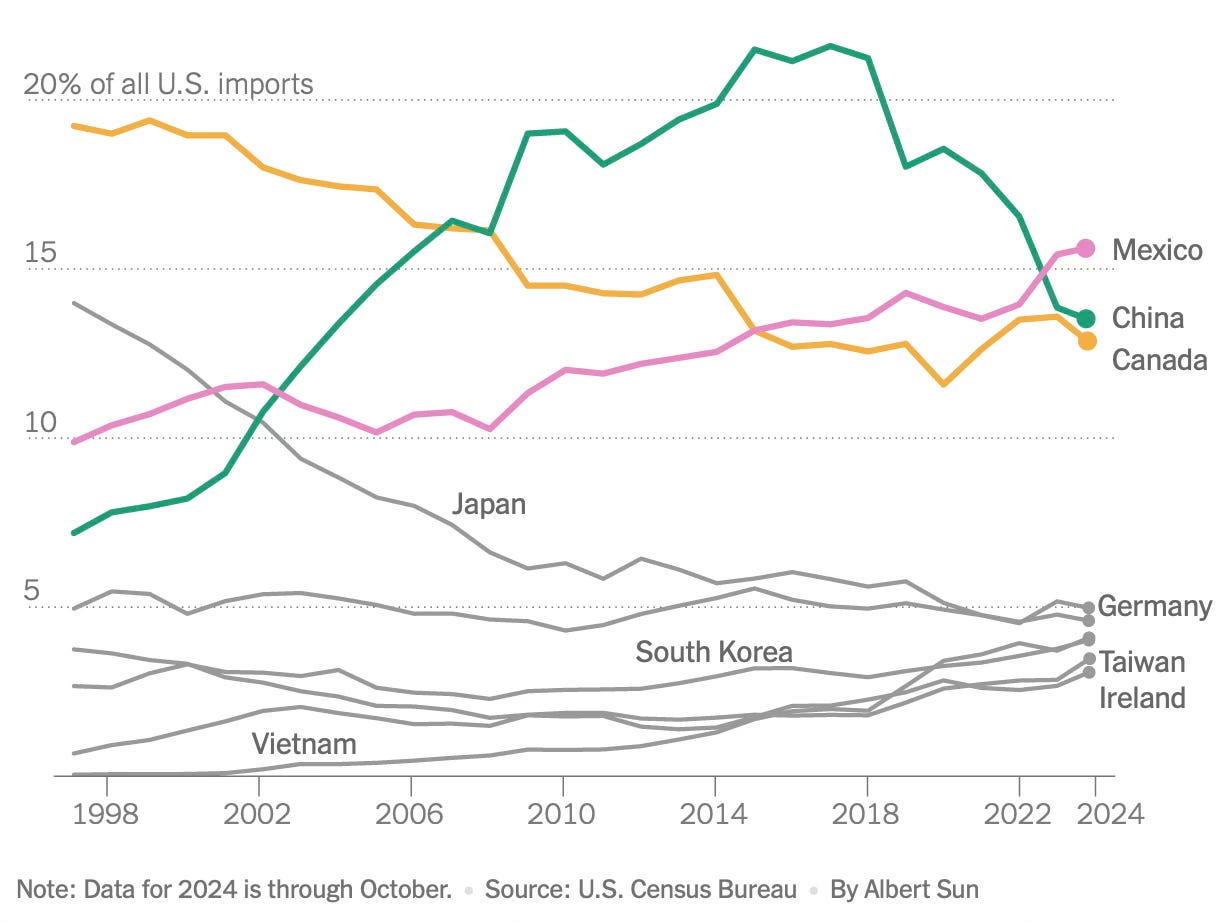
3. The most important graphic for 2025 regarding the pointers to any trade war.

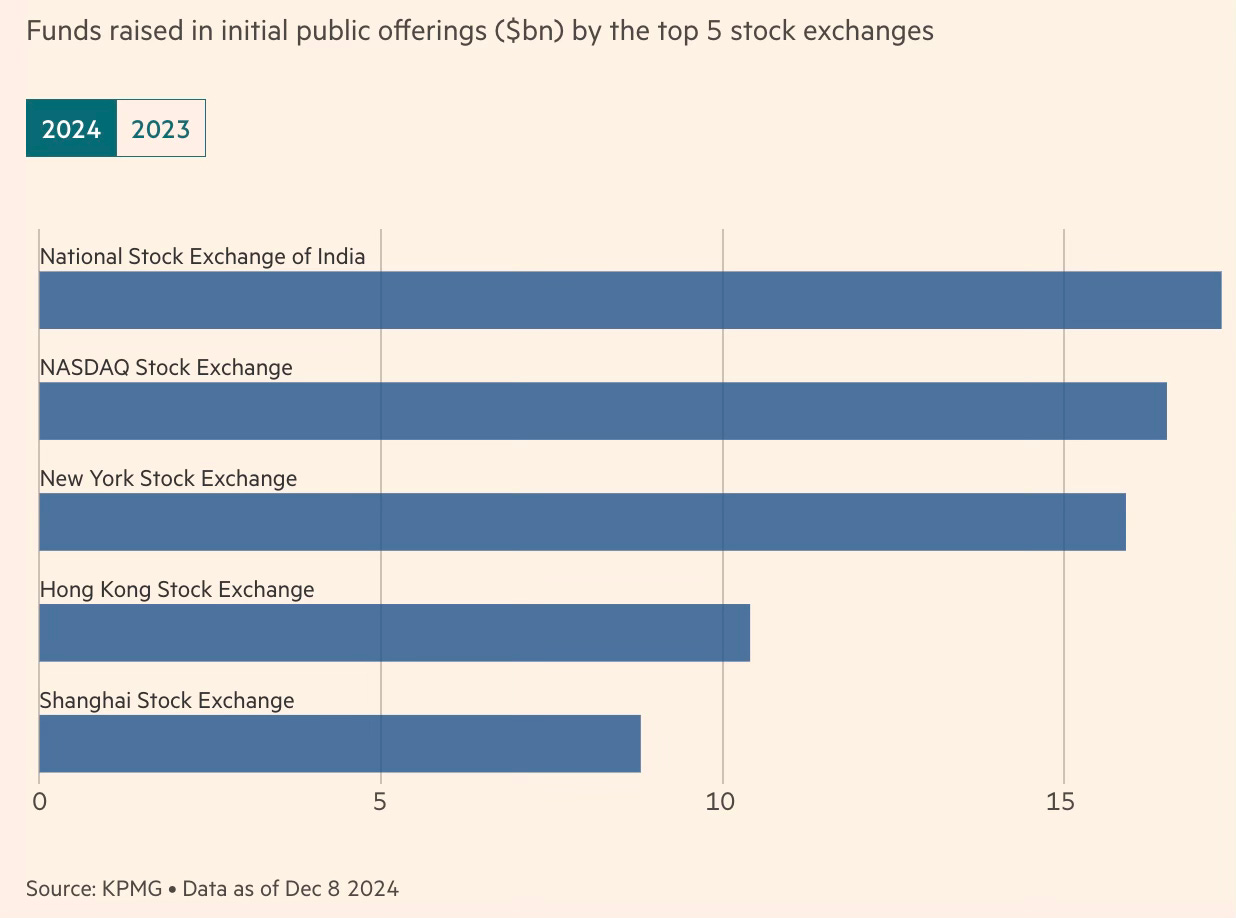
4. India’s NSE became the top global stock exchange by IPO proceeds in 2024. 

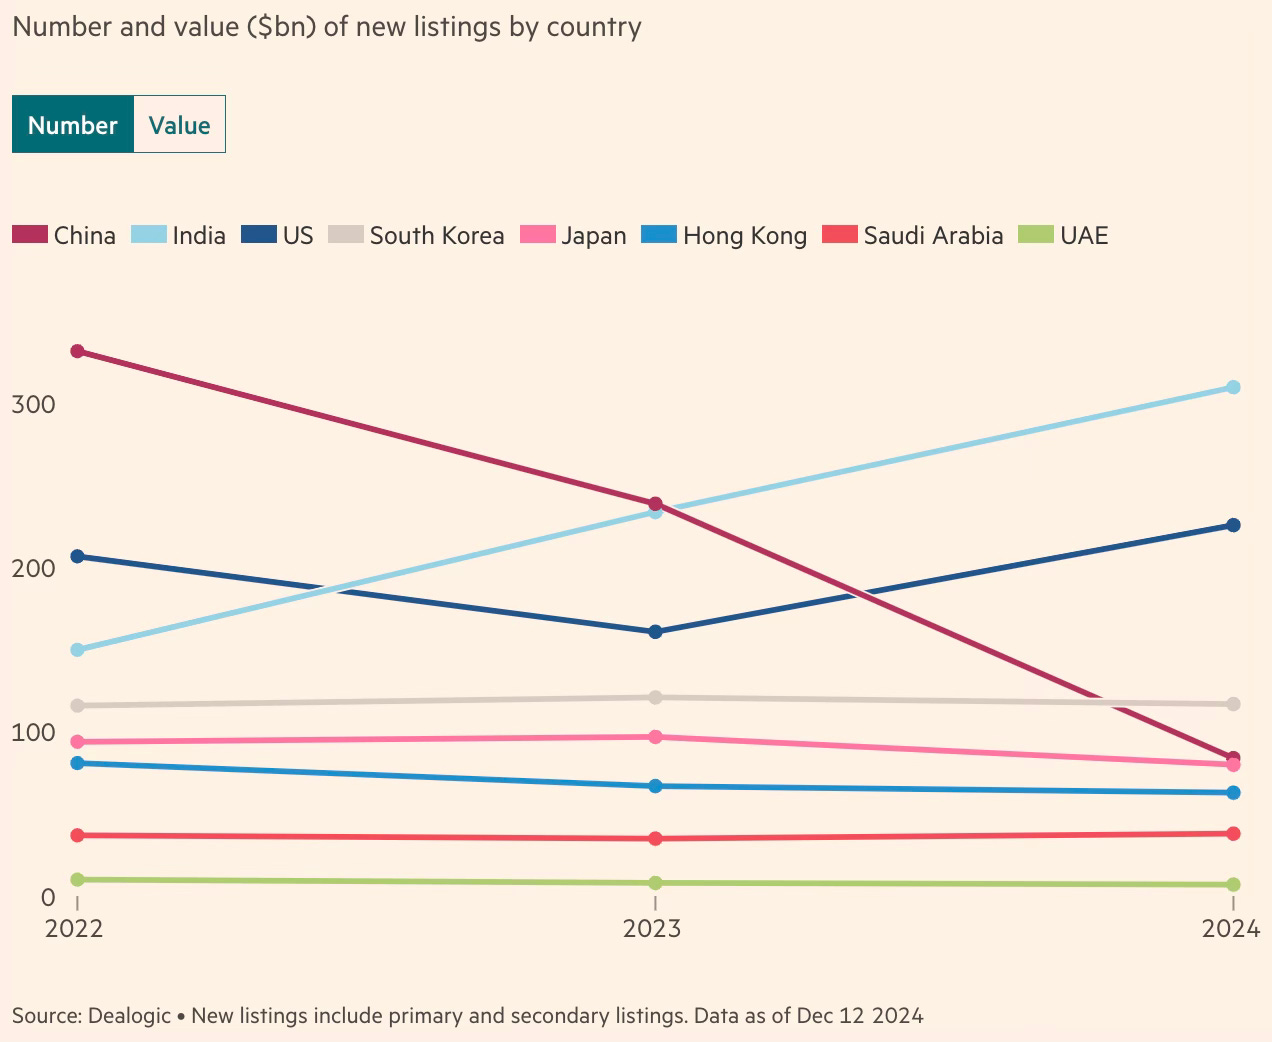
India also emerged as the top market in the world for IPO listing by numbers and second (after the US) by value.

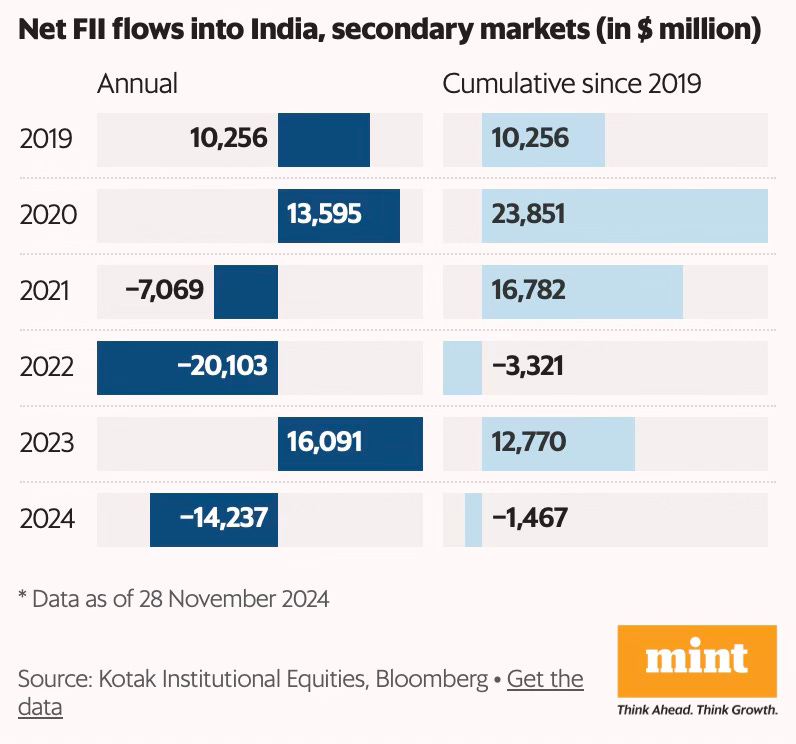
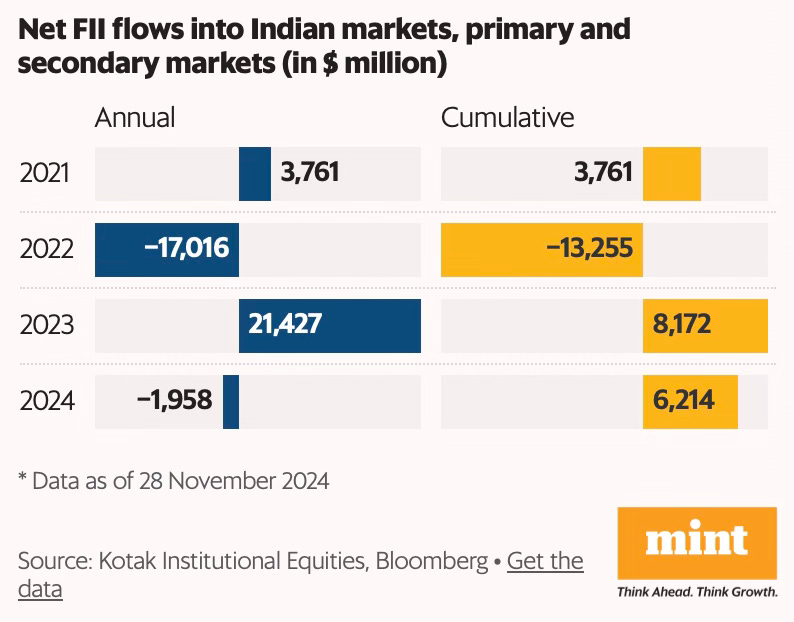
5. Foreign Institutional Investors (FII) have been net sellers in India’s secondary markets since 2019.

Even after considering their primary investments in IPOs, QIPs etc., the cumulative inflow over the last four years is only $6 billion or about two-three months’ worth of SIP inflows.

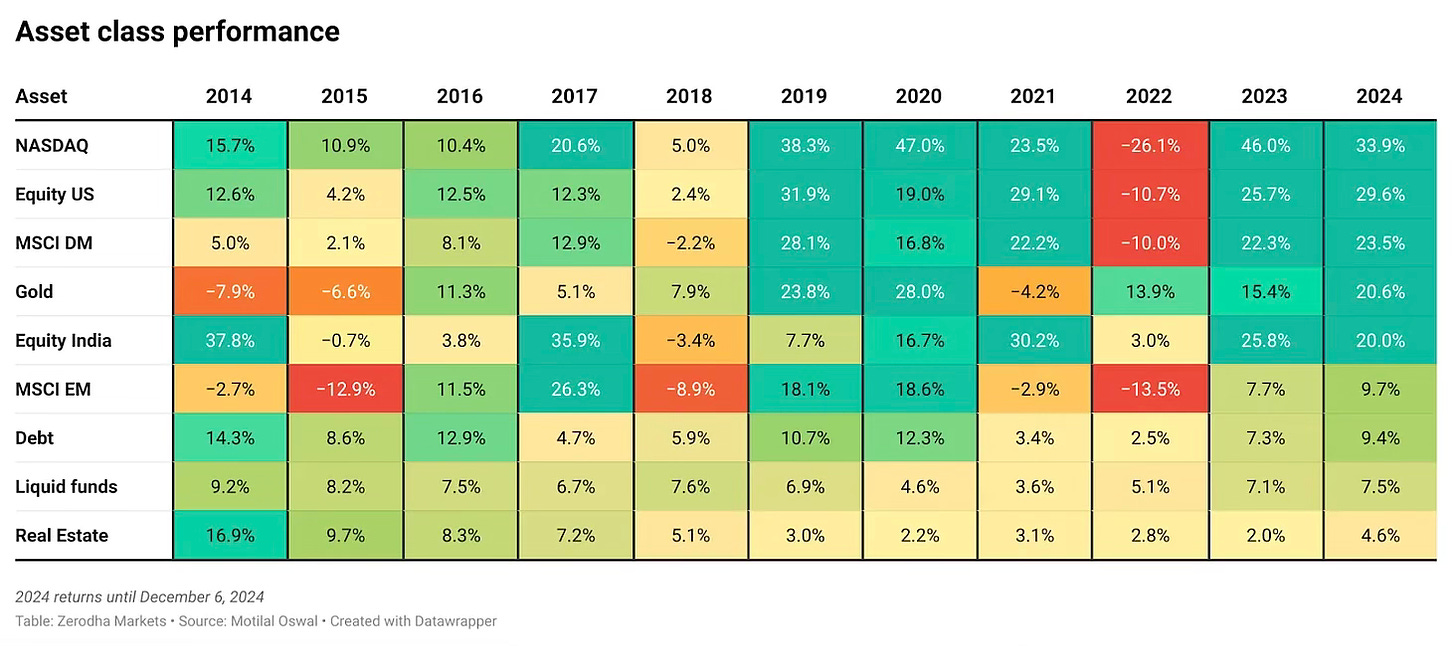
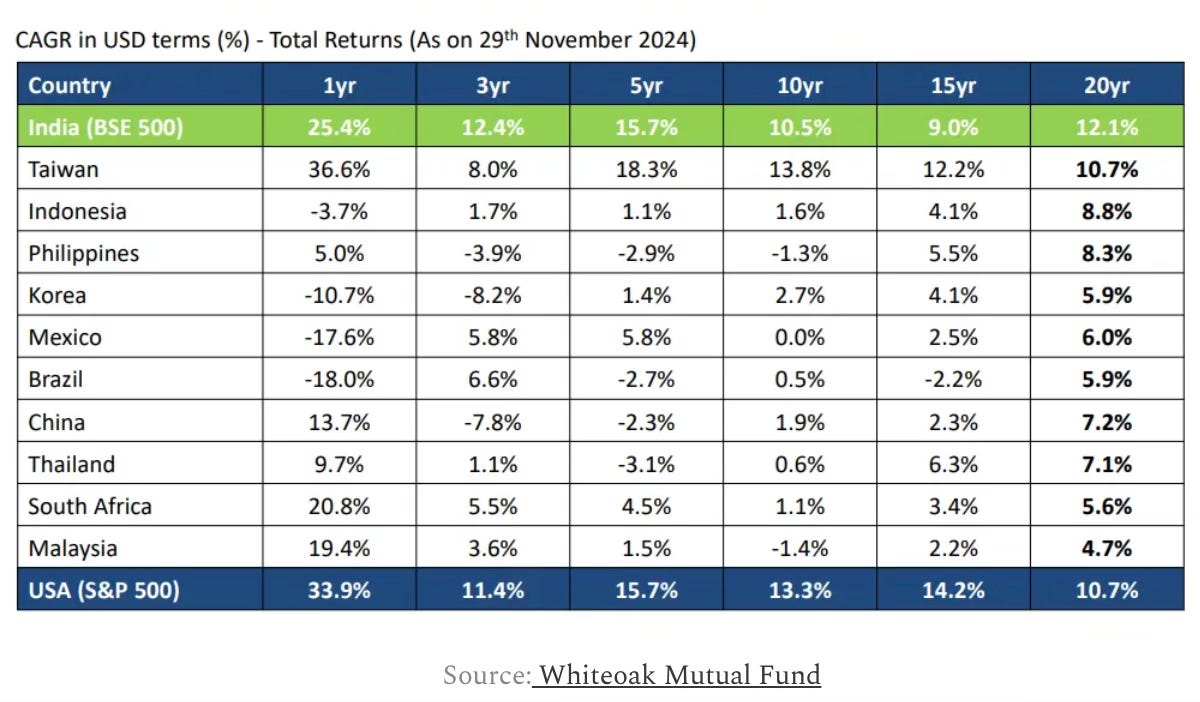
6. Among asset classes, Indian equity topped EM equity in 2024 by a big distance.

In fact, India has consistently been among the best performing EM for at least two decades. 

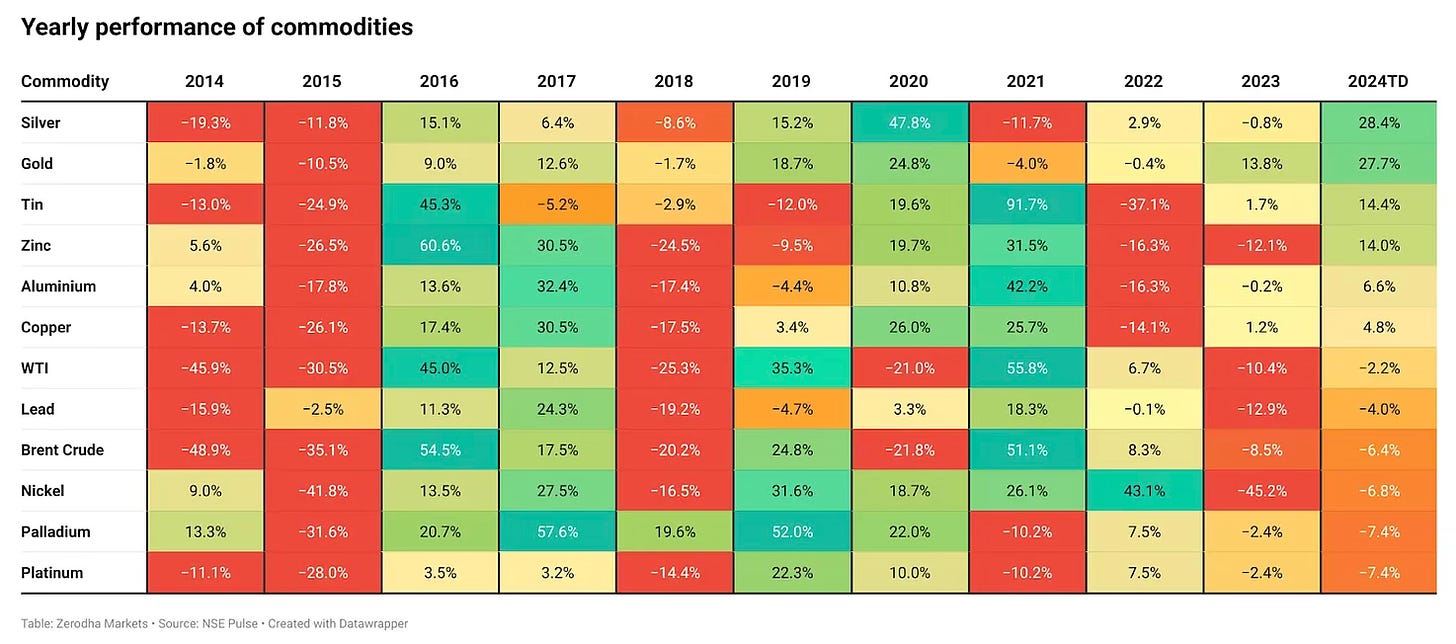
7. Commodities had a generally weak year, contributing to easing inflation pressures. 

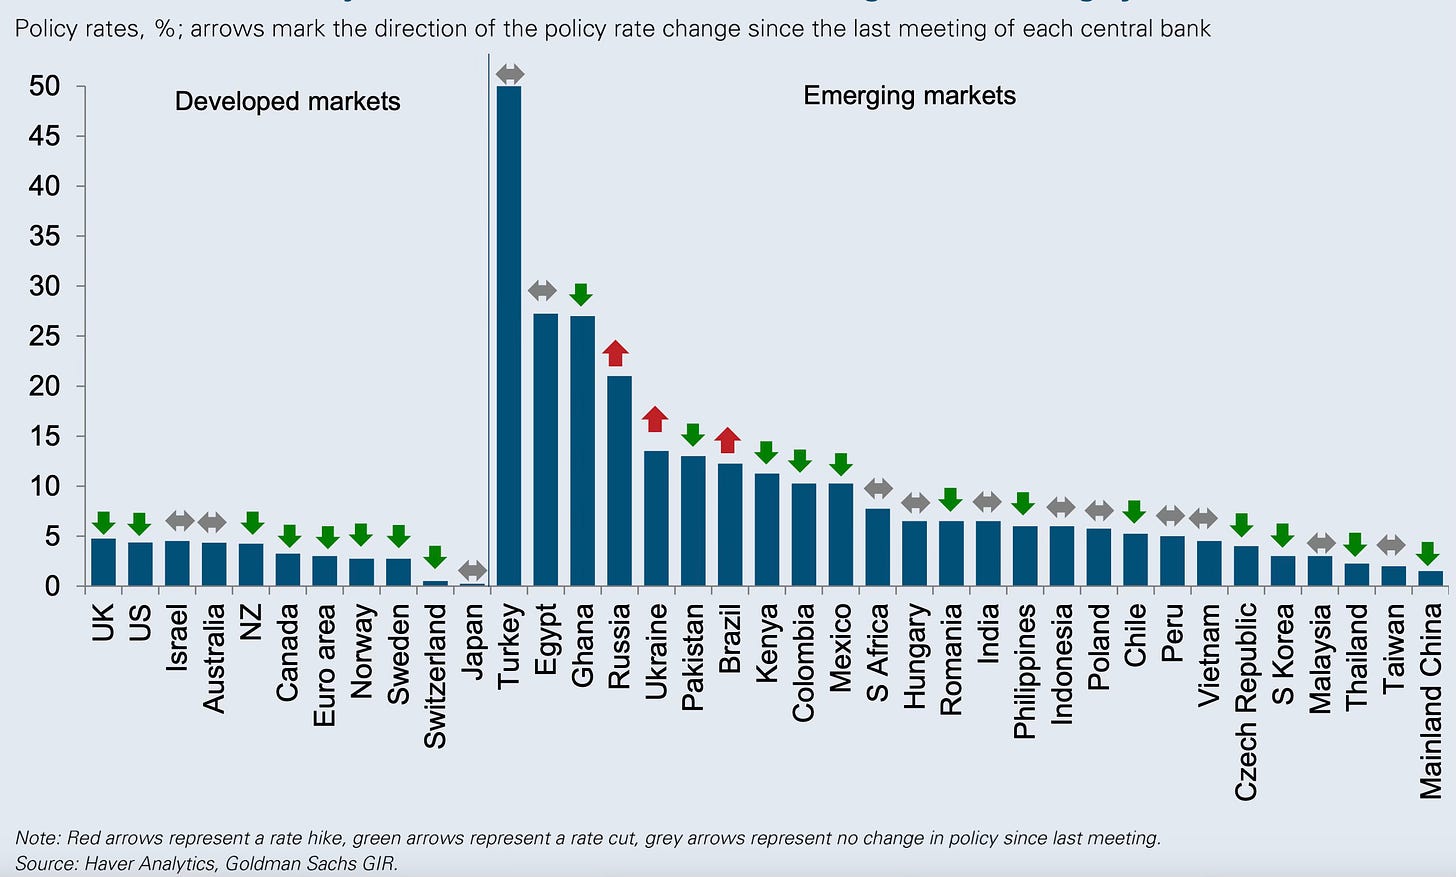
8. Central banks across developed and developing countries have started cutting rates.

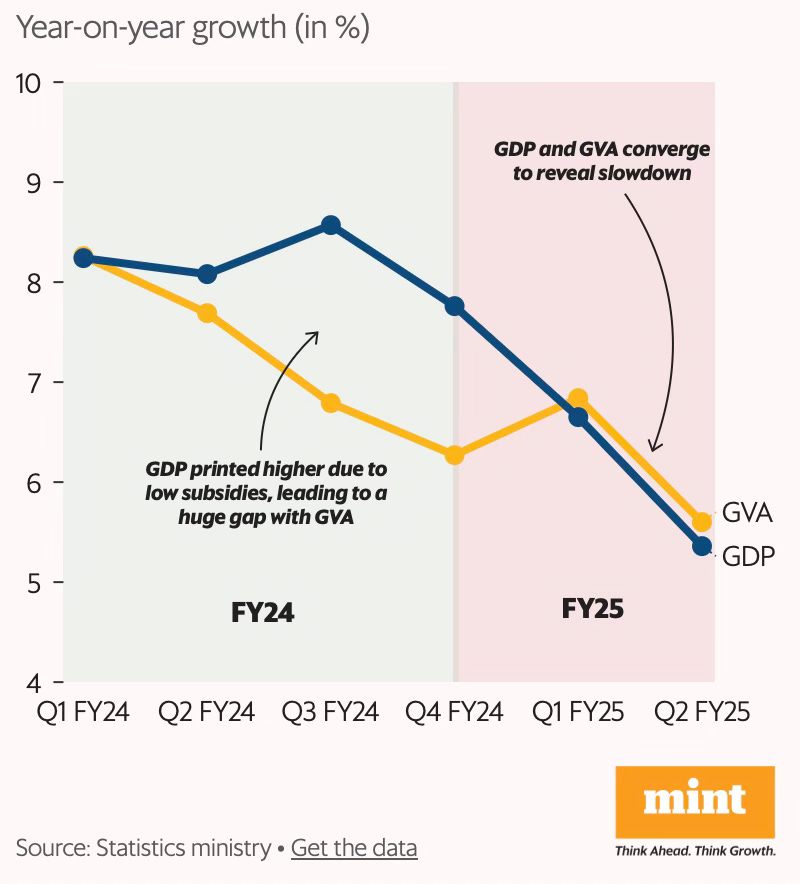
9. India’s GDP growth has declined for the last three quarters.

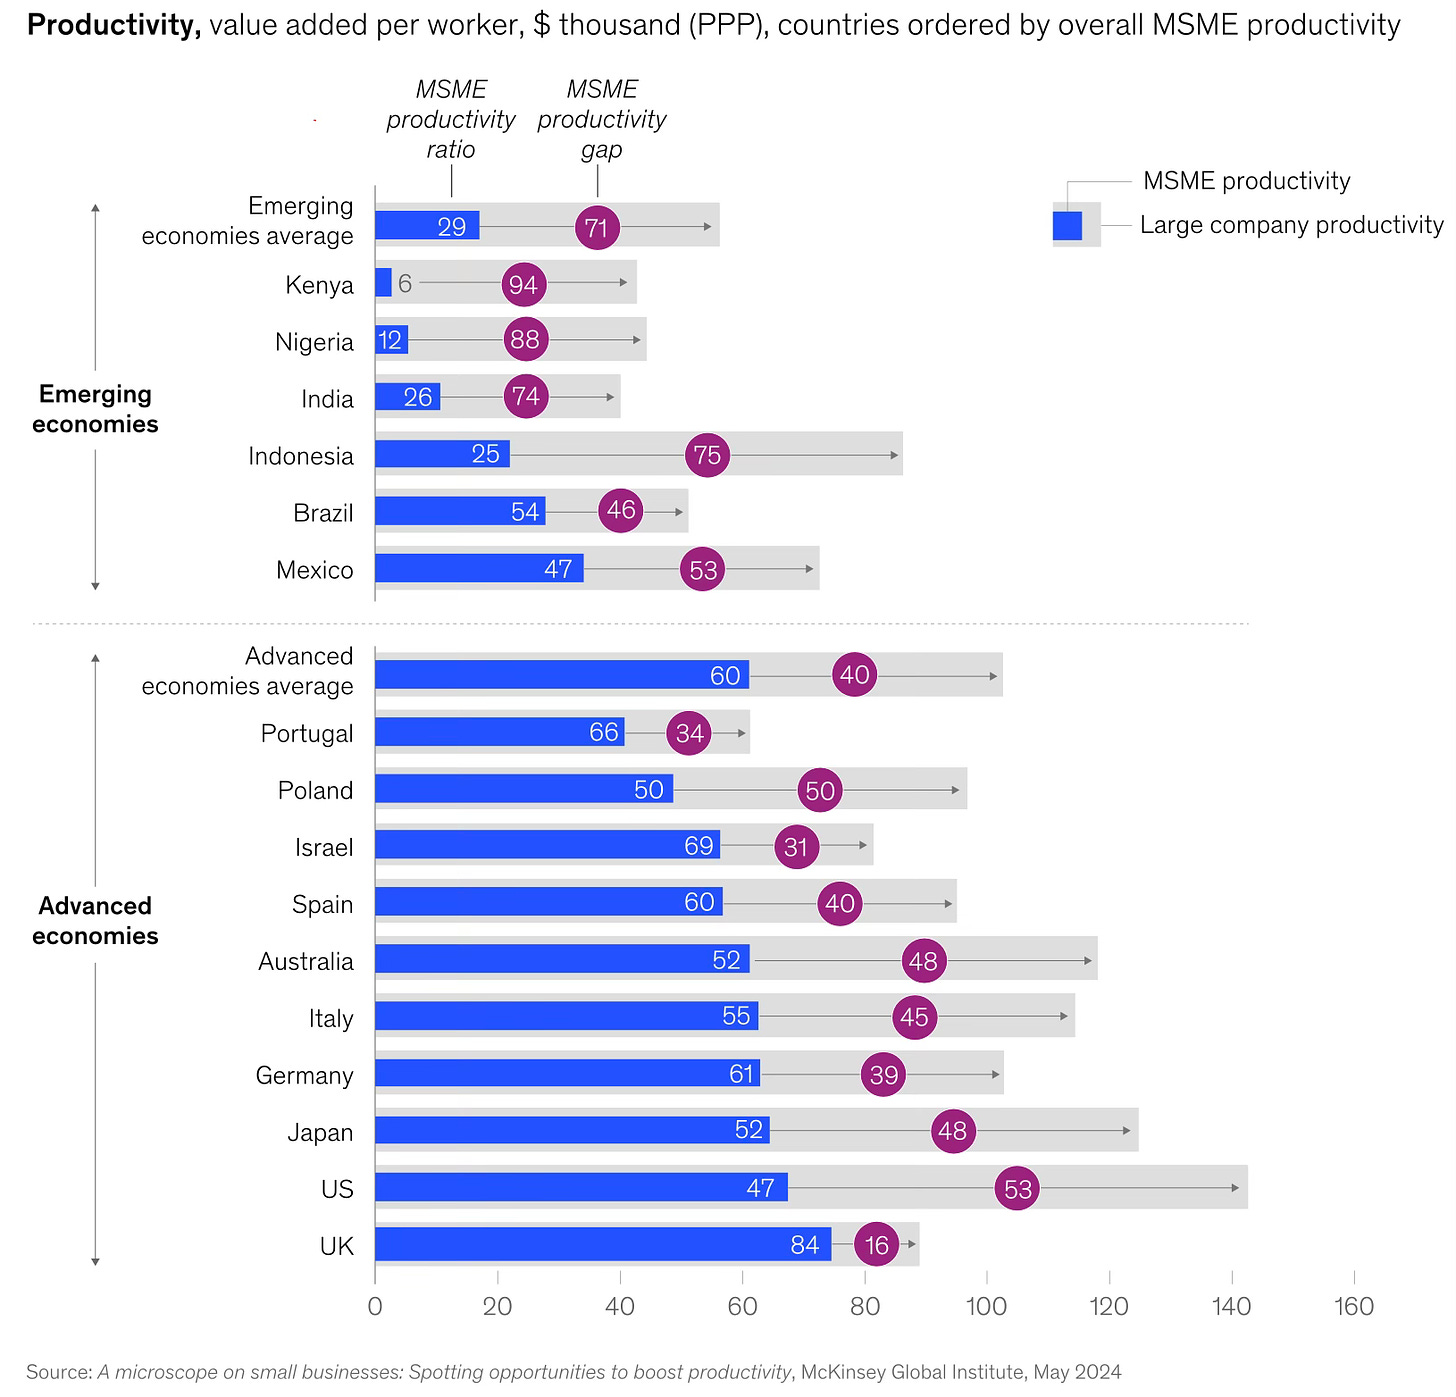
10. MSMEs account for half economic output, but are orders of magnitude less productive than firms in the top-quartile

Indian large firms are far less productive than those of Brazil, Mexico, and Indonesia. 

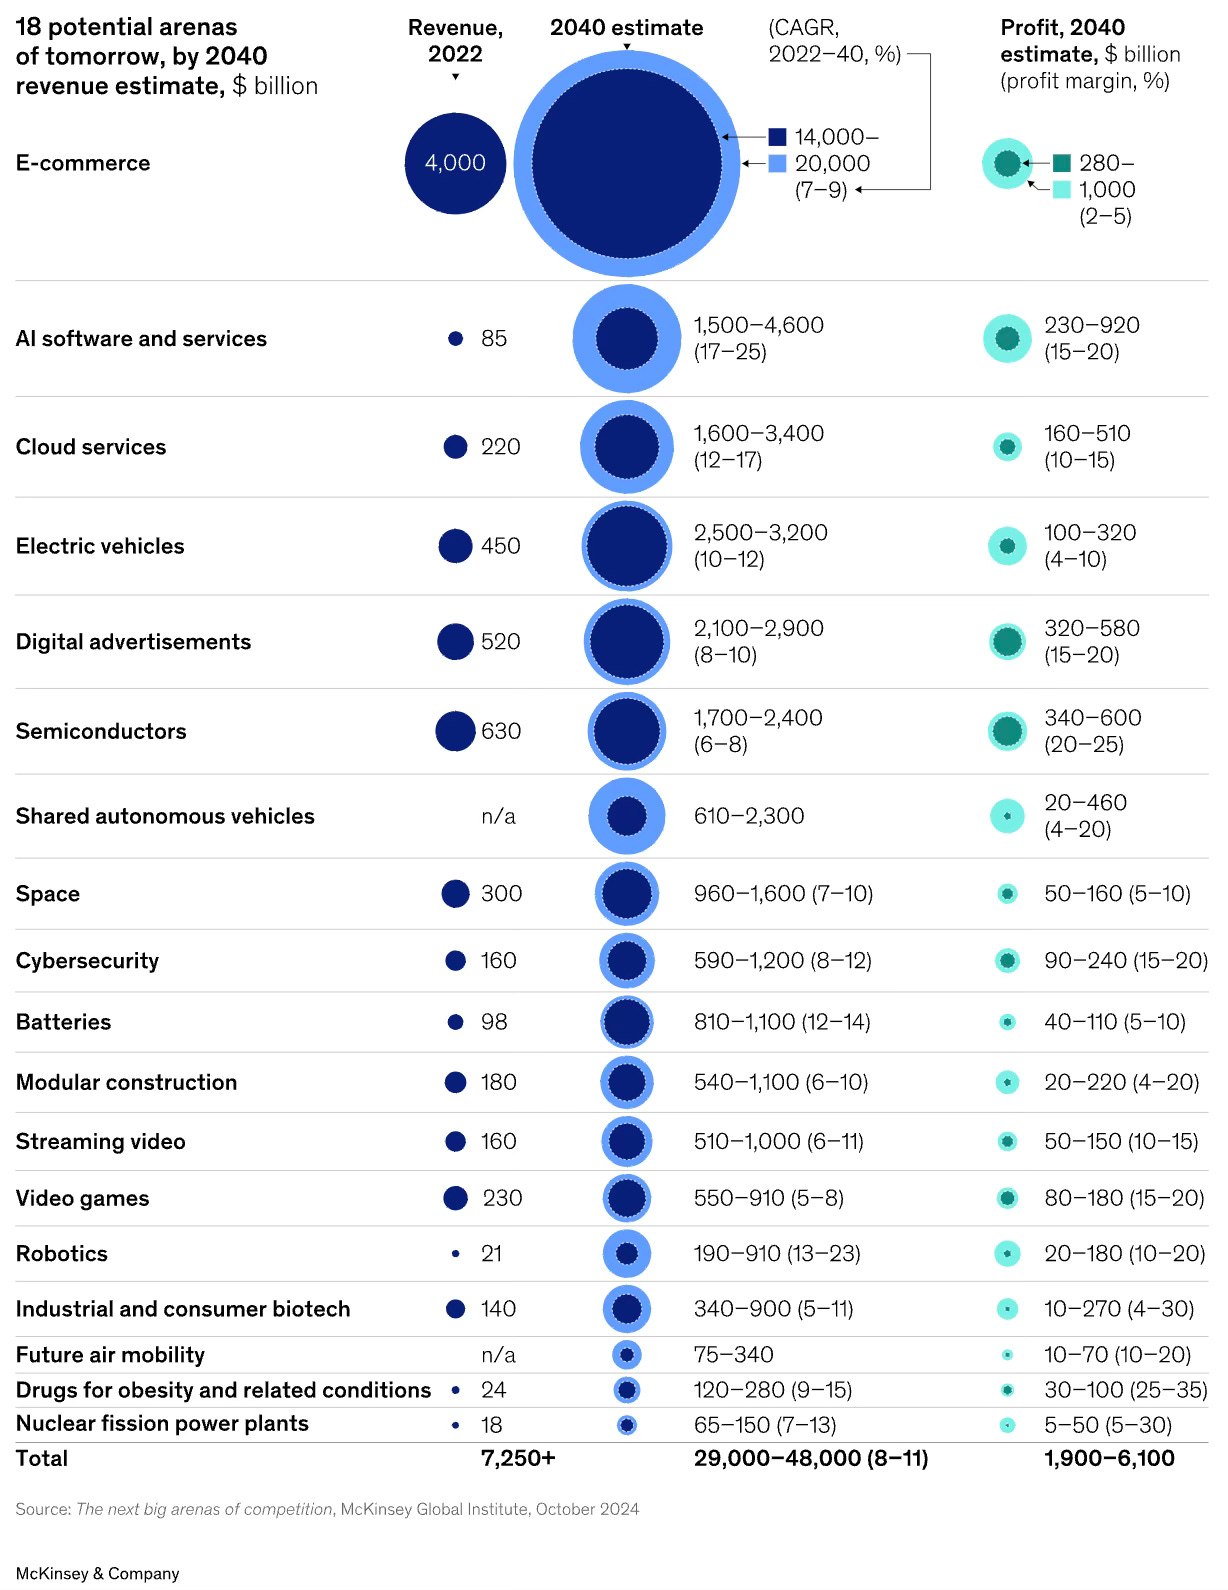
11. McKinsey has 18 potential areas that could generate $29 trillion to $48 trillion in revenues and $2 trillion to $6 trillion in profits by 2040

12. Consolidation of all graphical stories in the year from NYT.

13. World Bank’s key development challenges in graphics for 2024. 

14. Finally, a prediction from McKinsey’s year in Charts. 

Saturday, December 28, 2024

Weekend reading links

1. Agriculture terms of trade facing Indian farmers

Such export controls and anti-market policies inflict a large “implicit tax” on farmers, despite significant budgetary support through fertiliser and other subsidies, including loan waivers. In this context, it is useful to look at the OECD’s producer support estimates (PSEs) that it generates for more than 50 major countries in the world. They adopt a common methodological framework to estimate the impact of various agricultural policies, mainly budgetary support and market price support. The comparative results may shock some policymakers in India. For the triennium ending 2023, OECD countries supported their agriculture to the tune of about 14 per cent of gross farm receipts (PSE 13.8 per cent). Interestingly, China also supports its agriculture to the tune of 14 per cent (PSE 14 per cent), while India’s PSE is negative (-) 15.5 per cent. That happens due to the negative market price support that results from export controls, dumping in the domestic market to push prices down, putting stocking limits on private trade, banning futures markets, and so on.

2. India's banking sector in 2024 

The gross non-performing assets (NPAs) of the banking system, which stood at 3.2 per cent in September 2023, dropped further to 2.8 per cent in March 2024. After provisioning, the net NPAs dropped from 0.8 per cent to 0.6 per cent during this period. The capital adequacy ratio, meanwhile, remained unchanged at 16.8 per cent. Meanwhile, the gross NPAs of the non-banking financial companies (NBFCs) dropped from 4.6 per cent to 4 per cent, and return on assets rose from 2.9 per cent to 3.3 per cent. There was a marginal drop in their capital adequacy ratio, from 27.6 per cent to 26.6 per cent.

3. Lego facts of the day

Over the past 20 years the company’s revenue has grown ten-fold, reaching DKr66bn ($9.7bn) in 2023. A decade ago it became the world’s largest toymaker by revenue. Today its sales are greater than those of its two biggest rivals—Mattel, creator of Barbie, and Hasbro, maker of Nerf guns—combined. In 2023 it opened 147 shops around the world, taking its total to 1,031, and built factories in America and Vietnam. Sales in the first half of 2024 were up by 13%, year on year, even as the global toy market shrank. In 2004 the company was loss-making; in 2023 its net profit was DKr13bn, implying an enviable margin of nearly 20%... A foundation owns a quarter of the firm; the Kristiansen family owns the rest.

4. PE investors who flocked into China faces their reckoning.

Among the 10 largest global private equity groups with operations in China, there is no record of any having listed a Chinese company this year or fully sold their stake through an M&A deal, figures from Dealogic show. It is the first year for at least a decade where this has been the case, though the pace of exits has been slow since Beijing introduced restrictions on Chinese companies’ ability to list in 2021. Buyout groups rely on being able to sell or list companies, typically within three to five years of buying them, in order to generate returns for the pension funds, insurance companies and others whose money they manage. The difficulties in doing so have in effect left those investors’ funds locked away, with future returns uncertain... Many private equity groups expanded their presence in the world’s second-biggest economy as it grew rapidly over the past two decades. Global pension funds and others ploughed capital into the country, hoping to gain exposure to its economic boom. The 10 firms invested $137bn over the past decade, but total exits amount to just $38bn, Dealogic data shows. New investment by those groups has collapsed to just $5bn since the start of 2022...
The data covers Blackstone, KKR, CVC, TPG, Warburg Pincus, Carlyle Group, Bain Capital, EQT, Advent International and Apollo, the 10 largest buyout groups by funds raised for private equity over the past decade... Foreign buyout groups used to rely on taking Chinese companies public in the US or other countries in order to exit their investments after a few years. But Beijing has introduced new restrictions on offshore listings since cracking down on the ride-hailing app DiDi, in the wake of its New York IPO in 2021. Listings have slowed significantly since. In total this year, there have been just $7bn of domestic IPOs in China as of late November, compared with $46bn last year, which was already the lowest total since 2019.

China's troubles come even as India emerged as the top market for IPO listing in the world in 2024 by numbers and the second highest (after the US) by value.

The NSE of India has emerged as the number one venue for primary listings by value, ahead of Nasdaq and HK SE. 

5. 2025 is expected to be an inflexion point for EVs in China, as it's estimated to overtake ICE cars in sales.
China is set to smash international forecasts and Beijing’s official targets with domestic EV sales — including pure battery and plug-in hybrids — growing about 20 per cent year on year to more than 12mn cars in 2025, according to the latest estimates supplied to the Financial Times by four investment banks and research groups. The figure would be more than double the 5.9mn sold in 2022. At the same time, sales of traditionally powered cars are expected to fall by more than 10 per cent next year to less than 11mn, reflecting a near 30 per cent plunge from 14.8mn in 2022. Meanwhile, EV sales growth has slowed in Europe and the US, reflecting the legacy car industry’s slow embrace of new technology, uncertainty over government subsidies and rising protectionism against imports from China... China's adoption of battery electric vehicles (BEVs) is projected to grow to 80% by 2035... HSBC estimated about 90 new car models had been planned for release by manufacturers in China in the fourth quarter of 2024 — about one a day — and nearly 90 per cent were EVs. 
This has important implications.
The forecasts suggest Beijing’s official target, set in 2020, for EVs to account for 50 per cent of car sales by 2035, will be achieved 10 years ahead of schedule. Norway leads the world in EV sales as a share of the market, with more than 90 per cent of new cars battery-powered... They imply that over the coming decade, factories set up in China to produce tens of millions of cars with traditional engines will have almost no domestic market to serve. They also highlight how the rapid rise of the Chinese EV industry now threatens the national manufacturing champions of Germany, Japan and the US. As China’s EV market tracked towards year-on-year growth of near 40 per cent in 2024, the market share of foreign-branded cars fell to a record low of 37 per cent — a sharp decline from 64 per cent in 2020, according to data from Automobility, a Shanghai-based consultancy. In this month alone, GM wrote down more than $5bn of its business value in China; the holding company behind Porsche warned of a writedown in its Volkswagen stake of up to €20bn; and arch rivals Nissan and Honda said they were responding to a “drastically changing business environment” with a merger.

6. The long-term performance of a UK local government pension fund that invests over half its portfolio in index funds raises more questions on the value created by the asset management industry. 

Quentin Marshall, chair of Kensington and Chelsea’s £1.9bn pension scheme, has delivered the best performance of any UK local authority fund over the past decade by parking half of its assets in a global equity index tracker. Marshall, who has chaired the fund since 2014, said individual stock or fund selection hinders rather than helps drive returns and he avoids tactical decision-making when his team meets to review its investments... “The whole asset management industry is built on the premise that they have value,” Marshall said. 

He is withering in particular about consultants who advise pension funds on investment decisions and “rely on backward looking data which is definitely shown to be completely and utterly useless as a source of prediction”. Over the past decade, the 51-year-old Conservative party councillor and banker has delivered average annual returns of 10.8 per cent for the pensions of workers at Kensington and Chelsea’s council, which provides services to both the wealthiest parts of the UK and neighbourhoods with significant deprivation. The performance, driven by a heavy equity exposure, outstrips other local authorities, according to shareholder advisory group PIRC. Marshall’s fund was the only local authority to achieve double digit annual returns over the past decade. The second best was Bromley council, which trailed him with 9.3 per cent... Marshall attributes his performance in part to making few decisions. His team meets formally to review its strategic asset allocation once a year but it has been “broadly unchanged for many years”. Half of the fund follows the BlackRock MSCI world index tracker...

His rejection of fund and stock selection makes him sceptical that the UK government’s decision to pool all of the assets of England and Wales’s £391bn local government pension scheme will help boost pension returns, although he supports the government’s attempts to professionalise the investment process. Last month Labour chancellor Rachel Reeves set out plans for a series of “megafunds” to run local council pension assets, a move the government hopes will drive billions of pounds of investment into British infrastructure and fast-growing companies. The reform programme was supported by her Tory predecessor Jeremy Hunt. But Marshall does not buy their argument that the reforms will lead to better pension returns for cash-strapped councils.
7. Good oped on the implications of the events in the Middle East over the year.

8. Junk food and children health in UK

While the price of healthy, whole foods — such as fish or staple vegetables such as carrots — has soared, unhealthy processed foods are more likely to be placed on enticing promotions and cost significantly less than fresh alternatives. Per calorie, healthy food is almost three times as expensive as unhealthy options, says the Food Foundation. The most deprived fifth of the population would need to spend half of their disposable income on food if they stuck to the government-recommended healthy diet, the charity found. This compares to just 11 per cent for the highest earners. To put together a children’s packed lunch that meets healthy eating guidelines, typically involving fresh fruit and vegetables, unsweetened yoghurt and brown bread, costs up to 45 per cent more than a lunchbox filled with chocolate, flavoured yoghurt and processed snacks marketed at children, according to the charity. The imbalance in grocery baskets between whole foods and junk foods has contributed to higher levels of obesity in lower-income groups, with poorer families becoming more reliant on less-healthy diets, data shows.
The trend has also been exacerbated by food inflation. Between 2021 and 2023, healthier foods increased in price by £1.76 per 1,000 calories compared with £0.76 for less healthy foods, according to the Food Foundation. Fruit and vegetables are the most expensive grocery category, costing an average of £11.79 per 1,000 calories, while food and drink high in fat and sugar costs £5.82... Children are constantly tempted by brightly coloured packaged food placed strategically in shops and advertised on TV and social media platforms. Young people are also influenced by what their friends are eating. Soft drinks, confectionery, snacks and desserts account for about a third of food and soft drink advertising spend, compared with just 1 per cent on fruits and vegetables, says the Food Foundation. Brand advertising, which accounts for about 40 per cent, also contributes to unhealthy eating as consumers tend to associate companies with their products, such as snacks, even if they are not directly promoted... Researchers have also found that some companies deliberately market junk food to deprived communities... According to research by Impact on Urban Health, which mapped food availability in London boroughs, unhealthy food outlets were significantly more concentrated in deprived neighbourhoods.

The same story is repeated across the world. 

9. About corporate churn rate

Just over 1 per cent of the 1,513 UK-listed companies in 1948 still existed 70 years later, according to an analysis by two Cambridge professors. Roughly half of US public companies traded for 10 years or fewer over the past century, says Morgan Stanley.

10. On industry concentration in banking in the US

JPMorgan Chase, Bank of America, Citigroup and Wells Fargo, the four largest US banks by deposits and assets, collectively reported about $88bn in profits in the first nine months of 2024, according to Financial Times calculations based on figures from industry tracker BankRegData. Together they account for 44 per cent of the US banking industry’s profits — the highest share for the first nine months of the year since 2015 — despite the pool taking in more than 4,000 of the country’s other banks. Including US Bank, PNC and Truist, the seven largest banks by deposits generated almost 56 per cent of all banking profits in the first nine months of the year, up from 48 per cent for the same period in 2023.

11. Finally, a snippet on structural transformation in the US, from an excellent oped by Martin Wolf.

In 1810, 81 per cent of the US labour force worked in agriculture, 3 per cent worked in manufacturing and 16 per cent worked in services. By 1950, the share of agriculture had fallen to 12 per cent, the share of manufacturing had peaked, at 24 per cent, and the share of services had reached 64 per cent. By 2020, the employment shares of these three sectors reached under 2 per cent, 8 per cent and 91 per cent, respectively. The evolution of these shares describes the employment pattern of modern economic growth.
He points to an important challenge in manufacturing
Initially, two positive forces — cheaper food and higher incomes — shift spending towards manufactures and drive up the share of manufacturing in employment. But two negative forces — the decline in prices of manufactures relative to services and the higher income elasticity of demand for the latter — do the reverse. Initially, the positive effects on manufacturing dominate, because the agricultural revolution is so huge. Yet there comes a time when agriculture is too small to provide a positive impulse to manufacturing. Then forces operating within manufacturing and the service sector dominate. Employment shares in manufacturing start to fall. In the US, these have been falling for seven decades. The idea that this process is reversible is ridiculous. Water flows downhill for a good reason.

Wednesday, December 25, 2024

China's EV industrial policy is beggar-thy-neighbour

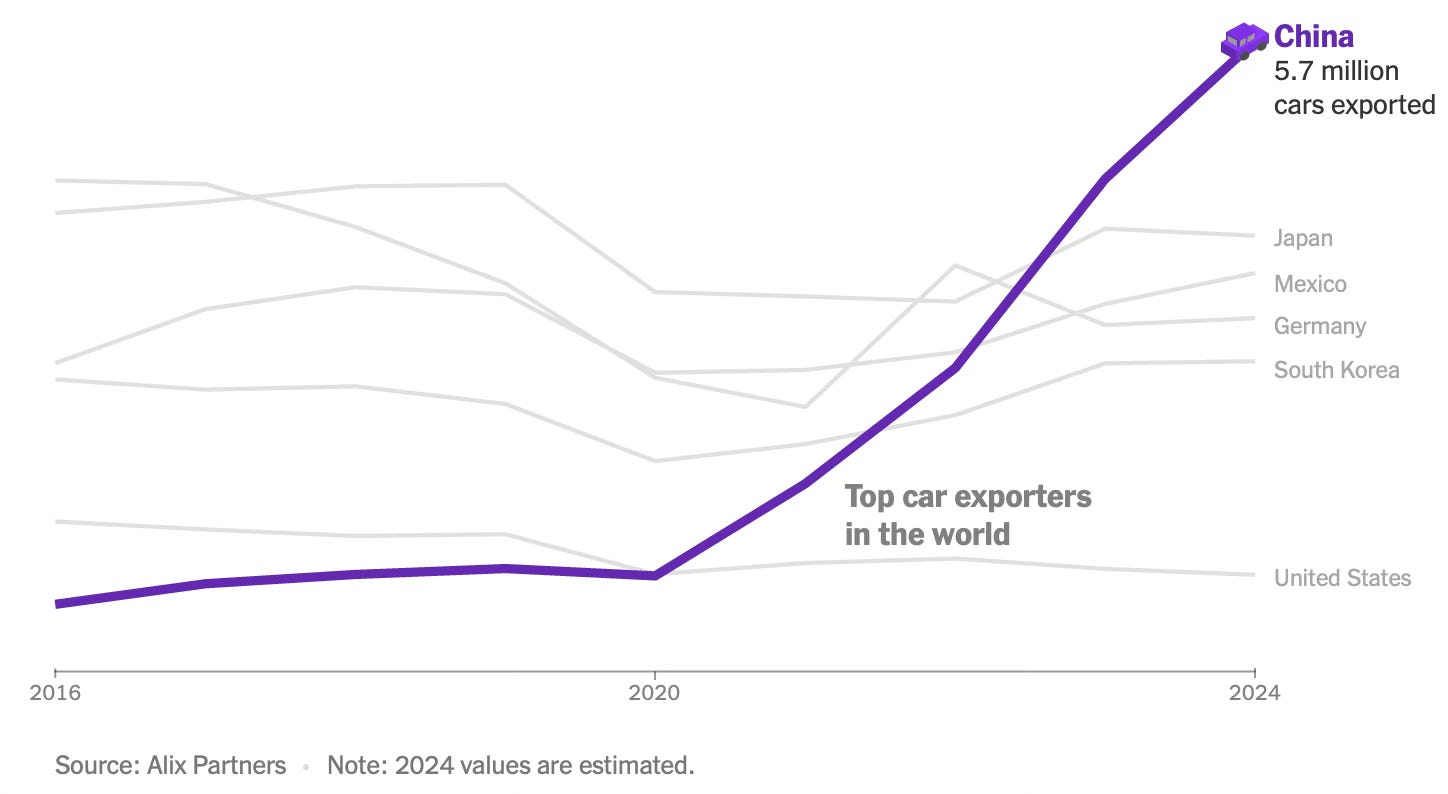
The latest sector where Chinese manufacturers are gradually establishing their global dominance is that of passenger vehicles, especially electric vehicles (EVs). NYT has an excellent article that chronicles how Chinese car makers have come to dominate the global market.

Since 2020, Chinese car makers have taken the world by storm.

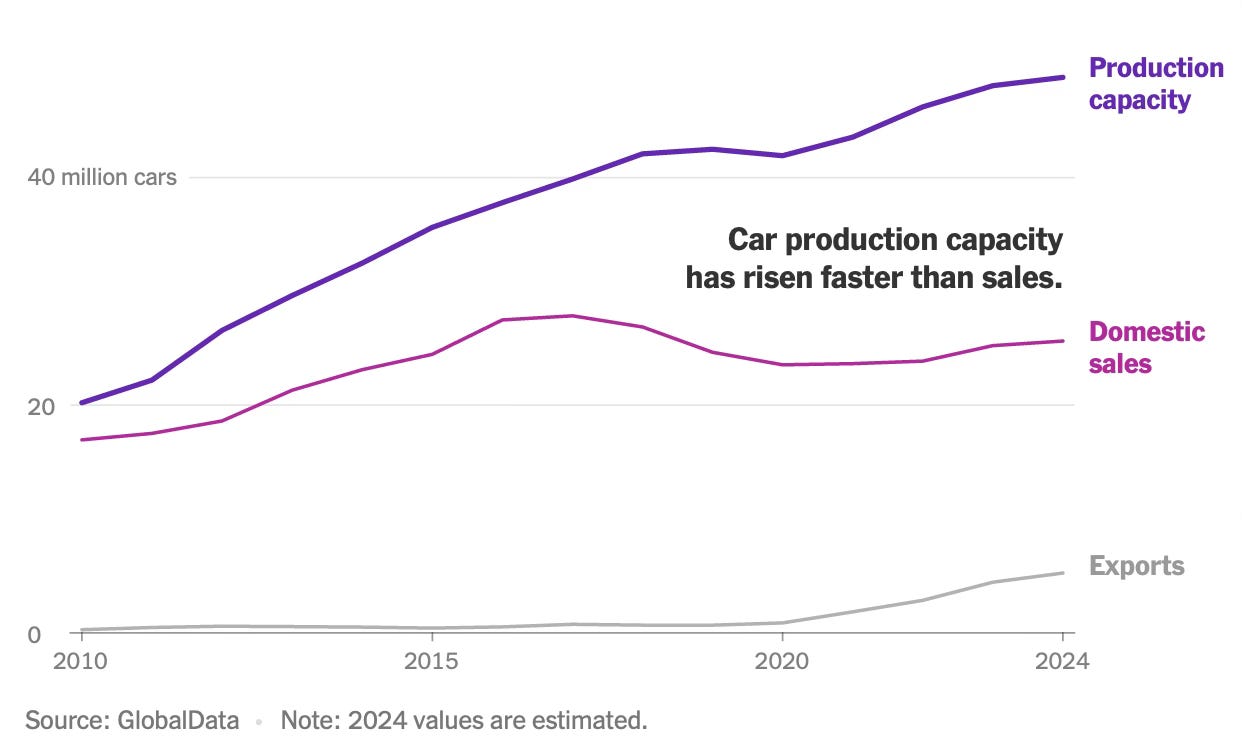
On the back of industrial policy, Chinese firms have ramped up production capacity aggressively, so much so that it’s now more than double the domestic demand. There are apparently more than 100 factories that can churn out 40 million ICE vehicles a year. 

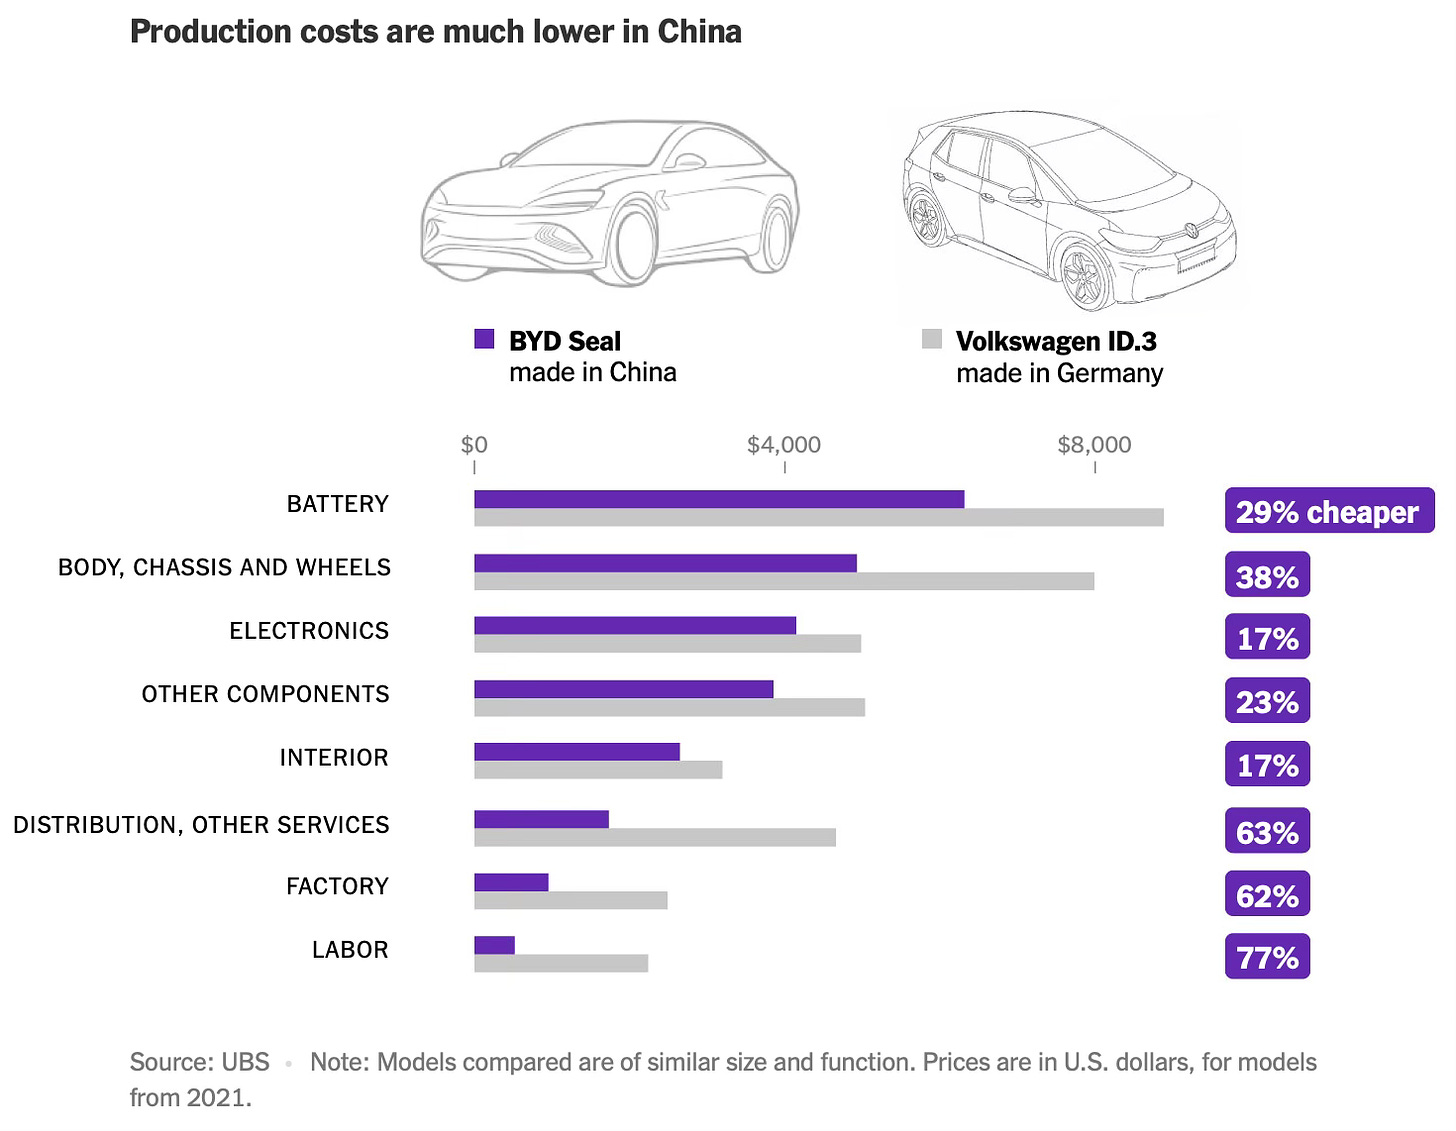
The large subsidies, economies of scale, and the discounted dumping of excess capacity mean that Chinese car makers easily outcompete their rivals. 

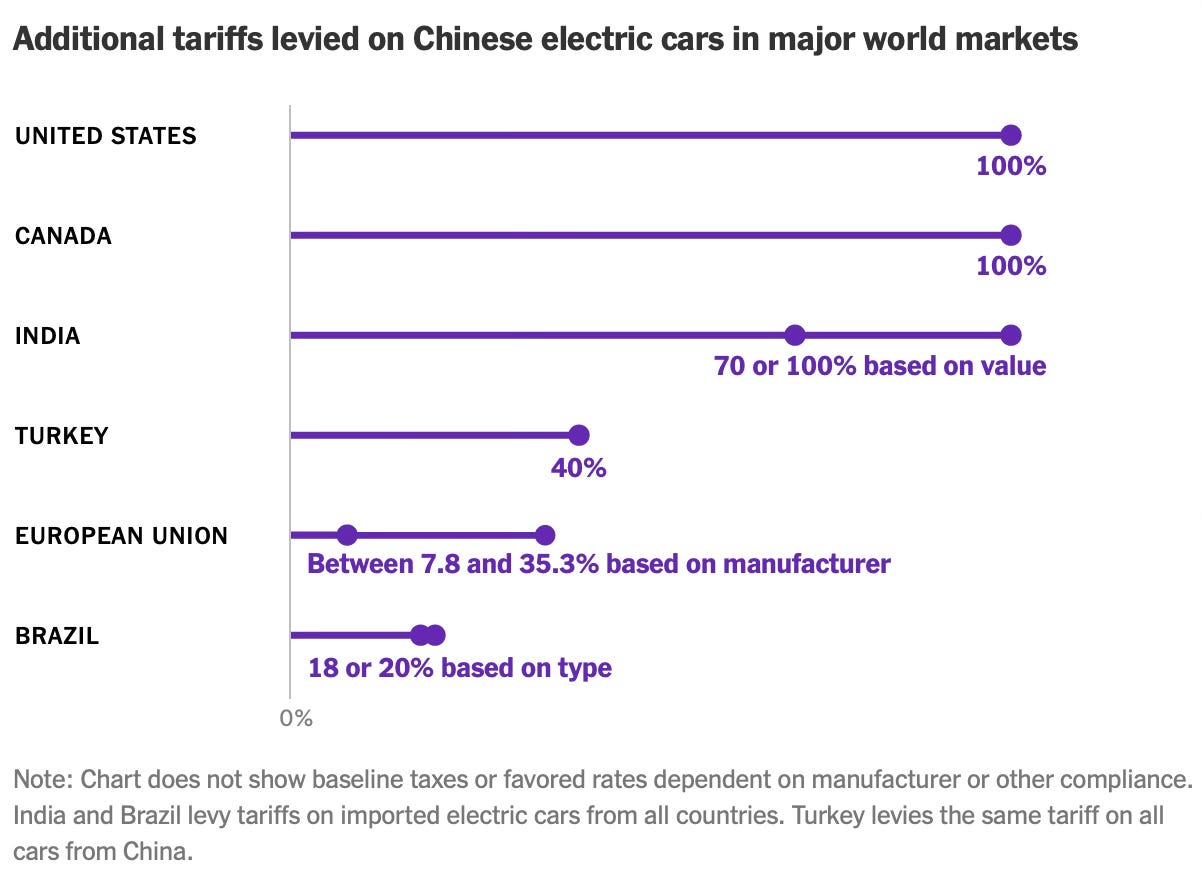
And it invariably triggers tariffs from trade partners, and in this case, they have been very large. 

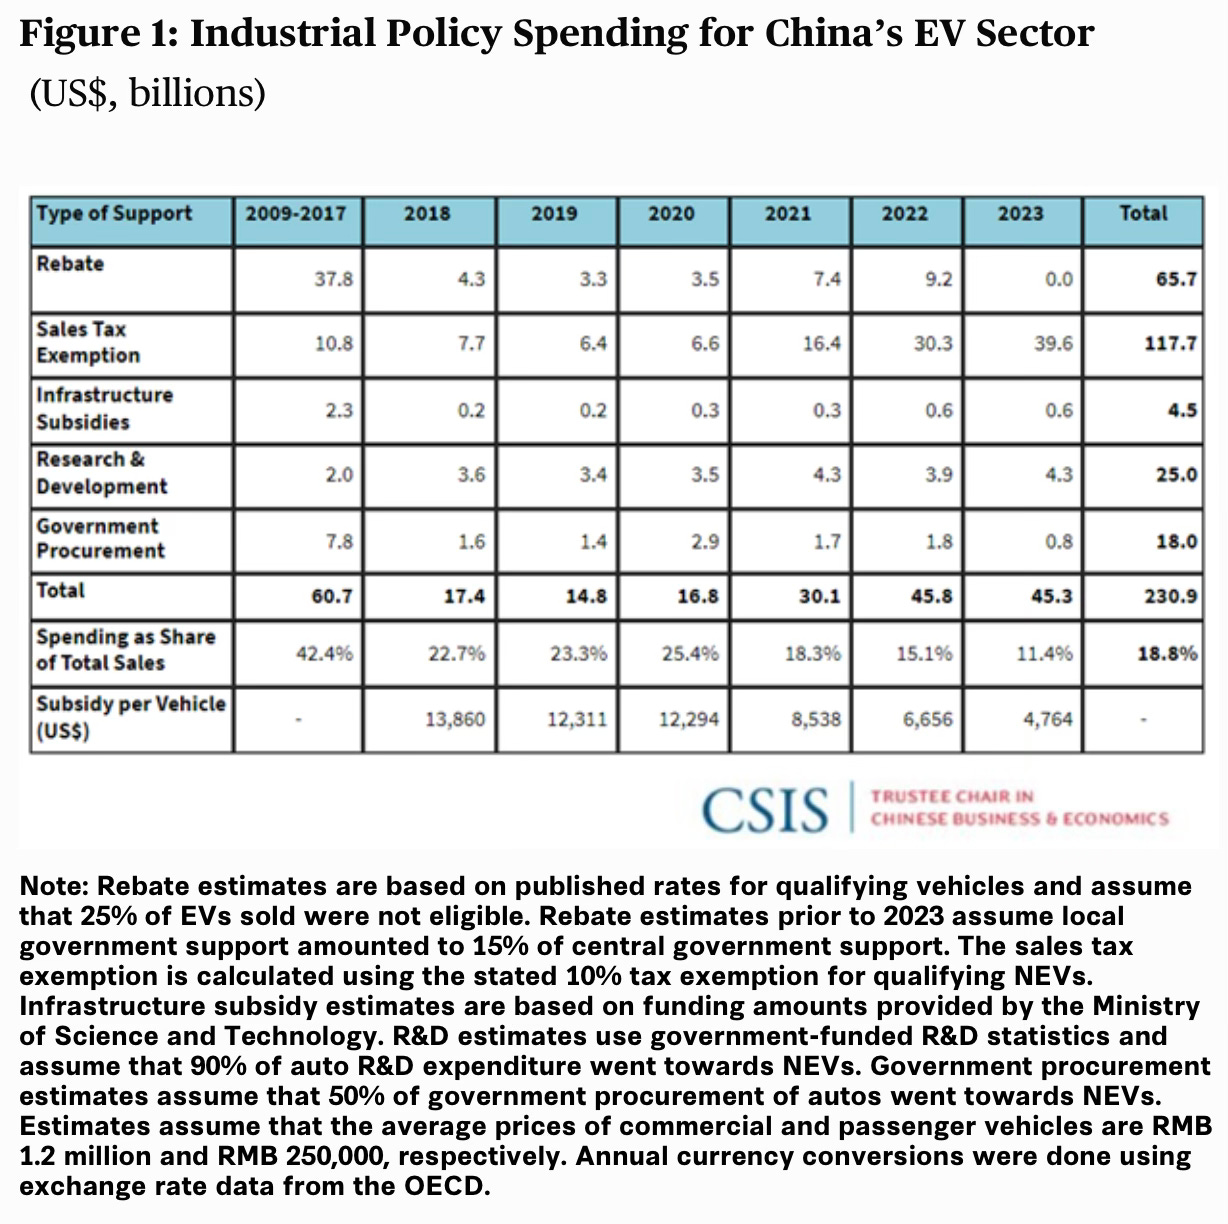
study by CSIS estimates that Chinese EV makers have received a staggering $230 bn in subsidies since 2009. Subsidies have nearly tripled during 2018-20 and have risen sharply since 2021.

The composition of subsidies has changed over time from sales price rebates in the early years to sales tax exemption now as the industry has matured. 

In this context, Dani Rodrik proposes a beggar-thy-neighbour test for a distortionary industrial policy, which appears to exclude Chinese-like industrial policies that support renewable and other new technologies. He writes,

When the Chinese government subsidizes research and development that enhances the country’s competitiveness in high-tech products and lowers their prices on global markets, the US and other advanced economies are hurt, because these are the areas of their comparative advantage. Despite the harm, however, we would not consider it proper to ask China to remove such subsidies, because our intuition tells us that supporting R&D is a legitimate tool to promote economic growth, even if others incur losses… Applying this perspective to the real world, one finds that the bulk of industrial policies in China and the US today are not beggar-thy-neighbor. In fact, many should be considered enrich-thy-neighbor. 

The clearest example is the broad range of green industrial policies that China has deployed over the last couple of decades to bring down the price of solar and wind power, batteries, and electric vehicles. These policies have been doubly beneficial to the world economy. They generate innovation spillovers, reducing costs for the world’s producers and lowering prices for consumers. And they accelerate the transition from fossil fuels to renewables, partly compensating for the absence of carbon pricing. When industrial policies appropriately target externalities and market failures – as in the case of green subsidies – they are not something to worry about. Moreover, while we can raise legitimate concerns about cases where these conditions are not met, the fact remains that the costs of inefficient industrial policies are borne primarily at home. It is domestic taxpayers and consumers who pay in the form of higher taxes and prices. Bad industrial policies are less beggar-thy-neighbor than beggar thyself

Trade partners are always free to impose their own safeguards, even when the policies they are responding to are not beggar-thy-neighbor. For example, if a government is worried about national security or adverse consequences for local labor markets, it should have the freedom to introduce export restrictions or tariffs to address these concerns. Ideally, such responses will be well-calibrated and targeted narrowly at the stated domestic goal, rather than being designed to punish countries that are not engaged in beggar-thy-neighbor policies. Distinguishing the small number of beggar-thy-neighbor actions from the vast array of other policies with cross-border spillovers is an important first step to easing trade tensions.

I think Dani Rodrik gets it wrong here in the context of China’s policies on renewable and other cutting-edge technologies. While China’s industrial policies in these areas might have created spillovers and helped hasten the green transition, they have also had damaging consequences for industries and economies. 

Across sectors from textiles and footwear, consumer electronics, thermal boiler-turbine-generator (BTG), metro railways, solar panels, cars (ICE and EVs), EV batteries, etc., China has employed the same set of policies over the last three decades. They consist of building massive capacity on the back of heavy industrial policy subsidies (in addition to low-cost land, electricity, and credit) and dumping excess capacity abroad at discounted prices, thereby rendering the importing country firms uncompetitive and capturing those markets. 

In addition to direct subsidies, Chinese manufacturers benefit from similarly subsidised component makers and their competitive discounted pricing, and a willingness or ability to produce and expand regardless of profitability (despite their global dominance, very few Chinese EV makers are profitable). For all these reasons, foreign competitors face a heavily tilted playing field when facing Chinese car makers. These policies have decimated industrial bases across trade partners, and caused tens of millions of job losses.

These economic impacts alone would have been sufficient to initiate protectionist measures against Chinese imports. But compounding matters, the country’s clearly aggressive foreign policy intentions and willingness to weaponise its manufacturing dominance pose national security risks that necessitate strict policies to protect the domestic economy against Chinese imports. Given these motivations, it’s inevitable that any market dominance becomes detrimental to the interests of other countries. The only way to counter it is by restricting market access to Chinese exports.  

Monday, December 23, 2024

Some thoughts on agriculture incomes

At a time when India’s manufacturing sector is buffeted by several headwinds that threaten a premature de-industrialisation, the services sector is predominantly informal and suffers from poor productivity, and also given India’s recent struggles with structural transformation (the latest PLFS data shows that the share of agriculture in India’s labour force has remained persistently high, even reversing course since 2018-19 to increase from 42.5% to 45.76% in 2022-23), it’s important that to achieve broad-based economic growth public debates should focus more on improving the productivity and incomes from agriculture.

But agriculture is one of the hardest areas for policy 

In this backdrop, the rapid rise of Ethiopia and Kenya as leaders in cut-flower exports and Peru as the runaway leader in blueberry exports are impressive success stories. This post will point to three similar successes of exports from India in a short time, table grapes (and wine) from the Nashik area of Maharashtra, inland shrimp farming in the Godavari and Krishna delta districts of Andhra Pradesh, and pomegranate in a few districts of Rajasthan. 

A feature of these examples is the absence of any specific efforts by the government to promote the specific sectors, beyond the provisioning of irrigation and some inputs and enablers generally available for agriculture. Instead, all of them have built on the enterprise of local farmers, especially the dynamic entrepreneurs among them. 

Sayantan Bera in Livemint has a great story about the remarkable success in a quick time of table grape production and exports centred around Nashik.

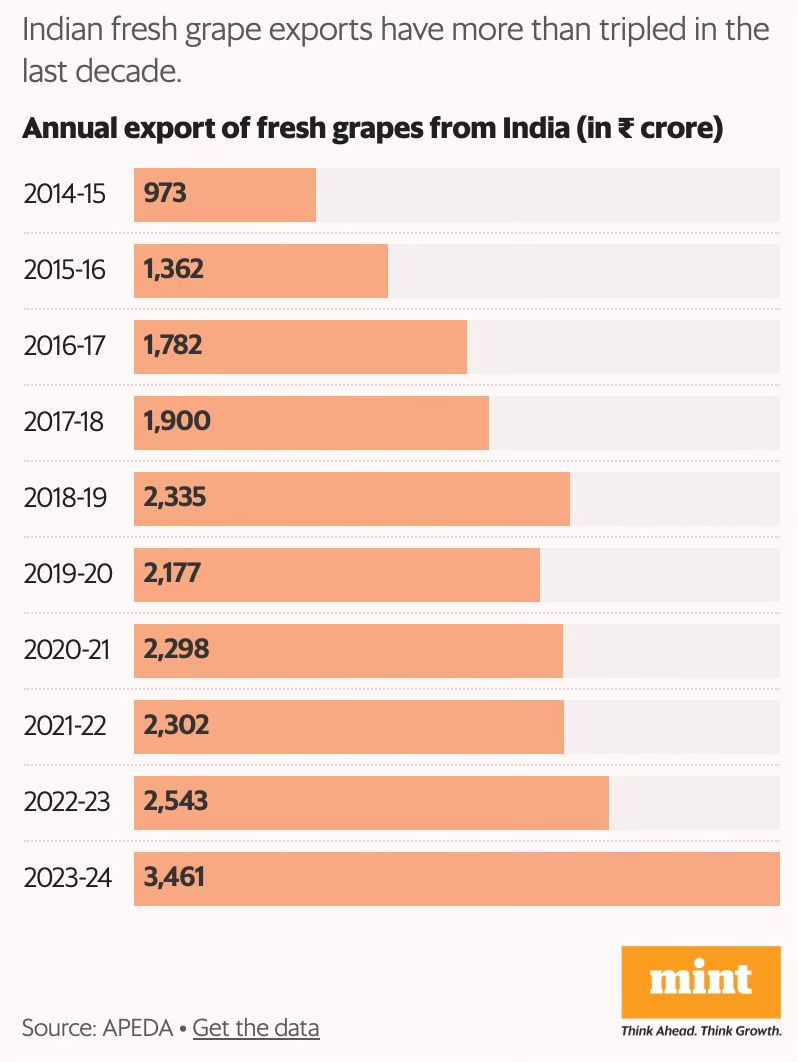
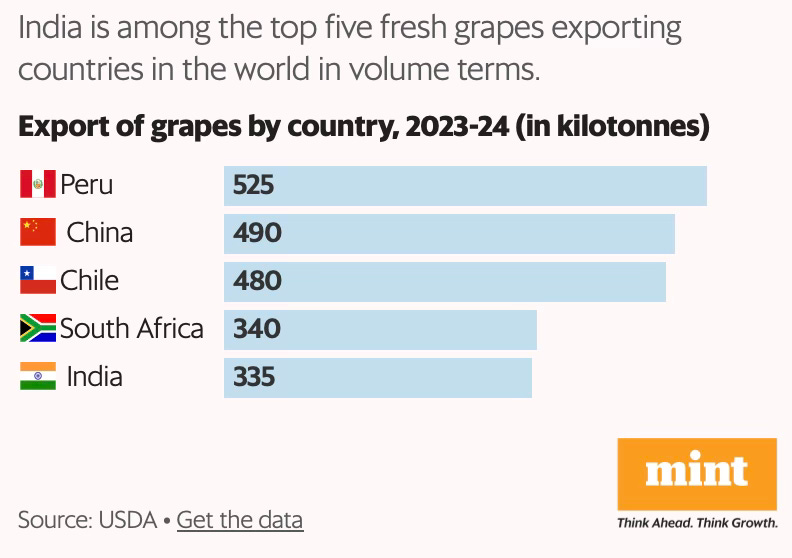
In 2023-24, India exported fresh grapes worth ₹3,461 crore, a 36% increase year-on-year, and a 3.5-fold jump over ten years. Close to half of the export volumes (45.8% in FY24) originated from just one district, Nashik, in northern Maharashtra, which has emerged as both India’s grape and wine capital. Riding on Nashik’s output, Maharashtra accounts for 67% of the country’s total production, with Karnataka (28%) and Tamil Nadu making up the rest… Grapes are a perennial crop and a plantation can be in production for up to 15 years. India primarily grows white (they are called white though they appear a vibrant shade of green) seedless varieties like Thompson, elongated varieties like Sonaka and black varieties like Crimson and Sharad… the vines require care and monitoring through the year… average production costs are around ₹2.5 lakh per acre.

You can spot Indian table grapes in global supermarkets, be it Tesco or Edeka in Europe or Choices Market in Canada, with farmers like Boraste catering to the exacting standards of fussy western buyers. The grapes supplied to Europe, for instance, have to be a certain size (berry size of 16-20 mm in diameter), be crisp and sweet (but not too sweet) besides meeting a long list of other quality parameters… a highly competitive export market for grapes has ensured lucrative prices for growers. For instance, in the 2024 harvest season (January to April) farmers received ₹65-70 for every kg of grapes they exported, much higher than the wholesale domestic price, which averaged between ₹25-30 per kg.

While there were general enablers from the government, the specific industrial success appears to have emerged from local initiatives. 

First, they are highly perishable and would perish within ten days of harvest without a cold chain. But Indian farmers and traders have cracked the storage challenge and now export grapes to distant shores—to Europe and Canada and closer home to China and the Middle East, where the fruit travels for up to a month on the seas. This is done by precooling the harvest at zero degree Celsius and then maintaining a cold chain that extends shelf-life to 45-60 days, till it reaches the consumer. Secondly, in a wild domestic market with few quality checks, farmers upgraded themselves to meet the exacting standards of western markets. They now produce grapes that are traceable (meaning, a consumer knows which field it comes from), closely monitor the sugar and acidity levels (which determine how the grapes taste), and follow stringent chemical residue limits set by global buyers… 

In 2004, Ganesh Kadam took charge of two acres of a family plot and now grows table grapes on 14 acres. In 2024, he supplied 880 quintals for export at a price of ₹70 per kg, fetching ₹61.6 lakh revenue. A smaller lot, worth ₹6 lakh, was sold in the domestic market. After spending close to ₹35 lakh on production costs, his net earnings for the season were more than ₹30 lakh (average production costs are around ₹2.5 lakh per acre). “As a visitor, one only sees the materialistic changes. How big one’s house is, how many cars a farmer owns… but it is important to understand how knowledge, technology and training drove this change," Kadam said. 

The article documents the critical role played by a co-operative society.

Sahyadri Farms, a farmer-owned company in which Kadam is a shareholder, has become the largest exporter of table grapes today. Exports would not have reached where they are today without its intervention, he said. “How else can a small farmer have access to the best technology, package of practices and an assured marketing channel," he asks. “I have been to Europe, seen how farming is done there, and how the produce is sold in supermarkets. Sarkari subsidies cannot take you there."… Farmers in Maharashtra have been commercially cultivating grapes for generations but began supplying to export markets only in early 2000. In 2010, most of the grapes shipped to the European Union were rejected due to the presence of excess levels of a growth regulator sold under the tradename Lihocin. Nearly half of India’s exporters shut shop after the tragic episode, which led to an estimated loss of ₹250 crore. But it taught farmers the importance of staying on top of global regulations and quality parameters. They were soon back in the game. 

Vilas Shinde, a farmer and exporter, was among those who went bust in 2010. But unlike most traders, he paid farmers their due by selling his land (he lost ₹6.5 crore that year). In 2011, Shinde set up Sahyadri Farmer Producer Company Ltd together with 110 shareholder farmers with the aim of exporting grapes. Farmer producer companies are like cooperatives but set up under the Companies Act to ensure little or no bureaucratic and political interference. Since 2012, when Sahyadri shipped its first containers, its grape export volumes have grown seven-fold to 21,000 tonnes (as of 2024). Because grapes are a seasonal business (peaking between January and March, during harvest and shipping) Sahyadri diversified into other crops such as tomato (it is currently the largest processor of tomatoes in India and a contract manufacturer for Hindustan Unilever’s Kissan ketchup brand), bananas, pomegranate, sweet corn, mangoes, and cashews. The company’s 120-acre campus in Mohadi, Nashik, is a post-harvest hub with packhouses, cold storages and processing lines for these crops. In FY24, Sahyadri clocked a turnover of ₹1,549 crore, a 55% increase year-on-year.

Sahyadri is now a collective of 26,000 farmers cultivating 40,000 acres. In a way, it is trying to do with perishable horticulture crops (where production and prices often fluctuate wildly) what the Amul cooperative did for small dairy farmers. What’s more, Sahyadri plans to go for a public listing by 2026—that would be a first for a farmer producer company, racing ahead of VC-funded agriculture startups… In 2022, Sahyadri purchased the exclusive rights from Grapa, a California-based breeder, to grow its patented Arra variety of table grapes for a sum of ₹35 crore. By all measures, it was a significant intervention, that too by a farmer-owned company, to get the latest global technology for its growers. In 2024, the first batch of Arra grapes sold for an eyepopping ₹250 per kg in an auction held on a Nashik farm. Growers associated with Sahyadri are gradually replacing their vines with Arra varieties, and expect farmgate price realization to double to ₹150 per kg.

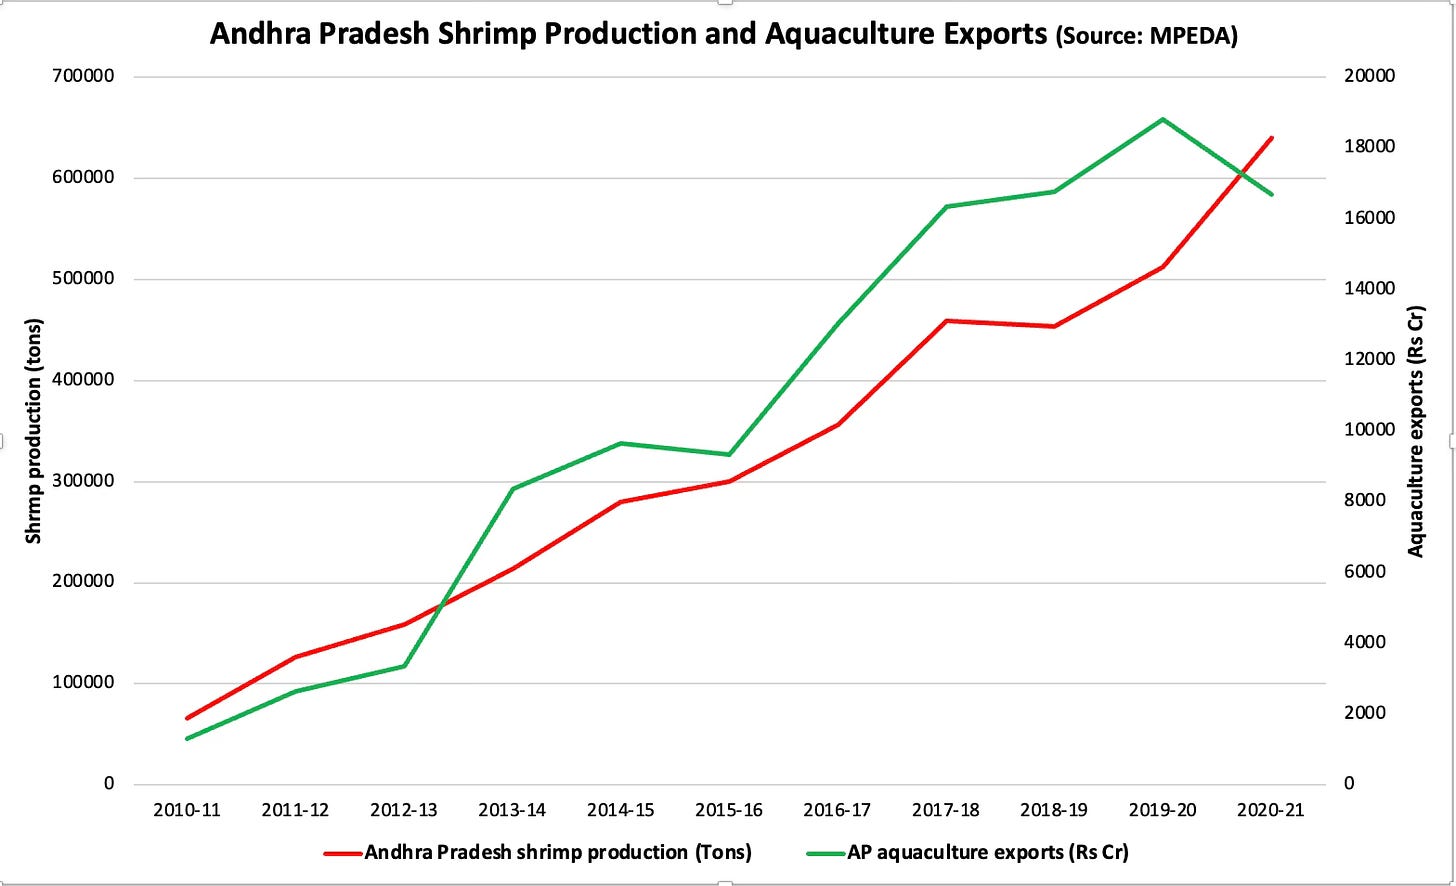
Another example of a successful breakout is inland aquaculture, specifically shrimp farming, in the delta districts of Andhra Pradesh. Following the introduction of the L. vannamei shrimp variety in 2009. the state has dramatically multiplied several-fold shrimp production and aquaculture exports (which are mainly shrimp in value).

Freshwater shrimps typically yield a profit of Rs 3-4 lakh per acre, after adjusting for risks. Interestingly, state government data reveals that of the 1.35 lakh farmers doing aquaculture on 4.5 lakh acres, just 6398 farmers with more than 10 Acres and an average extent of 28.63 acres used 41% of the land area. 

While I have not come across a formal study explaining the contributors to this success, anecdotal snippets point to some important insights. One, there was no specific government scheme or focused initiative that contributed to the inland shrimp culture boom in Andhra Pradesh. In fact, shrimp production grew at a compounded annual rate of 17.9% till 2018 without any power subsidy. Incidentally, the growth rate declined to 11.7% till 2020-21 after the introduction of subsidised power at Rs 1.50. 

Further, as this study shows, lack of government support was the least cited constraint facing shrimp farmers. It also shows that the major constraints were access to good quality seeds and other inputs, and better management practices. While governments can play a role in facilitating access and provision of good extension services, there are serious limits to the quality and effectiveness of such efforts. 

Instead, conditional on the promise of the industry and a reasonable regulatory environment (shrimp culture in AP passed both these tests), these constraints are best relaxed by enterprising farmers. It’s therefore no surprise that anecdotal evidence from AP points to the same conclusion. The rapid rise of shrimp culture itself and the major contributors to steep rise in production and exports are the efforts of a handful of enterprising farmers in East and West Godavari and Nellore districts who seized the opportunity to access good quality seeds and cheaper inputs, and adopted productivity enhancing and cost optimising management practices. It helped that the region had a brief episode in the 1990s of boom in aquaculture that was disrupted by pest attacks. 

Finally, Harish Damodaran writes about the recent emergence of pomegranate farmers in Rajasthan, covering an estimated 12,500 hectares in Barmer, Sanchore, Jalore, Sirohi, Jodhpur, and Phalodi districts. He chronicles the success of one farmer who generates an annual income of around Rs 1.5 Cr from his 32 Acre orchard where he has deployed drip irrigation facilities. This is a good summary of the transformational effects of such breakouts

The 30-km stretch from Dechu to Kalau is now a major anar cluster, with all the orchards having drip irrigation facility. Mali’s land value has shot up from a mere Rs 8,000 per bigha in 2004 to Rs 1 lakh in 2017 and Rs 5 lakh now — all thanks to anar. Till about 2004, Mali cultivated only bajra (pearl millet), guar (cluster bean), moth (dew bean) and moong (green gram) during a single kharif or post-monsoon crop season. With water-saving sprinklers, Mali could now plant rabi (winter-spring) season crops — raida (mustard), chana (chickpea), jeera (cumin) and isabgol (psyllium husk) — and also groundnut during kharif.

The article points to how access to high-quality seeds and exposure visits were important triggers for generating interest among farmers.

The turning point came in August 2017. That was when the state horticulture department supplied him 12,000 disease-free, tissue-cultured plants of Bhagwa Sinduri, a high-yielding pomegranate variety developed by the Mahatma Phule Krishi Vidyapeeth University at Rahuri in Maharashtra. “They charged Rs 40 per plant and credited back Rs 16 to my bank account after I bought it. Of the 12,000 plants, 3,000 were infected by nematodes and termites. The remaining 9,000, planted at 8 ft x 12 ft spacing, survived,” recalled Mali. He further spent Rs 8.5 lakh on laying 10,000 metres of drip irrigation pipes with emitters at 2 feet distance, and got back Rs 3 lakh as subsidy on this investment as well… 

In early June, Jodhpur-based South Asia Biotechnology Centre (SABC), a non-profit, took 30 pomegranate farmers from western Rajasthan on an Anar Shodh Yatra. The 10-day field trip, supported by the NABARD’s Agri-Export Facilitation Centre in Jodhpur, involved visits to INI Farms’ integrated pack-house facility near Pune, the National Research Centre on Pomegranate at Solapur, and the Yara Crop Nutrition Centre at Pandharpur. The idea was to expose the farmers to the best cultivation and post-harvest management practices in Maharashtra, which accounts for 55 per cent of India’s annual pomegranate production of 3.2 million tonnes. 

Note how enterprising farmers like Mali seized the opportunities presented to them and also the role of non-profits like SABC. 

In light of these examples, what can the government do in agriculture? 

I have blogged here pointing to the challenges faced by public policy in agriculture. Agriculture is one of the most challenging sectors for public policy. It engages with people who are generally poor and semi-literate. It is bedevilled with incentive distortions due to subsidies, and market failures arising from the nature of the sector. Finally, it must reconcile the interests of producers (who want high prices for their produce) and consumers (who want affordability).

Therefore, the government should continue to make investments in irrigation, provision of extension services, enable access to inputs and credit, finance downstream investments like storage, and support market enablers like certification. As all three examples illustrate, access to good quality seeds is a critical contributor to raising farm incomes substantially. 

In addition, it would do well to demonstrate the possibilities and opportunities to local farmers in the belief that at least some among them will emerge as pioneers for new crops and practices. For example, there are similar opportunities for other fruits and vegetables like custard apple, guava, dragon fruit, avocado, pear, etc. There’s a need to create numerous clusters of high productivity and high incomes that have the potential for transformational local spillovers. 

Once a farmer demonstrates some interest, government extension and other services should be channelled to support these self-selected farmers in pursuing their interests. Specifically, exposure to new opportunities and identification and encouragement of progressive or enterprising farmers should become an explicit priority of agriculture departments.

Public policy can also play a role in addressing coordination failures by connecting such progressive farmers with all the market actors, especially the agriculture sector non-profits and startups, in addition to companies, who are involved in pre- and post-harvest linkage activities. Given the expanding landscape of such non-government actors, governments should enlist them as close partners and even support them financially where possible to increase the effectiveness of their engagement with farmers. 

The problem with such policy activities is that they lose their effectiveness when done in a commoditised programmatic manner. Their effectiveness lies in their organic emergence where the value proposition is made evident to all sides involved (instead of the standard approach of creating an IT platform to connect everyone, and leaving it at that). 

Supporting enterprising farmers is perhaps the highest value for money investments in agriculture, and the activities of such farmers also have the highest multipliers on the local farmers and farming practices. 

Finally, society must start to celebrate enterprising farmers in the same way as startup founders. In fact, unlike many startup founders who merely build companies with ephemeral valuations, enterprising farmers create genuine and lasting value. Their average economic multiplier or marginal value is perhaps higher than those of a tech startup founder, especially in the Indian context. Instead of being stigmatised, dynamic farminc entrepreneurship of the kind discussed here should become a livelihood that people should be encouraged and supported to pursue with interest.