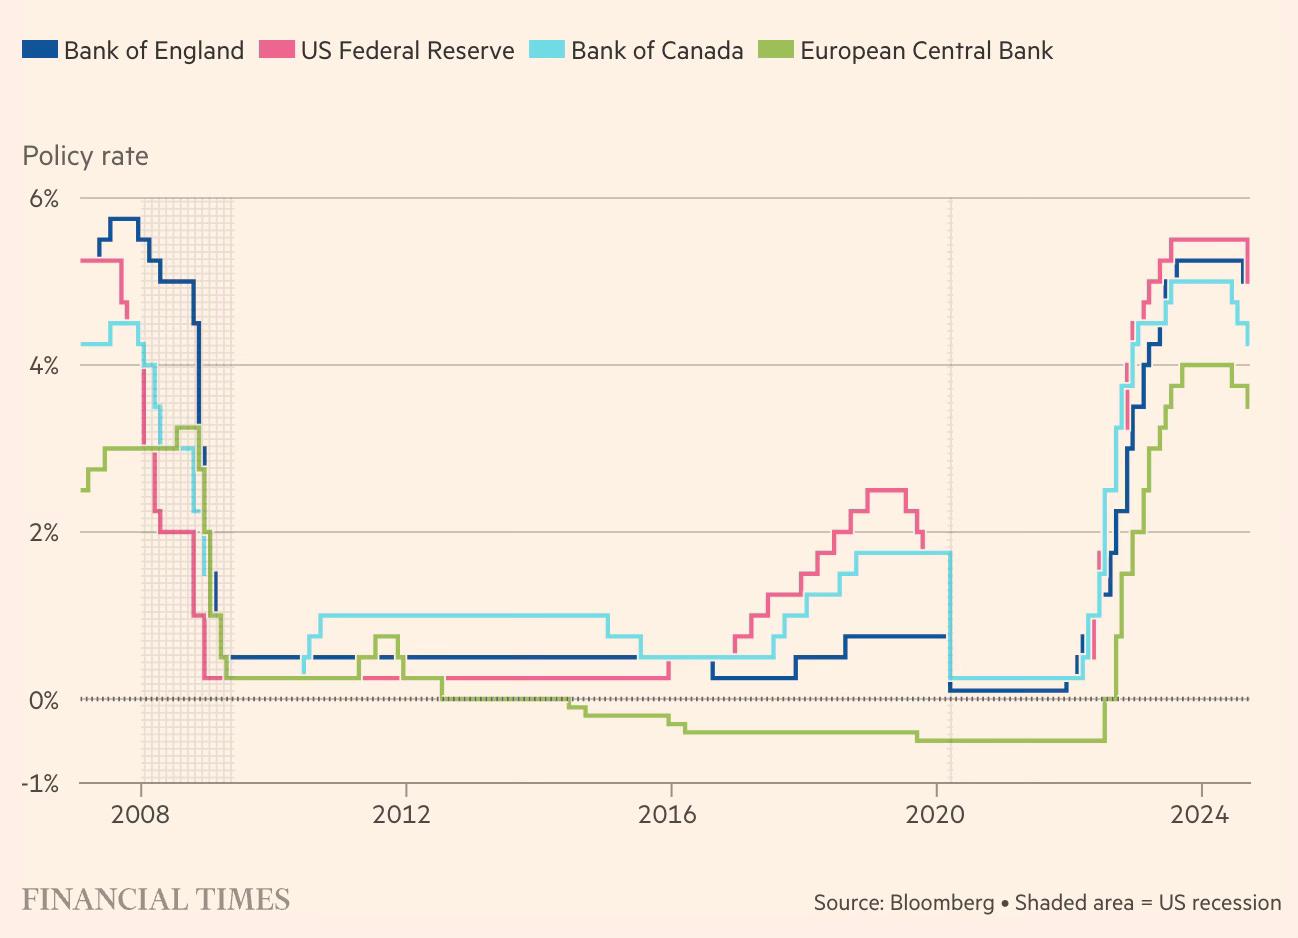
Substack

Monday, September 16, 2024

R&D expenses, productivity, and growth in the age of Big Tech

Econ 101 informs us that R&D investments spur innovation and productivity growth, which in turn lower production costs and create newer products, boost consumption, drive further investments, job creation and economic growth. In short, R&D investments and innovation trigger a virtuous loop.

Gillian Tett points to an interesting paradox that questions this conventional wisdom that R&D investments invariably result in innovation, productivity growth, and expansion of economic output. Sample some numbers.

On the one hand, American R&D has risen in recent decades, from 2.2 per cent of GDP in the 1980s to 3.4 per cent in 2021. That reflects a doubling of private sector R&D to 2.5 per cent of GDP. Meanwhile, the proportion of the population involved in patent production nearly doubled in this period. But there is a big catch. Although “conventional economic models” imply that increases in R&D spending on this scale “should have led to accelerated economic growth”, this has not occurred. Michael Peters, a Yale economist, lays out the grim news: while labour productivity rose on average by 2.3 per cent between 1947 and 2005, between 2005 and 2018 it fell to 1.3 per cent. This cost America a putative $11tn of output, he calculates.

Micheal Peters in the IMF’s latest F&D magazine points to the US productivity growth being on a secular decline, that has become pronounced during the digital age since the turn of the millennium.

There is growing evidence that the US economy is not as dynamic as it used to be. A key aspect of business dynamism is new business formation. It is often measured by the entry rate, or the share of enterprises that started operating in a given year. The entry rate fell from 13 percent in 1980 to 8 percent in 2018, according to the US Census Bureau. In addition, US enterprises became substantially larger, with the average number of employees rising from 20 in 1980 to 24 by 2018. Older and bigger companies thus account for a much larger share of economic activity than they used to. These trends indicate significantly declining dynamism in the US economy over almost four decades…

First, the rise in corporate concentration has been shown to go hand in hand with expanding market power. The average markup by publicly traded US companies surged from about 20 percent in 1980 to 60 percent today. Large incumbent businesses thus seem to be shielded more and more from competition, allowing them to jack up prices and widen profit margins. A second line of research shows the flip side of rising corporate market power: the weakening of workers’ bargaining position. Since 1980, labor’s share of the US economy has fallen by about 5 percentage points. The plunge was faster in industries that experienced more concentration… Third, there has been a secular decline in business-to-business reallocation since the late 1980s, as shown in a series of papers by John Haltiwanger and other researchers. This suggests that the process of workers moving from declining to expanding businesses is not as fluid and dynamic as it once was.  

Peters also explores the possible causes for this productivity decline.

The ten biggest tech companies by capitalisation in Nasdaq spent a total of $222 bn in R&D in 2022, of which Amazon alone spent $73.2 bn. 

Remarkably, these kinds of R&D expenditures have not been accompanied by job creation. As an illustration, even as Amazon, Microsoft, and Alphabet spent a record $139.3 bn on R&D, the three laid off 40,000 workers at the beginning of 2023. 

Germán Gutiérrez and Thomas Philippon measured the evolution of dominant firms in the US since 1960 (top 20 firms by global sales and top 4 firms in each 3-digit industry) and globally since 1990 (top 100 firms by global sales in a given year and the top 20 firms in 25 industries), and found that their contribution to aggregate productivity growth has fallen by more than one-third since 2000. 

In another paper Philippon writes

I estimate that markups in the United States have increased by about 12% since 2000. Such an increase in markups implies that wages and consumption are at least 10% below their potential… increasing markups in the United States have lowered labor income by about $1.44 trillion… the stars of the digital economy—Amazon, Google, Facebook, Apple, and Microsoft (GAFAMs for short)—are not as “special” as one might think… Along all qualitative dimensions, including profit margins and productivity, the stars of today are… they are smaller than market leaders of the past, and they matter less for overall GDP growth than General Motors, IBM, or AT&T did at their peak… rising market concentration since the early 2000s has produced market inefficiencies. Dominant firms have succeeded in erecting barriers to entry, which has resulted in lower investment, higher prices, and slower productivity growth.

Given the aforementioned facts, here are some observations:

1. Joel Mokyr has made the distinction of useful knowledge as one that promotes material progress. It consists of propositional knowledge (“what”) and prescriptive knowledge (“how”), with the former consisting of people who know things (savants) and the latter of people who make things (fabricants). He uses this distinction to explain why the Industrial Revolution originated in England and not in continental Europe. On the same lines, it may be useful to make the distinction within R&D investments and categorise some as useful R&D. Ditto with innovation. 

Are R&D expenditure and innovation increasing the economic output? Is it creating jobs? Or is it being used to create moats around the markets served by the big technology companies? Given the nature of the digital technology markets, with their network effects and the advantages conferred by access to large data, are the large R&D expenditures conferring an unbridgeable advantage to the large incumbents?

There’s a case for distinguishing between defensive and productive R&D, with the latter aimed at protecting the turf/market. More on this latter in the post.

2. In the last 2-3 years, there has been a surge in AI-related R&D investments. As the graph above shows, each of the US Big Tech firms - Amazon, Alphabet, Apple, Microsoft, Meta, Nvidia etc. - have been making AI-related investments in the tens of billions of dollars every year. So much so that the entire US equity market is now riding almost entirely on the AI investment boom. However several questions are being raised about the likely value generation from these investments. The vast majority of commentators view this boom as being driven by FOMO and disconnected from any value creation. 

Is it then the case that the returns from R&D investments, or their productivity, have declined? Or is it that the technology will take time to mature and start to show its benefits? Or more generally, are large firms being inefficient in their allocation of R&D expenditures? Or a combination of all three?

Ufuk Akcigit writes in the same issue of the IMF’s F&D magazine:

In earlier research, Harvard’s William Kerr and I found that small businesses are more innovative relative to their size, suggesting they use R&D resources more efficiently. As companies grow and dominate their markets, they often shift their focus from innovation to protecting their market position. In a more recent study, Salome Baslandze, Francesca Lotti, and I showed using Italian data that larger enterprises tend to innovate less and instead engage in activities that limit competition. One such activity is hiring local politicians. As businesses climb the ranks among the largest 20 players in their industry, they hire more politicians, while their patent production declines. This highlights what we call a leadership paradox, where leading companies plow resources into maintaining dominance rather than fostering innovation… As dominant players prioritize strategic moves over genuine innovation, the economy as a whole is almost certainly missing out on potential growth opportunities.

3. Most importantly, it’ll be useful to examine where these R&D investments are going. These are astronomical sums, larger than the entire R&D expenditures of several large countries combined, including those like India. Are they actually going into research and development? Or is it some accounting trick to benefit from tax rules?

The primary reason to doubt these numbers is a palpable absence of their signatures on the products and services being delivered. Has e-commerce, social media engagement experience, and internet search got so much better in say, the last five years, to justify even a small part of these expenditures? Does building and maintaining data centres (whose buildings and operations are outsourced to PE funds and their boring infrastructure contractors) demand such levels of R&D expenditures?

It’s hard to imagine or rationalise that e-commerce, social media, and internet search (and advertising) can consume anything even remotely close to the amounts being spent on R&D. One associates with R&D in digital technologies to some equipment and software costs, and considerable manpower costs. Even at the higher end of such expenditures, $73.2 bn (and similarly high numbers in earlier years) appears mind-boggling. So where is this likely coming from (or what’s it going into)? 

A comment on a discussion thread in Hacker News nails it:

This $73.2B figure was pulled directly from their 2022 10-K filing under an operating expenses line item labeled technology and content, which includes R&D and then some. The devil in the details is buried in a footnote on p. 26:

Technology and content costs include payroll and related expenses for employees involved in the research and development of new and existing products and services, development, design, and maintenance of our stores, curation and display of products and services made available in our online stores, and infrastructure costs. Infrastructure costs include servers, networking equipment, and data center related depreciation and amortization, rent, utilities, and other expenses necessary to support AWS and other Amazon businesses.

At face value, to handwave this figure as just R&D and purport that it's directly comparable to other publicly-traded companies who report disaggregated research and development strikes me as somewhere between shotgun analysis and hoodwinking.

Read this Forbes article which says the same things, and see this

Here is the table indicated above.

Amazon spends large amounts on its AWS data centres. All those expenditures are lumped together into the basket of technology and content. Even its prime Video content is classified under R&D. In short, it appears that Amazon lumps all its personnel, software and hardware costs under R&D. 

Is all this disingenuous accounting motivated by tax minimisation strategies adopted by these companies? Is Amazon benefiting from the greater tax benefits accorded to R&D expenses? Akcigit again

The Federal Reserve’s Sina Ates and I examined market competition trends in the US over the past several decades. Since the early 1980s, there’s been a noticeable increase in market concentration and a decline in business dynamism… This period aligns with the 1981 introduction of the R&D tax credit, a component of President Ronald Reagan’s sweeping Economic Recovery Tax Act. The credit was intended to encourage businesses to invest in research and development. Minnesota was the first state to adopt a similar state-level R&D tax credit, in 1982, and many other states followed, expecting to promote innovation and economic growth. Which companies are most likely to take advantage of the R&D tax credit? Our research with Goldschlag shows that large businesses are much more likely to benefit than smaller ones. The policy—perhaps unintentionally—favors big companies, encouraging them to dominate in R&D spending… Our research provides direct evidence that businesses actively claiming R&D tax credits are more likely to engage in stifling hiring practices. These enterprises often offer higher salaries to inventors, and the inventors become less innovative after joining.

It’s therefore clear that all the so-called R&D expenditures are mostly about the general operational and capital expenses! So after all, real R&D expenditures might not have gone up as much as we imagine, which also explains the apparent paradox of low productivity growth. 

4. In this context, it’s also worth making the distinction between the R&D expenditures of firms in digital technology and traditional economy sectors. Technology firms like those above are constantly iterating and improving their algorithms and user interfaces (and the logistics operations in the case of Amazon and advertising engine in the case of Google) as part of their regular operations. The nature of digital technologies (for example, with digital trails that serve as fuel for data analytics and AI-algorithms) ensures such iteration and refinement. 

There’s an indistinguishable line between the R&D expenditures of technology firms and their operational expenses. It’s different from the distinct role of R&D in the traditional economy where it’s about inventing new technologies, products, and services. The likes of Amazon, Meta, Alphabet, Apple etc., have not brought out any new product, but are only marginally refining their algorithms and at best moving into emerging adjacent markets (where too they have a head start due to the nature of their platform business models). They are, for all practical purposes, one trick ponies.

This raises the need for greater clarity in the accounting of R&D expenses of digital technology firms. 

5. One of the surprisingly less discussed but widely known features of technology markets today is the stifling grip exercised by the big firms. This hold covers hiring and retaining critical personnel, patent acquisition, protection of their own patents, and even protecting themselves from being gobbled up. Big Tech (and large incumbents generally) firms employ armies of lawyers to engage in the likes of patent trolling, squatting, and hoarding to copy, steal and intimidate startups. 

More from Ufuk Akcigit

Over the past two decades, there has been a notable reallocation of innovative resources toward large, established companies, Goldschlag and I documented in 2022. At the beginning of this century, roughly 48 percent of American inventors worked for these big incumbent companies—those that are more than 20 years old and employ more than 1,000 workers. By 2015, that figure had surged to 58 percent, marking a significant shift in where the nation’s innovative talent is concentrated… research shows a concerning trend: inventors that move to large firms become less innovative compared with inventors that move to young firms.

A specific practice identified in our research is innovation-stifling hiring. This occurs when big, established enterprises hire key employees from younger competitors, often by offering higher salaries. However, instead of using these new employees to drive innovation, the big businesses may place them in roles that do not fully leverage their skills. As a result, these individuals become less innovative, and the overall innovative capacity of the economy suffers. After 2000, there was a notable increase in the wage premium offered by established companies, compared with salaries paid by younger businesses. The pay differential widened by 20 percent, prompting many innovators to switch jobs and join larger, well-established companies. However, these inventors’ innovativeness dropped by 6 percent compared with that of their peers who joined younger employers… By hiring away top talent from rivals, these companies not only weaken their competitors but also prevent these individuals from contributing to potentially disruptive innovations elsewhere. This strategy may benefit the hiring business in the short term, but it poses a long-term risk to the economy’s overall innovation and growth. 

Given all these, startups stand little or no chance of competing with large incumbents. It’s an open secret that the Big Tech firms unleash their lawyers and financiers to intimidate and squeeze any startup trying to compete with them. I don’t know whether the libertarians and tech evangelists who wax eloquent about digital utopia and lose no opportunity to argue for deregulation and getting government out of the way are being ignorant or disingenuous or plain dishonest when they overlook the egregious manner in which Big Tech firms unleash their lawyers and corporate brokers to intimidate startups. 

Why are none of the economists in the big Economics Departments silent about one of the commonest market practices which is also the biggest threat to competition in digital markets?

I have written here (and here) about how Amazon uses anti-competitive practices to copy and forcibly buyout emerging startup competitors and then kill off their technologies or adopt them itself. 

The final word to Akcigit

The evidence suggests that while the US is investing more in R&D, the concentration of resources among large businesses has led to diminishing returns in terms of productivity growth. This outcome challenges the assumption that simply expanding R&D spending will automatically lead to economic growth. Instead, it highlights the need for a more nuanced approach to industrial policy—one that not only incentivizes R&D but also encourages the effective reallocation of resources. To foster a more dynamic and innovative economy, the US needs to design policies that support not just large incumbents but also smaller businesses and start-ups, which often have a greater capacity for disruptive innovation. This could include targeted tax credits for small businesses, grants for early-stage innovation, and policies that encourage competition and reduce barriers to entry for new players. 

Saturday, September 14, 2024

Weekend reading links

1. Railways looks set to come the full circle back to government control in the UK. From an FT editorial last week
A bill set for a lightning third reading on Tuesday will return franchised passenger rail services to public hands when existing contracts end or reach a breakpoint — which at least means this renationalisation has little upfront cost. The government says it will produce a more centralised network, under the “directing mind” of a still-to-be-created arms-length body, Great British Railways. It touts the potential to cut costs by removing duplicative bureaucracy, and to simplify the unpopular maze of ticketing.

And this

The Labour government is set to launch legislation to nationalise the railways as a matter of priority, with takeovers of some of the UK’s busiest operators expected within months. Nearly three-quarters of train journeys in Britain are expected to be on nationalised rail services within a year under Labour’s plan... The legislation is intended to renationalise the rest of the railway after about 40 per cent of services were taken over by the previous Conservative administration as operators failed over the past decade... Under the bill, contracts to run train operators that are let to private companies will be permanently returned to the government as soon as they expire.

2. Jean Pisani Ferry has some wise words on green transition costs

The reality is that it’s a combination of supply and demand shocks. The demand shocks caused by the additional investment are obviously positive. The supply shocks are mostly negative, at least in the short term. And the reason for that is that one way or another, you’re basically paying for a resource — a stable climate — you used not to have to pay for. It is the same if the investment is triggered by regulations instead of the pricing of carbon: economic agents are compelled to spend significant amounts for capital expenditures that do not improve the efficiency of capital and labour... the overall magnitude is equivalent to the first oil shock of 1973-74. And the first oil shock isn’t remembered as something very positive...

So essentially, we are going to invest 2 to 3 per cent of GDP for 10, perhaps 25 years. Burning fossil fuels is significantly less capital intensive than investing in clean energy. And we’re substituting that with a system in which upfront investment is required to transform the energy system and to ensure it does not rely on fossil fuels. It means investment that’s normally devoted to improving overall efficiency, improving total factor productivity or saving labour, has to be diverted to saving on fossil fuels. And that’s not going to improve your economic performance. That is, unless — and it’s possible in the long term — the new technology proves to be much more efficient than the old technology. So that’s what makes me hopeful that in the long run, I mean at the 20- to 25-year horizon, it may be that the use of such technologies proves to be more efficient overall. But that does not eliminate the transition cost... job-neutral globally — which I don’t think it will be, because the labour intensity of an EV [electric vehicle] is much lower.

And he has a very good comparison

At the time of the Industrial Revolution, there were agrarian interests versus manufacturing interests: there was a fight between those two strands of capitalism. And I think it’s a bit the same. There is a green capitalism that has developed and has gained strength. It’s a war between two strands of capitalism — green and brown.

3. As the frequency, intensity, and damages from forest fires rise, state governments in the US are reviving an age-old practice of triggering small beneficial fires in an effort to prevent the accumulation of the fuel that sustains large fires. 

According to one study from researchers at Columbia and Stanford, low-intensity fires, a category that includes mild natural fires and prescribed burns, reduce wildfire risk by about 60 percent. Experts also say that prescribed burns have reduced the severity of previous wildfires, including in Yosemite National Park, where researchers found that they helped protect giant sequoias during the Washburn fire in 2022. Most of California’s ecosystems have evolved to adapt to or depend on fire, which can rejuvenate forests and help nutrients return to the soil. But federal and state land management agencies banned intentional burns for many decades, arguing that all fires were dangerous and could hurt the timber industry. This, along with aggressive efforts to suppress wildfires, allowed vegetation to accumulate, a condition that could supercharge blazes...

Federal and state agencies, as well as other groups that work with them, including private citizens and businesses, are setting fires that burn the dry grasses, small trees and other vegetation that could otherwise fuel an intense wildfire... Land managers in the state, including the California Department of Forestry and Fire Protection, and federal agencies have set a target of intentionally burning 400,000 acres annually by next year, an amount of land that when combined would be larger than the city of Los Angeles. The goal is to chip away at the 10 million to 30 million acres that officials estimate would benefit from some form of fuel reduction treatment. In 2022, the most recent year for which there is data publicly available, about 96,000 acres were burned by these land managers... Since then, intentional burn practices, including planned fires and cultural burning by Native American tribes, have been gradually reintroduced. Nowadays, these efforts are carried out by various entities across the state, including Cal Fire, the U.S. Forest Service, tribal organizations and private citizens...

In addition to the need for more funds... controlled burn programs face a number of other hurdles. Already limited in number, firefighters who would staff a prescribed fire are often called away to battle an active blaze. There are also only so many days in a year that conditions are right for a fire, and access is a challenge in some locations. And local communities may oppose a controlled burn... The U.S. Forest Service has said that over 99 percent of these fires go as planned, but mistakes can be destructive. In 2022, the agency lost control of two prescribed burns in New Mexico. The fires merged and grew to become the largest recorded fire in the state’s history, destroying hundreds of homes.

4. What has been driving Nvidia?

Notably, less than 5 per cent of Indian patent citations refer to other Indian patents, reflecting a low level of local knowledge creation and heavy reliance on foreign sources. By comparison, China and South Korea have local citation rates of 10 and 20 per cent, respectively. India also ranked 42nd out of 55 countries on the 2024 International Intellectual Property Index, with an overall score of 38.64 per cent, unchanged from the previous assessment... the ratio of big businesses to unicorns in India is just 0.1, compared to 0.9 in the US, 0.4 in China, 0.5 in Germany, 0.25 in Brazil, and 0.6 in South Korea.

6. Some numbers on ESIC and EPFO deductions

Take the example of Sarita, a (fictitious) new employee in Mumbai earning Rs 15,000 per month (Rs 1.80 lakh annually). She must pay a profession tax of Rs 2,500 annually... Next, Sarita (Rs 1,350) and her employer (Rs 5,850) must pay a total of Rs 7,200 annually to the Employees’ State Insurance Corporation (ESIC). However, getting claims from ESIC is notoriously difficult, effectively making it another tax. ESIC holds Rs 1,17,000 crore in reserves. The claims paid (Rs 14,000 crore) are 83 per cent of contributions (Rs 17,000 crore), and investment income (Rs 7,000 crore) is 41 per cent of contributions (Source: Accounts for year ended March 31, 2023). The numbers reveal a system where contributors have long given up hope of receiving claims. Then you have the Employees’ Provident Fund Organisation (EPFO) triplets. Sarita contributes Rs 1,800 monthly to her EPF, while her employer contributes Rs 600 to her account, plus Rs 75 in administrative charges. In addition, her employer contributes Rs 1,200 to her Employees’ Pension Scheme (EPS) account and Rs 900 for her life insurance (of Rs 7 lakh), under the Employees’ Deposit Linked Insurance (EDLI) scheme.

All these small deductions add up. Sarita pays Rs 25,450 per year (Rs 21,600 EPF + Rs 2,500 profession tax + Rs 1,350 ESIC), leaving her with Rs 1,54,550 from her salary of Rs 1,80,000. Meanwhile, her employer pays a total of Rs 39,250 (Rs 7,200 EPF, Rs 24,400 EPS, Rs 900 EDLI, Rs 900 administrative charges and Rs 5,850 ESI), making Sarita’s total cost to the employer Rs 2,19,250. The difference (Rs 64,700) between her employer’s cost and Sarita’s take-home pay is 42 per cent—coincidentally the same tax rate for individuals earning over Rs 5 crore annually. Effectively, the lowest-paid employees are taxed at the same rate as the highest earners.

7. Fascinating story of William Phillips, the famous economist of Phillips curve fame, who travelled from a farm in New Zealand to become the world famous economist at LSE who in 1949 demonstrated to an astounded audience of superstar economics professors "the first ever computer model of a country's economy", the Moniac. 

Phillips might have been expected to go to university — he passed every exam — but there was a problem. In 1929, a collapse in share prices... had set in motion the Great Depression. Its effects lasted for years, and reached as far as a dairy farm in Te Rehunga. Prices for agricultural commodities plummeted, and Harold and Edith simply couldn’t afford to send their son off to study. Phillips became an apprentice electrician at a hydroelectric power station instead... In 1935, the apprentice electrician left Te Rehunga to see the world. Steve Levitt, a co-author of Freakonomics, was once dubbed “the Indiana Jones of economics”, but if that swashbuckling label belongs to anyone, it’s Phillips. In between leaving New Zealand and his first brush with economics in 1946, Phillips worked in a gold mine, hunted crocodiles, busked with a violin, rode the Trans-Siberian railway and was arrested by the Japanese and accused of spying. He eventually pitched up in London and signed up for the LSE. Then the war started, and he joined the Royal Air Force, which promptly sent him back to the other side of the world. In the RAF, Phillips established himself as an outstanding engineer, working to upgrade the obsolete aeroplanes that were supposed to defend British-held Singapore from Japan. Days before Singapore surrendered, he found himself on the last convoy to flee the city, onboard the Empire Star. The cargo ship designed to carry 23 passengers had been packed with 2,000, many of them women and children. When the convoy was discovered and attacked by Japanese planes, Phillips found a new use for his talents as an engineer. He brought a machine gun up on deck and improvised a mounting for it. Then he stood there for hours, fending off the attackers as bombs fell around him. 

This extraordinary performance earned him the MBE medal, but didn’t spare him from spending more than three years in a Japanese prisoner-of-war camp. Conditions were bad. Phillips later said that the small men survived and the taller men starved. He was one of the small ones. By the end of the war, he weighed just seven stone (45kg). To keep everyone cheerful and up to date on news from the outside world, Phillips continued with his engineering improvisations. He built concealed radio sets, one of which was tiny enough to be hidden from the guards in the heel of his shoe. He would have been tortured and killed had it been discovered. He also designed and built little immersion heaters, which the inmates used every evening to make hundreds of morale-boosting cups of tea. The guards never worked out why the camp lights flickered and dimmed each evening... In the summer of 1945, he was one of thousands of men transferred to a death camp, where they watched their captors mount machine guns on the walls, pointing inwards, and were forced to dig their own mass graves... When Phillips returned to London at the war’s end, he resumed his studies at the LSE. He took up sociology, a degree that contained some basic economics modules, and became intrigued by the engineering-style mathematical equations that were becoming popular in the new subject of macroeconomics... The LSE’s establishment rushed to give Phillips a job. Within a decade, he had been made professor, then a rare honour in British academia. For a man with no honours degree and no economics qualifications of any kind, he hadn’t done so badly.

The Moniac, or Phillips machine, could solve differential equations using hydraulics and not differential calculus. It could solve nine differential equations simultaneously and within a few minutes. 

Even in the 1950s, economic models were worked out by rooms full of human “computers”, typically women armed with paper and calculators to provide the mathematical equivalent of a typing pool. It would be years before digital computers could support economic models as complex as the Moniac’s. Phillips made 14 machines in all, most Mark II Moniacs, expanded versions of the original machine. The original machine went to the University of Leeds. Others ended up at Cambridge, Harvard, Melbourne, Manchester and Istanbul. Some went to corporations or ambitious governments in developing countries, from the Ford Motor Company to the Central Bank of Guatemala... If the Moniac was the result of exquisite engineering skill, Phillips’s flash of inspiration — that hydraulics could be used to solve complex systems of equations — was close to genius...

Each equation quite literally had to be carved into the flow-control system of the Moniac, in small squares of Perspex set in a neat white frame, with a thermometer-like scale along the side. The equations themselves were slots, one in each piece of Perspex, each with a particular shape and angle, snugly holding a peg that ran smoothly on brass rails. Each peg was attached to a float and a sluice gate, so that as the water level in a tank rose, the peg would move up and — depending on the shape of the slot — would also move sideways, opening or closing the sluice gate. Phillips had calibrated his equations to what was then known about the British economy: how much income people tended to put aside as savings, for example, or the overall response of supply and demand to prices. To his surprise, he found that the machine was watertight enough to be accurate to within 2 per cent — a higher level of precision than was required given the quality of the economic statistics of the day. 

8. Some facts about housing in the US

Real prices in the US are currently 25 per cent above the pre-crisis peak in 2006... Astonishingly, the US is building no more new homes and 80 per cent fewer “entry level” homes than it was half a century ago — when the population was much smaller. And the time it takes to complete a new multi-unit dwelling has doubled, with most of that increase coming in the past two decades — as “NIMBY” resistance spread.
Since 2000, according to Zillow, the average household income has doubled but the average price for its listings has tripled to $360,000. Over that period, the time it takes to save for a 20 per cent down payment has risen by nearly half to eleven years. And the share of income that goes to mortgage and insurance payments has risen by more than a third to 35 per cent — into the unaffordable zone. Because developers are building homes much more slowly than Americans are forming new households, the shortage is growing by several hundred thousand residences a year... Housing takes up a greater and growing share.

9.  Interesting points about the need to map supply-chain risks.

Data from the US commerce department indicates that 57 per cent of industries in America would require six months to return to normal capacity if there was even a single week of transport disruption... there are unexpected areas of workforce and trade vulnerability that couldn’t have been predicted without burrowing deep into granular data down many levels of global supply chains... the department has developed the Scale Tool, a computational system which includes data from the entire American goods economy. This is identified and ranked across various industries, geographies and risk metrics (geopolitical, environmental, national security, public health, and so on). The aim is to create an extremely granular picture of where vulnerability and resiliency in the American economy actually lies. That has required Raimondo and her officials to become familiar with things as esoteric as, for example, the components that go into an AI data centre cooling system. While it’s been widely understood for some time that AI capacity was a potential point of vulnerability for the US, this was thought of mainly in terms of the large amounts of power required for data centres, and whether the grids supporting them were resilient.

10. The definitive graph that blares out China's disturbing hold on clean manufacturing technologies.

11. India textile industry fact of the day

Between 2016 and 2023 the value of Indian apparel exports fell by 15%, whereas Bangladesh’s increased by 63%.

12. Peru's spectacular rise as a blueberry exporter in a graphic.

Back in 2013 Peruvians earned about $17m exporting blueberries; by last year receipts had soared to $1.7bn. In 2019 Peru became the world’s single biggest exporter of fresh blueberries. Nowadays it sends more than twice as many berries abroad as its closest rivals... Peru’s blue revolution relies on newfangled “low chill” varieties, developed in the United States, that thrive on Peru’s coast. The International Blueberry Organisation, an industry group, says that in 2022 the yield of a typical Peruvian blueberry farm was nearly double the global average (which is nine tonnes per hectare)... it takes only about two years for a new farm in Peru to start turning a profit. In other places four years is more common... Blueberry farmers have also gained from trends that have boosted all manner of Peruvian produce. These include tax breaks and irrigation megaprojects that have opened up land along Peru’s desert coastline. Between 2000 and 2023, total annual Peruvian farm exports grew 16-fold to $10.5bn.

13. Japanese company valuations.

The price-to-book ratios of listed companies, a measure of their value relative to the worth of their assets, is a mere 1.5. By contrast, American companies are worth five times as much as the assets they hold. Japan’s non-financial firms now hold ¥372trn ($2.6trn) in cash and bank deposits, a figure that has risen by 82% in nominal terms since the end of 2012, suggesting that too many executives are resting on their laurels.

14. Developing country cities are growing upwards.

And this

This is a welcome development, most likely a reflection of having hit the limits to suburban sprawls. This process must be expedited. 

Wednesday, September 11, 2024

China economy update - September 2024 edition

This is the latest in the series of China economy updates, covering its structural imbalances, the problems with its fiscal federalism, the reliance on “connector” countries to access increasingly hostile Western markets, how Chinese imports upend economic orthodoxy on trade, and the extent of market concentration involving China in green technologies and critical minerals. 

1. Zongyuan Zoe Liu has an excellent essay that reiterates the structural imbalance problem, cited by several others too, as the greatest threat to China’s economic prospects. 

A decades-old economic strategy that privileges industrial production over all else, an approach that, over time, has resulted in enormous structural overcapacity. For years, Beijing’s industrial policies have led to overinvestment in production facilities in sectors from raw materials to emerging technologies such as batteries and robots, often saddling Chinese cities and firms with huge debt burdens in the process. Simply put, in many crucial economic sectors, China is producing far more output than it, or foreign markets, can sustainably absorb. As a result, the Chinese economy runs the risk of getting caught in a doom loop of falling prices, insolvency, factory closures, and, ultimately, job losses. Shrinking profits have forced producers to further increase output and more heavily discount their wares in order to generate cash to service their debts. Moreover, as factories are forced to close and industries consolidate, the firms left standing are not necessarily the most efficient or most profitable. Rather, the survivors tend to be those with the best access to government subsidies and cheap financing…factories in government-designated priority sectors of the economy routinely sell products below cost in order to satisfy local and national political goals. And Beijing has regularly raised production targets for many goods, even when current levels already exceed demand.

This production focus is deeply entrenched in the Communist Party’s world view

As the party sees it, consumption is an individualistic distraction that threatens to divert resources away from China’s core economic strength: its industrial base. According to party orthodoxy, China’s economic advantage derives from its low consumption and high savings rates, which generate capital that the state-controlled banking system can funnel into industrial enterprises. This system also reinforces political stability by embedding the party hierarchy into every economic sector. Because China’s bloated industrial base is dependent on cheap financing to survive—financing that the Chinese leadership can restrict at any time—the business elite is tightly bound, and even subservient, to the interests of the party. In the West, money influences politics, but in China it is the opposite: politics influences money. The Chinese economy clearly needs to strike a new balance between investment and consumption, but Beijing is unlikely to make this shift because it depends on the political control it gets from production-intensive economic policy…

China’s sixth five-year plan (1981–85) was the first to be instituted after Chinese leader Deng Xiaoping opened up the Chinese economy. Although the document ran to more than 100 pages, nearly all of it was devoted to developing China’s industrial sector, expanding international trade, and advancing technology; only a single page was given to the topic of increasing income and consumption. Despite vast technological changes and an almost unrecognizably different global market, the party’s emphasis on China’s industrial base remains remarkably similar today. The 14th five-year plan (2021–25) offers detailed targets for economic growth, R & D investment, patent achievement, and food and energy production—but apart from a few other sparse references, household consumption is relegated to a single paragraph. 

The success of this industrial strategy is increasingly reliant on exports and the world economy.

In prioritizing industrial output, China’s economic planners assume that Chinese producers will always be able to offload excess supply in the global market and reap cash from foreign sales. In practice, however, they have created vast overinvestment in production across sectors in which the domestic market is already saturated and foreign governments are wary of Chinese supply chain dominance. In the early years of the twenty-first century, it was Chinese steel, with the country’s surplus capacity eventually exceeding the entire steel output of Germany, Japan, and the United States combined. More recently, China has ended up with similar excesses in coal, aluminum, glass, cement, robotic equipment, electric-vehicle batteries, and other materials. Chinese factories are now able to produce every year twice as many solar panels as the world can put to use.

But the global backlash against these policies puts a natural limit to its pursuit. 

Since the mid-2010s, the problem has become a destabilizing force in international trade, as well. By creating a glut of supply in the global market for many goods, Chinese firms are pushing prices below the break-even point for producers in other countries. In December 2023, European Commission President Ursula von der Leyen warned that excess Chinese production was causing “unsustainable” trade imbalances and accused Beijing of engaging in unfair trade practices by offloading ever-greater quantities of Chinese products onto the European market at cutthroat prices. In April, U.S. Treasury Secretary Janet Yellen warned that China’s overinvestment in steel, electric vehicles, and many other goods was threatening to cause “economic dislocation” around the globe. “China is now simply too large for the rest of the world to absorb this enormous capacity,” Yellen said… 

In a speech in May, Lael Brainard, the director of the Biden administration’s Council of Economic Advisers, warned that China’s “policy-driven industrial overcapacity”—a euphemism for antimarket practices—was hurting the global economy. By enforcing policies that “unfairly depress capital, labor, and energy costs” and allow Chinese firms to sell “at or below cost,” she said, China now accounts for a huge percentage of global capacity in electric vehicles, batteries, semiconductors, and other sectors… At their meeting in Capri, Italy, in April, members of the G-7 warned, in a joint statement, that “China’s non-market policies and practices” have led to “harmful overcapacity. ” The massive inflow of cheap Chinese-manufactured products has already raised trade tensions. Since 2023, several governments, including those of Vietnam and Brazil, have launched antidumping or antisubsidy investigations against China, and Brazil, Mexico, Turkey, the United States, and the European Union have imposed tariffs on various imports from China, including but not limited to electric vehicles.

This strategy has engendered several problems. For a start, its impact on the domestic economy has been brutal.

In China’s domestic market, overcapacity issues have provoked a brutal price war in some industries that is hampering profits and devouring capital. According to government statistics, 27 percent of Chinese automobile manufacturers were unprofitable in May; at one point last year, the figure reached 32 percent. Overproduction throughout the economy has also depressed prices generally, causing inflation to hover near zero and the debt service ratio for the private nonfinancial sector—the ratio of total debt payments to disposable income—to climb to an all-time high. These trends have eroded consumer confidence, leading to further declines in domestic consumption and increasing the risk of China sliding into a deflationary trap.

Besides, it has entrapped local governments in a debt-fuelled investment race whose consequences are now becoming evident.

At the center of Beijing’s overcapacity problem is the burden placed on local authorities to develop China’s industrial base. Top-down industrial plans are designed to reward the cities and regions that can deliver the most GDP growth, by providing incentives to local officials to allocate capital and subsidies to prioritized sectors….These planning directives and campaigns put enormous pressure on local party chiefs to achieve rapid results, which they may see as crucial for promotion within the party. Consequently, these officials have strong incentives to make highly leveraged investments in priority sectors, irrespective of whether these moves are likely to be profitable. This phenomenon has fueled risky financing practices by local governments across China. In order to encourage local initiative, Beijing often does not provide financing: instead, it gives local officials broad discretion to arrange off-balance-sheet investment vehicles with the help of regional banks to fund projects in priority sectors, with the national government limiting itself to specifying which types of local financing options are prohibited. About 30 percent of China’s infrastructure spending comes from these investment vehicles; without them, local officials simply cannot do the projects that will win them praise within the party. Inevitably, this approach has led to not only huge industrial overcapacity but also enormous levels of local government debt. According to an investigation by The Wall Street Journal, in July, the total amount of off-the-book debts held by local governments across China now stands at between $7 trillion and $11 trillion, with as much as $800 billion at risk of default…

Ever since China’s 1994 fiscal reform, which allowed local governments to retain a share of the tax revenue they collected but reduced the fiscal transfers they received from Beijing, local governments have been under chronic financial strain. They have struggled to meet their dual mandate of promoting local GDP growth and providing public services with limited resources. By centralizing financial power at the national level and offloading infrastructure and social service expenditures to regions and municipalities, Beijing’s policies have driven local governments into debt. What’s more, by stressing rapid growth performance, Beijing has pushed local officials to favor quickly executed capital projects in industries of national priority. As a further incentive, Beijing sometimes offers limited fiscal support for projects in priority sectors and helps facilitate approvals for local governments to secure financing. Ultimately, the local government bears the financial risk, and the success or failure of the project rests on the shoulders of the party’s local chief, which leads to distorted results.

A larger problem with China’s reliance on local government to implement industrial policy is that it causes cities and regions across the country to compete in the same sectors rather than complement each other or play to their own strengths. Thus, for more than two decades, Chinese provinces—from Xinjiang in the west to Shanghai in the east, from Heilongjiang in the north to Hainan in the south—have, with very little coordination between them, established factories in the same government-designated priority industries, driven by provincial and local officials’ efforts to outperform their peers. Inevitably, this domestic competition has led to overcapacity and high levels of debt, even in industries in which China has gained global market dominance… Whenever the Chinese government prioritizes a new sector, duplicative investments by local governments inevitably fuel intense domestic competition. Firms and factories race to produce the same products and barely make any profit—a phenomenon known in China as nei juan, or involution. Rather than try to differentiate their products, firms will attempt to simply outproduce their rivals by expanding production as fast as possible and engaging in fierce price wars; there is little incentive to gain a competitive edge by improving corporate management or investing in R & D.

2. There are three big distortions that drag down the Chinese economy - the continuing focus on investments as the driver of economic growth, the corollary of a disproportionately low share of consumption, and the skew between central and state government revenues and expenditures. 

Robin Harding has a good article about how the problems due to fiscal federalism in China are impacting economic activity. While central government debt is just 24% of GDP, that of local governments at 93% is an underestimate. 

This is a good description of China’s fiscal federalism

A basic fact about China’s fiscal system is that local governments do almost all of the spending, but rely on the centre for revenue to an extent that is rare elsewhere in the world. Localities bear most of the responsibility for education, health, social security and housing, in addition to obvious local duties such as roads, parks and rubbish collection, and spend about 85 per cent of the government total. They directly collect only around 55 per cent of government revenues. The system is balanced by transfers from the centre to the regions.

This is about the problems created by the mismatch between the revenues and expenditures of local governments.

For example, the lower down the pyramid of governance, the more the system gets starved of resources, because each tier — province, prefecture, county — tends to hold back what it needs before passing cash onwards down the chain. The implementation of central government spending plans is haphazard. Meanwhile, local government officials, who must deliver growth to climb the bureaucratic ranks, do whatever they can to find money. China’s property boom was partly driven by the reliance of local governments on land sales for revenue. Off-the-books borrowing by so-called local government financing vehicles was a way to get around the revenue constraint and fund infrastructure. As land sales slump due to the housing slowdown, and the central government cracks down on local borrowing, there are many reports of municipalities resorting to fines and penalties, launching retrospective tax investigations or simply not paying staff on time as they struggle to balance their books. None of this is good for the struggling private sector. 

The central government has been reluctant to undertake reforms that give local governments more revenue generation powers.

What the central government has not been willing to do, as is typical for Xi, is surrender control. It often specifies the services that local governments must provide, yet declines to hand over the revenue sources that fund them. It is reluctant to take big new spending responsibilities onto the central books. It has cracked down on local government debt, and yet… it is unwilling to let central government debt rise instead. The result has been a de facto fiscal tightening during the past few years even as the economy has struggled to recover after Covid. At the recent “third plenum”, an important meeting for economic policy held once every five years, Beijing promised to… give local governments more control over taxes and increase fiscal transfers from the centre. It will consider rolling various local surcharges into a single local tax. It will move the liability for consumption tax from manufacturers to retailers and let local governments collect it, which would be an important reform. Where the central government has more fiscal power, it will “raise the proportion of central government expenditure accordingly”… lengthy debates about whether to introduce property taxes, a natural way for local governments to fund local spending. If Beijing is actually going to implement these plans, it will have to surrender some control, and if it is to do so while reviving the stagnant economy, it will also have to accept a rise in the central government’s debt.

3. Faced with these structural problems, China has been focusing outward to maintain high economic growth rates. 

The FT has a good long read that throws some interesting insights on China’s foreign direct investments (FDI). Specifically, the article points to the emergence of a group of “connector” countries that are being courted with Chinese FDI to help the country skirt around the restrictions imposed by Western economies. 

Unsurprisingly, these countries are now also seeing growing exports from China.

The so-called connector countries are seeking to insert themselves between the two and are “rapidly gaining importance and serving as a bridge”, according to the IMF. Flows of trade with and investment in such countries have increased dramatically since the US, Europe and others began erecting trade barriers with China. For Chinese companies, investing in such countries brings several advantages. One is access to large free trade areas with minimal tariffs and regulatory friction. Another is that domiciling in a new geography can allow Chinese companies to dilute or repurpose their identity, thus remaining below the trade flak flying between China and the US-led west, analysts say. So marked is this behaviour in Singapore that it has earned a distinct name. “Singapore-washing” describes a process through which Chinese companies set up a subsidiary or reincorporate in the city-state to mitigate the geopolitical risks and scrutiny often directed at China-based entities…

Perhaps the best-known example is Shein, the fast-fashion group currently seeking a public listing in either London or New York. It originated in 2008 in the eastern city of Nanjing and its supply chains, warehouses and inventory remain in China. But in 2021 its enigmatic founder Sky Xu, who also goes by the names Xu Yangtian and Chris Xu, relocated himself and the company’s headquarters to Singapore. Shein, valued at $66bn in its last private funding round, now defines itself as a “Singapore-headquartered global online fashion and lifestyle retailer”, according to its website… Singaporean identities are also sometimes used to access the market in India, skirting New Delhi’s clear antipathy towards Chinese investment.

While Singapore and Vietnam are connectors in South East Asia, their counterparts in Europe appear to be Ireland and Hungary, both EU members. 

Bilateral trade (of Ireland) with China has tripled in the past five years and there is a clear desire on both sides to increase investment, said Ireland’s then-prime minister Leo Varadkar as he welcomed his Chinese counterpart Li Qiang on a visit early this year. Big-ticket Chinese investments in Ireland include those from ByteDance, parent of the short form video app TikTok, WuXi Biologics, a drug company, Huawei, the Chinese telecoms equipment giant, and the Bank of China, a big Chinese state-owned bank. In total around 40 Chinese companies employing 5,100 people are clients of Ireland’s investment promotion agency IDA… Hungary received 44 per cent of all Chinese foreign direct investment in Europe in 2023, overtaking the ‘big three’ economies of Germany, France and the UK, according to a study by Berlin-based think-tank Merics. 

In the Americas, Mexico is the connector.

Mexico is a member of the US-Mexico-Canada Agreement (USMCA), the successor to Nafta, which embraces 510mn people and accounts for another 30 per cent of the global economy. Chinese companies have quietly gained a considerable foothold as investors in Mexico over recent decades. North America’s USMCA free trade agreement means Chinese businesses making everything from fridges and televisions to textiles in Mexico gain privileged US market access. América Móvil, the telecoms group controlled by the billionaire Carlos Slim, relies heavily on Huawei technology. Mexican appliance and refrigerator manufacturer Mabe is 48 per cent owned by the acquisitive Chinese group Haier. One in five cars purchased in Mexico last year was made in China, with half of those coming from Chinese manufacturers. Electric-vehicle makers such as BYD and Chery are now scouting Mexico for factory sites so they can export to the US and avoid tariffs on vehicles imported to the US from China, which rose to 100 per cent at the start of August.

4. Countries like India have been extremely cautious about allowing foreign retail and e-commerce giants due to fears that their competition could hurt the tens of millions of mom-and-pop shops. Even when allowed, there have been stringent domestic sourcing requirements to prevent cheap imports, especially from China. 

The spectacular rise of online-only low-price household goods, apparel, and toys retailer Temu in the US and its disruptive impact on local retailers appears to vindicate this concern. Consider this. 

Since launching in the US in September 2022, the online retailer — powered by big ad spending — has shot to the top of the app stores. While parent company PDD Holdings does not break out Temu’s financial performance, Temu’s global gross merchandise value — the total of all goods sold — reached $17bn last year and could grow to $40bn this year, according to Bernstein Research. Within this, Temu has made the most inroads among low-income shoppers. In the space of two short years, its share of US discount spending has gone from zero to 17 per cent, according to consumer data analytics firm Earnest Analytics. Over the same period, Dollar General’s market share fell from 63 per cent to 52 per cent. Dollar Tree, which also owns Family Dollar, saw its share shrink 6 percentage points to 19.5 per cent. Temu can undercut US rivals by delivering cheap goods straight from factories and warehouses in China… Temu and its rock-bottom prices means inflation-wary shoppers can skip the trip to the dollar store altogether. 

The regulators in Europe and the US have started their efforts to contain damage by changing the “de minimis” rule that allows Temu and others to import in small scale cheap goods tariff-free. Temu and Shein have exploited this rule to make rapid inroads into the US and European markets. 

All Econ 101 theories on free trade and comparative advantage breaks down when faced with the onslaught from cheap Chinese imports.

5. This is a good summary of how globalisation helped China more than any other country. 

China’s emergence as an economic superpower over the past four decades has been propelled to a large degree by globalisation. Open markets and free trade underpinned China’s long export boom and helped facilitate huge transfers of capital, knowledge and technology from the west to Chinese companies.  Many have gone on to become world leaders in their sectors: examples include BYD and CATL in electric vehicles and batteries, Huawei in telecoms and ByteDance in social media. Faced with imported goods that are a match for their domestic incumbents in quality terms, and growing more concerned about national security issues, western powers have cooled on globalisation.

Now that the shoe is on the other feet, developed countries are feeling exactly what the developing countries used to feel all for long when they placed import restrictions to prevent their domestic industry from being destroyed by more competitive imports from developed economies. Economists who used to berate and scorn on developing countries for pursuing autarkic policies are themselves now advocating the same policies to protect domestic industry in the west.

6. Finally, three graphs from the just released EU report by Mario Draghi on measures to improve the region’s economic competitiveness. The first highlights the stranglehold China exercises on the manufacturing of green technologies. 

The second highlights the concentration in the extraction and processing of critical minerals and how China dominates the supply chain in most of them. 

It’s in the processing that China dominates. Indonesia must be strongly commended and supported for the policies it’s pursuing on indigenising value capture in Nickel. It’s surprising how Australia has allowed the Chinese to import and capture value from its Lithium mines. Chile has done well in Lithium, but not so much in Copper in terms of processing. 

In contrast to the clean technologies and critical minerals where China dominates, its presence in the semiconductor industry is modest, even marginal.