Substack

Tuesday, April 30, 2024

Corporate profits, subway tunnelling techniques, and affordable housing

1.  A new working paper by Michael Smolyansky shows that low-interest rates and corporate tax rate cuts explain a major share of corporate profitability.  
From 1989 to 2019, the S&P 500 index grew at an impressive real rate of 5.5 percent per year, excluding dividends. The rate of U.S. real GDP growth over the same period was 2.5 percent. What accounts for this enormous discrepancy? And is it sustainable? I argue that it is not. To reach this conclusion, I consider 60 years of data on the earnings and stock price performance of S&P 500 nonfinancial firms, from 1962 to 2022. My central finding is that the 30-year period prior to the pandemic was exceptional. During these years, both interest rates and corporate tax rates declined substantially. This had the mechanical effect of significantly boosting corporate profit growth. Specifically, I find that the reduction in interest and corporate tax rates was responsible for over 40 percent of the growth in real corporate profits from 1989 to 2019. Moreover, the decline in risk-free rates over this period explains the entirety of the expansion in price-to-earnings (P/E) multiples. Together, these two factors therefore account for the majority of this period’s exceptional stock market performance... The overall conclusion, then, is that—with the expected slowdown in corporate profit growth and no offsetting expansion in P/E multiples—real longer-run stock returns in the future are likely to be no higher than about 2 percent, the rate of GDP growth.

He compares the real EBIT (earnings before interest and tax expenses) growth for the 1962-89 and 1989-2019 periods - 2.2% and 2.4%. He shows that interest and tax expenses as a share of EBIT declined from 54% in 1989 to 27% by 2019, pointing to an ever-declining share of profits being paid out to debt holders and tax authorities. 

Now both interest rates and corporate tax rates have bottomed out - the 10-year Treasury yields have fallen from 7.9% to 1.9% over 1989-2019 and the effective tax rate for S&P 500 companies fell from 34% to 15%. In fact, both rates are now likely to rise. This means that corporate profits can at best only grow at the same rate as EBIT. 

This also means that companies benefited from policy changes and good luck, and enjoyed higher profits not attributable to their efforts.

This blog has been long-time sceptic of the economic orthodoxy and conventional wisdom that low corporate tax rates will spur investment. In The Rise of Finance, we point to evidence that contradicts this. 

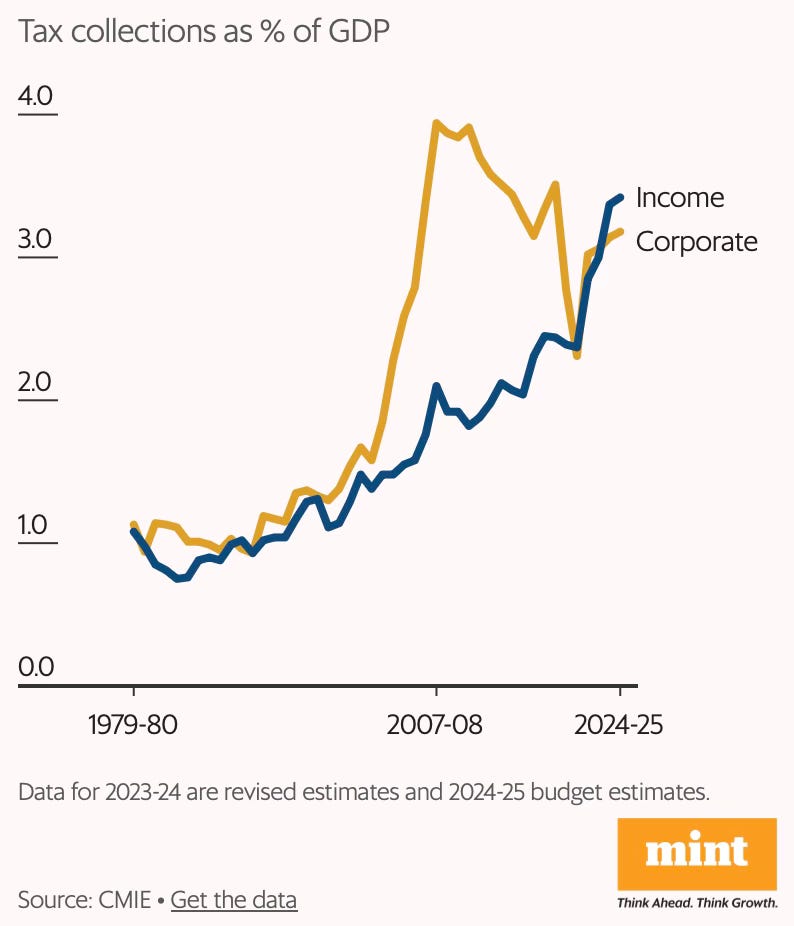
The latest example is from India, where corporate investments have struggled to materialize despite significant corporate tax cuts and a favourable economic environment. In fact, not only have corporate tax cuts not revived private investments but it has also led to a reduction in corporate tax revenues as a share of GDP.


2. Fascinating account by Brian Potter in the latest edition of Works in Progress about the shift from the cheaper but more disruptive cut and cover technique to the much more expensive tunnel boring techniques in the construction of metro railway systems. 

This about how the Brunel shield technique was used to tunnel under the Thames in 1825. 
Soft-ground TBMs evolved from unmechanized tunnel shields, large hollow structures that supported the sides of the tunnel while it was being excavated. The tunnel shield was invented by Marc Brunel (father of ​Isambard Kingdom Brunel) in 1806 for tunneling under the Neva River in Russia, and was first used to tunnel under the Thames in 1825. Brunel’s shield consisted of a 21-foot-tall grid of iron frames, divided into 12 separate frames, each one consisting of three compartments stacked on top of one another. Within each compartment, the face of the tunnel would be supported by a series of boards called poling boards. A worker would remove a single board, dig away the soil behind it to a depth of around nine inches, and then replace the board and move on to the next one. After all boards had been dug out, the frame would advance forward with large mechanical jacks, and the process would repeat. Behind the shield, brick lining would be installed around the sides of the tunnel to form its structure. With Brunel’s shield, tunneling under the Thames proceeded at about eight feet per week on average...
The tunnel shield prevented the sides of the tunnel from collapsing while it was bored, but they still required some method to prevent the face of the tunnel from collapsing, and to prevent water from intruding when tunneling below the water table. By the late nineteenth century, the standard method was to use compressed air. By pressurizing the tunnel to several times atmospheric pressure, water would be kept out. Compressed air remained in use well into the twentieth century, and is still sometimes used today, but it has been largely supplanted by slurry machines and earth pressure balance machines, which respectively use a bentonite slurry and the excavated material itself to support the face of the tunnel. Today, earth pressure balance machines are the most common type of TBM for tunneling through soil.

Then there’s the top-down and bottom-up approaches in the cut-and-cover method

Cut and cover also uses different methods for building the tunnel structure itself. In the conventional method, known as bottom-up, the trench is fully excavated and the tunnel structure is built up starting from the bottom. With the top-down method, by contrast, the tunnel is excavated only partway down, and then the roof of the tunnel is built using the existing soil as a vertical support. Once the roof is in place, the rest of the tunnel is then excavated below it. With top-down construction, the surface can be completely restored after the roof has been built; with bottom-up, the top of the excavation will often be covered with temporary decking to allow use of the surface while tunnel construction is taking place.

This about the respective speeds and economics of different tunneling technologies

Brunel’s non-mechanized shield tunneled under the Thames at the glacial pace of eight feet per week. By the early 1900s, Price mechanized shields were achieving excavation rates of nearly 200 feet per week. And by the 1970s, TBMs were achieving rates of 1,400 feet per week in soft ground, and 1,900 feet per week in rock... As TBMs got faster, they also got cheaper, and became increasingly competitive with cut and cover. When a TBM was used to bore some of the tunnels on the Bay Area Rapid Transit (BART) project in the 1960s, its costs were just 40 percent higher on average than the cut and cover sections, a far cry from the eight-times cost difference on the New York Subway... Depending on the nature of the project and how disruptive surface construction would be, TBMs in some cases began to be cheaper than cut and cover...
TBMs have high fixed costs (in the form of the time, effort, and expense to buy the machine and get it set up) but low operational costs: once they are up and running, the marginal cost of additional excavation is low. TBMs are thus often particularly economical on large tunneling projects where the fixed costs of the machine can be thinly spread. ​When Madrid built 60 miles of underground tunnel when constructing its metro in the late 1990s and early 2000s, it achieved a famously low cost ​of €42 million per kilometer (about $73 million per kilometer in 2023 dollars) using TBMs. And the recent extension of the L11 line in Madrid, which adds another 4.3 miles to the metro system, likewise found that excavation with TBMs would be cheaper than cut and cover.

3.  As I have blogged on numerous occasions, arguably the biggest challenge to urban growth is housing affordability in the larger cities. Given the limited extent of vacant lands remaining, there’s no alternative to radical changes to urban planning rules to create the conditions that allow for incentives and market forces to increase the supply of housing from brownfield properties. 

Ben Hopkinton and Sam Dumitriu have a series of posts on increasing housing supply in London where prices have risen sharply and the average floor space has declined. In the first post they propose upzoning in the brownfield locations around transit stations. They point to Paris, Madrid, and Milan having areas twice as dense as the densest parts of London and some of the best-connected parts of London being built at extremely low densities. They propose permissions for additional floors on the older properties (pre-1919 ones), and adoption of New Zealand’s 2020 plan of automatic approval for six floors in properties that are within walking distance of city centres, commercial hubs, and transit stops. 

In the second post, they propose building on some of London’s several Golf courses, those that are well-connected or centrally located. They point to some very interesting facts about Golf courses.

If all of London’s golf courses were a borough, they would be its 15th largest – roughly the size of Brent… London’s 95 golf courses (excluding driving ranges and courses with fewer than 9 holes) take almost as much land as all other sporting activities combined. There are also a further 74 golf courses just outside London too. More of London is dedicated to golf than to football, despite the fact that many times more Londoners play football than play golf on a regular basis. A large proportion of London’s golf courses are publicly-owned. In fact, if London’s publicly owned golf courses were a borough, they would be larger than Hammersmith and Fulham. Yet councils get little in return as they lease them to golf clubs on the cheap. For instance, one golf course pays just £13,500 in rent to Enfield council for 39 hectares. That’s £3,000 less than it costs to rent a one bed flat in Enfield.

The third post proposes the rezoning of industrial sites and localities that are well connected. The last post proposes policies to encourage the renewal of older areas, specifically old public housing estates. 

The ideas raised in the four posts are universal and applicable to cities worldwide. Affordable housing policies must work on similar urban planning reforms to create the conditions for increasing housing supply. 

Saturday, April 27, 2024

Weekend reading links

1. Two long reads in NYT about Novo Nordisk and its wonder drugs Ozempic and Wegovy. The first is about the transformation it has brought about to the Danish town of Kalundborg, a town of under 17000 people, and where the company makes nearly all the semaglutide, the active ingredient for its wildly popular diabetes and obesity treatment drugs. It now plans to invest $8.6 bn to expand its facilities there, adding 1250 employees to its existing 4500 workforce. 
Kalundborg knows the benefits and risks of pinning the town’s fortunes to one company. A shipyard briefly dominated the town’s economy early last century, but was decimated during the Great Depression. In the 1960s, Kalundborg thrived as the manufacturing site for Carmen Curlers, which pioneered electric hot hair curlers, causing a sensation in the United States. Then the company was sold to the American firm Clairol, fashions changed, thousands were laid off and the plant eventually closed in 1990... Educational opportunities are already undergoing a transformative change. For years, high school graduates left town to continue their education, and Novo Nordisk struggled to retain scientists and other employees with advanced training. Now, three universities offer courses in biotechnology and related subjects in town, with more institutions arriving soon. The Novo Nordisk Foundation also finances the Helix Lab, where graduate students complete their master’s thesis working with local companies, including Novo Nordisk... Recently, Kalundborg has been able to sell plots of land it had previously been struggling to shift to private developers. And there is talk of opening an international school to teach children in English to accommodate the drugmaker’s increasingly international work force.

The impact on the Danish economy has been no less significant.

Novo Nordisk is already reshaping Denmark’s economy. The country’s economy grew 1.9 percent last year, among the fastest in Europe and all thanks to the pharmaceutical industry, led by Novo Nordisk. Without it, the economy would have stagnated. Nearly all of Novo Nordisk’s revenue is earned overseas, more than half in the United States alone... The company is the largest corporate taxpayer in Denmark. Last year it paid about 15 percent of the country’s entire corporate tax intake, more than other big Danish companies like the brewer Carlsberg, the toy company Lego and the shipping firm Maersk... (But) Novo Nordisk’s employees represent just 1 percent of the Danish work force — though it did account for 20 percent of the jobs added last year. Some of the corporate taxes that Novo Nordisk pays return to the communities where the company operates. Gladsaxe, the municipality on the edge of Copenhagen that includes Bagsvaerd, the home of Novo Nordisk’s headquarters, is investing in day care centers and new sports facilities, and is building a light rail transit system with other regions outside the capital.

The company's spectacular growth (the 100 year-old company's revenue grew by over 30% in 2023 to $33 bn, and its market value exceeded $555 bn) has created challenges for itself

For most of its 100 years Novo Nordisk has been focused on the steady business of treating diabetes, one of the world’s most prevalent chronic diseases. Even today, it produces half the world’s insulin. But the development of Ozempic and Wegovy has led to a bigger and bolder ambition to “defeat serious chronic diseases.” That includes treating, and even preventing, obesity, which is linked to other health issues like heart and kidney diseases. By pursuing a much larger target than diabetes, the company expects to unlock the door to a multibillion-dollar market with nearly a billion potential patients. In the United States alone, more than 40 percent of adults are obese...

But in all the tumult, there is something executives are trying to hold on to: the company’s longstanding values, codified in the “Novo Nordisk Way.” Those principles, which include having a “patient-centered business approach,” have helped earn the company a good reputation at home, where it’s considered a place where people are proud to work. But these guideposts are facing pressure as tens of thousands of new employees are hired, lawmakers denounce the drugmaker for its high prices and counterfeit versions of its products make people sick... The heart of the growth is semaglutide, Novo Nordisk’s synthetic version of a hormone known as glucagon-like peptide 1, or GLP-1, which helps the body regulate blood sugar levels. The patent developed by the company also proved remarkably effective for weight loss. It causes people to feel fuller when they eat and reduces cravings...
Ozempic, the brand name for semaglutide, a weekly injection for Type 2 diabetes patients, has been around for more than six years. But in the last couple of years, there was an explosion in popularity, helped along by heavy advertising, social media videos and intrigue over celebrity use... As Ozempic began to take off, Novo Nordisk pushed ahead with Wegovy, which is semaglutide marketed specifically for weight loss... Novo Nordisk leads the pack in obesity treatment, but it now has strong competition from Eli Lilly, which sells a similar drug under the brand names Mounjaro, for diabetes, and Zepbound, for weight loss. Other pharmaceutical companies are clambering to catch up.

2.  How do rich and poor countries reduce their debt?

Interesting that poor countries have relied more on inflation and economic growth to pare their debt, and rely less on generating primary surpluses. 

3. The evolving story of the market expectations on US interest rate cuts.
At the end of last year, futures markets had priced in six interest rate cuts for the US in 2024. As stubborn inflation data kept coming in over the first quarter, traders began to slowly align with the US Federal Reserve’s forecast for just three. But, over the past two weeks, those still expecting several cuts this year have started to look like stubborn contrarians. A third above-expectation reading for US consumer price index inflation in March was the final straw. Traders repriced to between one and two rate cuts this year — although zero is an increasingly popular punt too. 
4. Ruchir Sharma writes that the strong performance of the US economy, perhaps a third of the growth in 2023, can be attributed to the overhang of the large fiscal and monetary stimulus. The US continued stimulating its economy long after the recession of 2020 got over. Apart from sustaining growth, the over-stimulation may also explain idiosyncrasies in different markets.
The broad measure of money supply known as M2, which includes cash held in money market accounts and bank deposits, as well as other forms of savings, is still well above its pre-pandemic trend. In Europe and the UK, where monetary stimulus was less aggressive, M2 has fallen back below trend. This liquidity hangover has countered Fed interest rate hikes and helps explain the current behaviour of asset prices. Corporate earnings are up, on strong GDP growth, but prices for stocks — not to mention bitcoin, gold and much else — have been rising even faster. This odd combination — higher stock valuations despite higher rates — has not happened in any period of Fed tightening going back to the late 1950s. A similar levitation act is visible in the US housing market; despite higher mortgages rates, prices have risen steadily and faster than in other developed nations. Since 2020, the total net worth of US households has risen by nearly $40tn to $157tn, driven by home and stock prices. For the better off, this “wealth effect” is a happy turn. More Americans plan to vacation abroad this summer than at any time since records begin in the 1960s. For the less well off, who summer locally, do not own a home and tend to be younger, these conditions are less felicitous.

He feels that with both consumer and asset prices elevated and money supply still high, there's limited room for the Fed to cut rates immediately.  

5. In another shot at anti-competitive practices, the US FTC has voted to ban non-compete agreements by employers that restrict employees freedom to change jobs. 

The FTC said approximately 30mn workers are subject to such contracts, which prohibit employees from working for a competitor or setting up a competing business for a period of time or within a geographical area after they leave a job. “Non-compete clauses keep wages low, suppress new ideas, and rob the American economy of dynamism, including from the more than 8,500 new start-ups that would be created a year once non-competes are banned,” said Lina Khan, FTC chair. Non-competes constituted “unfair methods of competition”, she added. The FTC estimated the new rule will raise an average worker’s earnings by $524 a year... The US Chamber of Commerce announced it would sue the regulator, arguing the agency lacked constitutional and statutory authority to enact the rule, calling it a “blatant power grab” that “sets a dangerous precedent for government micromanagement of business”.

The non-compete clauses cover a vast variety of jobs that include TV news producers, hairdressers, corporate executives, and computer engineers. Non-compete clauses covering senior executives are not covered by this order. This decision is certain to be challenged in courts, with the US Chamber of Commerce vowing to sue the FTC. The Times writes.

Workers in finance and professional services are the most likely to have noncompete contracts, at a rate of nearly 20 percent. Studies have shown that noncompetes suppress wages because switching jobs is the most efficient way workers can increase how much they make.

6. FT has a long read that discusses the discontent in South Africa at the legacy of Nelson Mandela. The crux of the argument is that while Mandela's leadership gave the black majority political freedom, his compromises with the white minority ended up depriving them of economic freedom. 

ANC was too timid from the outset in pursuing a more progressive economic agenda. Instead, Mandela’s government adopted the neoliberal orthodoxy of the times... Enacting a self-imposed structural adjustment of the sort favoured by the Washington consensus, it reduced tariffs, cut fiscal deficits and ran a hawkish monetary policy that persists to this day. “We wanted to outdo the neoliberals,” says Msimang, adding that a desire to prove a Black government could govern responsibly led the ANC mistakenly to “out World Bank the World Bank”. One result of that shock therapy, say some economists, was to expose the previously protected manufacturing base to outside competition too quickly, nearly halving manufacturing as a share of output from 21 per cent to 12 per cent in the 20 years after the ANC took power. When the commodity supercycle ended and the global financial crisis hit in 2008, growth rates plummeted with an inevitable knock-on effect on living standards...
The re-evaluation of Mandela’s legacy from across South Africa’s political spectrum has been accompanied by a revival of appreciation for Winnie, who was put in solitary confinement, tortured and sent to a remote internal exile by the apartheid authorities. “She bore the brunt of the apartheid regime’s attacks on Black people,” says Jonny Steinberg, author of Winnie & Nelson, a book that re-examines their dual legacy. “She said, ‘I was physically engaged with the enemy because my body was being battered while you [Nelson] were wrapped in a cocoon.’ Her story was that he negotiated away his people’s future because he was no longer truly a Black person, he’d been turned into somebody else inside prison, whereas she was the embodiment of people’s suffering.”... Winnie’s death in 2018 sparked a resurgence in her reputation and her adoption as an icon by Malema, leader of the EFF. In her defiance and refusal to compromise with her oppressors, many younger Black South Africans have come to regard her as a metaphor for the path not taken.

7. The latest industry to suffer from China's capacity glut is car manufacturing

China has more than 100 factories with the capacity to build close to 40 million internal combustion engine cars a year. That is roughly twice as many as people in China want to buy, and sales of these cars are dropping fast as electric vehicles become more popular. Last month, for the first time, sales of battery-electric and plug-in gasoline-electric hybrid cars together surpassed those of gasoline-powered cars in China’s 35 largest cities. Dozens of gasoline-powered vehicle factories are barely running or have already been mothballed... Automakers with factories close to China’s coast are exporting gasoline-powered cars. But many of the endangered factories are in cities deep inside the country, like Chongqing, where high transport costs to the coast make it too expensive to export... Sales of gasoline-powered cars plummeted to 17.7 million last year from 28.3 million in 2017... That drop is equivalent to the entire European Union car market last year, or all of the United States’ annual car and light truck production...

The longstanding benchmark is that car factories should run at 80 percent of capacity, or more, to be efficient and make money. But with new electric car factories opening and few older factories closing, capacity utilization across the entire industry fell to 65 percent in the first three months of this year from 75 percent last year and 80 percent or more before the Covid-19 pandemic, according to China’s National Bureau of Statistics. Without a big burst of exports last year, the industry would have operated even further below full capacity. Chinese manufacturers, many of them partly or entirely owned by city governments, have been reluctant to reduce output and cut jobs... 

The country’s auto industry is near the start of an E.V. transition that is expected to last years and eventually claim many of those factories. How China manages that long change will influence its future economic growth, since the auto sector is so big and could transform its workforce. The stakes are great for the rest of the world, too. China, the world’s largest car market, became the largest exporter last year, having passed Japan and Germany. China’s auto sales abroad are exploding. Three-quarters of China’s exported cars are gasoline-powered models that the domestic market no longer needs... Those exports threaten to flatten producers elsewhere. At the same time, China’s electric vehicle companies are still investing heavily in new factories... Electric car sales in China are still growing. But the pace of growth has halved since last summer, as consumer spending has faltered in China because of a housing market crisis... China also has overcapacity in electric vehicle manufacturing, although less than for gasoline-powered cars. Price cutting for electric vehicles is common... Almost all of China’s electric cars are assembled at newly built factories, which qualify for subsidies from municipal governments and state-directed banks. It’s cheaper for automakers to build new factories than to convert existing ones. The result has been enormous overcapacity... Assembling electric vehicles requires considerably fewer workers than making gasoline-powered cars, because E.V.s have much fewer components. 

8. From the EC on China's trade distorting subsidies

The European Commission published an updated report, 711 pages long, on state-induced distortions in the Chinese economy. The trade complaint, broadly, is that China follows a nefarious playbook whereby it has attracted foreign investment, required joint ventures and acquired key technologies, granted massive subsidies for domestic suppliers while also slowly erecting barriers or closing the market for foreign groups, and then dumped excess supply on foreign markets. According to research from the Kiel Institute for the World Economy, a German think-tank, BYD has been a chief beneficiary of EV-related subsidies with direct government subsidies to the company of up to €3.4bn from 2018 to 2022. Across the Chinese green-tech industries, the research points to other channels of government support including preferential access to critical raw materials, forced technology transfers, strategic use of public procurement as well as the favourable treatment of domestic companies by local officials.

Thursday, April 25, 2024

Thoughts on international development - V

I blogged here highlighting the obsession in international development circles with new ideas and innovations and neglect of regular development interventions and examined the reasons; here questioning the belief that there are new ideas and innovations waiting to make a transformative impact; here that policies in most of the development matter very little and it's mostly about implementation; and here questioning the conventional wisdom on impact evaluations and arguing that evaluations should focus on the use of administrative data (and surveys) coupled with qualitative information to help improve the effectiveness of implementation. 

In this post, and in continuation from here, I’ll argue that the combination of the grafting of externally generated ideas and innovations and the associated flow of easy money prevents developing countries from cultivating their ability to make good development decisions. Specifically, it avoids the hard collective struggles to diagnose their problems, figure out the most appropriate local solutions, and squeeze out the scarce resources from countless other competing needs. 

In short, well-meaning aid money distorts the incentives and distracts from the real tasks of development. Instead of being helpful, it can end up harming.

Consider the example of education, an area of extensive engagement by the international development community with ideas and resources. The field has a vast spectrum of innovations in pedagogy, human resources management, incentives, financing structures, Edtech etc. Philanthropies and others fund academic researchers to conduct rigorous evaluations to establish the impact of these innovations. Politicians and bureaucrats in developing countries are then encouraged to adopt these evidence-based innovations. 

The entire process is one-way and top-down - foreigners advising developing countries, outsiders advising practitioners, and experts advising governments - with large doses of we-know-it-best condescension thrown in. The solutions are presented as implants that can be made on the education system, at best with tinkering at the margins. 

And the countries are promised development aid if they do so. The flow of easy money into systems struggling to find resources for basic requirements has irresistible political economy and bureaucratic attractions. It provides the misleading belief that something is being done to address the problem and that too with the support of those who are supposedly experts. 

But it ends up displacing the hard struggles that these countries need to undergo to face up to the sobering realities of what ails their educational systems. It glosses over the political economy issues of community ownership, accountability to parents, prioritisation and sequencing of objectives and expenditures, figuring out what’s right and implementing it, finding scarce resources, and so on. It also avoids the collective struggles and sacrifices that result in conscious choices and decisions that are steeped in the local contexts and requirements. Most importantly, it prevents the development of the muscle memory of making decisions when faced with hard choices.

For example, it prevents the essential public discussions on the hard questions about teacher quality, their absenteeism, their recruitment processes, their benefits and service conditions, their capabilities development, the expectations from them, the curriculum and learning content, the best use of the limited resources available to the Education Department etc. Each of these involves the exercise of collective judgment. These struggles create norms, practices, and institutional forms that mediate such decision-making and gradually improve the quality of judgments that are exercised. 

The same happens across development sectors. 

None of this should be taken to mean that there should not be any aid money or technical assistance support. Instead, there should be a paradigm shift in the framing of such support. It must strongly abjure any thoughts, however well-meaning, of wanting to help developing countries with specific ideas and programs. It should avoid the impulse to offer well-meaning advice and best-practice solutions. It should eschew falling into the trap of the “reductive seduction of solving other people’s problems”. 

Instead, it should help with the cultivation of the ability to make good development decisions. This, in turn, requires both financing and technical support, but for the implementation of the decisions made by developing countries themselves. The international development community must consciously and explicitly recognise and internalise this insight. 

I can think of a few elements of this approach. One, support the creation of basic and critical physical infrastructure in areas like irrigation, transportation, electricity, urban utilities, schools and hospitals, and climate change adaptation and mitigation. Two, assist with capacity development in public institutions, create stronger state capabilities for implementation management, research and development, higher education institutions etc. Three, encourage private investors and support the emergence of the private sector, especially in sectors and areas that serve the vast majority of the population. 

In all these cases, the needs must emerge as conscious and internally driven decisions. In this framing, international aid will be supporting the cultivation of the ability to make good decisions and then supporting the implementation of those decisions. At the risk of repeating, such engagement should consciously stay away from displacing the internal struggles required to make decisions on development. 

This approach will be long-drawn, unplannable, messy, and can appear inefficient and wasteful. So be it. The history of development shows that it’s never happened through any planned, logical, linear, and quick approach and that too guided or mediated from outside. 

Ironically, there was a time, immediately after the War and in the post-colonial projects, when international aid focused on the essential requirements of economic growth - infrastructure and other material needs, higher education institutions etc. Irrigation projects, transportation and connectivity infrastructure, power generation and supply, water supply and sewerage, higher education and tertiary health care facilities were the primary focus of international aid. It largely left the countries to figure out their local programmatic solutions to their development problems. 

Then, for a variety of reasons, it strayed into the funding of development programs/schemes (interventions to improve farm productivity, student learning, skilling, livelihood generation, social welfare etc.) and prescriptive technical assistance. And it’s here that things started to go wrong.  

Monday, April 22, 2024

The balance sheet of UK's water and sewage privatisation

It’s no hyperbole to argue that the UK water sector privatisation could be described as the Great British PPP Robbery. It may well become the canonical example of the problems with the privatisation of regulated utilities. 

Consider the latest balance sheet of the water sector in UK. 

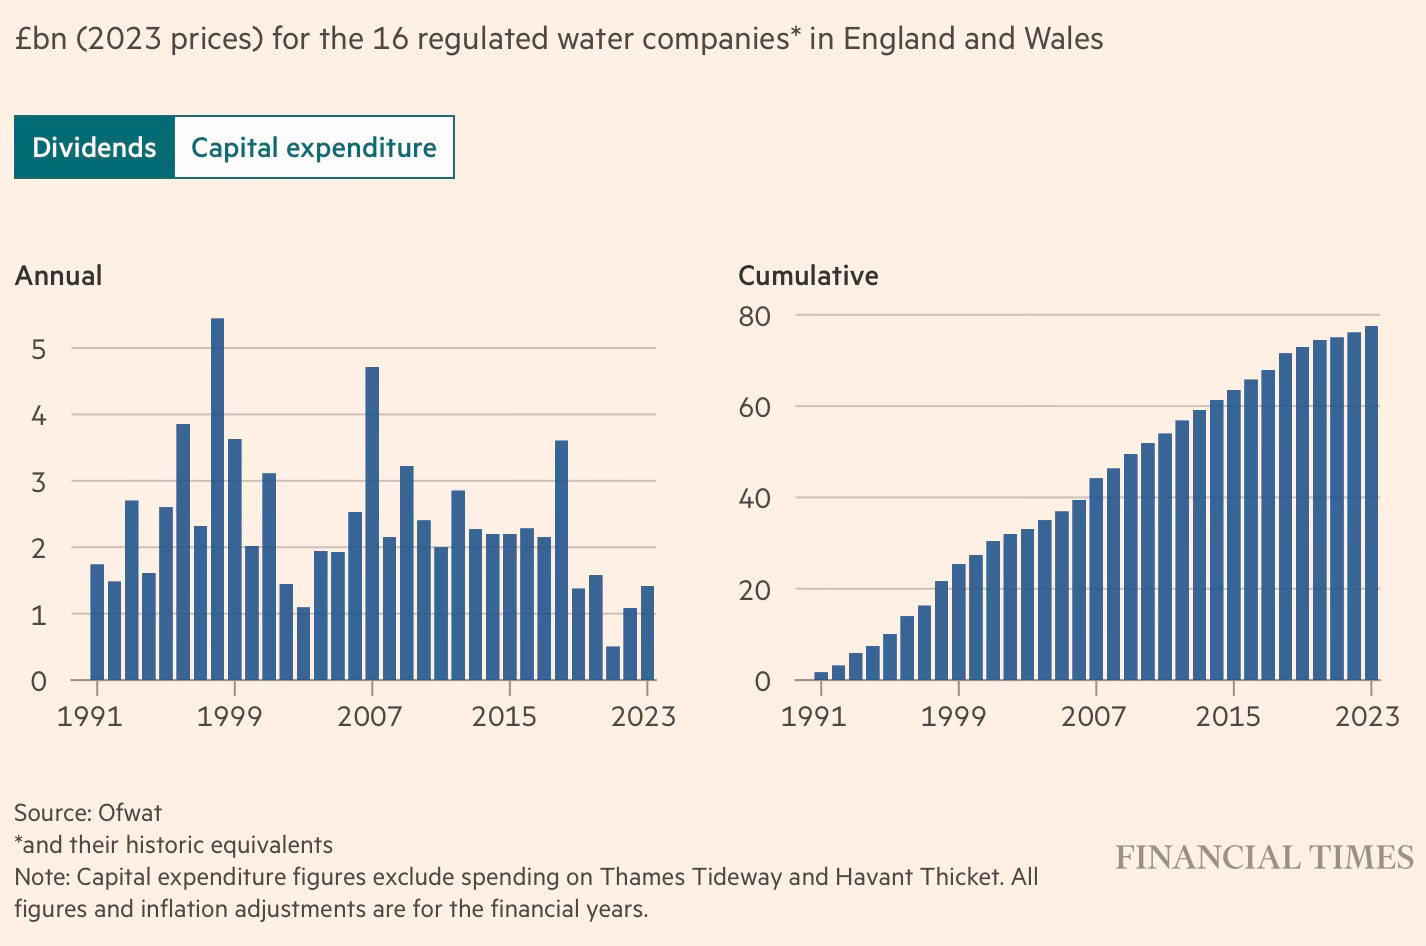
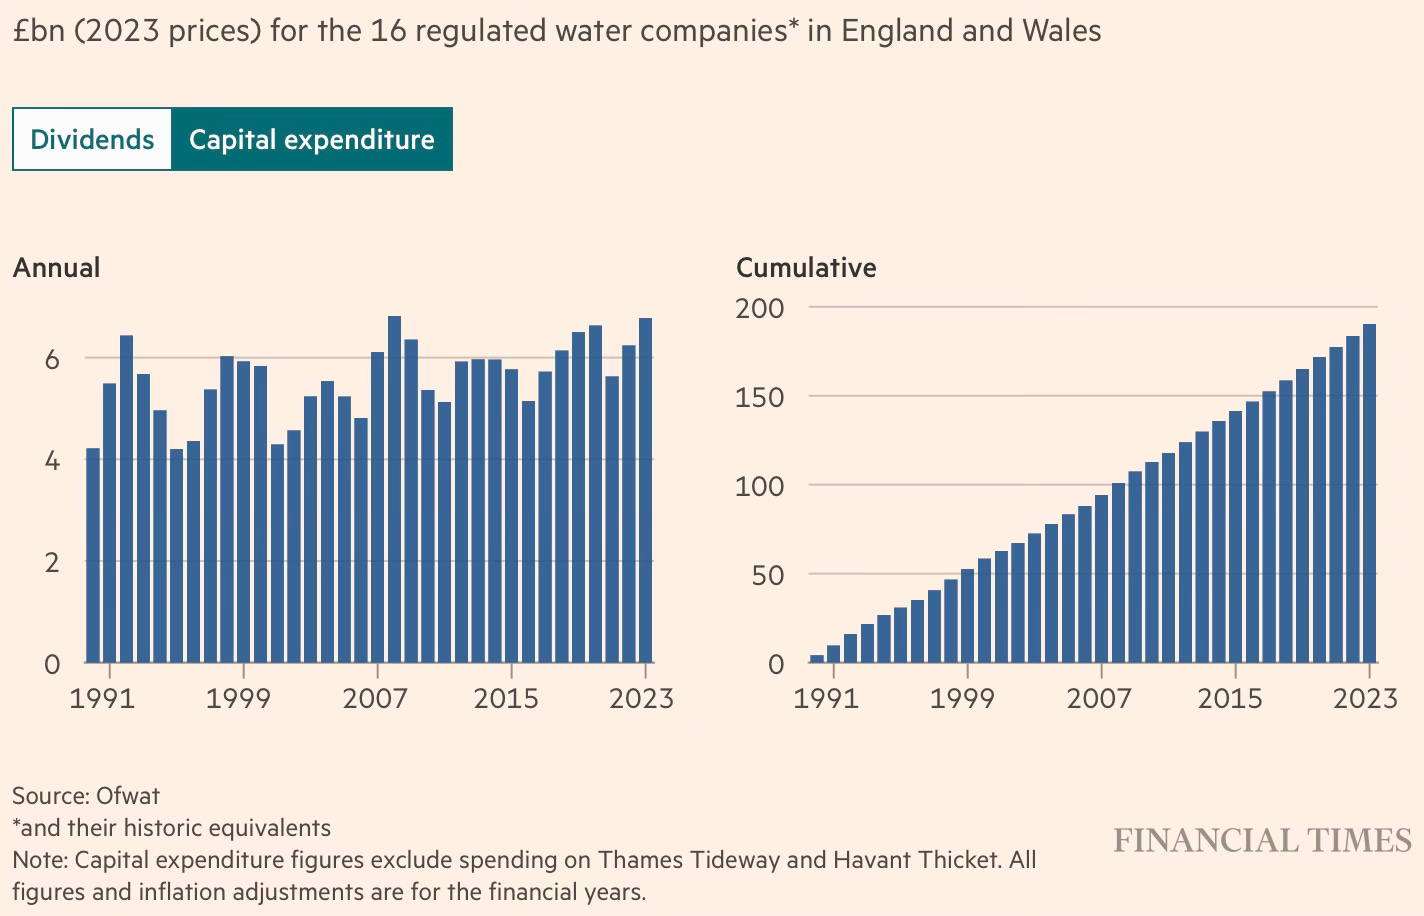
Water companies in England and Wales paid £2.5bn in dividends and added £8.2bn to their net debt in the two financial years since 2021, according to research by the Financial Times. The updated figures mean that the 16 water monopolies have paid out a total of £78bn in dividends in the 32 years between privatisation in 1991 to March 2023, according to the research, which is based on regulatory data and then adjusted for inflation. The £78bn payout is nearly half the £190bn the companies spent in the same three decades on infrastructure. The utilities meanwhile chalked up more than £64bn net in debt over the same period, despite being sold at privatisation with no borrowings.

Consider the dividend payouts since 1991.

And the capital expenditures.

In other words, in the 32 years since privatisation, the owners of the UK water companies took out or created obligations to the tune of £142 bn while investing only £190bn, or a net asset increase of just £48 bn. 

The loading up of debt is a problem in regulated industries like water since the regulator takes the debt service costs into account while fixing tariffs, thereby passing the debt service costs to the consumers through their bills. 

The high noon of such leveraging was the decade-long ownership of Thames Water since 2006 by Macquarie, the Australian infrastructure private equity group. A study by Karol Yearwood at Greenwich University has this summary of the financials of the company during the decade.

Macquarie borrowed more than £2.8bn to finance purchase, and later supposedly repaid £2bn of the debt through new loans raised by Thames Water through a subsidiary in Cayman Islands, effectively transferring the purchase costs to customers. Furthermore, in those 10 years, debt increased 2.3x times (from £4bn to £10bn), dividends averaged 270m per year, yet between 2011 and 2015 they paid no tax.

It’s a testament to the distortions in the market that Macquarie’s rent extraction from Thames Water has been an important motivating force behind the private equity industry’s push to invest in infrastructure. 

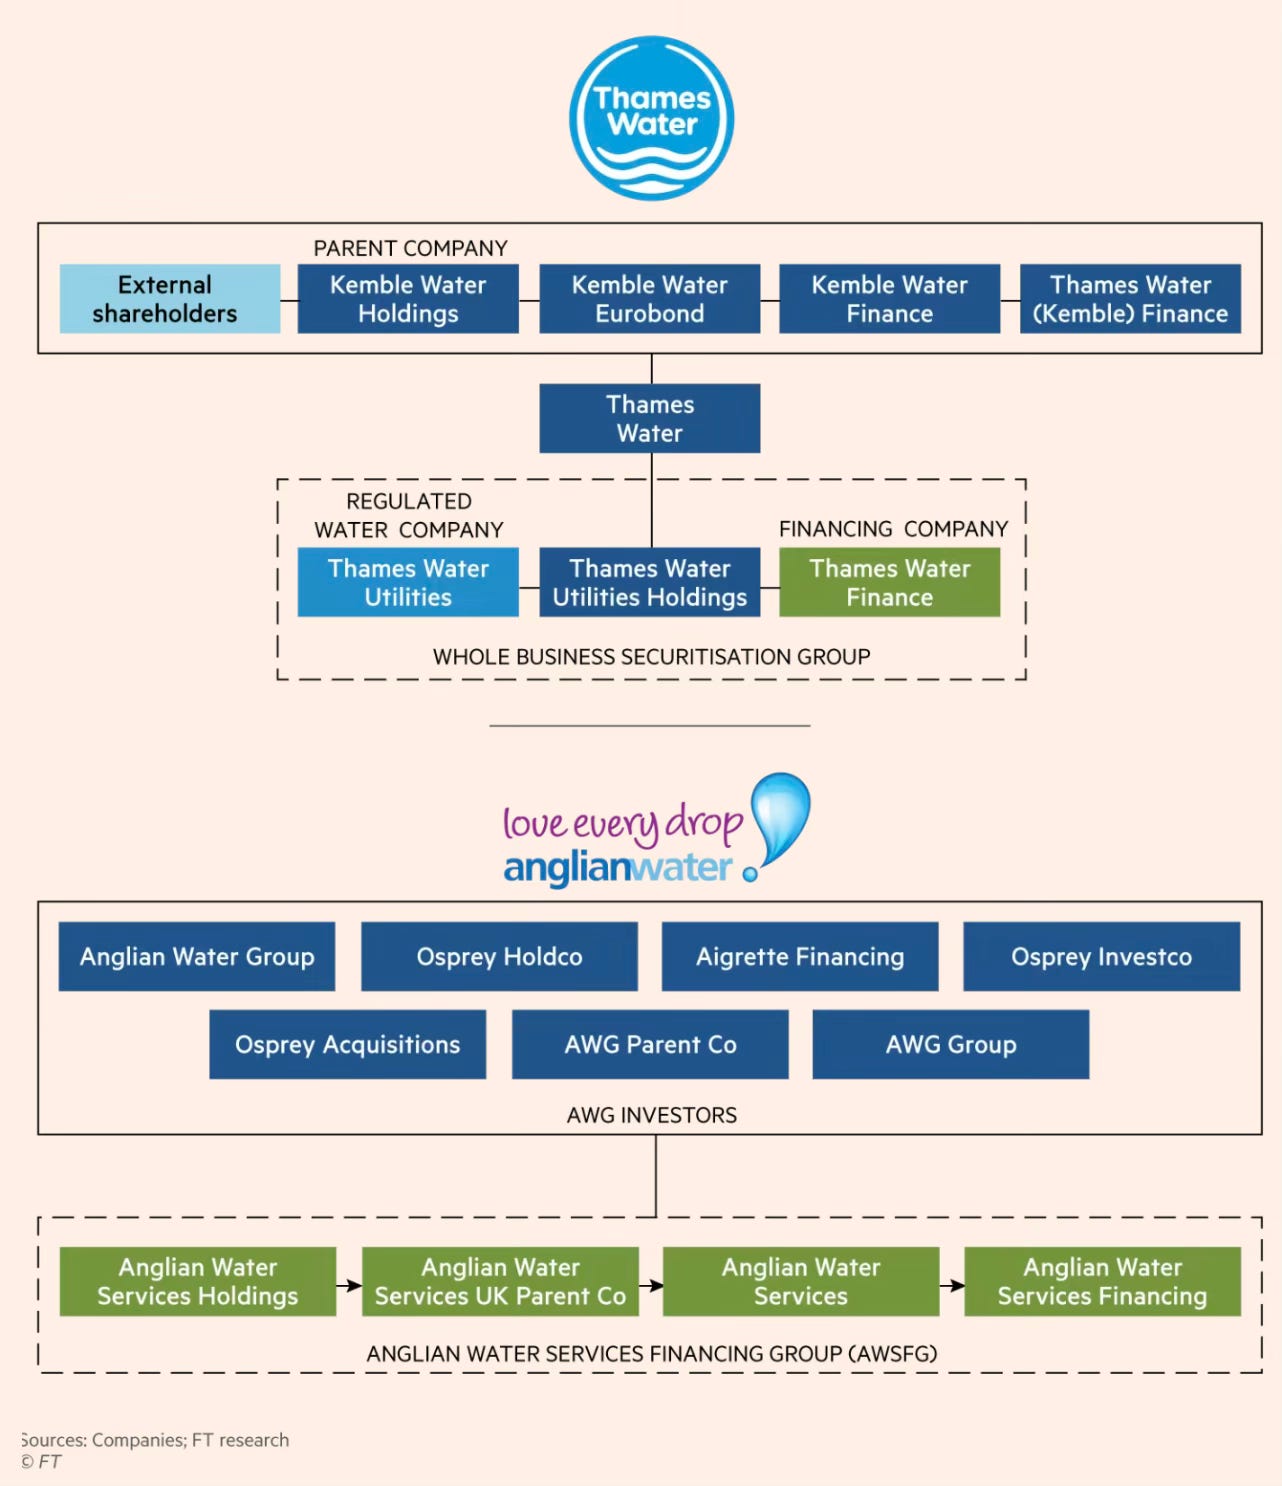
The business model of the private owners has sought to retain earnings and avoid equity infusions and instead use debt to finance investments for maintenance and upgrades while paying out dividends from cashflows. In fact, Thames Water received no equity infusion since privatisation till it got a £515mn loan at an 8% interest rate in 2023 through a convoluted structure - the loan was accounted as a debt in the books of the regulated utility’s parent company (Kemble Water), but accounted as equity in the regulated utility itself

Thames Water, which supplies water to about 25 per cent of the population in England, presented the loan in March as “£500mn of new equity funding from its shareholders” to improve “leakage and river health” and deliver a turnaround plan. However, the recapitalisation involved the owners — which include sovereign wealth, private equity and pension funds — providing a £515mn convertible loan to Thames Water’s parent entity, Kemble Water, according to the company’s accounts. Kemble then “cascaded” £500mn of this borrowed money down the chain of holding companies that own Thames Water into the regulated utility. The £515mn increase in debt at Kemble has pushed the group’s consolidated borrowings to over £18bn, having risen from just over £15bn as of March 31 2022. The loan could convert to equity in the future. It is treated as a liability in Kemble’s accounts.

The owners have used complicated financial structures to not only load up on debt but also payout large dividends.

Britain’s privatised water and sewage companies paid £1.4bn in dividends in 2022, up from £540mn the previous year, despite rising household bills and a wave of public criticism over sewage outflows. The figures… are higher than headline dividends in the year to end March 2022. This is because several have layered corporate structures with numerous subsidiaries, only one of which — the operating company — is regulated by Ofwat… The complex arrangements enable providers to distinguish between internal dividends — payments between intermediate holding companies in the group — and external dividends to private equity, sovereign wealth and pension funds, which own the entire water and sewage business including the holding companies… water monopolies argue internal dividends are used to service debt and other costs… Thames Water, the largest water monopoly, paid £37mn of “internal dividends” to its parent company in the year to March 31 2022. This was an increase from £33mn in the previous 12 months, despite announcing that  “external shareholders” had not received dividends for five years…

Adding to the complexity, internal dividends are often only included in notes to the accounts, while dividends can also be deferred until after financial results are released, enabling companies to show zero dividends for the current year in their published annual reports and accounts. Dividend payments are also often described as “cash neutral” as the funds are immediately returned to the company from within the group in payment of debts. In one example, Northumbrian Water, majority owned by CK Infrastructure Holdings, declared £272.6mn in dividends in the year ended March 2022, including an interim dividend of £58.2mn, and a final dividend of £55.4mn. The final dividend was approved after the balance sheet date and will only show as a paid dividend in the 2023 financial statements. The £272.6mn included £159mn as a special dividend, which the company said enabled a group company to pay off a loan, stating that the transaction was “cash neutral” [implying no cash leaves the business], according to the accounts.

Thames Water is not the only company facing acute stress.

South East Water, SES Water and Southern Water are all under close watch by regulator Ofwat over their financial stability. Southern Water was rescued from the brink of bankruptcy in an Ofwat-brokered deal with the Australian infrastructure manager Macquarie in 2021 but the utility was forced to suspend external dividends until at least 2025 following a credit rating downgrade last year. Investor jitters come as Ofwat is pushing them to inject more cash into the utilities. It is not clear whether investors — which include sovereign wealth funds, private equity firms and pension funds — will play ball. Few equity injections have been made since privatisation.

The business models of the companies that relies excessively on debt has taken the sector to the brink of collapse.

Ofwat wants to lower utilities’ debt. It is pushing them to reduce gearing — a measure of debt to assets — from a sector average of around 68 per cent to 55 per cent by April 2025.  Peter Hope, head of regulatory finance at Oxera Consulting, said water companies will need to change how they run their finances in the next few years, given the step change in investment that is expected. “In broad terms, the industry will have to go from a situation of not having retained any earnings since privatisation, to having to retain for the next 25 years almost all of the earnings.”  In addition they will have to inject £5bn equity by 2030, and £8bn in the five-year period following, according to his calculations based on the 55 per cent gearing ratio assumed in Ofwat’s modelling. “Even this does not take into account the need for future increases to replace aged assets and deal with resilience and climate change,” he added.

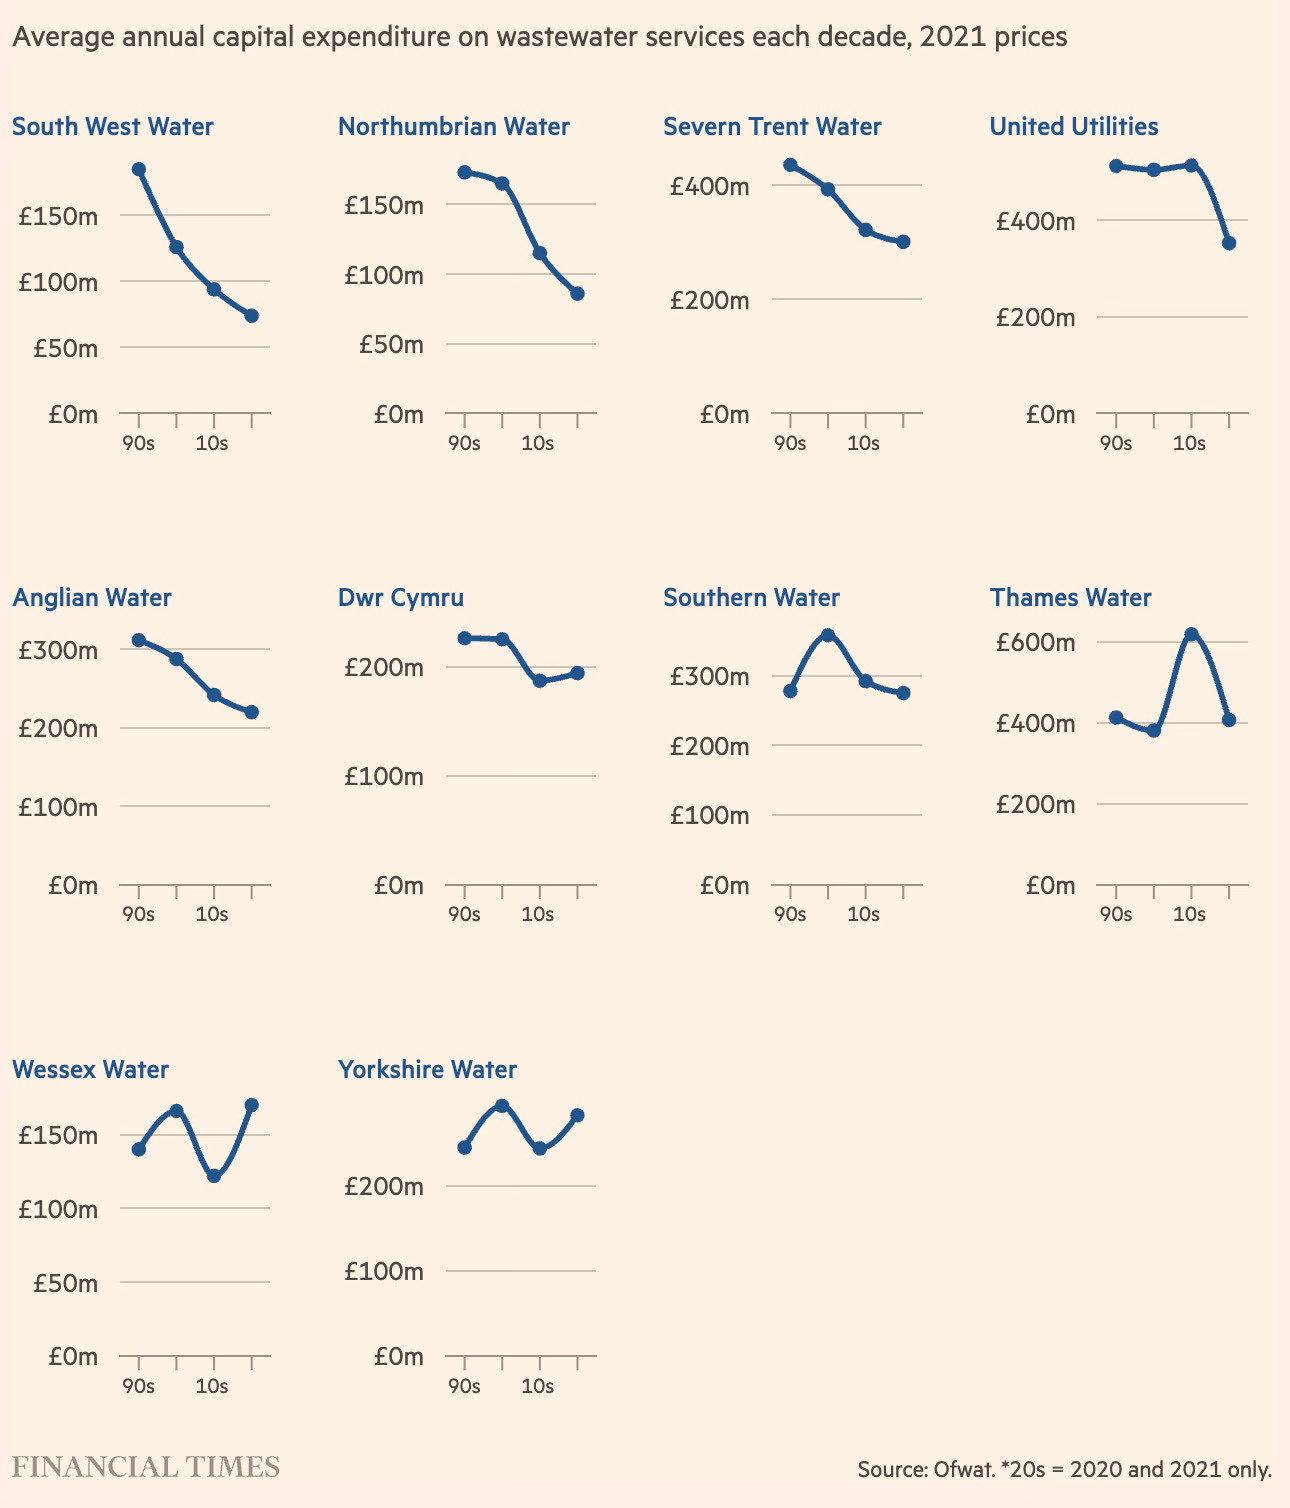
The problems in water supply are mirrored on the sewerage and wastewater treatment side. Consider this about investments in wasterwater treatment

Total spending on waste water infrastructure by the 10 largest companies — excluding Thames Tideway — has failed to rise significantly. Average annual wastewater investment was £295mn in the 1990s, £297mn in the 2010s and £273mn in the 2020s so far.

And this about the worsening quality of waterbodies in the country arising from releases of untreated water.

All 16 companies have been criticised for service failures, including tipping unknown quantities of sewage into waterways, high leakage rates or water outages. The Environment Agency is conducting its largest ever criminal investigation into potential widespread non-compliance by water and sewerage companies at more than 2,200 sewage treatment works, while Ofwat is also running its own investigation into the issue.

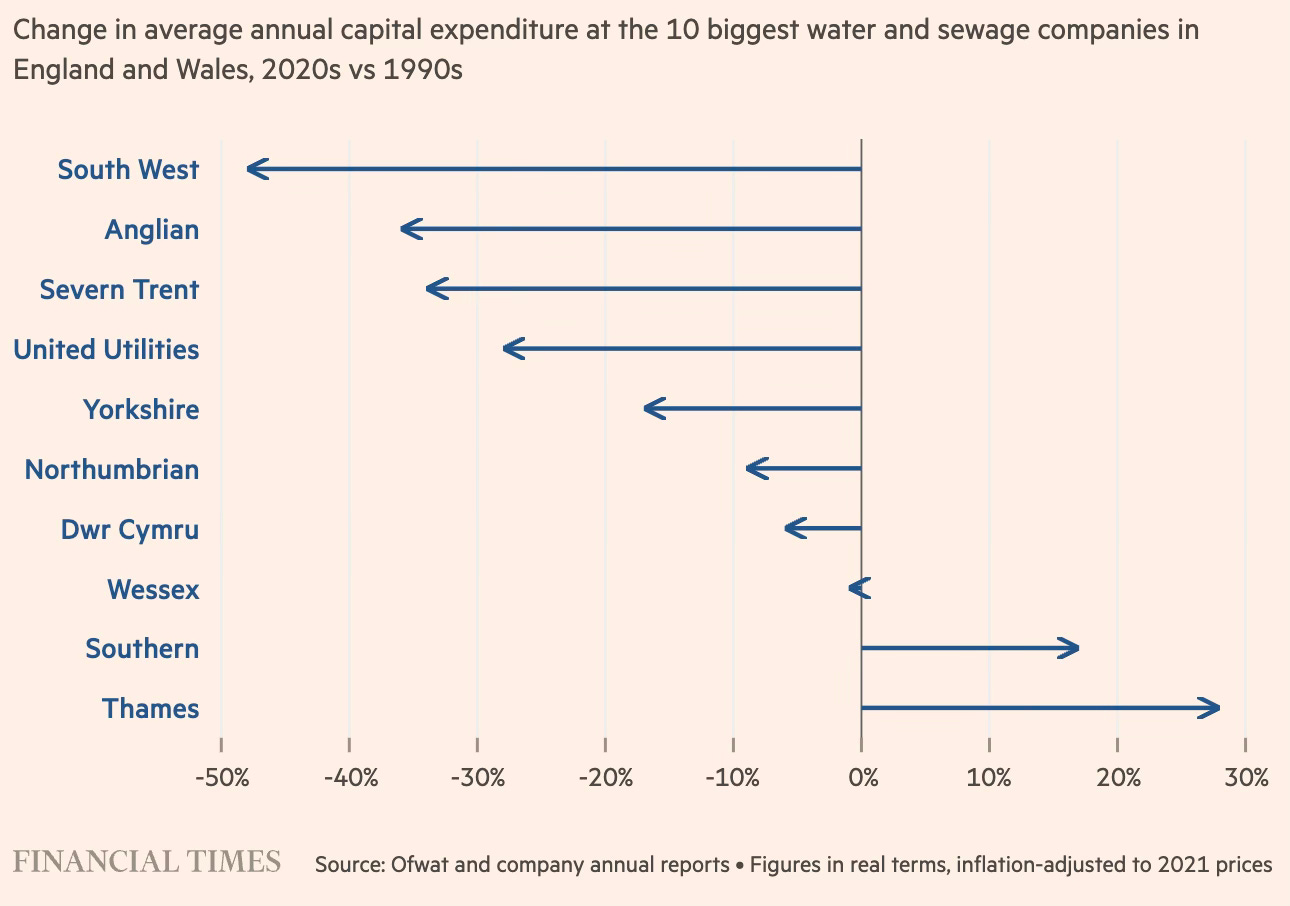
This graphic is striking in so far as it shows that all water utilities have cut their investments in wastewater treatment infrastructure since privatisation. 

Consider this balance sheet of wastewater and sewage infrastructure

Total spending on important infrastructure, which hit a post-privatisation peak of £5.7bn a year between 1991 and 1999, fell by 15 per cent to £4.8bn between 2020 and 2021, according to a Financial Times analysis of the accounts of the 10 largest providers in England and Wales. The decline was most extreme for wastewater and sewage networks. Investment there has fallen by almost a fifth, from £2.9bn a year in the 1990s to £2.4bn now… The reductions have come despite a 31 per cent real-term increase in water bills since the 1990s — an average of £100 a year per household — and £72bn in dividend payments to parent companies and investors including private equity, sovereign wealth and pension funds in the same period… In 2019, only 16 per cent of England’s rivers and seas met the minimum “good or better” ecological status as defined by the EU’s water framework directive, according to official Environment Agency figures, while about a fifth of the treated water supply is lost in leakage.

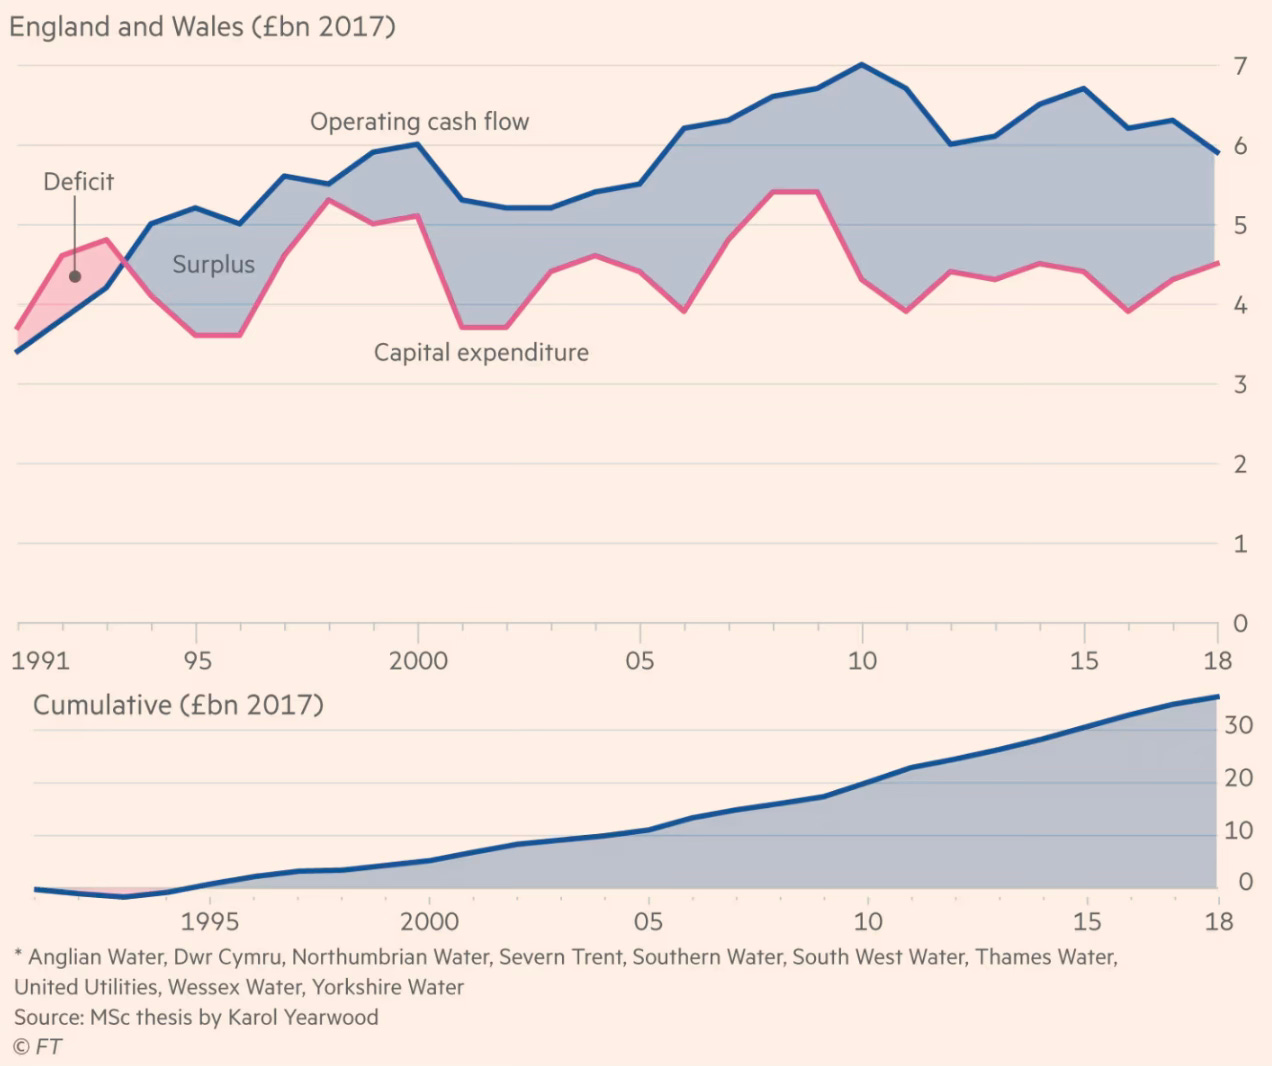
The most striking finding from the Greenwich University study on water and sewage privatisation in the UK is this graphic that shows that the “privatised water companies have generated enough cash to cover investment without taking debt”.

Since privatisation, the aggregate cash flow generated by the English and Welsh companies after operating costs was £36bn more than the £123bn they spent on fixed assets such as new pipes and network infrastructure (all in 2017-18 prices), the study found. This suggests their capital spending could all have been funded out of internal resources… On a combined basis, customers today pay about £1.2bn a year — or £53 a year per household — servicing the debt, according to the analysis by Karol Yearwood... Funding capital spending with debt rather than free cash flow enabled the English companies to pay out £56bn in dividends to investors, which include an array of private equity type groups. 

In other words, it’s clear that the water companies have assumed such massive debt only to payout large dividends. 

And the comparison of the privatised companies with the only public owned utility, Scottish Water, is revealing.

The English water companies have improved efficiencies since they were privatised in 1989. Their revenues have grown by 34 per cent since 1990-91 in constant currency terms, and operating cash flows have increased by 74 per cent over the same period. But the study claims they are not obviously more efficient than Scottish Water, which remains in state hands: its operating spending per household is about 10 per cent lower than the English companies. Customers’ bills in Scotland have fallen slightly in real terms since 2002, when Scottish Water was established, to about £357 per household in 2018. This compares with a 10 per increase in England and Wales over the same period, from an average of £356 per household in 2002 to £395 in 2018.

The study by Yearwood makes extensive comparisons between the privatised utilities and Scottish water on a host of parameters. It’s illuminating and upends the conventional wisdom about private management being superior to public management, at least in developed countries. 

All this raises fundamental questions about the desirability of private equity investments in regulated sectors and their regulatory treatment. 

“These problems are the failings of a system which encourages companies to extract returns as though it was a high risk business,” said Professor David Hall, a director at Greenwich university. “But water and sewerage services are not high risk.” Other experts have also criticised the regulator. Dieter Helm, a professor of energy policy at Oxford university who focuses on British utilities, said that water privatisation had been a “major regulatory failure”. “The companies were given a £1.5bn green dowry at privatisation and the system was set up to encourage borrowing,” he added. “Were their balance sheets used primarily for capital investment? No. They are private companies so of course they are going to try and maximise profits.” While the practice of companies borrowing to pay dividends is not unknown, it is more controversial in industries — such as water — where the regulator takes financing costs into account when setting prices for services.

The result of all this means that the deeply indebted privatised utilities in UK, and especially Thames Water, are close to renationalisation. In fact, the FT’s Lex column has advocated a “period of temporary public stewardship” would be beneficial and help tackle the complex ownership structure. It may be a good one-time reset to the incentives among financial market participants to wipe out the investors, impose haircuts on creditors, and nationalise the utilities. 

Saturday, April 20, 2024

Weekend reading links

1. Contrary to conventional wisdom, in the long-run smaller companies have outperformed larger ones in generating returns. 

The outsize returns of small companies relative to larger peers was documented in the early 1980s using evidence from the half-century to 1975. The idea found theoretical support. Higher returns compensate investors for taking on the greater risk of backing smaller, younger companies — though that can be minimised in a diversified portfolio... Over the long run, small-cap companies have outperformed larger ones, according to the UBS Global Investment Returns yearbook. Over 43 years in 34 markets, the monthly premium relative to large companies averaged 0.21 per cent. But the premium identified in the 1980s was far bigger. It can disappear — sometimes for years at a time — after periods of strong performance. That pulls down the long-term average.

2. What constitutes physiology of great cricket batting?

A sequence of three movements that produced the longest hits. First, the shoulders and hips pulled away from each other as the batter twisted into a coiled position, like a golfer at the height of a swing. McErlain-Naylor, seated on a Zoom call, demonstrated this well enough to remind me of contrapposto, the idealised stance of ancient Greek statues of discus throwers and warriors: shoulders thrown away from the hips, chest expanded, one leg more tense than the other, the frame taut and strong. Next, the most effective batters flexed their front elbow at the top of the swing and straightened it back out as they brought the bat through their stroke. Finally, they cocked and uncocked their wrists — a final lash of momentum...

James Moore, a psychologist who studies voluntary movement... told me that the brain craves certainty and likes things that flow predictably. “Economy of movement and timing enhance predictability,” he said. “With those who muscle their way through, there are more moving parts, therefore less economy of movement and less predictability.” The best-timed strokes, the most beautiful ones, are those that appear to require nothing beyond a minimal, sweet connection with the ball. “Great art,” he said, “offers no more and no less than the subject matter requires.”

3. The ramp-up in the production of iPhones from India is truly spectacular.

Apple has set a new record by exporting $10 billion worth of iPhones from India during FY24, according to data provided to the government... In terms of consumer products, this constitutes the largest-ever export of a single branded product by any company from India. iPhone exports accounted for 70 per cent of Apple’s total production in FY24. Of the three suppliers, Foxconn exported 60 per cent of its total iPhone output; Pegatron 74 per cent; and Wistron (now the Tatas) 97 per cent. Apple’s total iPhone production by its three suppliers touched $14 billion during the financial year... In FY24, the cumulative export target under the PLI scheme for the three suppliers was $7.2 billion, a target they have exceeded by 39 per cent... In future, as Apple expands capacity in India, it is expected that exports will cross 80 per cent of its total production from India. Apple is the first global value chain lead firm that has made India its home, primarily for labour-intensive manufacturing exports, rather than for the domestic market...
The total exports of mobile phones from India are expected to cross $15 billion in FY24, making Apple by far the largest contributor with nearly two-thirds of the total. The Apple ecosystem has generated nearly 150,000 new direct jobs since the launch of the PLI scheme and approximately 300,000 additional indirect jobs... While the domestic market for Apple products in general and the iPhone in particular is growing fast, the company’s revenue of Rs 49,321 crore for FY23 merely constituted 1.5 per cent of Apple’s global turnover of $383.29 billion. Its FY24, revenue is expected to increase over the previous fiscal by over 30 per cent.

4. Good primers by Shyam Saran and Shankar Acharya on the emerging situation in Myanmar where the military junta is losing control over large parts of the country's territories to the resistance forces of the ethnic minorities and the army mobilised by the opposition National League for Democracy (NLD) led by Aung Sang Suu Kyi's parallel National Unity Government (NUG). The junta has been on the back foot after the civil war broke out following its refusal to recognise the electoral verdict in 2021 won overwhelmingly by the NLD which represents the Burman majority. The junta carried out a military coup and installed itself in power, forcing the resistance from NLD and ethnic minorities. 

5. The national highways monetisation program of the government of India must count as one of the great successes of PPP anywhere in the world. The NHAI has been doing monetisation through TOT bundles and Infrastructure Investment Trusts (InvIT). 

The authority has so far issued 14 bundles of national highways in the TOT mode. This instrument gives highway players the right to collect toll for a specific period by paying the authority upfront cash. The valuation is arrived at through competitive bidding. After having struggled with getting bids considered fair by the authority, NHAI has awarded 10 TOT bundles to raise Rs 42,000 crore since the beginning of the asset monetisation pipeline. In InvIT, the trust which has numerous tax benefits for investors, buys the road from the authority and operates it. It distributes toll earnings in the form of return on units. NHAI has executed three rounds of offers through its InvIT, raising close to Rs 26,000 crore... In FY24, the highway authority had identified 46 national highway stretches, spanning 2,612 km for monetisation through ToTs and InvIT. It finished the financial year, meeting over 90 per cent of its target of Rs 44,000 crore... NHAI had monetised highway assets worth Rs 40,314 crore, through its three models — TOT, InvIT, and toll securitisation — for specific projects, such as the Delhi-Mumbai expressway... The National Highways Authority of India (NHAI) is looking to monetise 33 stretches of national highways during the current financial year (FY25) through its toll operate transfer (TOT) and infrastructure investment trust (InvIT)... Cumulatively, the 33 stretches, spanning 2,741 kilometres (km) earned approximately Rs 5,000 crore revenue in FY24.

6. Harish Damodaran has a brilliant article where he points to some interesting facts about Tamil Nadu, the state with the most diversified economy. This about diversification in agriculture itself.

About 45.3% of TN’s farm GVA comes from the livestock subsector, the highest for any state and way above the 30.2% all-India average. Not surprisingly, TN is home to India’s largest private dairy company (Hatsun Agro Product), broiler enterprise (Suguna Foods), egg processor (SKM Group) and also “egg capital” (Namakkal).

And this about the nature of its industrialisation

TN has just a handful of large business houses with annual revenues in excess of Rs 15,000 crore: TVS, Murugappa, MRF, Amalgamations and Apollo Hospitals. Even they are not in the league of Tata, Reliance, Aditya Birla, Adani, Mahindra, JSW, Vedanta, Bharti, Infosys, HCL or Wipro, as far as turnover goes. TN’s economic transformation has been brought about not by so-called Big Capital as much as medium-scale businesses with turnover range from Rs 100 crore to Rs 5,000 crore (some, like Hatsun and Suguna, have graduated to the next Rs 5,000-10,000 crore level). Its industrialisation has also been more spread out and decentralised, via the development of clusters. Some of the clusters – agglomerations of firms specialising in particular industries – are well known: Tirupur for cotton knitwear (the units there clocked exports of Rs 34,350 crore and Rs 27,000 crore of domestic sales in 2022-23); Coimbatore for spinning mills and engineering goods (from castings, textile machinery and auto components to pumpsets and wet grinders); Sivakasi for safety matches, fire crackers and printing; Salem, Erode, Karur and Somanur for powerlooms and home textiles; and Vaniyambadi, Ambur and Ranipet for leather. 

Many cluster towns are hubs for multiple industries. Thus, Karur has powerlooms, bus body builders and even makers of mosquito and fishing nets (one of them, V.K.A. Polymers, is a major exporter of insecticide-treated bed nets). Dindigul has spinning mills and leather tanneries. Namakkal is as famous for layer poultry farms as its large lorry fleet/bulk cargo logistics operators and tapioca-based sago (sabudana) factories. Salem has powerlooms and tapioca starch-cum-sago producers, while Erode is a textile and “turmeric city”. In contrast to them are the more sub-specialised clusters. Chatrapatti, in Virudhunagar district’s Rajapalayam taluka, is “bandage city” not for nothing: It is a manufacturing centre for bandages, gauze pads/rolls/swabs and other surgical cotton products and woven dressings.

Tiruchengode is India’s “borewell rigs capital”. The borewell drilling services contractors of this town near Namakkal take their truck-mounted rigs all over the country to dig up to 1,400 feet. Dhalavaipuram, hardly 10 km from Rajapalayam, specialises in production of nighties and ladies innerwear, just as Natham, next to Dindigul, does in low-priced men’s formal shirts. Most of these clusters have come up in small urban/peri-urban centres, providing employment to people from surrounding villages who may otherwise have migrated to big cities for work. They have, moreover, created diversification options outside of agriculture, reducing the proportion of TN’s workforce dependent on farming.

TN’s early industrialists were mainly Nattukottai Chettiars and Brahmins... Prominent among them were Annamalai Chettiar (the M.A. Chidambaram and Chettinad groups descended from him), A.M.M. Murugappa Chettiar (Murugappa Group), Karumuttu Thiagaraja Chettiar (textile magnate) and Alagappa Chettiar (textiles, insurance, hotels and education). The big Tamil Brahmin-owned houses included TVS, TTK, Amalgamations, Seshasayee, Rane, India Cements, Sanmar, Enfield India, Standard Motors and Shriram. A more recent name is the business software solutions company Zoho Corporation of Sridhar Vembu. The drivers of TN’s more recent decentralised industrialisation have, however, been entrepreneurs from more ordinary peasant stock and provincial mercantile castes...
The promoters of Suguna Foods, CRI Pumps, Elgi Equipment and Lakshmi Machine Works, too, are from Kammavar Naidus. The cluster capitalists of Tirupur, Erode, Salem, Namakkal, Karur and Dindigul are mainly Kongu Vellalar or Gounders... Sivasaki’s fireworks, match and printing industries have been built largely by Nadars. But this belt in southern TN – also covering Virudhunagar, Srivilliputhur, Watrap and Rajapalayam – has produced entrepreneurs from other communities as well: Raju (Ramco Group and Adyar Ananda Bhavan) and Udayar (Pothys). Many from here have also gone on to create successful product brands: Hatsun (‘Arun’ ice-cream and ‘Arokya’ milk), V.V.V. & Sons (‘Idhayam’ sesame oil) and Kaleesuwari Refinery (‘Gold Winner’ sunflower oil)... Christians (MRF, Johnson Lifts and Aachi Masala Foods) and Muslims (Farida Group)... CavinKare’s C.K. Ranganathan, a Mudaliar, was selling ‘Chik’ shampoo (taken from his father Chinni Krishnan’s name) in single-use sachets well before the likes of Hindustan Unilever latched on to the idea.

7. One line of thinking about the impact of high-interest rates on the US economy is that it may be responsible for sustained economic growth.

The jump in benchmark rates from 0% to over 5% is providing Americans with a significant stream of income from their bond investments and savings accounts for the first time in two decades. “The reality is people have more money,” says Kevin Muir, a former derivatives trader at RBC Capital Markets who now writes an investing newsletter called The MacroTourist. These people — and companies — are in turn spending a big enough chunk of that new-found cash, the theory goes, to drive up demand and goose growth.

8. Andrew Haldane has some home truth about inflation forecasting within central banks.

In the early years of inflation targeting in the UK, the then head of forecasting at the Bank of England entered my room clutching a piece of paper. On it were two lines: the inflation forecast produced painstakingly by his team over the preceding weeks, and an alternative inflation projection hand-drawn in pencil by the then governor. Only the latter “forecast” ever saw the light of day... Former central bank governor Mervyn King used to observe that the probability of forecasts proving correct was almost precisely zero. (Ironically, this is one of the few BoE forecasts ever made that turned out to be accurate.)..

Economic models bring rigour to policy. Unfortunately, they also bring mortis. Even models at the frontier are always at least one step behind real-world events: from the global financial crisis (when most were found to take no meaningful account of the financial sector) to the Covid-19 and cost of living crises (when most were found to have no well-developed sectoral supply side). In these instances, models served to unhelpfully blinker policymakers to events playing out before their eyes, but not embedded in their models. This led to them first missing these crises, and then responding too slowly. Those models can also be gamed in ways that impose too few constraints on policy. In my experience, many policymakers produced their economic forecasts by working backwards from their preferred stance. This is an inversion of the way inflation targeting was meant to operate.

9.  It's not UK, but Sweden that has the deepest capital markets in Europe. 

At a time when the UK and many other European countries are struggling to attract initial public offerings and suffering from falling trading volumes, Sweden stands out for having, relative to its size, thriving capital markets that are backed by legions of investors and which are even tempting foreign companies to list... Over the past 10 years, 501 companies have listed in Sweden, more than the total number of IPOs in France, Germany, the Netherlands and Spain combined, according to Dealogic data. The UK is top with 765 listings... the Nordic country has been highly successful at encouraging smaller domestic businesses to stay at home, encouraged by the depth of its stock market... Around 90 per cent of listings are valued at less than $1bn... A key driver has been the country’s investment culture.

Consider the preference for equity investment among insurers.

Among larger investors, Swedish pension funds have long owned domestic equities. The country’s four biggest retirement schemes have roughly maintained or increased their holdings of domestic equities in recent years. In the UK, in contrast, domestic equity holdings among pension funds have plunged to about 4 per cent. Meanwhile, Swedish insurance companies have the highest holdings of stocks in the EU.

Swedish households are the most avid retail investors in Europe.

Retail investors are also big buyers of Swedish stocks, helped by a wealth of reforms in recent decades. Compared with the rest of Europe, Swedish households hold among the highest proportion of their investments in listed companies and among the lowest in bank deposit holdings, while financial literacy is greater than in Germany, France or Spain. In 1984, the government introduced Allemansspar, a product enabling ordinary Swedes to invest in stock markets. By 1990 there were already 1.7mn of these accounts, helping drive the launch of domestically focused small and mid-cap funds. Such funds arrived “10-to-20 years before any other country did anything similar, at least in Europe”... Rule changes in the 1990s allowed people to invest 2.5 per cent of the amount they allocate to their pensions into funds of their choice, supported by a public information campaign. And in 2012 the state introduced investment savings accounts called ISKs that allow individuals to invest without needing to report their holdings or worry about capital gains or dividend tax. Instead, the total value of the account is taxed — and in 2024 that was at a level of about 1 per cent... German investors have historically favoured bonds over stocks, making equity raising more challenging.
And Swedish companies are far more likely to be listed than peers. 
And the net result of all this has been positive
Sweden’s system appears to have translated into stock market returns. Its main index has gained 85 per cent over the past decade, while the Euro Stoxx 600 index has risen 49 per cent and London’s FTSE 100 just 17 per cent. That, too, is helping persuade Swedish small and mid-sized companies to stay at home.

10. Chinese State Owned Enterprises (SOEs) are doing better than the broader stock market index among Chinese stocks, mirroring trends in India too.  

11. Good read in Business Standard on the struggles facing the apprentice system in India, where just 1% of work force entrants are apprentices.