Arguably, the most significant corporate trend of today is the rush to break out from China’s manufacturing dominance and diversify away from the country. This trend assumed importance in the course of Donald Trump’s first term and has now become an existential reality for companies and countries.
But while the intent to diversify or decouple is real, the reality of translating the goals into action has been challenging for multinational corporations. Sample this
A Bain survey of chief operating officers, conducted before Trump’s re-election last year, found that while 80 per cent were planning to increase supply chain onshoring or reshoring over the next three years — up from 63 per cent in 2022 — only 2 per cent had successfully completed such plans. “Changing suppliers or shifting production is easier said than done, and because organisations are all looking at the same locations, that is likely to create capacity constraints in terms of skilled labour and factory space,” says Simon Geale, executive vice-president at Proxima, a supply chain consultancy owned by Bain & Company.
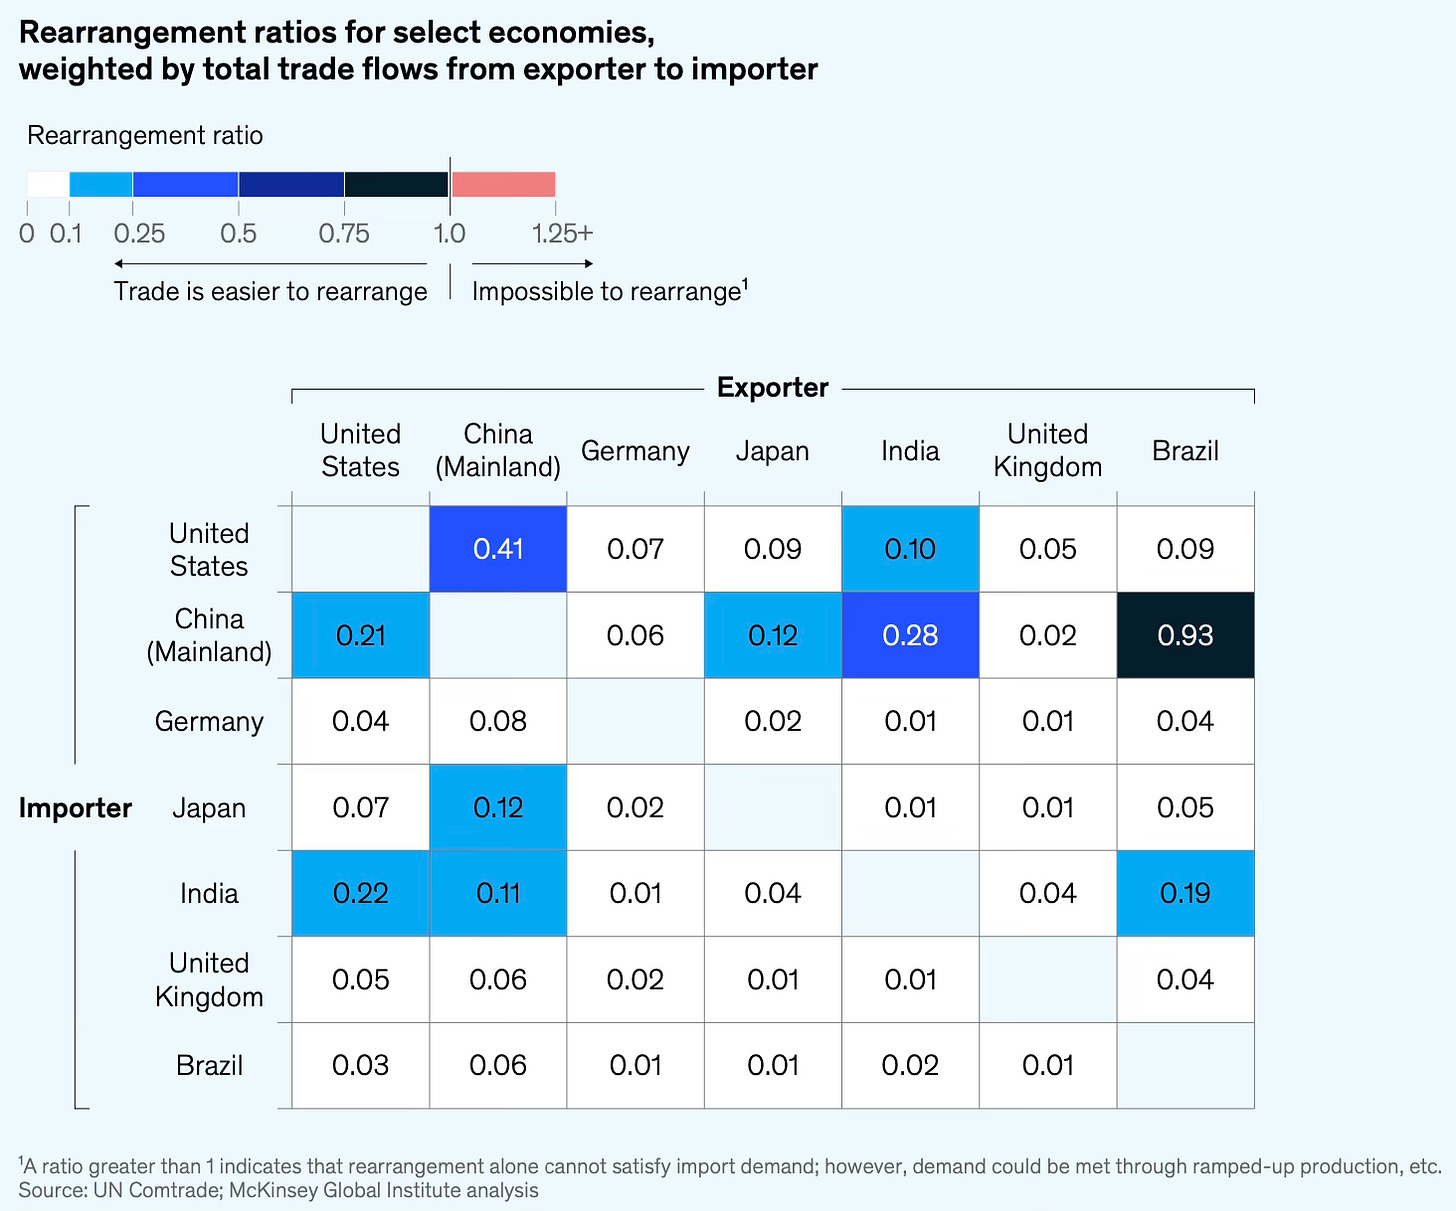
For a start, the dependency on China varies widely across product categories. A new McKinsey Global Institute report has formulated a product-level trade rearrangement ratio to measure a country’s trade dependency on China. It is the ratio of a country’s imports of that product from China to the total global exports of that product. The ratio is directly proportional to trade dependence. The weighted average of all the imports of a country from China can be calculated to determine its aggregate trade dependence on China.
The China Brazil-rearrangement ratio is highest, dominated by China’s massive $40 billion imports of soybeans from Brazil. This dwarfs the potentially available soy export market, which is about $20 billion, because other exporters already ship most of their soybeans to China. Beyond US–China ratios, other rearrangement ratios greater than 0.2 are China–India and India–US. Often, these midrange ratios are driven by acute points of reliance for specific products. For India’s exports to China, for example, the higher ratio is driven by products like castor oil. India is the largest global supplier of castor oil, and castor oil is one of China’s largest imports from India, used mainly as a building block in its chemical industry. China gets more than 99 percent of its castor oil imports from India, and the rearrangement ratio for this product is correspondingly high.
Interestingly, Chinese imports have among the highest rearrangement ratios with its trade partners - with Brazil, India, the US, and Japan - making the country dependent on those countries in some products. This does point to the leverage those countries might have with their exports to China. Apart from Brazil, India and the US appear to have substantial leverage. Does castor oil provide India with any meaningful leverage over China? What’s the leverage that the US might want to deploy against the Chinese?
For India, too, the graphic points to a high risk concentration in its exports and imports. In a geopolitically fraught world, governments ought to take cognisance of these trends and step in to strategically realign them.
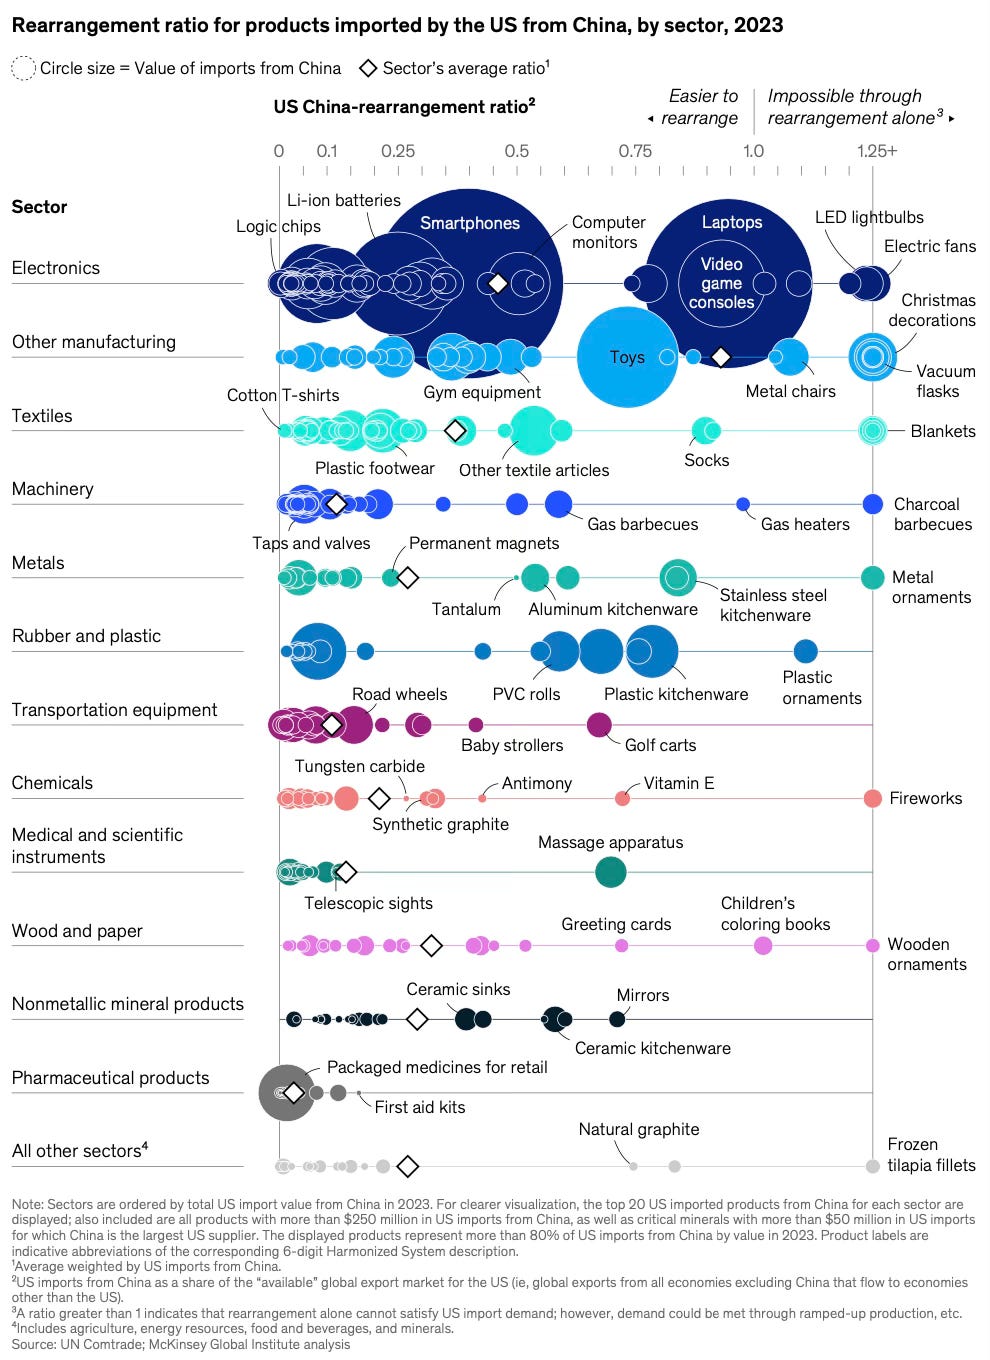
The report calculates the ratio for all US imports from China to identify the likely product pain points.
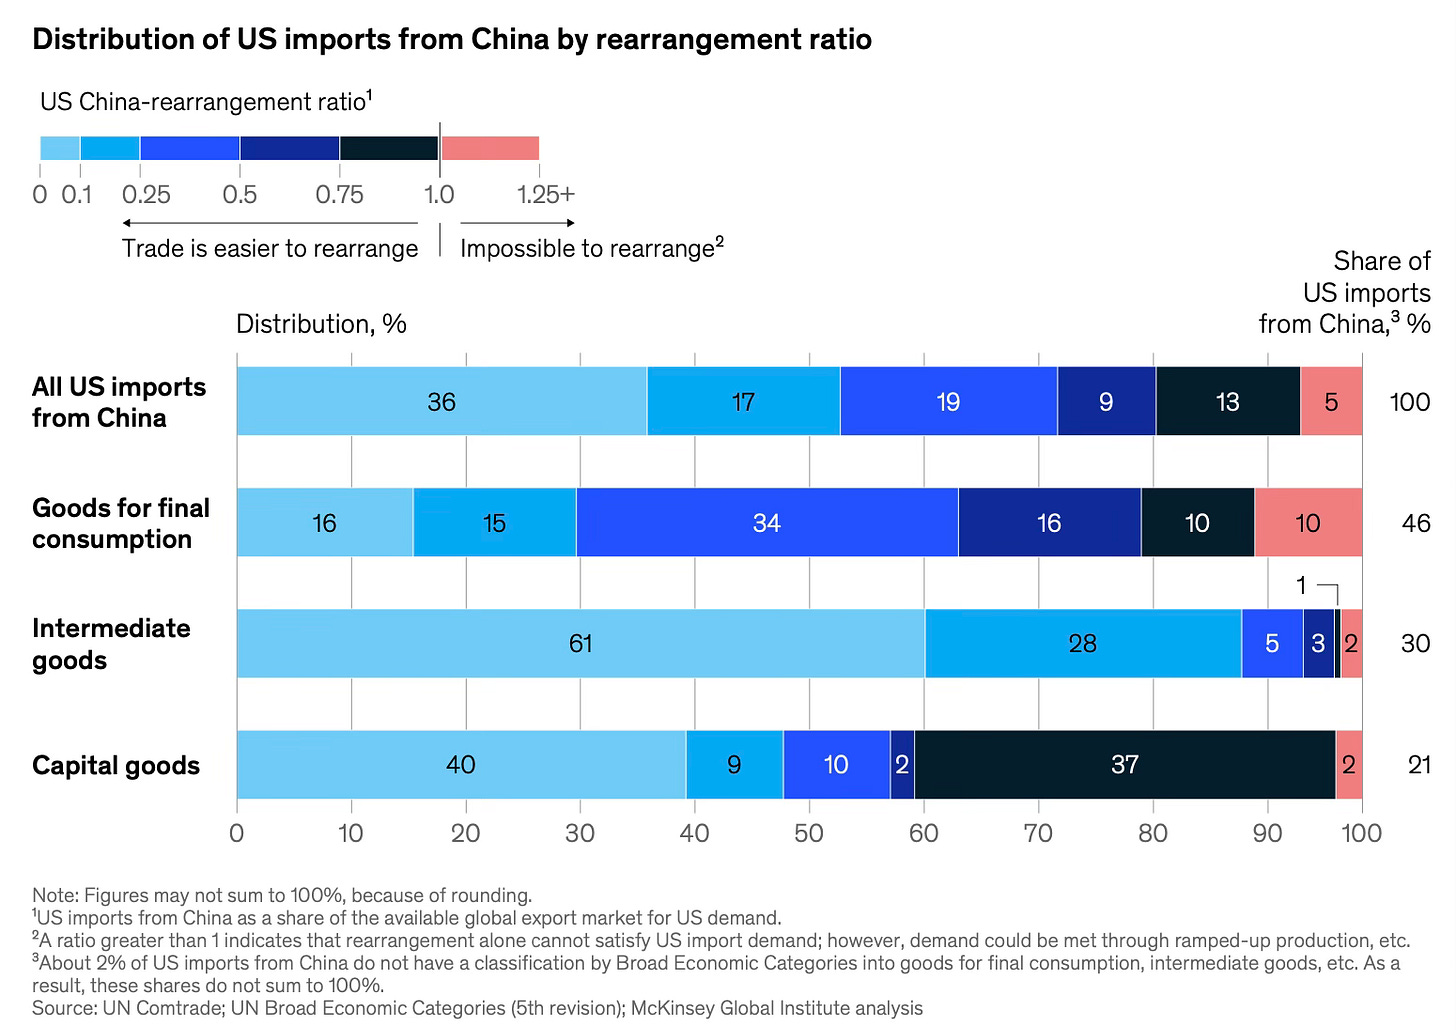
The report finds that while 61% of US business input imports from China have ratios below 10% (thereby making substitution easy), the ratio falls to 35% for product imports. It’s in capital goods that 37% of imports have ratio between 0.75 and 1.
In contrast, China’s imports from the US are easier to substitute, since they are also widely exported by others.
The report finds that Europe will become the fulcrum for any trade rearrangement.
Across nine varied simulations, European imports from China and exports to the United States both go up by nearly $200 billion. As intra-European trade shifts to the United States, it leaves holes filled by increased Chinese exports—assuming Europe does not choose to alter its own trade policies. Others will be affected, too: exports to the United States from as many as 70 countries may increase by more than 10 percent.
A new paper by ECB economists sheds light on the extent of dependency of European and US economies on Chinese imports. They use novel quantitative metrics like indices on export similarity, partner similarity, and ideal point distance.
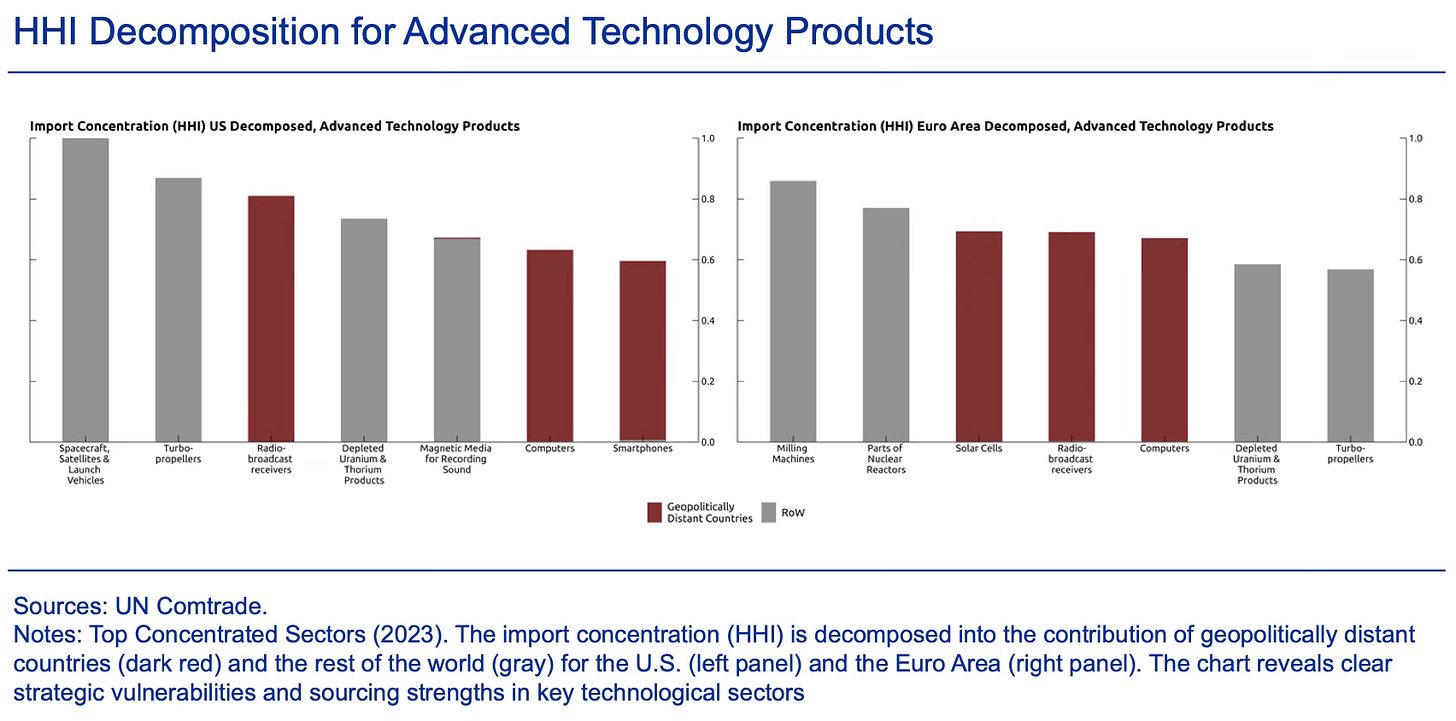
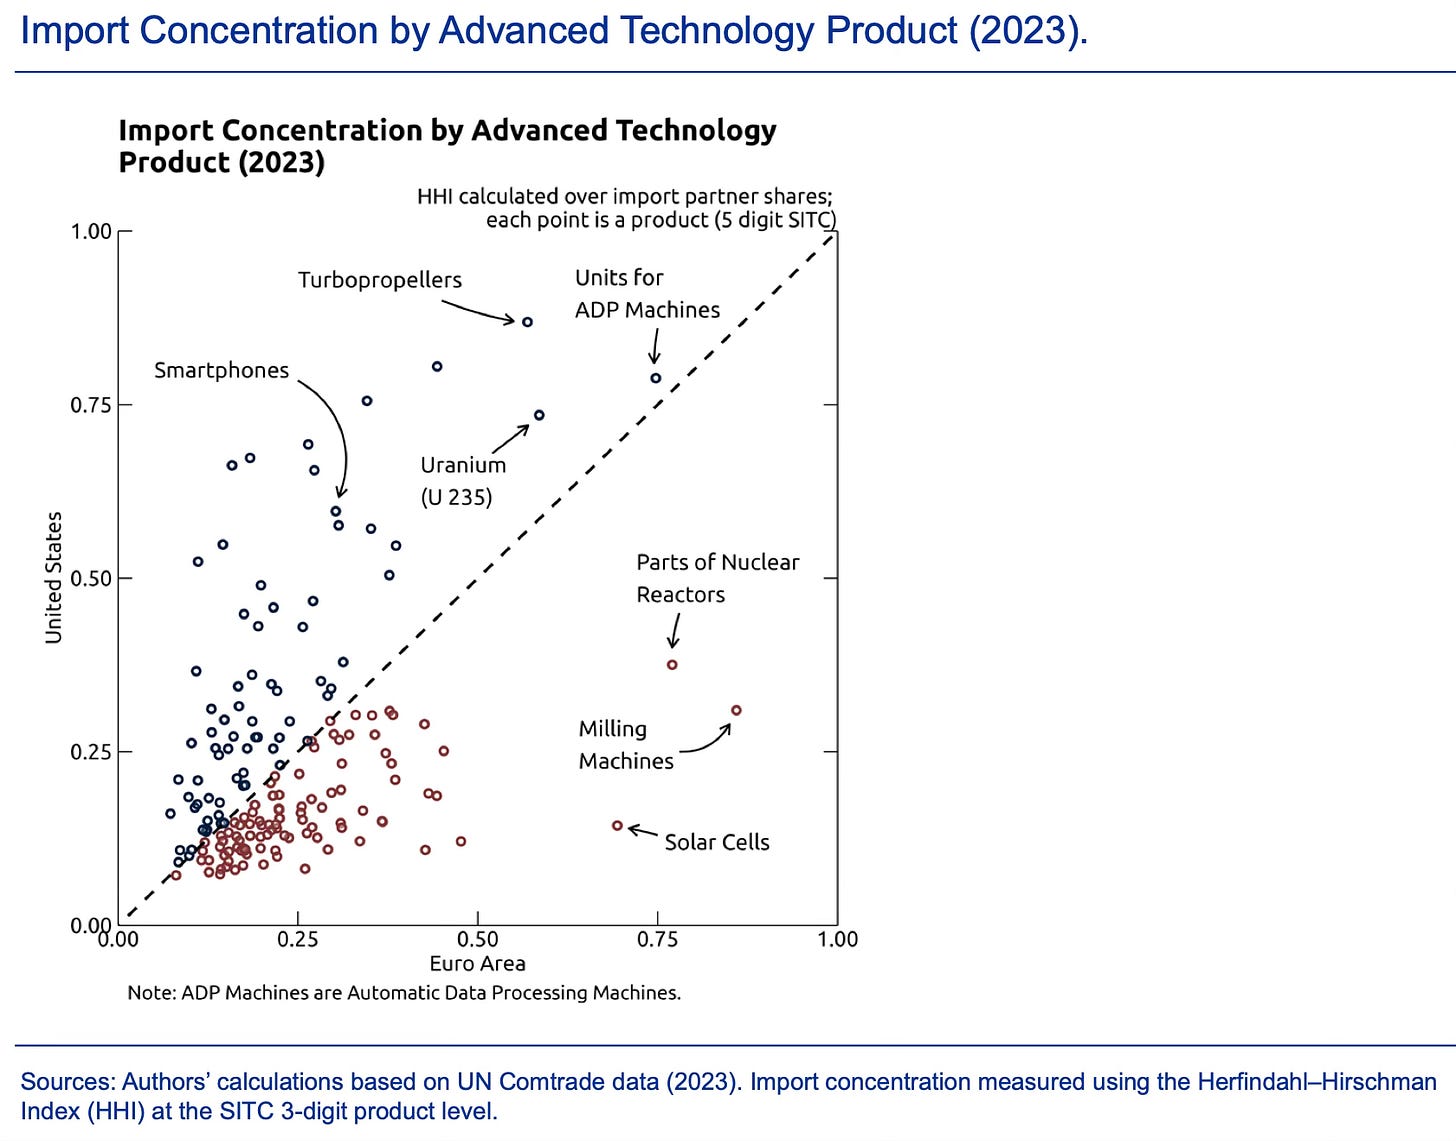
This shows the US and EU’s import concentration dependence on geopolitically distant countries like China, Russia, and Iran for a few advanced technology products.
The authors analyzed import concentration in the US and the Euro Area using the Herfindahl–Hirschman Index (HHI) to identify supply chain risks. This shows their import concentration dependence on all advanced technology products.
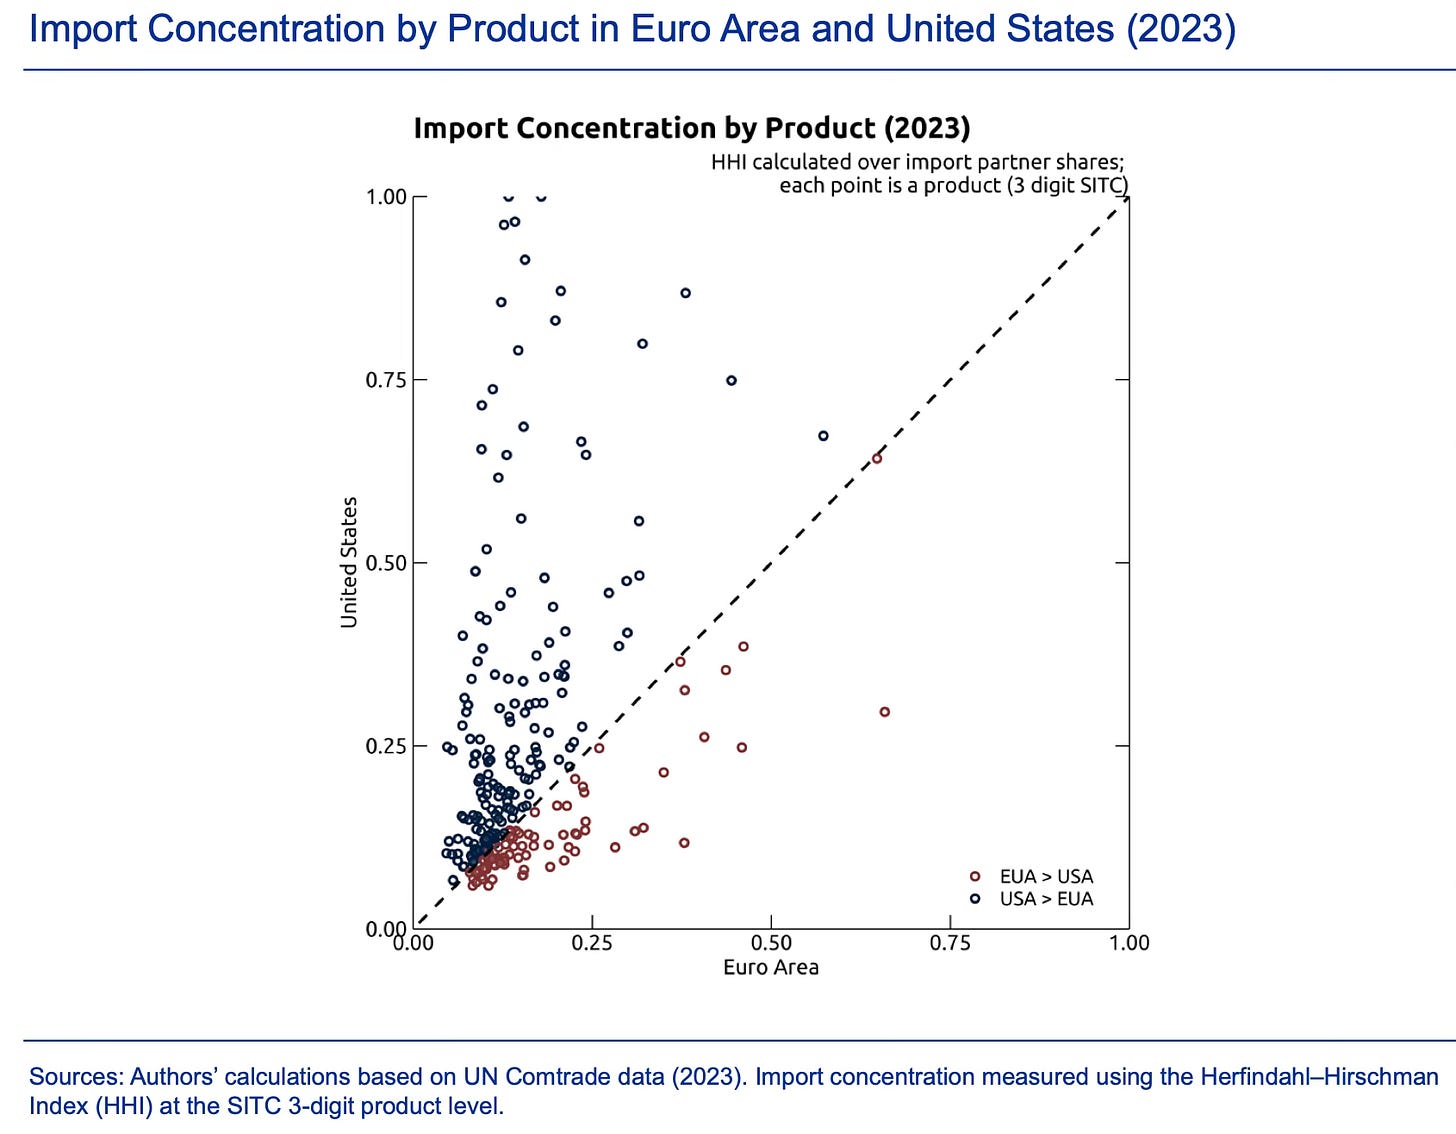
This shows the general import concentration dependence risk for all products.
Clearly, the US is much more dependent than EU in terms of a sigificant share of their imports on several products coming from geopolitically distant countries across both all products in general and advanced technology products in particular.
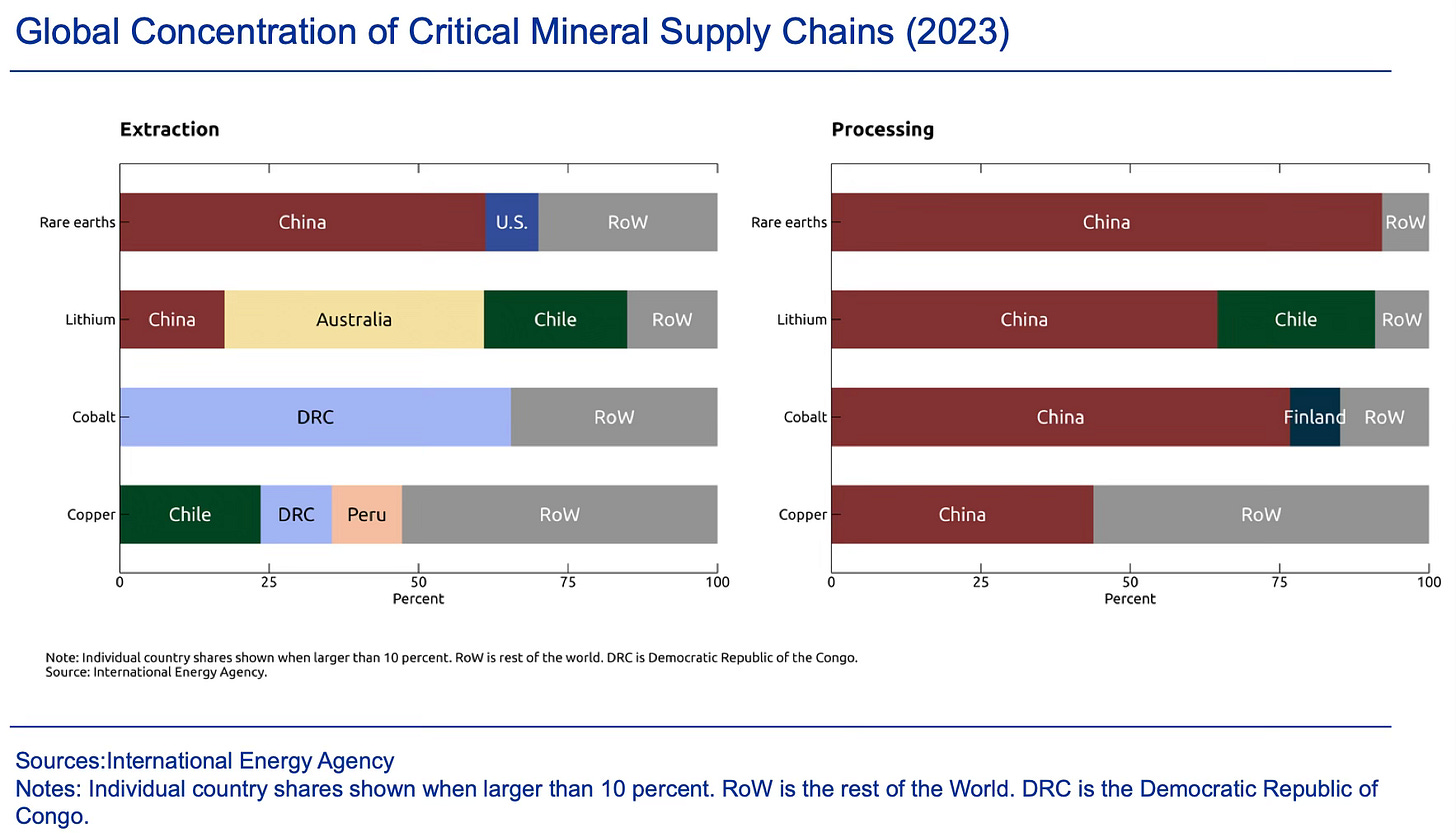
Critical minerals, specifically in their processing, are only the most salient example of this dependence.
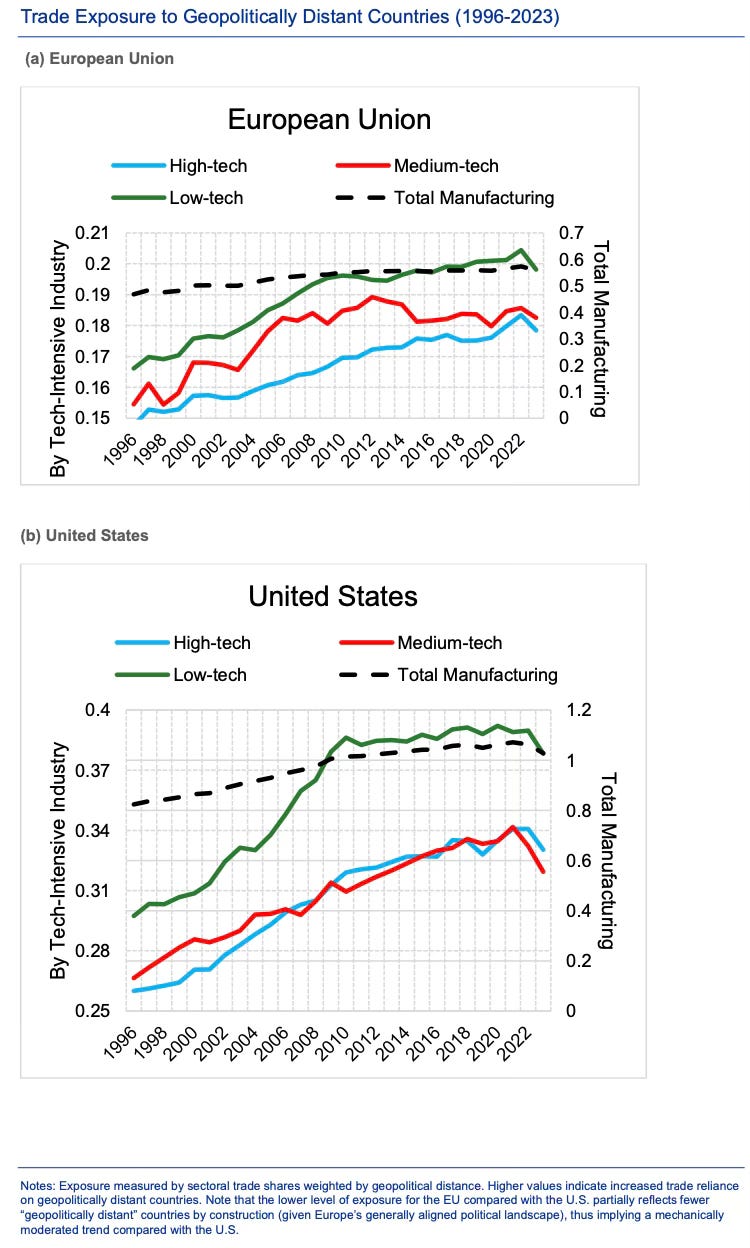
The paper shows that in terms of general trade exposure, both the EU and the US have had increasing manufacturing trade exposure to these countries since 1996.
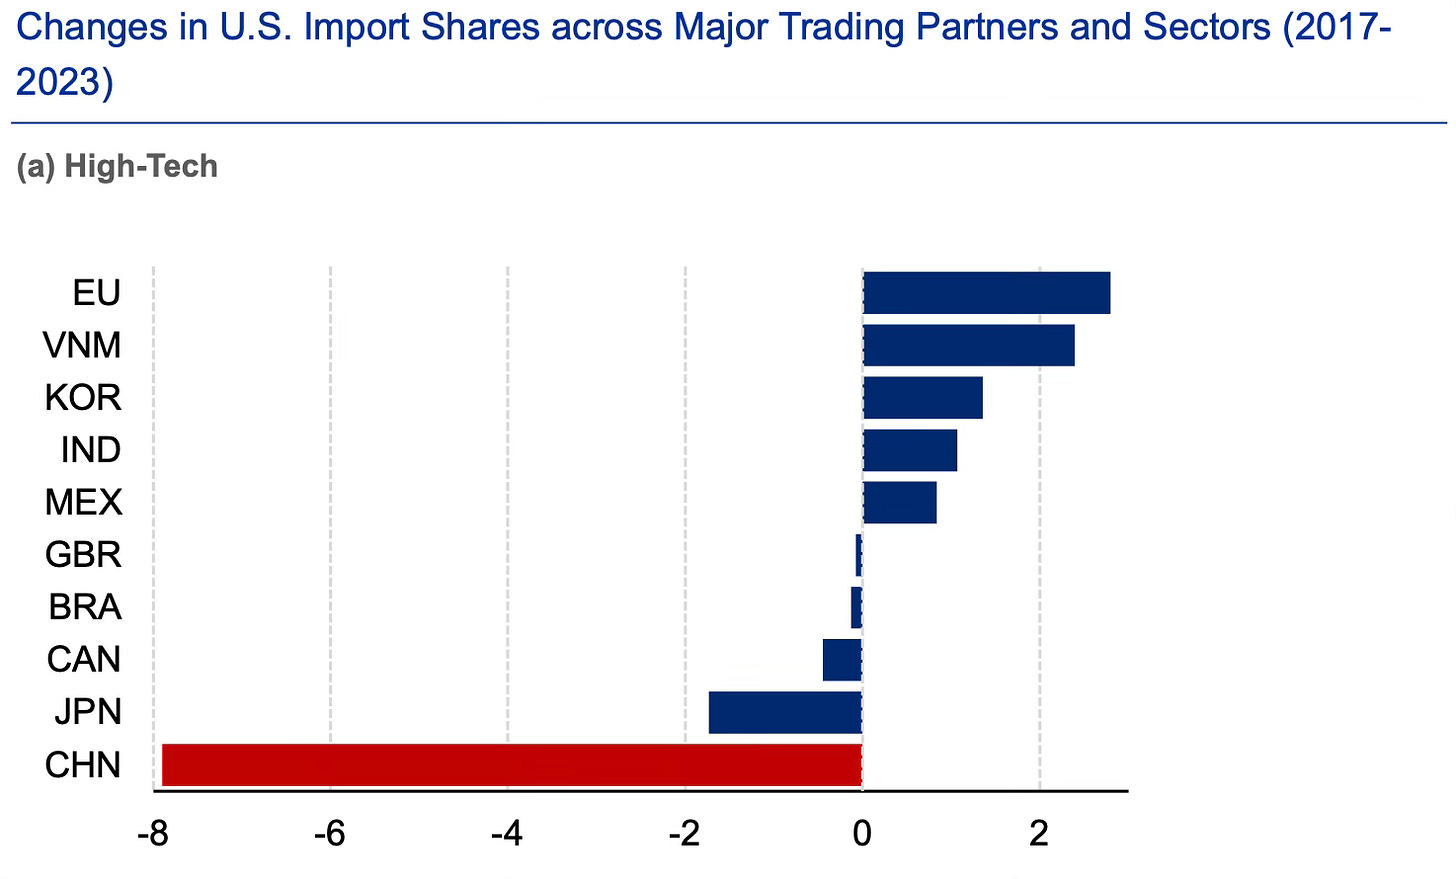
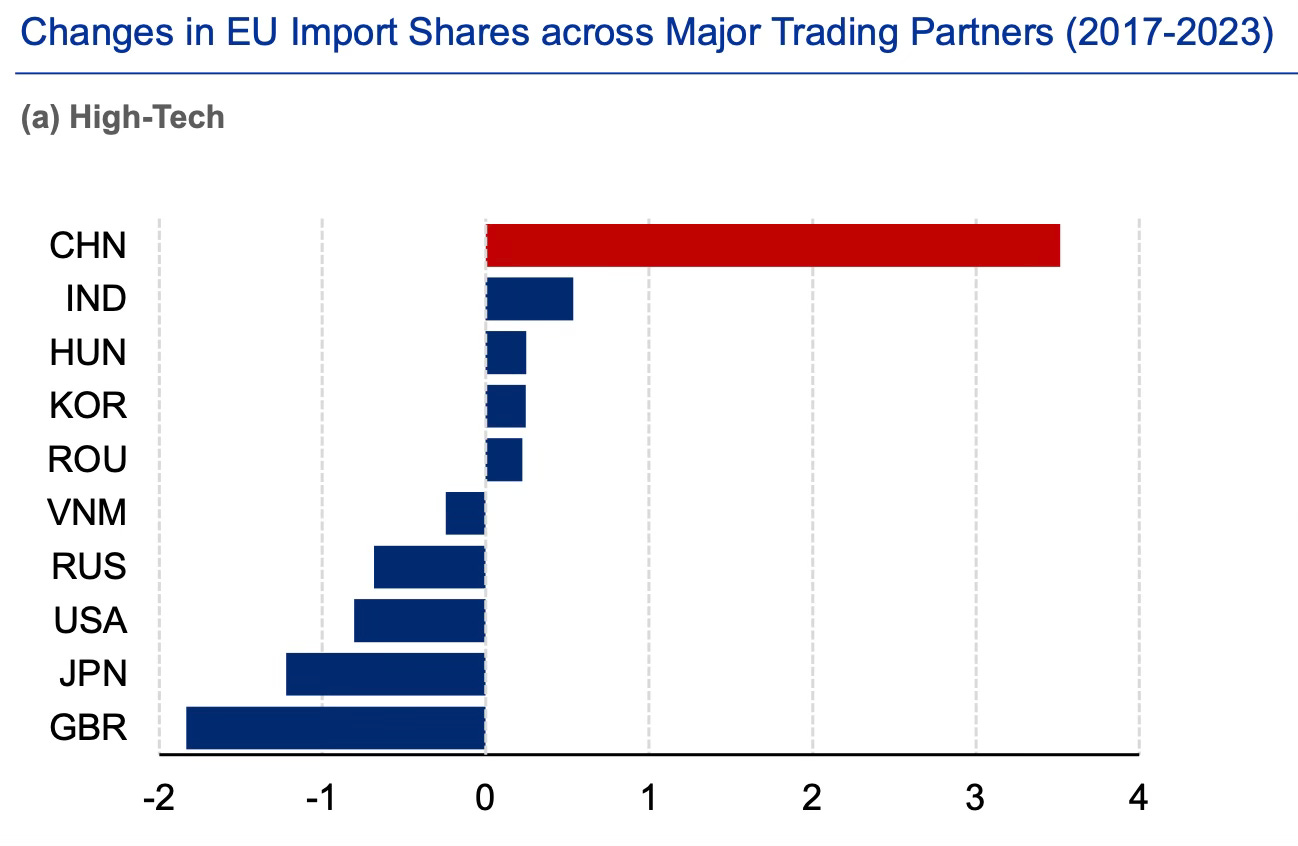
It’s interesting that while the Chinese share of high technology and all manufacturing products for the US has declined the most and significantly so since 2017 after President Trump started pursuing restrictions…
… the same has increased and significantly so for the EU.
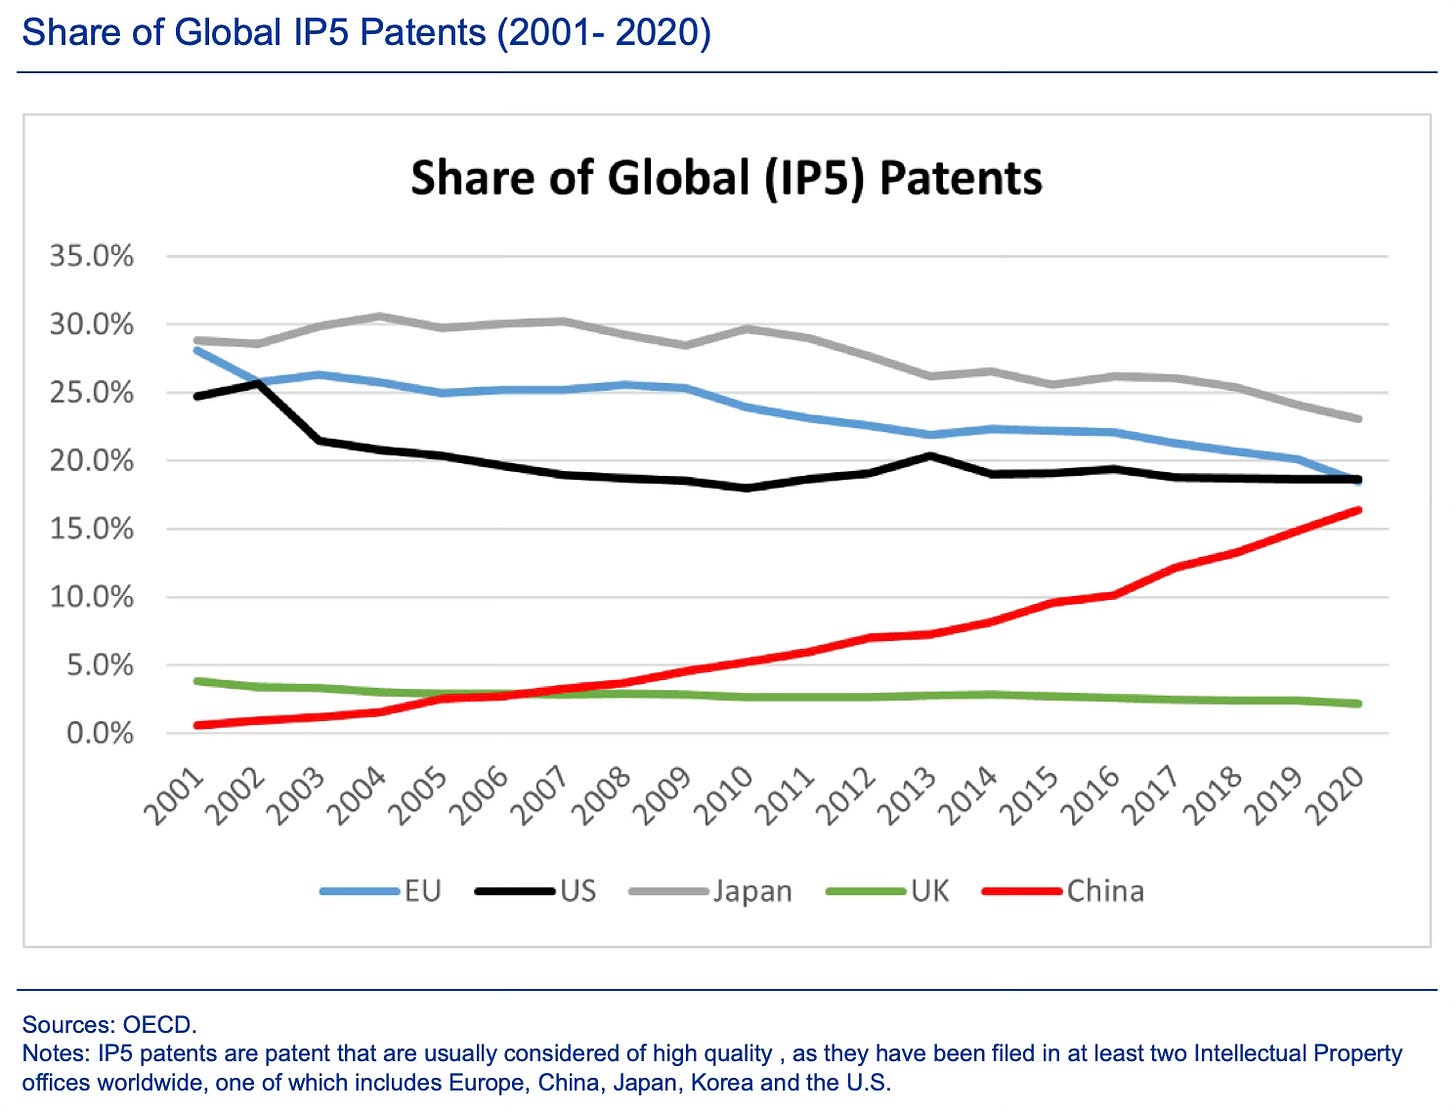
It’s interesting that each of the US, Japan, and EU still exceeds China in their shares of global IP5 patents, which are filed in atleast two jurisdictions and are considered of higher quality.
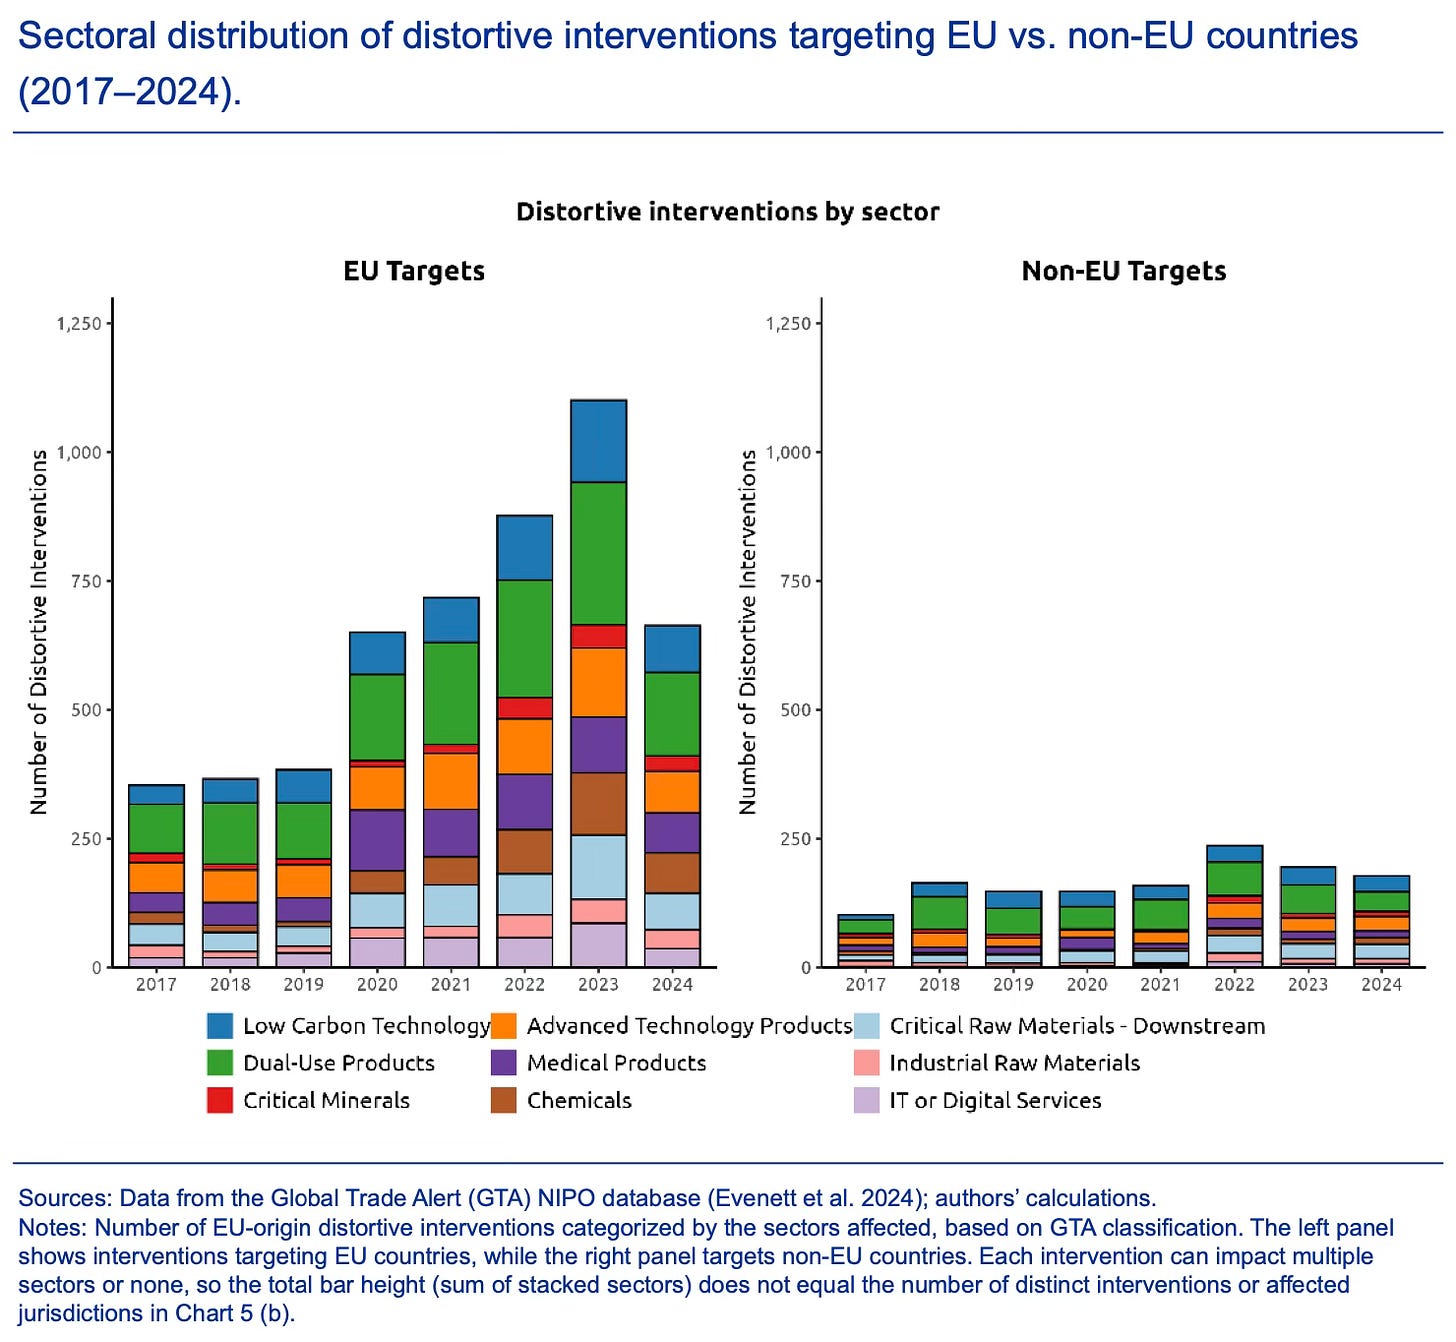
The paper uses the Global Trade Alert (GTA) database to look at all the strategic and distorting policy interventions used by EU members individually and collectively as the EU to address the geoeconomic risks and promote their domestic manufacturing industries. It finds a pronounced shift towards EU collective action since 2018.
This evolution is largely a strategic response to the technological ascension of China and escalating global trade tensions, signaling a deliberate move away from fragmented national policies towards cohesive, unified EU strategies. The introduction and deployment of critical policy tools such as the Anti-Coercion Instrument (ACI) and the Carbon Border Adjustment Mechanism (CBAM) epitomize this strategic reorientation aimed at managing the vulnerabilities arising from selective decoupling and heightened competition with China.
This is the sectoral distribution of such interventions by EU. The first panel mistakenly refers to EU targets, but covers those targeting non-EU targets.
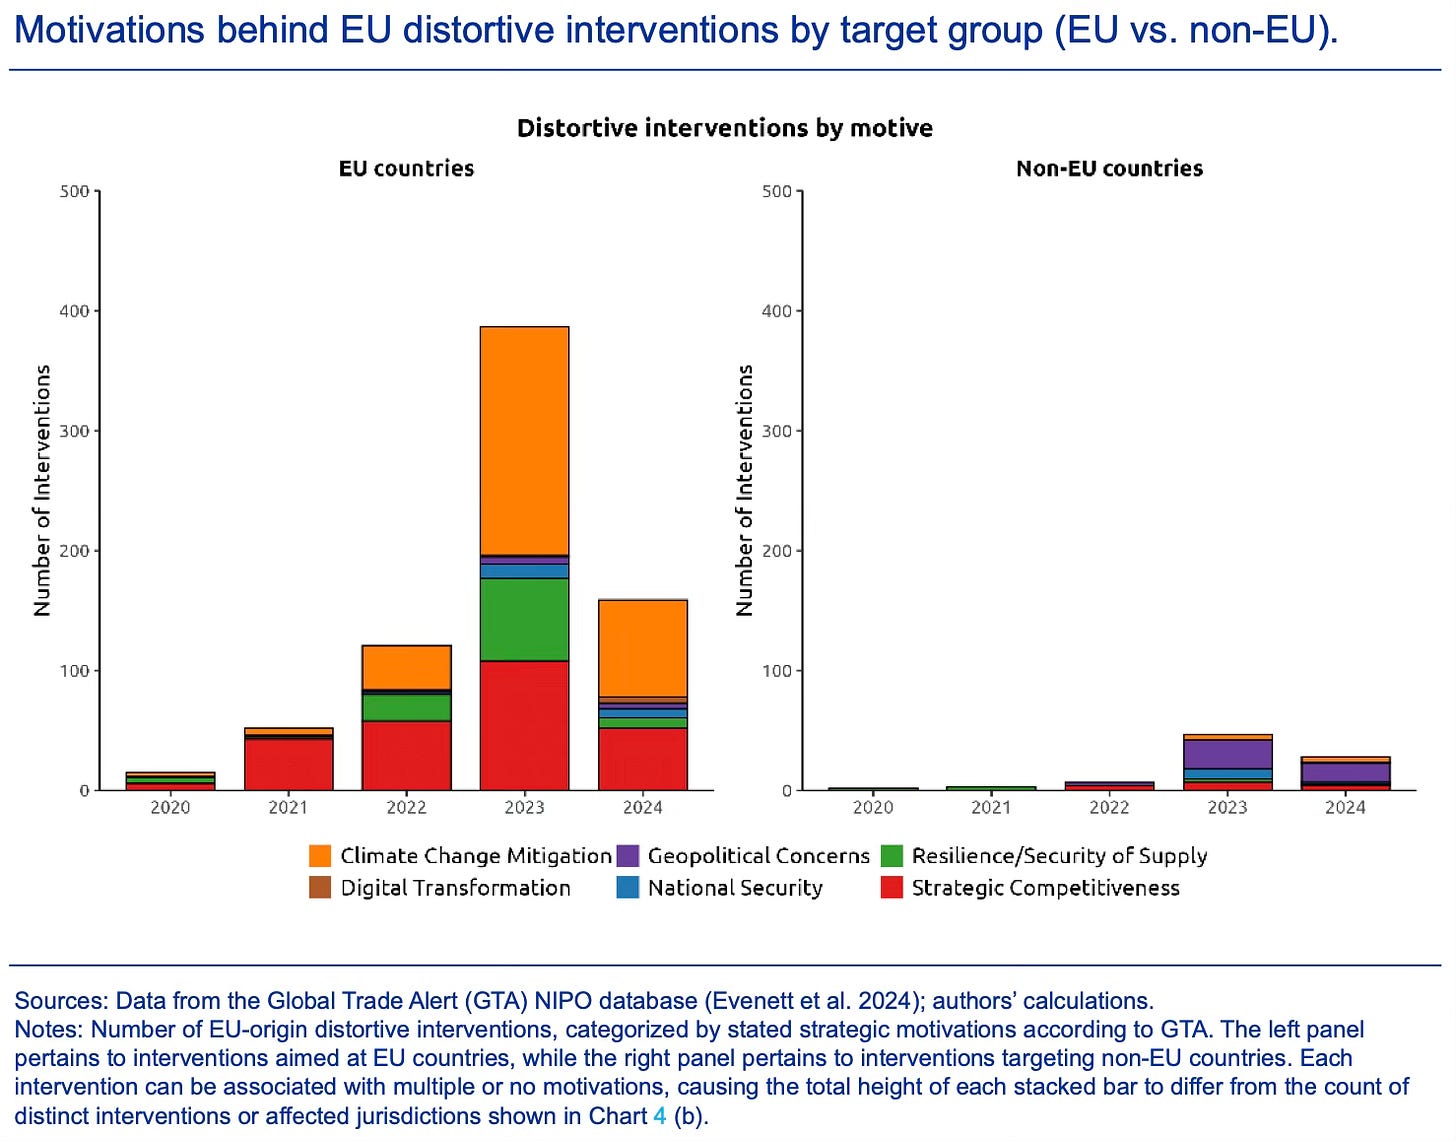
This captures the motivations behind such interventions by EU (again the panels are reversed.).
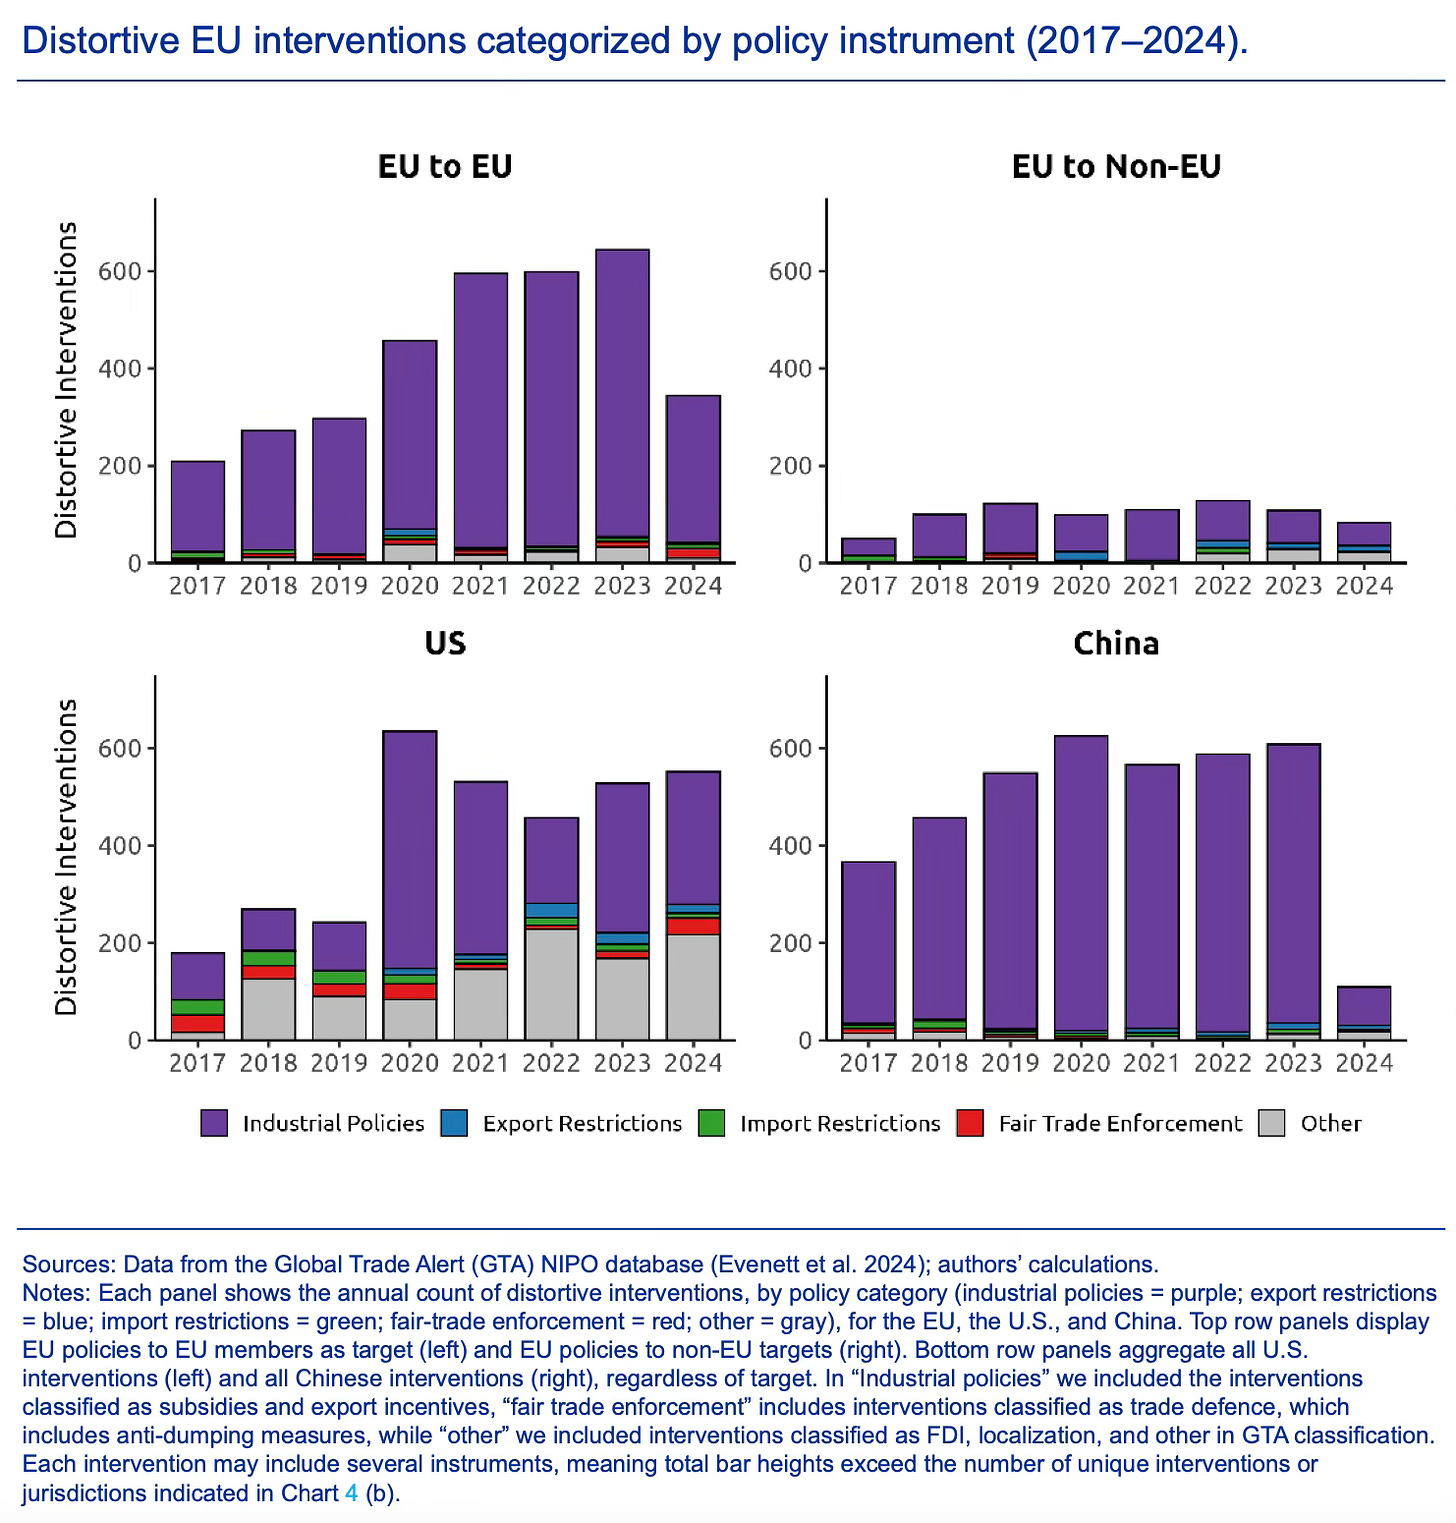
Finally, this captures policy instrument-wise interventions for EU, US and China.
There’s a global convergence in responding to the China problem and it rapidly growing in speed and scope. Unfortunately, Donald Trump’s tariffs are clearly muddying the waters and inadvertently may be helping China mitigate the consequences of these responses. As an illustration, the Trump tariffs on India would not only slow down Apple’s diversification from China, but also deter other prospective investors seeking to diversify into arguably the largest opportunities outside China.
No comments:
Post a Comment