Substack

Thursday, July 31, 2025

Graphical summary of geoeconomic risks from the China dependence

Arguably, the most significant corporate trend of today is the rush to break out from China’s manufacturing dominance and diversify away from the country. This trend assumed importance in the course of Donald Trump’s first term and has now become an existential reality for companies and countries.

But while the intent to diversify or decouple is real, the reality of translating the goals into action has been challenging for multinational corporations. Sample this

Bain survey of chief operating officers, conducted before Trump’s re-election last year, found that while 80 per cent were planning to increase supply chain onshoring or reshoring over the next three years — up from 63 per cent in 2022 — only 2 per cent had successfully completed such plans. “Changing suppliers or shifting production is easier said than done, and because organisations are all looking at the same locations, that is likely to create capacity constraints in terms of skilled labour and factory space,” says Simon Geale, executive vice-president at Proxima, a supply chain consultancy owned by Bain & Company. 

For a start, the dependency on China varies widely across product categories. A new McKinsey Global Institute report has formulated a product-level trade rearrangement ratio to measure a country’s trade dependency on China. It is the ratio of a country’s imports of that product from China to the total global exports of that product. The ratio is directly proportional to trade dependence. The weighted average of all the imports of a country from China can be calculated to determine its aggregate trade dependence on China. 

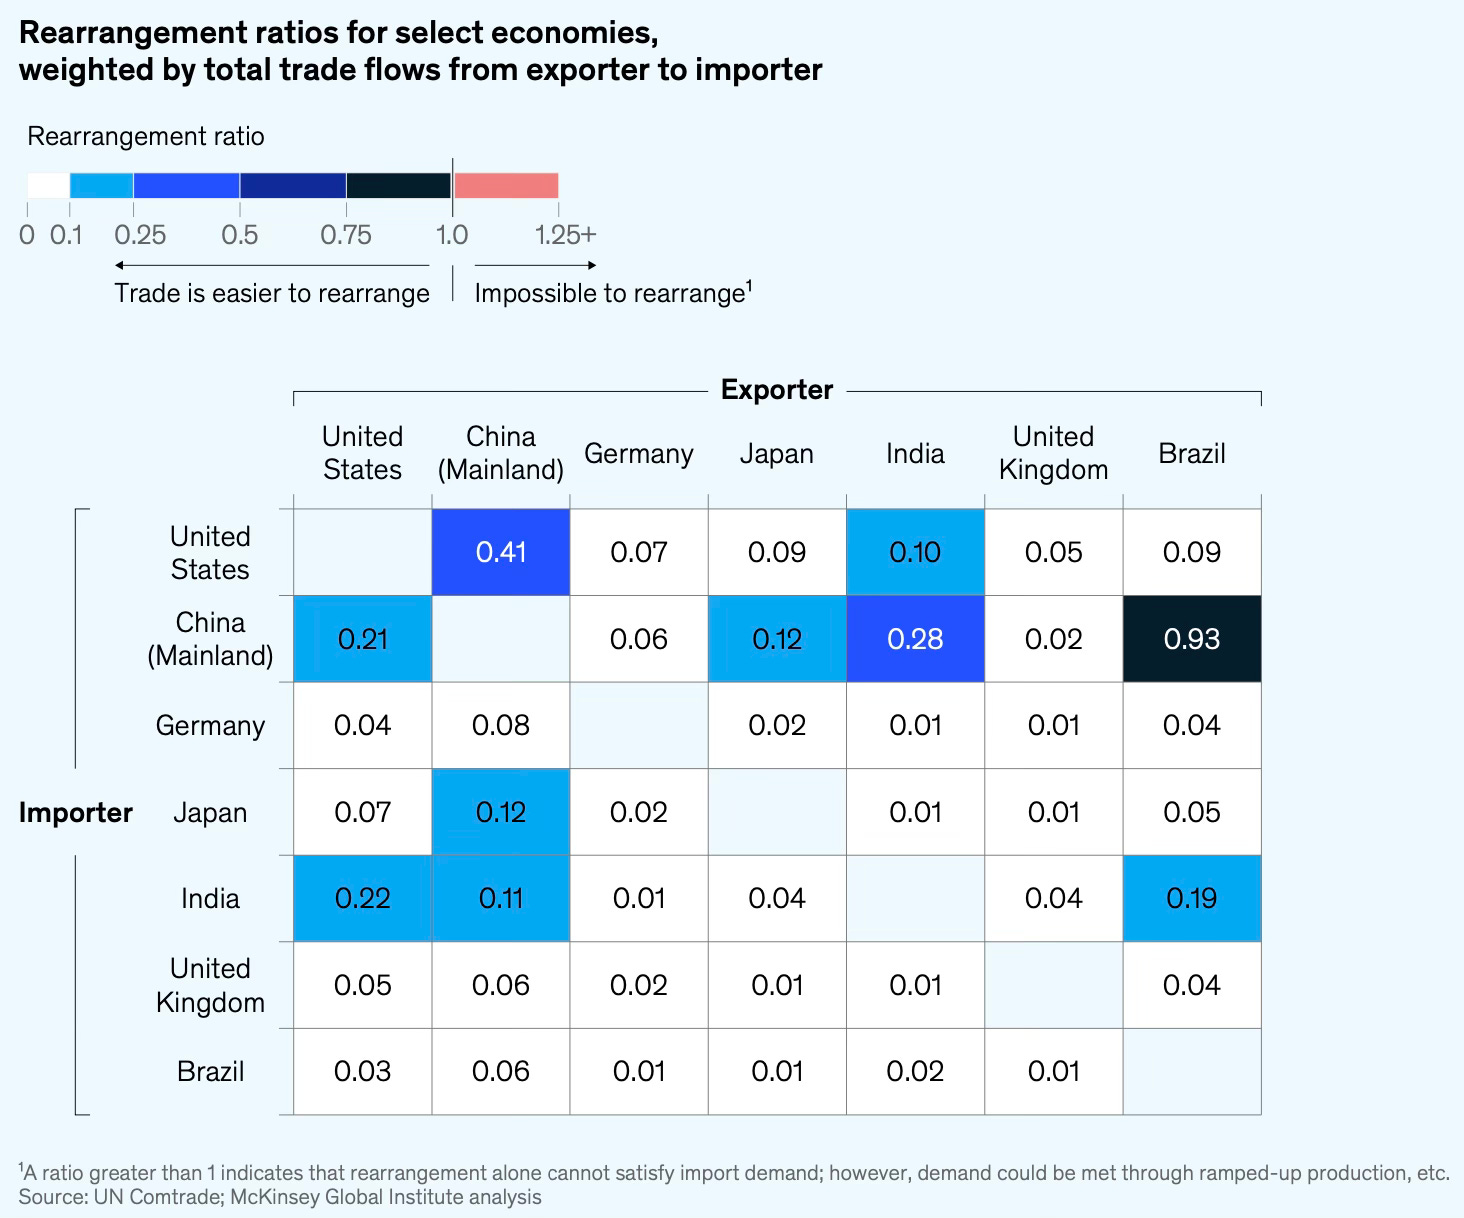
The China Brazil-rearrangement ratio is highest, dominated by China’s massive $40 billion imports of soybeans from Brazil. This dwarfs the potentially available soy export market, which is about $20 billion, because other exporters already ship most of their soybeans to China. Beyond US–China ratios, other rearrangement ratios greater than 0.2 are China–India and India–US. Often, these midrange ratios are driven by acute points of reliance for specific products. For India’s exports to China, for example, the higher ratio is driven by products like castor oil. India is the largest global supplier of castor oil, and castor oil is one of China’s largest imports from India, used mainly as a building block in its chemical industry. China gets more than 99 percent of its castor oil imports from India, and the rearrangement ratio for this product is correspondingly high. 

Interestingly, Chinese imports have among the highest rearrangement ratios with its trade partners - with Brazil, India, the US, and Japan - making the country dependent on those countries in some products. This does point to the leverage those countries might have with their exports to China. Apart from Brazil, India and the US appear to have substantial leverage. Does castor oil provide India with any meaningful leverage over China? What’s the leverage that the US might want to deploy against the Chinese?

For India, too, the graphic points to a high risk concentration in its exports and imports. In a geopolitically fraught world, governments ought to take cognisance of these trends and step in to strategically realign them. 

The report calculates the ratio for all US imports from China to identify the likely product pain points.

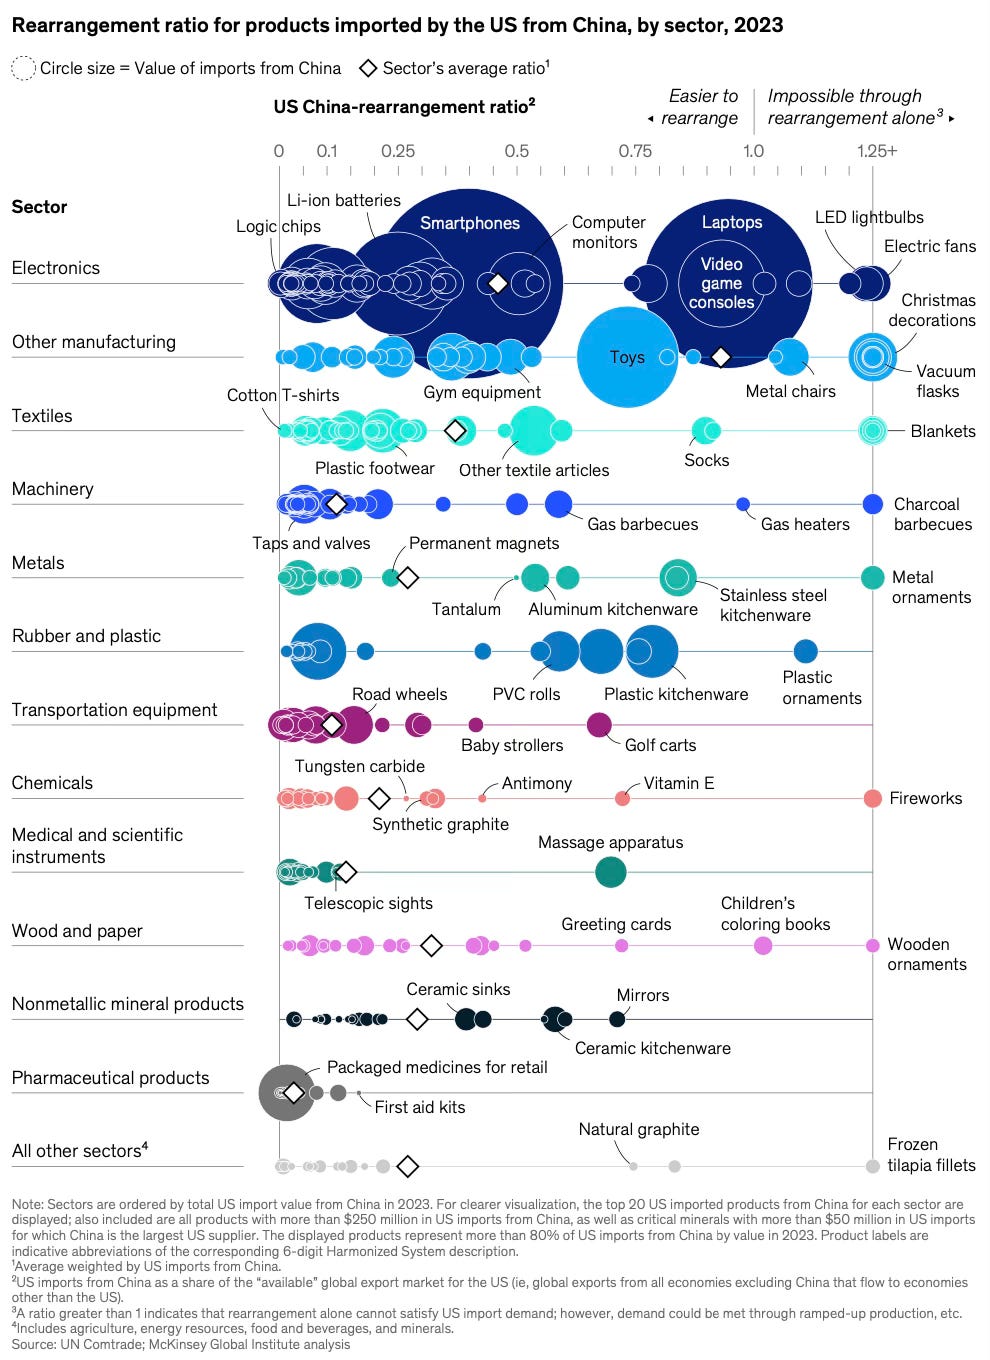
The report finds that while 61% of US business input imports from China have ratios below 10% (thereby making substitution easy), the ratio falls to 35% for product imports. It’s in capital goods that 37% of imports have ratio between 0.75 and 1. 

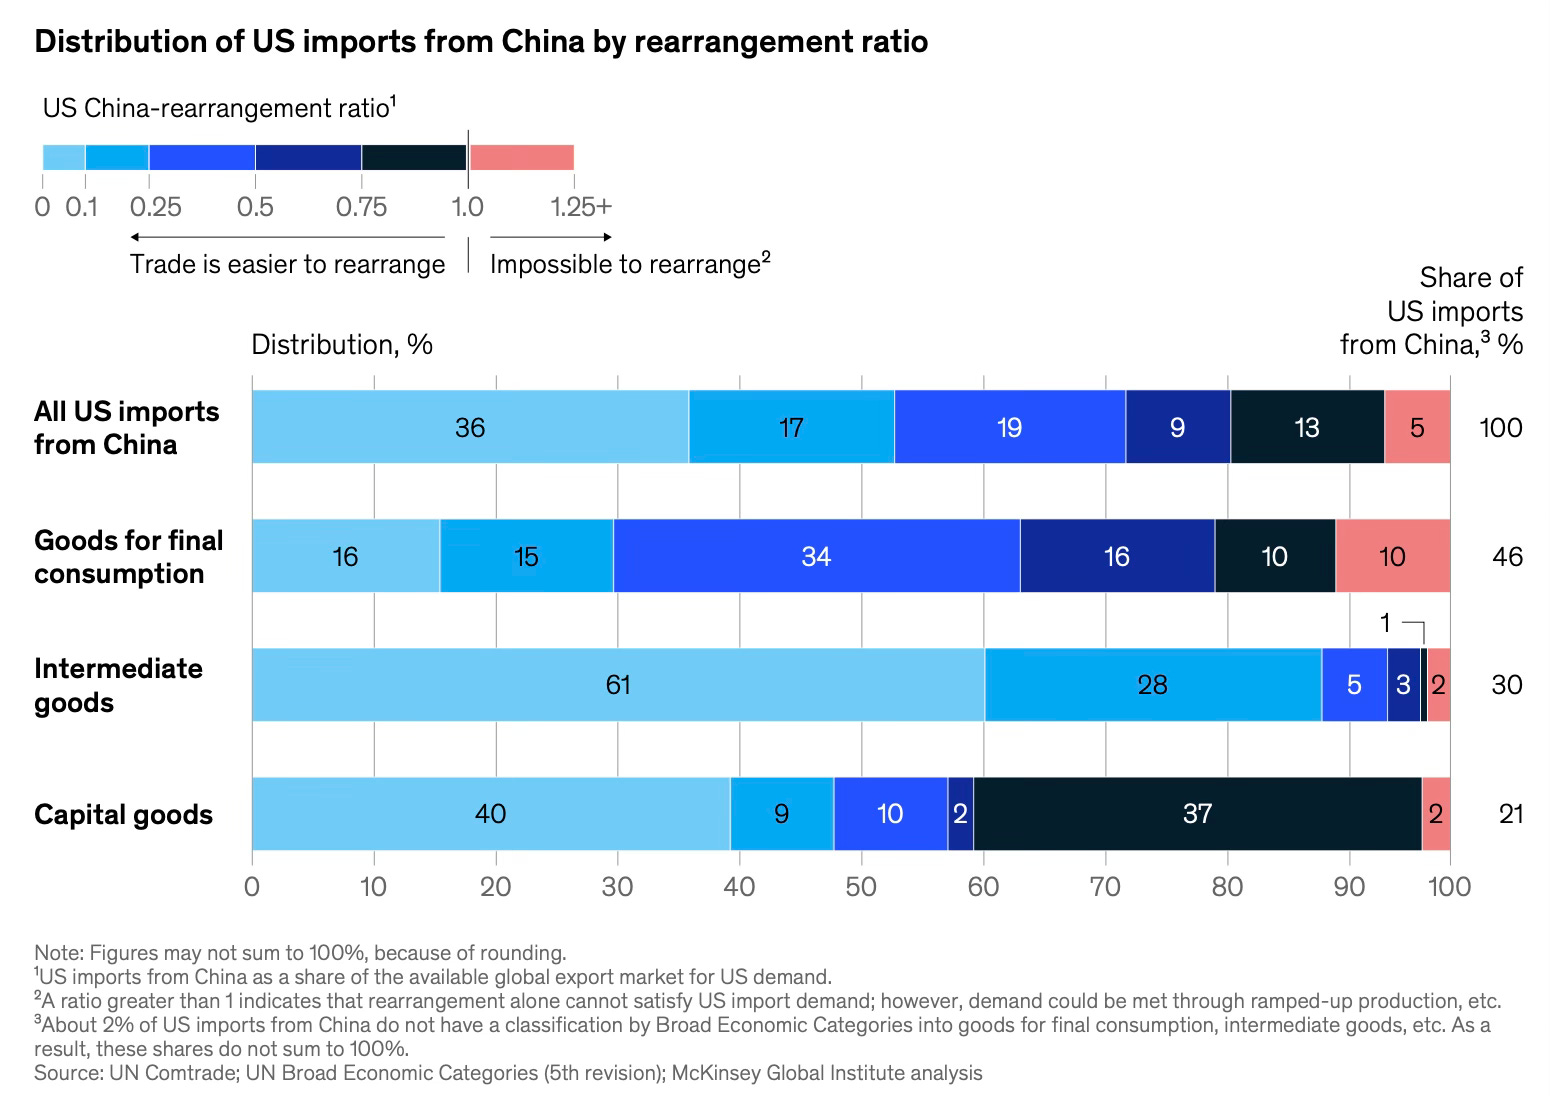
In contrast, China’s imports from the US are easier to substitute, since they are also widely exported by others. 

The report finds that Europe will become the fulcrum for any trade rearrangement. 

Across nine varied simulations, European imports from China and exports to the United States both go up by nearly $200 billion. As intra-European trade shifts to the United States, it leaves holes filled by increased Chinese exports—assuming Europe does not choose to alter its own trade policies. Others will be affected, too: exports to the United States from as many as 70 countries may increase by more than 10 percent.

new paper by ECB economists sheds light on the extent of dependency of European and US economies on Chinese imports. They use novel quantitative metrics like indices on export similarity, partner similarity, and ideal point distance. 

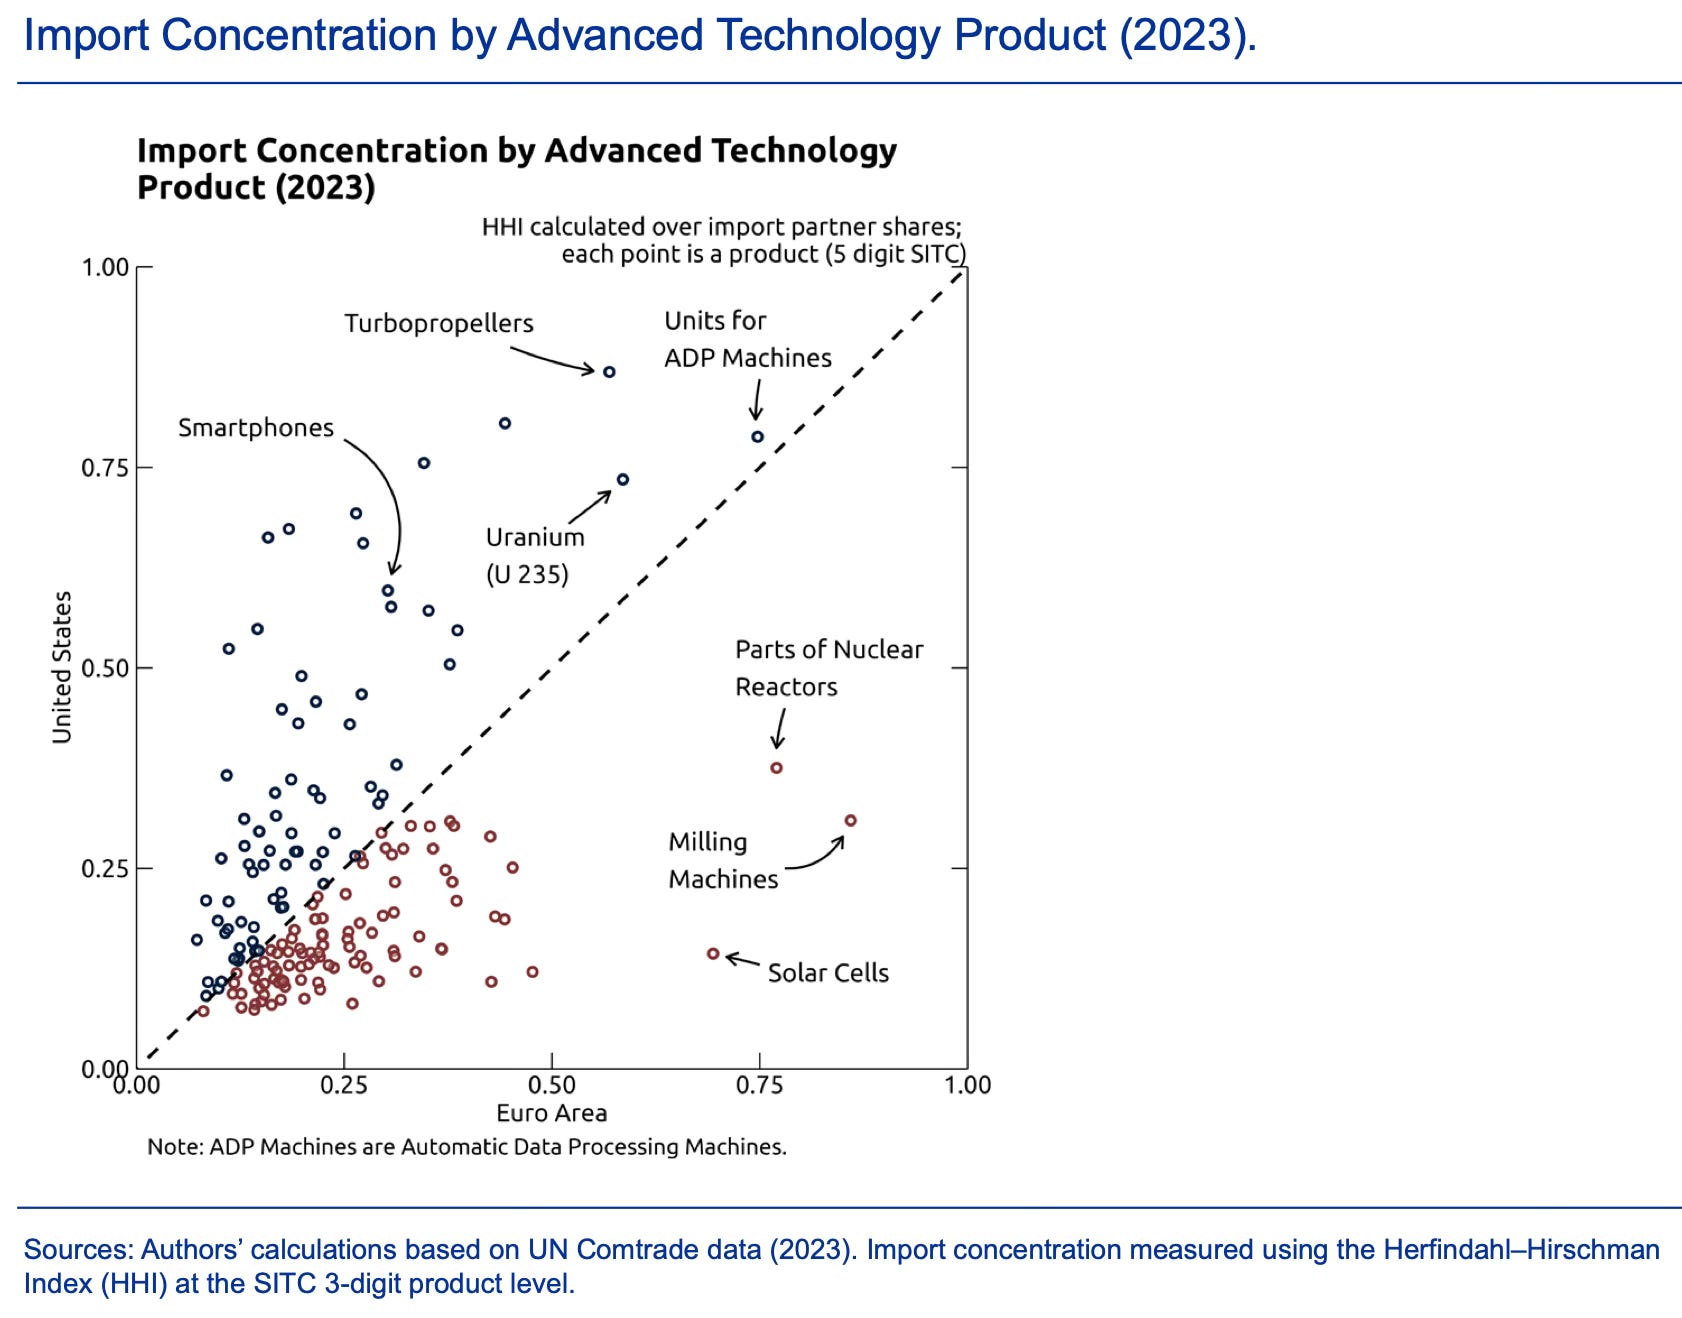
This shows the US and EU’s import concentration dependence on geopolitically distant countries like China, Russia, and Iran for a few advanced technology products. 

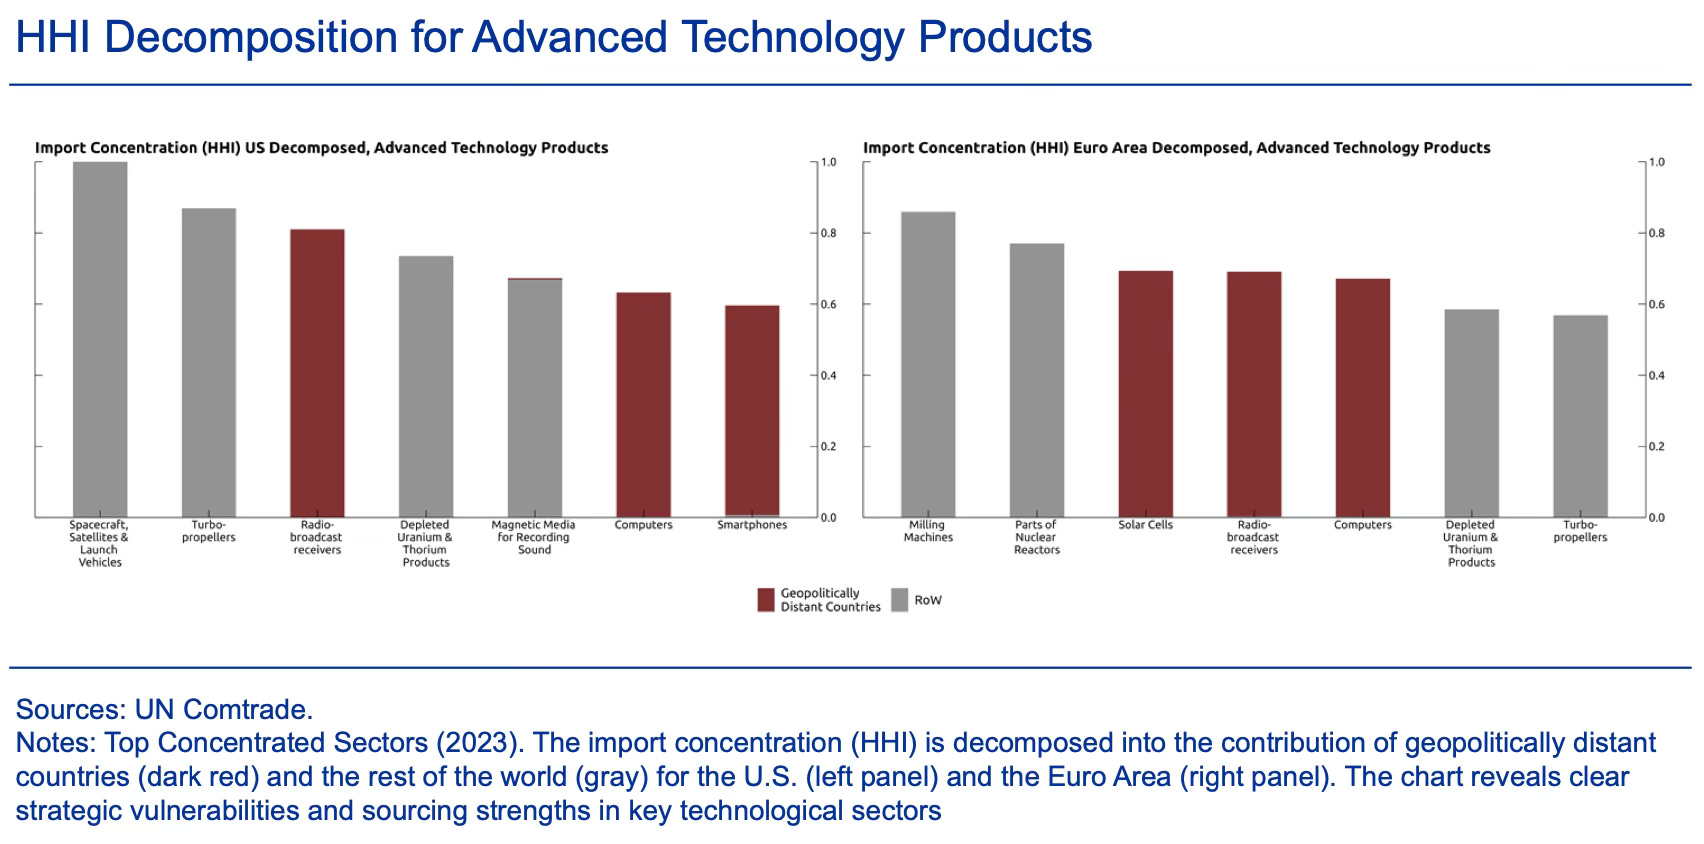
The authors analyzed import concentration in the US and the Euro Area using the Herfindahl–Hirschman Index (HHI) to identify supply chain risks. This shows their import concentration dependence on all advanced technology products.

This shows the general import concentration dependence risk for all products.

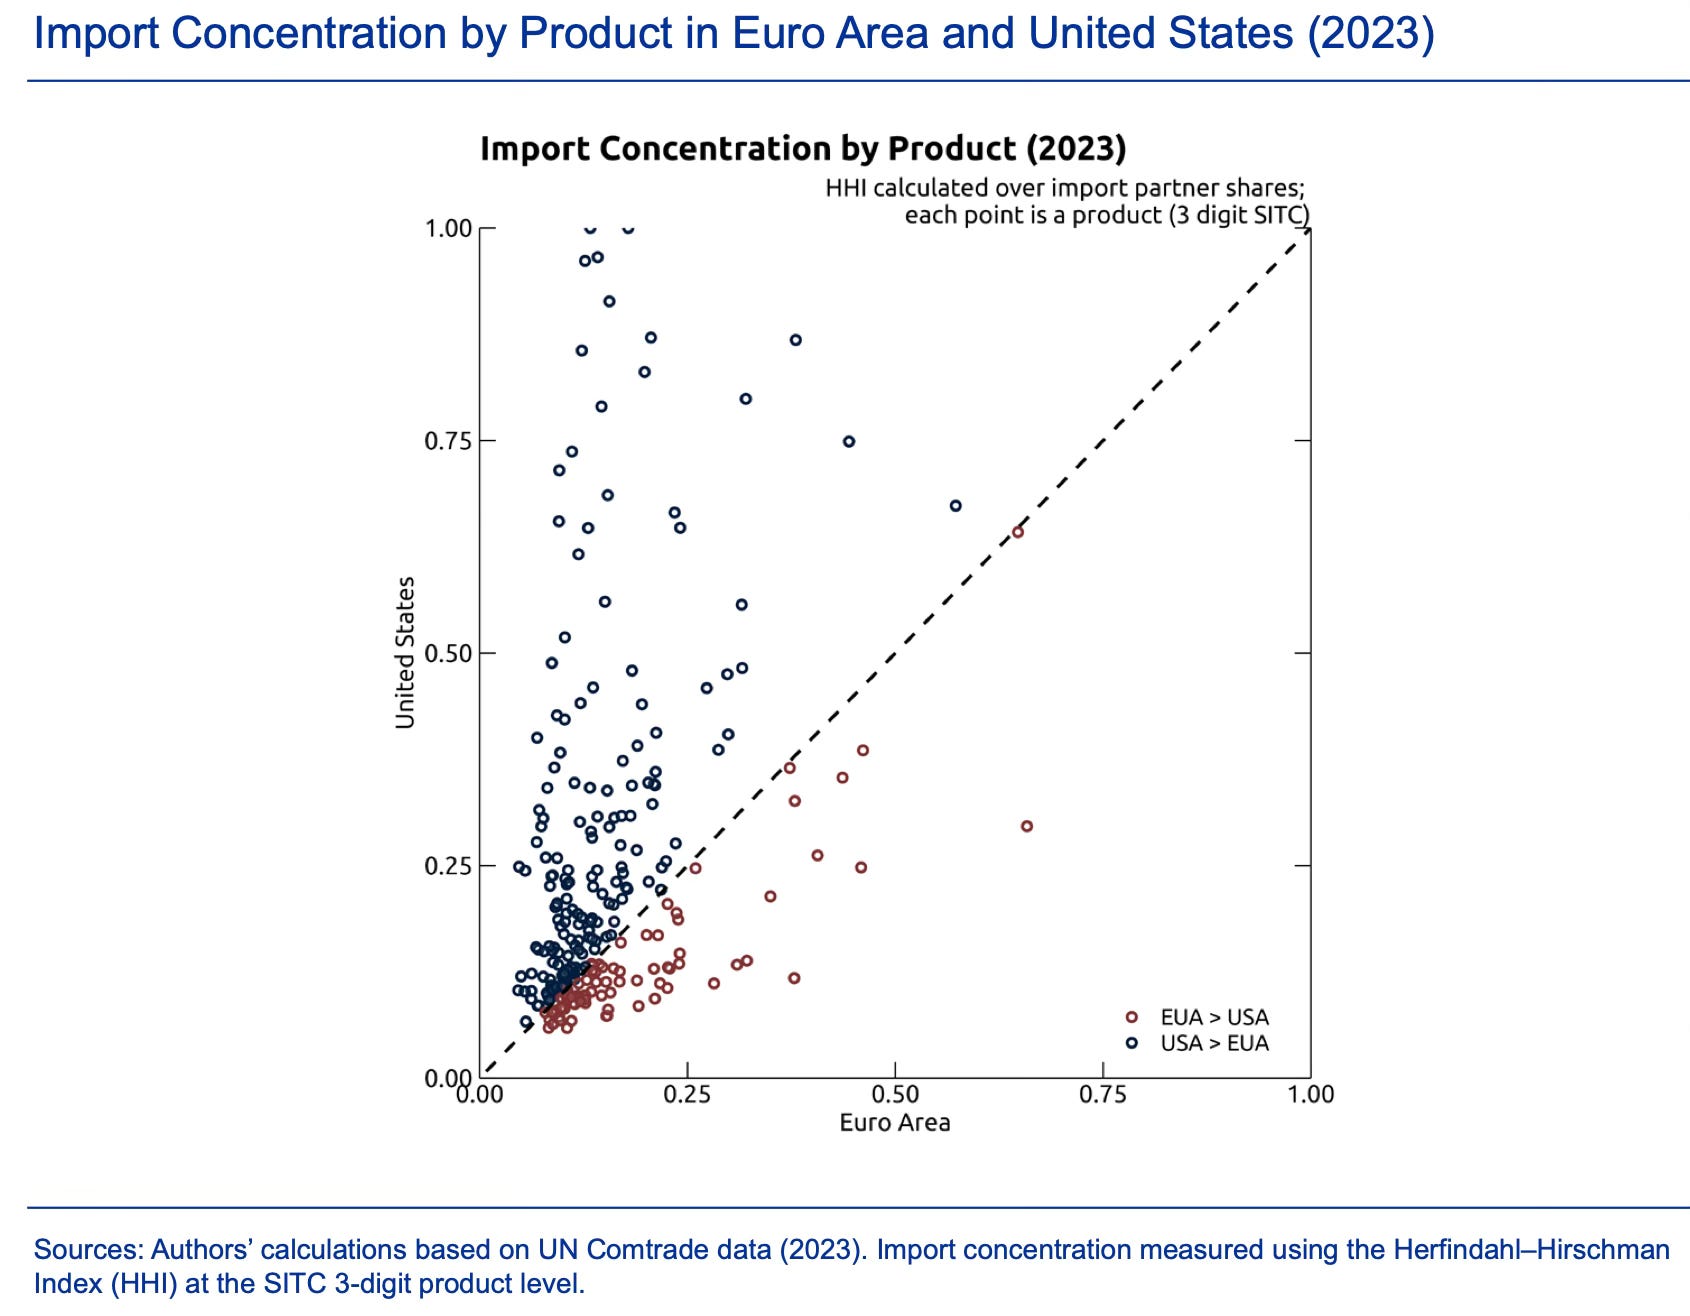
Clearly, the US is much more dependent than EU in terms of a sigificant share of their imports on several products coming from geopolitically distant countries across both all products in general and advanced technology products in particular. 

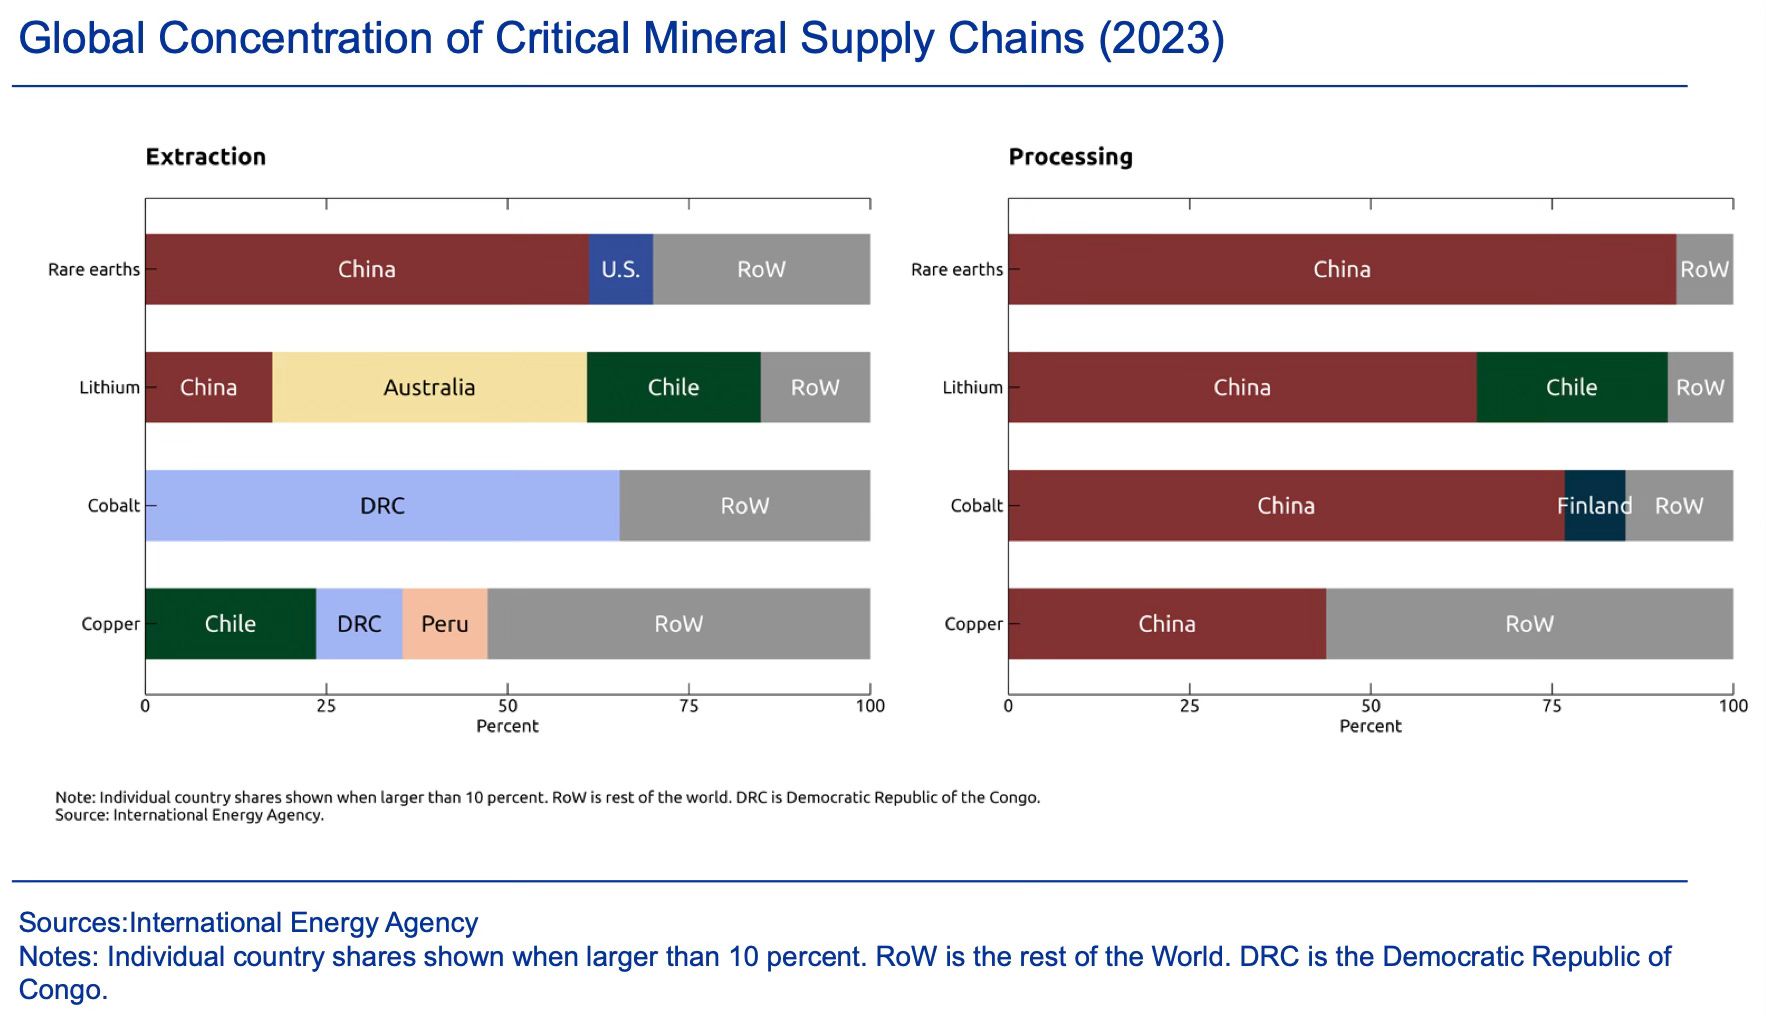
Critical minerals, specifically in their processing, are only the most salient example of this dependence. 

The paper shows that in terms of general trade exposure, both the EU and the US have had increasing manufacturing trade exposure to these countries since 1996.

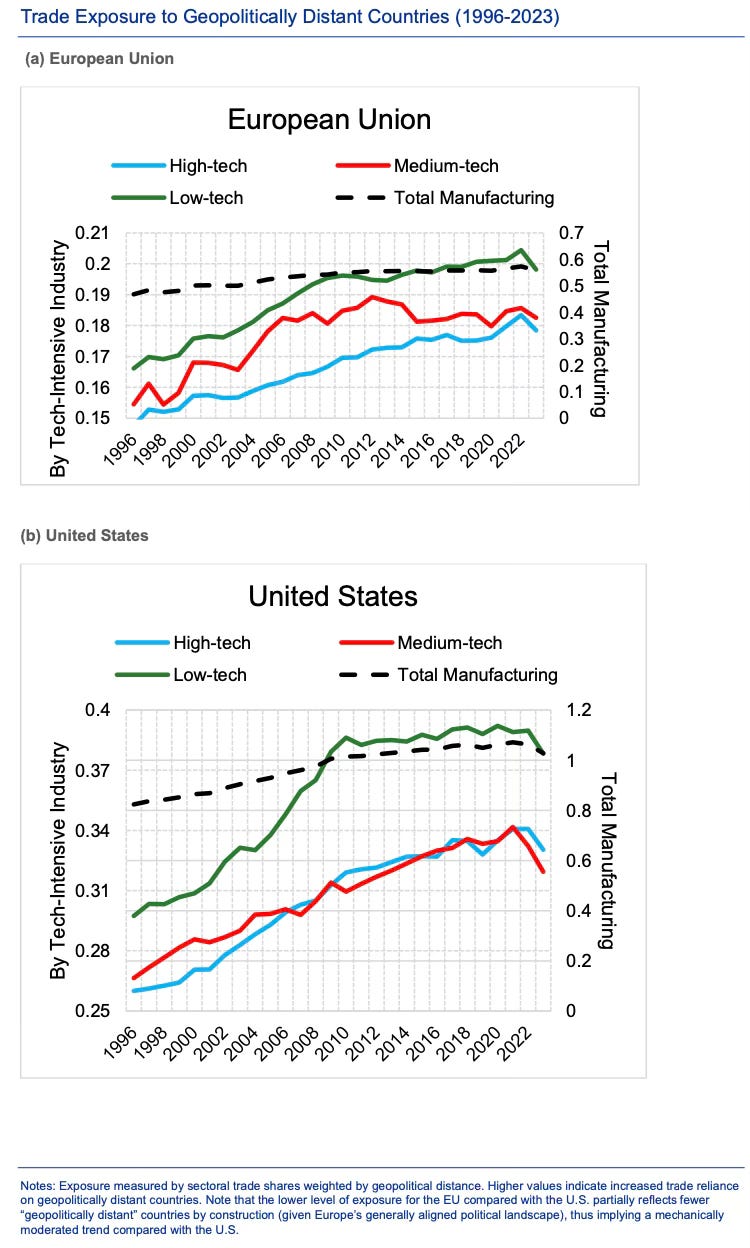
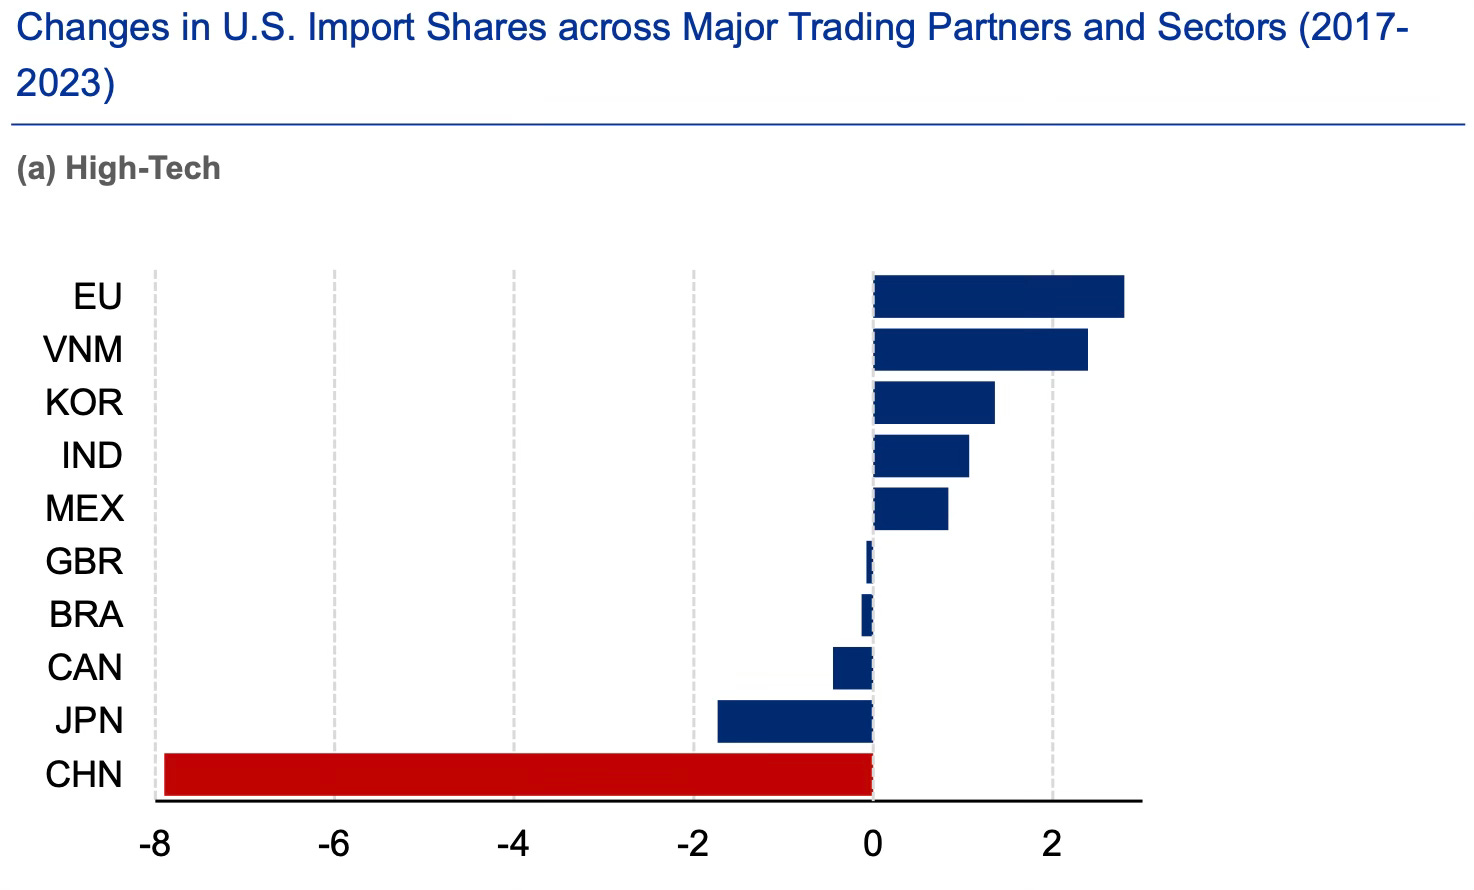
It’s interesting that while the Chinese share of high technology and all manufacturing products for the US has declined the most and significantly so since 2017 after President Trump started pursuing restrictions…

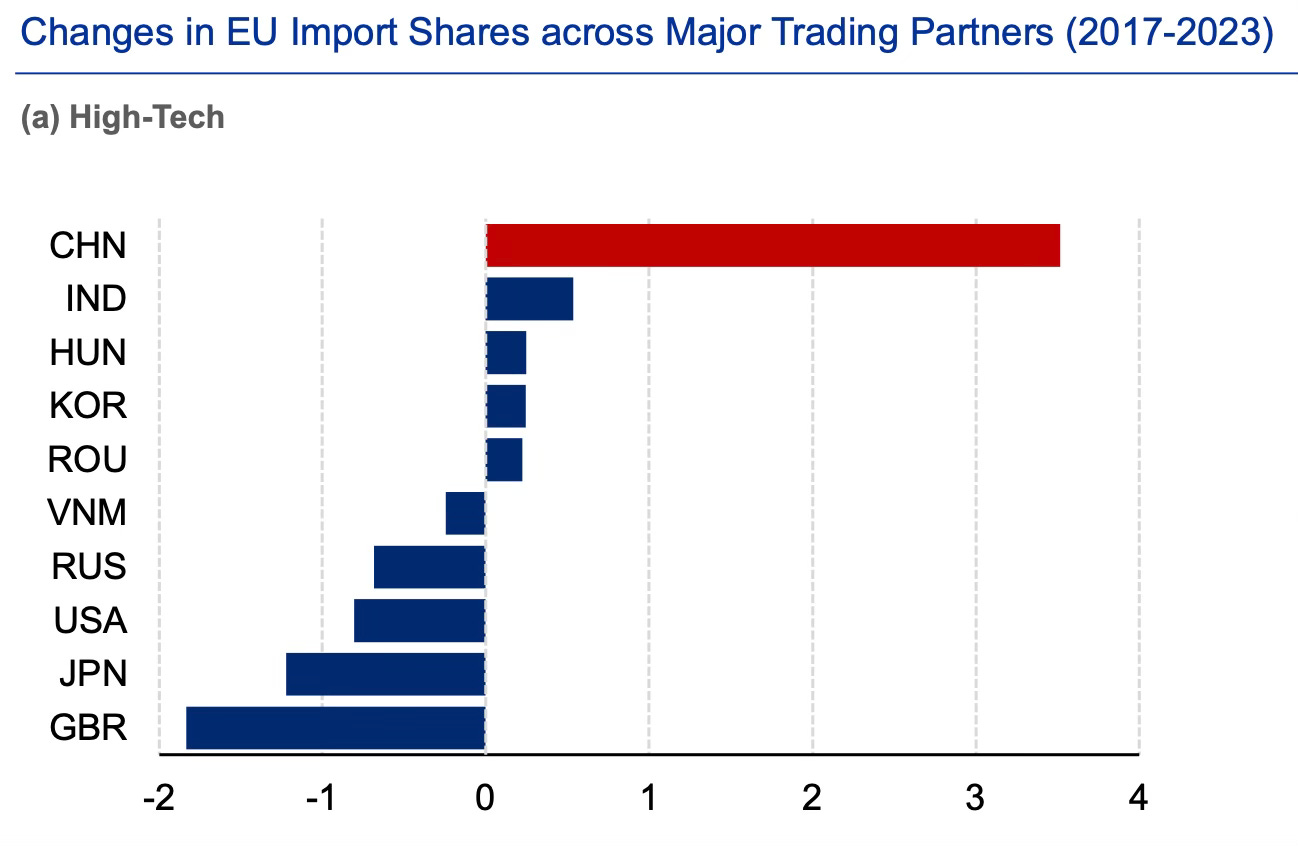
… the same has increased and significantly so for the EU.

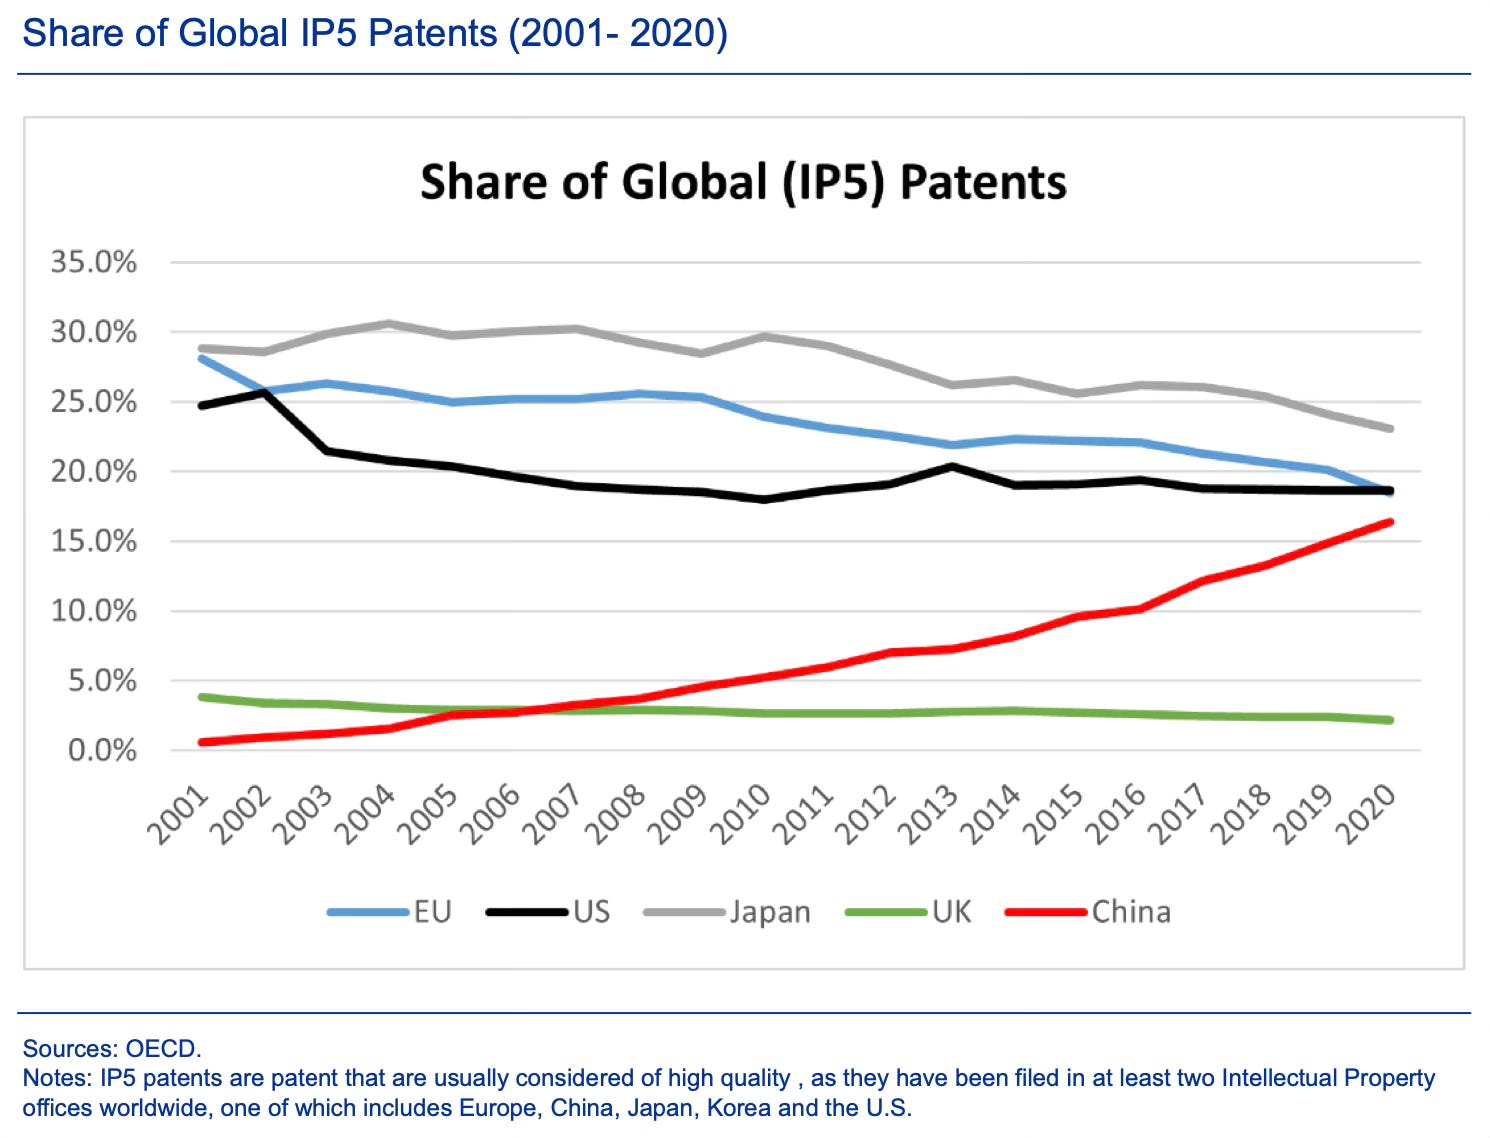
It’s interesting that each of the US, Japan, and EU still exceeds China in their shares of global IP5 patents, which are filed in atleast two jurisdictions and are considered of higher quality. 

The paper uses the Global Trade Alert (GTA) database to look at all the strategic and distorting policy interventions used by EU members individually and collectively as the EU to address the geoeconomic risks and promote their domestic manufacturing industries. It finds a pronounced shift towards EU collective action since 2018. 

This evolution is largely a strategic response to the technological ascension of China and escalating global trade tensions, signaling a deliberate move away from fragmented national policies towards cohesive, unified EU strategies. The introduction and deployment of critical policy tools such as the Anti-Coercion Instrument (ACI) and the Carbon Border Adjustment Mechanism (CBAM) epitomize this strategic reorientation aimed at managing the vulnerabilities arising from selective decoupling and heightened competition with China.

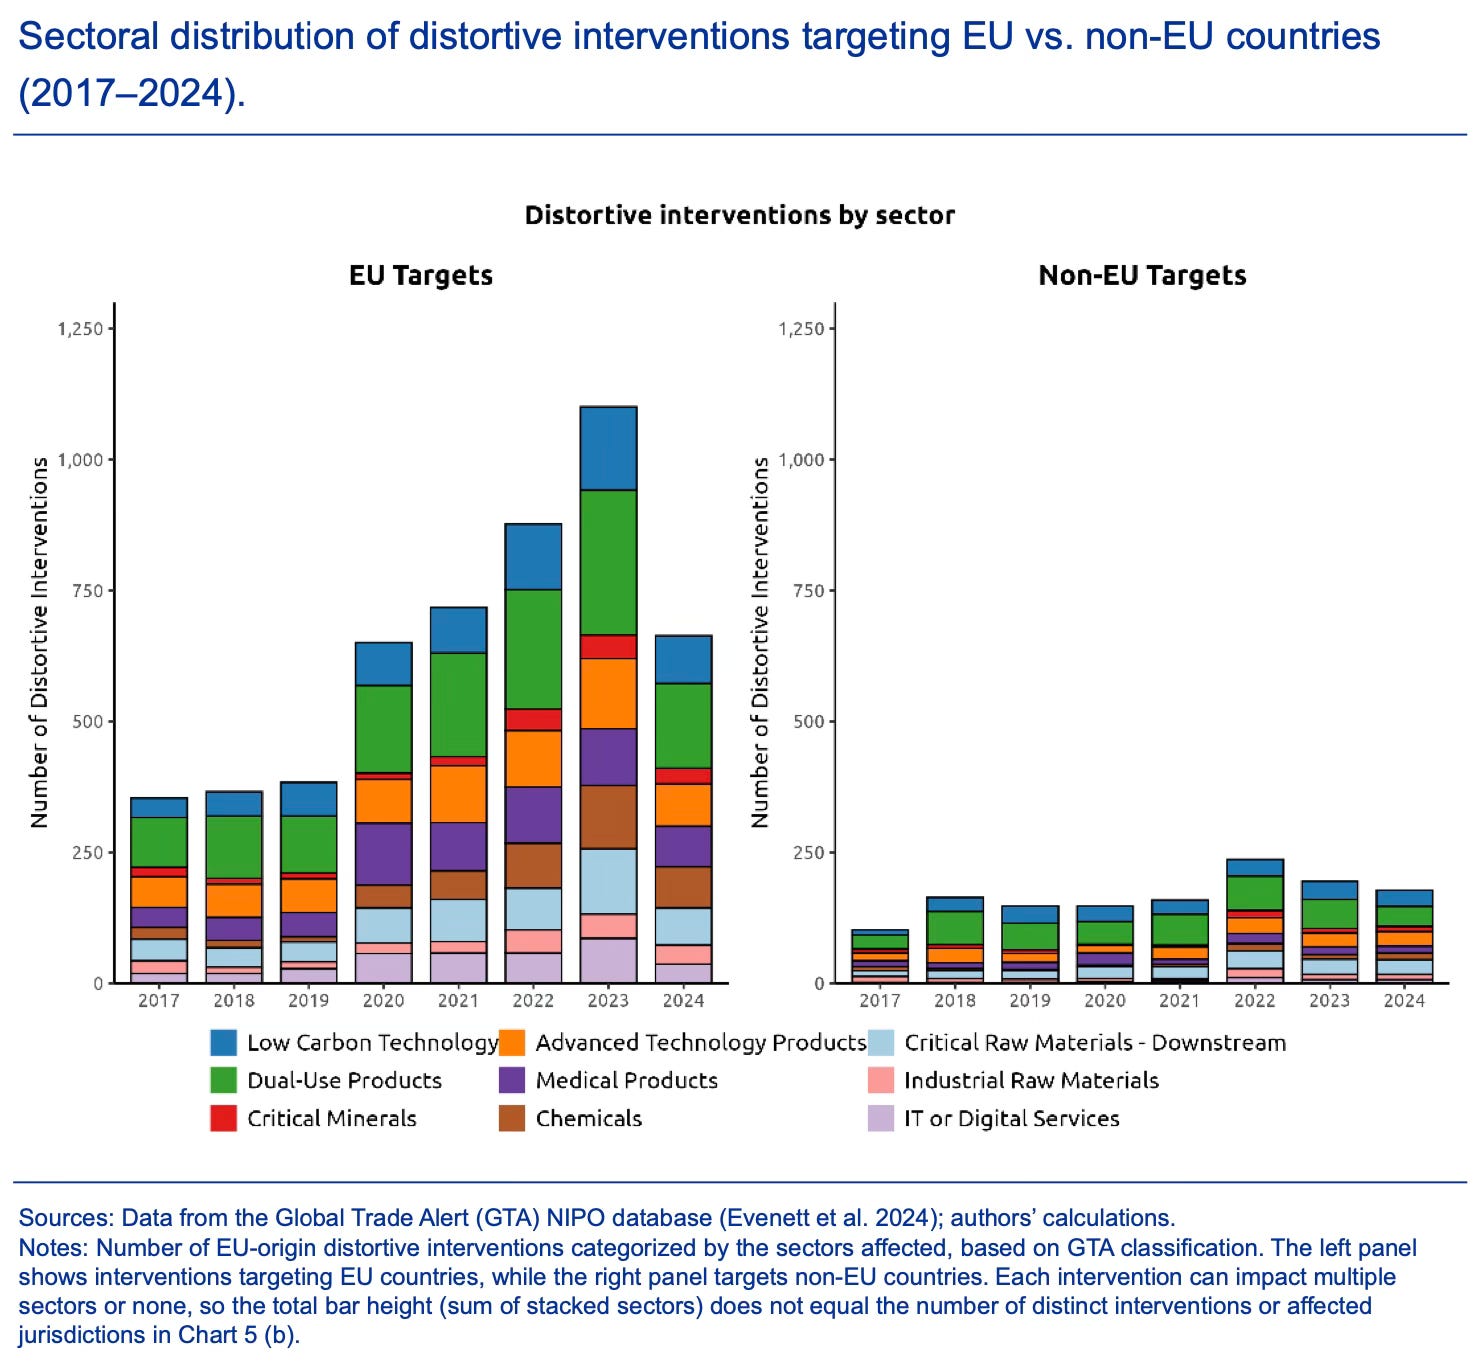
This is the sectoral distribution of such interventions by EU. The first panel mistakenly refers to EU targets, but covers those targeting non-EU targets. 

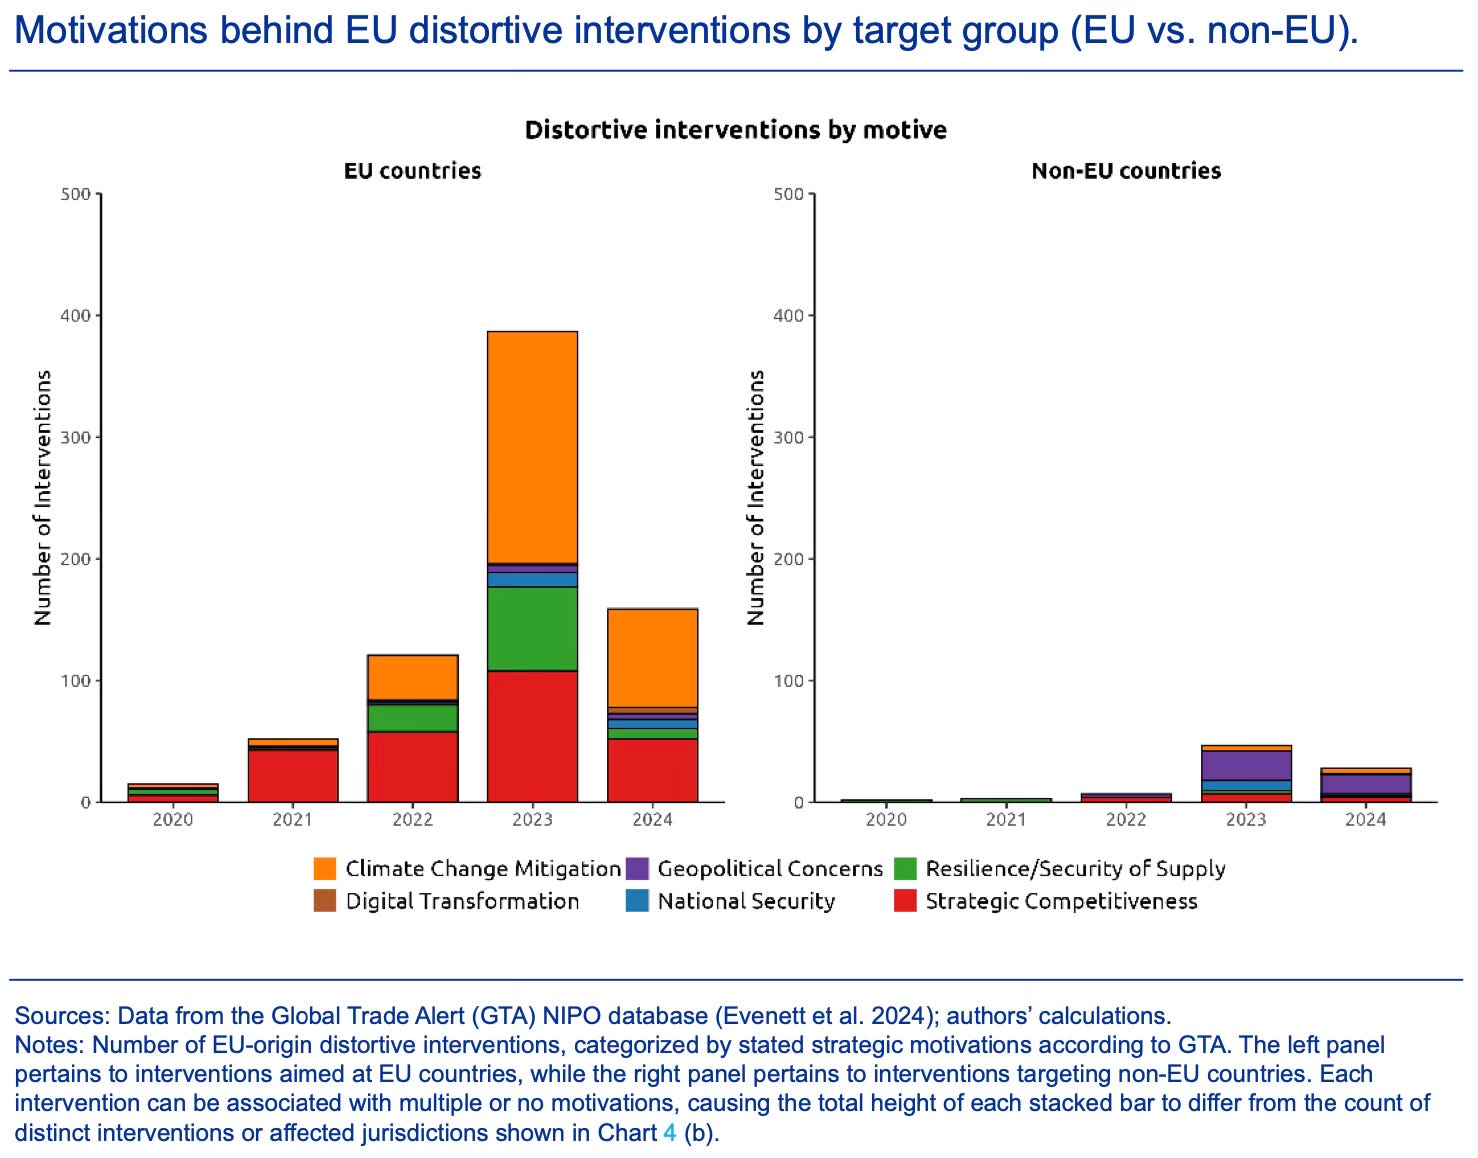
This captures the motivations behind such interventions by EU (again the panels are reversed.).

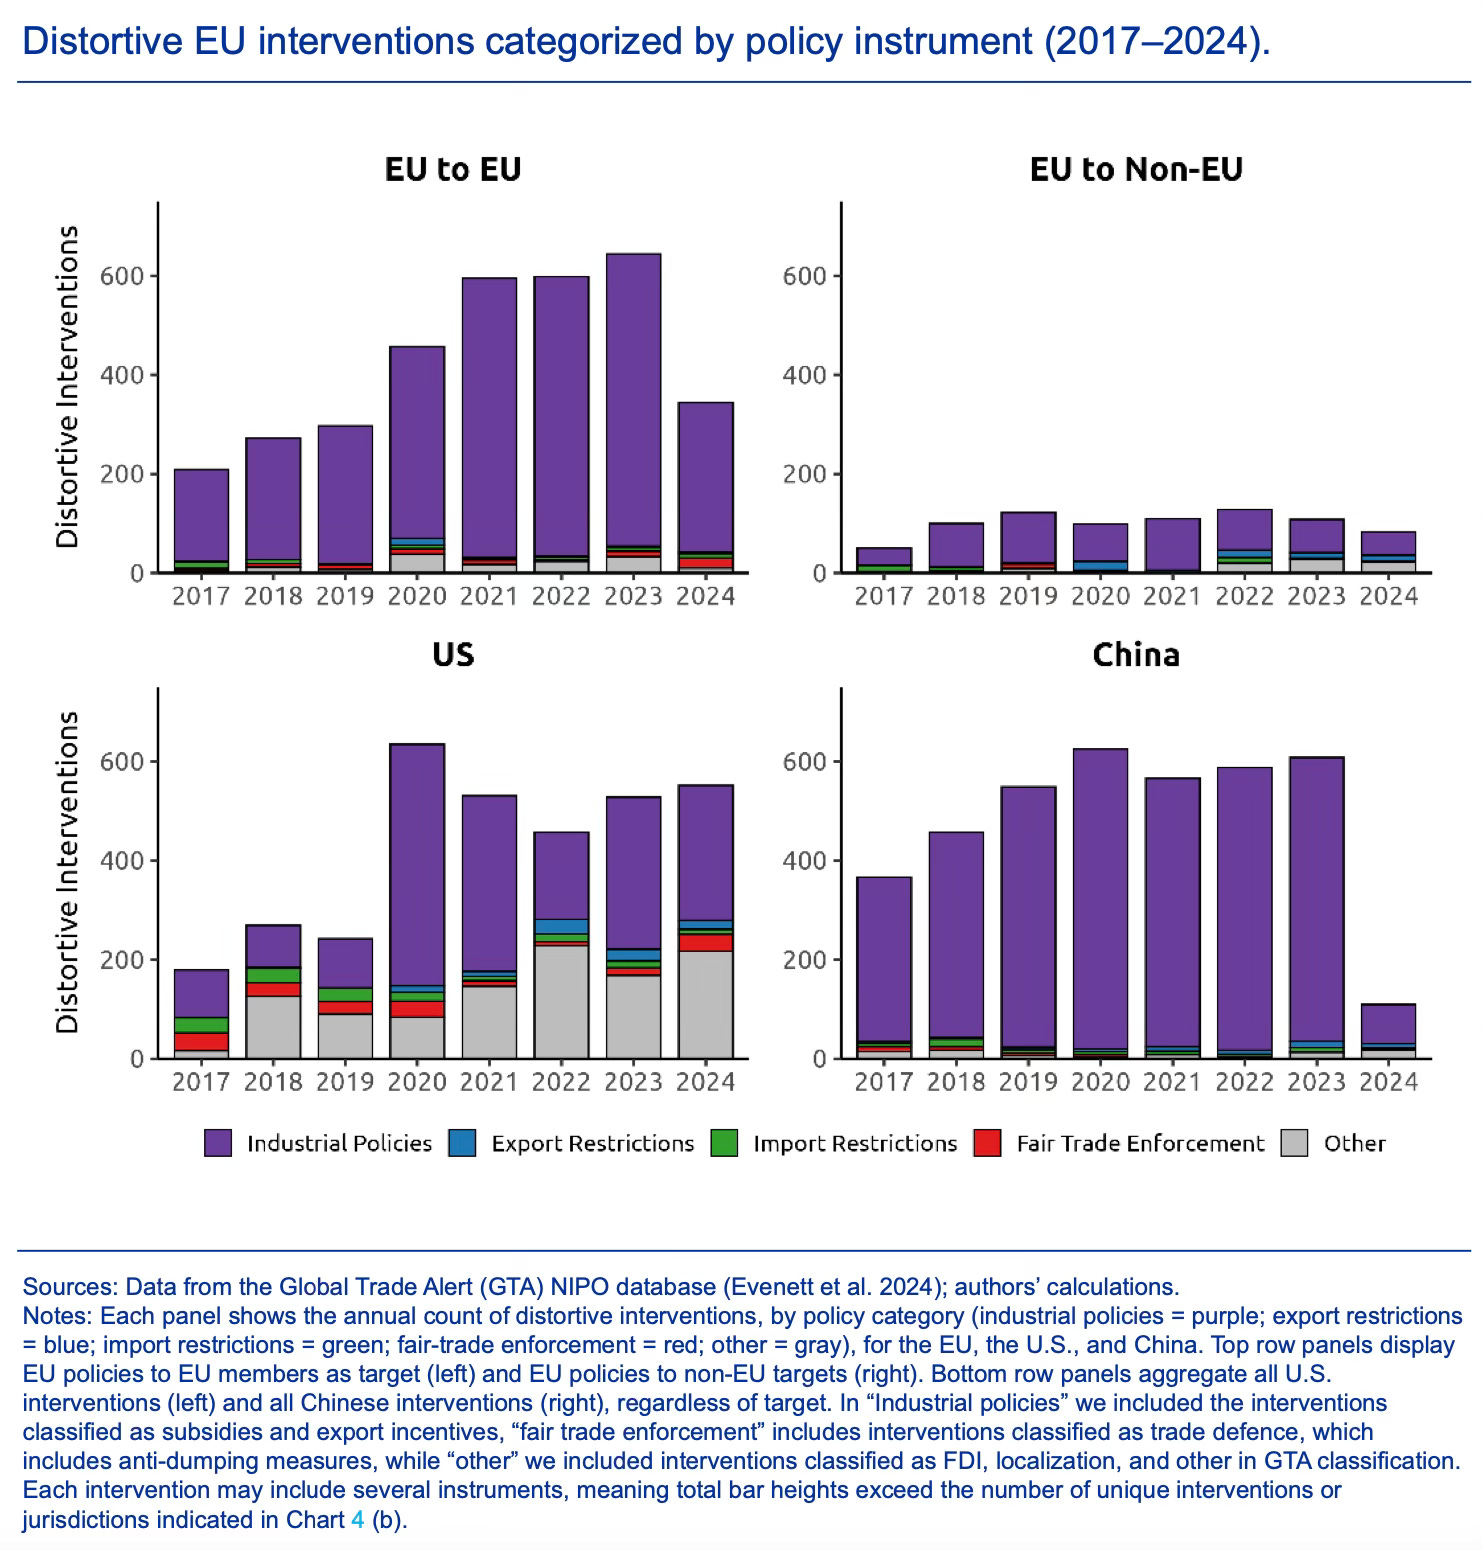
Finally, this captures policy instrument-wise interventions for EU, US and China. 

There’s a global convergence in responding to the China problem and it rapidly growing in speed and scope. Unfortunately, Donald Trump’s tariffs are clearly muddying the waters and inadvertently may be helping China mitigate the consequences of these responses. As an illustration, the Trump tariffs on India would not only slow down Apple’s diversification from China, but also deter other prospective investors seeking to diversify into arguably the largest opportunities outside China. 

Monday, July 28, 2025

Process discovery as a rationale for RCTs?

I have blogged on multiple occasions (see this paper), highlighting the point that the most important thing in development is not the WHAT to do, but the HOW of implementing what’s already known. 

Unfortunately, the mainstream international development discourse and funders are obsessed with the former, almost to the exclusion of the latter. The headline focus on ideas and innovations as opposed to state capabilities is only an illustration. 

Randomised Control Trials (RCTs) are a good example. It informs us about the headline efficacy of an intervention. But it tells us very little about the mechanics of implementing the intervention (in addition to the WHY of the intervention), arguably the most important reason why good ideas rarely translate to realised development outcomes. 

Consider Edtech. A government has fitted all classrooms with smart screens and established a computer laboratory with systems installed with personalised adaptive learning (PAL) software. How do we integrate digital media and its content with the physical classroom instruction across 20,000 schools, or even 100 schools?

There are several uncertain parts, even if the PAL software is mapped to the curriculum. How to effectively use the computer lab - number of hours/classes per week, sequencing of physical classroom and lab work, more than one child using a terminal, monitoring the child’s progress and appropriate follow-up, etc.? Similarly, how to effectively use the smart screen - pedagogy that toggles back and forth between using the blackboard and the digital content, which content to use where and when, how to deliver content effectively, and the general felicity of the teacher in intermediating the digital medium and its contents. See more here

The efficacy of these Edtech interventions depends on getting these details right. I’ll define this implementation challenge as one of process discovery. It is the mapping of the details of the processes that increases the likelihood of successful implementation. 

The process discovery maps provide the blueprints that can be used by frontline officials to implement the respective programs. They would be the default or Minimum Viable Product (MVP) for the implementation of programs. These process discovery maps can be simplified and made as user-friendly as possible to enable their practical utility. Interested officials will start with the MVP and improve it to suit their contexts and styles. 

The headline efficacy evaluation RCT of development interventions is an overrated, even wasteful, pursuit. Did anybody in the world of practice of education pedagogy doubt the efficacy of software like PAL, if implemented effectively, as to require an expensive and long-drawn RCT? The main outcome from these RCTs is the publication of some papers and the burnishing of academic credentials. 

The World Bank and other donors have now implemented tens of RCTs involving Edtech solutions. While there’s a rich library of evidence on the efficacy of Edtech solutions when implemented effectively in pilots, there’s very little by way of process discovery maps about the HOW of its implementation. 

The same could apply to the implementation of teaching at right level, youth skilling programs, maternal and child health tracking software applications, interventions to improve public health or nutrition, measures to increase effectiveness of health insurance, use of body cameras by police and hot sport policing, adoption of better management techniques by SMEs to improve productivity, use of Dashboards by officials to monitor and follow up on programs, provision of information to improve farm productivity, etc. 

Like with the Edtech example above, in all these cases, I’m not sure about the value proposition (to the practitioners in governments and other implementers) that comes with just an efficacy evaluation. Who would dispute that if done well, all of them would be efficacious, albeit in varying degrees? The challenge is to do well at scale

In these circumstances, if donors still wish to support RCTs, here is a suitable compromise. By all means, support the RCT, but use the opportunity to also prioritise the creation of process discovery maps. They derisk processes and can serve as a template to guide the scale implementation by large systems in business-as-usual environments. 

This can create the incentives for the emergence of process discovery maps along with efficacy evidence. The researchers get to publish papers, the governments get detailed implementation templates, and donors get both efficacy accountability and contribute to effective scaling. 

As a rough thumb rule for donors, how about mandating that every efficacy evaluation RCT also have a process discovery map, wherever possible?

Saturday, July 26, 2025

Weekend reading links

1. Impressive cost reduction in space technologies.

In the past 15 years, rocket launch costs have dropped from $50,000 per kilogramme to under $2,000. They are expected to dip below $200/kg with Starship — a reusable, heavy-lift launch vehicle being developed by SpaceX.

This is a summary of the opportunities presented by the space economy.

As a factory floor, space offers a set of unique properties. Microgravity assists new assembling habitats that may enable breakthroughs. Pharmaceutical companies have studied protein crystallisation on the International Space Station... Certain alloys can also only be created in low-gravity environments while orbital solar panels can collect energy 24/7, unaffected by weather or nightfall. These could be the next leap in clean energy... The infrastructure that we build in orbit can directly benefit Earth. Space-manufactured semiconductors can power more efficient data centres. Orbital pharmaceuticals could treat previously incurable diseases. Space-based solar panels can provide clean energy... Data companies are training AI on satellite imagery. Hedge funds use this information for commodity trading while logistics companies optimise routes. Companies can use the data provided from satellite imagery to predict retail footfall, agricultural yields, subsurface water location and supply chain disruptions. US based start-up Locus Lock is producing satellite-enabled GPS receivers that maintain ultra-precise accuracy even in compromised environments — critical for autonomous vehicles in dense cities, military operations in contested spaces, and orbital spacecraft navigation.

2. Andy Haldane has a scathing description of the legacy of "independent" central bankers. 

Unquestionably, we are in an era of fiscal laxity. Fiscal deficits across the G7 currently average around 6 per cent of GDP. These countries have collectively failed to run a fiscal surplus this century. That has caused government debt across the G7 to rise well in excess of 100 per cent of GDP, its highest for three-quarters of a century. This is expected to worsen further due to the effects of population ageing, climate change and President Donald Trump’s flagship “big, beautiful bill”. Whisper it quietly, but central banks have played an important supporting role during this era of fiscal laxity. Their direct purchases of government debt — quantitative easing — peaked at well over $10tn, around a third of the outstanding stock at the time. This was monetary financing in all but name. In the immediate aftermath of the global financial crisis, however, such measures were justifiable in preventing an inflation undershoot. Later-stage QE, including purchases made in response to Covid-19, is harder to justify. With fiscal policy highly expansionary, QE’s primary purpose was to placate fretful bond markets rather than boost inflation. In doing so, central banks’ holdings of government debt rose to approaching half of the outstanding stock in the UK and Japan, almost a third in the Eurozone and a quarter in the US. This was a mild, backdoor form of fiscal dominance.

The high deficits and rising debts creates incentives for more fiscal dominance.

In recent criticism of the Federal Reserve, Trump put a precise estimate on the size and source of the benefits from lower rates — $360bn a year in reduced government refinancing costs per percentage point. This signals a far stronger form of front-door fiscal dominance. Because central banks primarily affect short-term interest rates, the risk is most acute when government debt maturities are short and shortening. In the US, two-thirds of government debt outstanding is now under a five-year maturity. Last year, around a third of the debt issued was under a one-year maturity. These patterns are being mirrored internationally. UK government debt has a weighted average maturity of over 14 years. But that too has been falling, with forecast debt issuance averaging a nine-year maturity. The tilt to short-dated issuance has also been seen in Canada, Germany, France and other OECD countries. More than 40 per cent of the OECD’s $50tn-plus in outstanding sovereign debt will need to be refinanced in the next three years. In the face of steepening yield curves, these debt strategies make fiscal sense.

3. Tej Parikh has two graphics on how disconnected the US equity markets have become from its economy.

4. Where's India's version of Scale within its startup ecosystem?
Meta has invested $15bn in Scale AI, a data labelling start-up that claims just 900 employees. Scale’s 28-year-old chief executive, Alexandr Wang, will take up a job at a new Meta lab devoted to creating AI “superintelligence”... Scale AI is both a talent and a data play. The company’s main business is providing high-quality annotated data for training AI models. Now that the big AI companies have scraped most of the internet, Scale’s labelling work can help them improve the quality of their models.

With an increasing number of Western multinationals shifting their core data-related back office functions to India through Global Capability Centres (GCCs), there's a golden opportunity for India to emerge as tthe software development centre of the world. This will create opportunities for startups to come up with solutions like that of Scale. 

5. China's quiet infiltration of the UN system.

A study by Shing-hon Lam of the University of California and Courtney J Fung of Macquarie University found China had nearly 1,600 UN staff in 2022 compared with more than 5,000 for the US, though it is building new staff pipelines through internships... This year, China pledged $500mn to the WHO over five years. Part of this voluntary funding is expected to involve secondment opportunities for Chinese technical and advisory staff... While the ITU is currently led by American Doreen Bogdan-Martin, her predecessor was China’s Houlin Zhao. “The director-general is now American but China put — mostly African — people close to China in high positions, such as the current director of the Development Bureau,” the EU official added. Cosmas Luckyson Zavazava, formerly head of Zimbabwe’s telecommunications agency, is now director of the ITU’s Telecommunication Development Bureau. According to the EU official, he was strongly backed by China, which has close ties with Zimbabwe, including Huawei-led telecoms infrastructure projects.

6.  Important distinction between ICE and EVs.

EVs are fundamentally different from internal combustion engine (ICE)-based cars in terms of where the value is captured. The production process for ICE cars is far more disaggregated, with value — and thus profits — being earned at various places along the supply chain. For EVs, value addition is more concentrated, for example, in the production of batteries. This has serious implications for India’s auto-component sector.

7. Private equity funds increase reliance on continuation funds in times of sharply reduced exits. 

Buyout groups used so-called continuation funds — in which a private equity group sells assets from one of the funds they manage to a fresher fund also managed by the firm — to exit $41bn of investments in the first six months of 2025, according to a report by investment bank Jefferies. That was equal to a record 19 per cent of all sales by the industry, and 60 per cent higher than a year ago... Private equity groups sit on more than $3tn in unsold deals and are nearing four consecutive years in which they have returned only about half the cash investors traditionally expect... Continuation funds give investors the choice to roll over their investment or to cash out. For their private equity sponsors, they allow the firm to keep portfolio companies beyond the typical 10-year life of a fund, and to crystallise performance fees on the assets sold while collecting a steady stream of management fees from the new fund buying the investments.

8.  Kavitha Rao makes some good suggestions on GST reforms. This about the revenue from different rates.

In response to another question in Parliament, Minister of State for Finance Pankaj Chaudhary reported 70-75 per cent of GST collected in 2023-24 came from the 18 per cent rate while just 5-6 per cent came from the 12 per cent bracket. Further, 6-8 per cent of revenues was from the 5 per cent slab, and the highest tax slab of 28 per cent contributed 13-15 per cent last financial year... compensation cess... contributes... ₹1.44 trillion in 2023-24 and ₹1.49 trillion in 2024-25, or 7.6 per cent of net GST.

9. Profile of Viktor Orban, Prime Minister of Hungary since 2010, and the massive system of self-aggrandising crony capitalist system that has been built in the country.  

10. It's beyond imagination how the world is reacting to the genocide in Gaza, and that for 21 months of being played out on live television.

The World Food Program, an arm of the United Nations, said this week that the hunger crisis in Gaza had reached “new and astonishing levels of desperation, with a third of the population not eating for multiple days in a row.”... the number of children dying of malnutrition had risen sharply in recent days... The Gaza ministry of health has reported more than 40 hunger-related deaths this month, including 16 children, and 111 since the beginning of the war, 81 of them children... Throughout the war, U.N. agencies and independent aid groups have accused Israel of allowing far too little food into Gaza, warning of impending famine for its more than two million people... Hollow-eyed, skeletal children languish on hospital beds or are cared for by parents, who gaze helplessly at protruding ribs and shoulder blades, and emaciated limbs resembling brittle sticks. The haunting scenes are a stark contrast to the plenty that exists just a few miles away, across the borders with Israel and Egypt.

France's decision to recognise the Palestinian state will put pressure on others to follow suit. 

11. The US equity markets are on a roll, and it now remains to be seen when and how the reversal will strike. 

Backed by the Trump administration, crypto assets are clearly on a bubble.

The value of global crypto assets reached $4tn for the first time this month as speculators anticipated a deluge of money into the sector in response to new US digital asset legislation. That number again. Crypto’s achievement is astonishing given that it is devoid of intrinsic value and its contribution to the productive economy is minimal compared to that of Nvidia et al. Its chief utility appears to be to enable payments by criminals and to scammers, while gratifying the urges of gung-ho speculators. It is striking that crypto’s performance has even made gold, the traditional if volatile bolt hole for nervous money in dangerous times, look boring...

The great 18th century Mississippi bubble, initiated by the Scottish economic theorist and gambler John Law, obtained exclusive rights to develop land in French-owned Louisiana, along with monopoly rights over the French tobacco and slave trades. Law’s company even took over the collection of French taxes and management of the note issue — all with the backing of the French regent, the Duke of Orléans. Fomo fuelled the bubble until the whole edifice imploded spectacularly in 1720 amid rip-roaring inflation and spiralling government debt.

12. John Burn-Murdoch uses data from the World Happiness Report to point out that youth well-being in Anglosphere countries has been declining compared to stability in Europe. 

The share of young adults regularly experiencing stress and anger has risen sharply over the past 15 years in the US, Canada, UK, Ireland, Australia and New Zealand. But it has been largely stable elsewhere in the west, according to detailed data from the Gallup World Poll used in the report. It’s a similar story for young people’s faith in the ultimate social contract: that if you work hard you’ll be rewarded with security, stability and status. Outside the English-speaking world, confidence in this fundamental tenet of societal fairness is flat across the age spectrum. In the Anglosphere it is high only among the oldest, and in tatters among the young.

He points to a fascinating likely contributor, housing prices. 

In Germany and Spain real house prices have climbed 32 and 44 per cent respectively since 1995. In the US the equivalent figure is 85 per cent, while the UK, Ireland, Australia, New Zealand and Canada all come in north of 200 per cent. The result has been a brutal snatching away of the particularly Anglophone dream of home ownership. Rates of ownership among people aged 25-34 in English-speaking countries have slumped by between 20 and 50 percentage points over the same 30-year period.

Wednesday, July 23, 2025

Industrial policy to overcome the China problem may require market making

There were two important industrial policy decisions taken by the US government last week that underline its commitment to securing the supply chains for critical minerals. They also offer important lessons about the direction of industrial policy in general. 

In the first, the US plunged into the rare earths industrial policy by taking a direct stake in a private rare earths firm and setting a price floor for its output. 

The Pentagon last week said it had become the largest shareholder in MP Materials, operator of the Mountain Pass facility in California, which sent shockwaves through the industry and drove the company’s shares to record highs. The US government committed $400mn of direct investment in the Las Vegas-based company and guaranteed a decade-long price floor for its output at nearly double the current market rate. MP, led by founder James Litinsky, is also building a domestic magnet manufacturing facility… The arrangement is part of the White House’s drive to break the Chinese dominance of critical minerals and strengthen the domestic supply chain. It is rare for the government to make direct investments in businesses, and critics argue this deal went too far... Rare earths are vital to modern manufacturing and to the magnets used in high-tech industries, from electric cars to fighter jets. Low market prices have deterred western rare earth projects from coming online.

... the US government had overnight become the dominant “influence” in the market for the rare earth neodymium-praseodymium (NdPr oxide). The price floor for NdPr, which is used in magnets, has been set at $110 a kilogramme, almost double the current market price of about $60. The guarantee covers all the NdPr that MP would produce over 10 years… MP does not currently make magnets at commercial scale, but the US has also guaranteed to buy roughly 7,000 tonnes of magnets annually for a decade that the company would produce using its own NdPr at the as-yet unbuilt facility. Industry veterans say this volume far exceeded US defence demand. Despite industry unease, the rare earths agreement has drawn bipartisan support in Washington.

In the second decision, the US announced anti-dumping duties of 93.5% on the imports from China of anode active materials (graphite), a mineral vital to batteries in EVs. This increases the total US tariffs on Chinese graphite to 160%, and comes on top of the US Energy Department’s $750 million loan last year to the Australian company Novonix to construct the largest synthetic graphite factory in North America at Chattanooga. 

Anodes are widely regarded as the most difficult part of the battery for the west to reduce its dependence on China, due to low prices and the near-complete dominance of Chinese groups over global supply. Chinese companies accounted for 95 per cent of the global anode market in the first five months of 2025, with South Korean companies, led by Posco and Daejoo, accounting for 2.7 per cent, and Japanese makers for 2 per cent, according to market information provider SNE Research. Tim Bush, a Hong Kong-based battery analyst at UBS, said efforts in Asia and North America to build a non-Chinese anode supply chain had been “undermined by US automakers’ unwillingness to underwrite the costs”. That reflects, in part, scepticism among battery and electric vehicle producers about the ability of North American producers to supply the battery-grade graphite they require.

The tariffs undoubtedly come at a significant incremental cost to the US consumers. 

Given the current paucity of non-Chinese anode suppliers, the additional import costs are likely to sting Asian battery providers, including those serving American EV manufacturers such as Tesla, General Motors and Ford, with the extra costs potentially passed on to US consumers. An average EV battery contains 50 to 100 kilogrammes of graphite, meaning the new tariffs could deprive battery and EV makers of up to 20 per cent of the value of generous federal production credits that were introduced by the Biden administration and which survived the recent passage of President Donald Trump’s “One Big Beautiful Bill”.

Incidentally, the US decision comes even as China finalised new restrictions on the export of technologies essential for making cutting-edge lithium iron phosphate (LFP) batteries, which have a low-cost chemistry composition. 

What do these two examples inform us about the emerging trends in industrial policy?

The earliest industrial policy actions were regulatory, primarily in the form of infant industry protection measures, by way of outright bans and prohibitive tariffs. Industrial policy of the kind pursued by the East Asian economies has focused on capital subsidies and fiscal concessions aimed at firms. The Chinese expanded their boundaries further with economy-wide subsidies, cheap capital, regulations like hukou that assured a supply of cheap labour, economies of scale from operating in a massive market, and generally provided capital subsidies and fiscal concessions on a scale never before seen. The result is that global manufacturing sectors are either overwhelmingly dominated by their manufacturers or they far outcompete their peers from other countries. 

This China problem means that traditional industrial policy instruments deployed by the East Asian economies are hardly sufficient. No country, except perhaps the US and that too only in certain sectors, can outspend the Chinese. 

There’s a chicken-and-egg problem. There’s very little or no domestic manufacturing of good quality. Domestic manufacturers cannot match the very low prices of Chinese imports. In the absence of an assured domestic market, no investor or firm is willing to put money. This gridlock perpetuates Chinese dominance. It must be broken.

Accordingly, the US government's decisions to invest public funds and assure a floor price (for rare earths), and raise prohibitive tariffs and give state loans (for synthetic graphite) go beyond traditional industrial policy. It effectively creates a market that can support domestic manufacturing. But this comes at a higher cost (of production compared to the Chinese imports), which is passed on to the domestic consumers who must pay higher prices. 

There are lessons for India. Traditional industrial policy must be complemented with market-making policies. Policies must be tailored to leverage the attractions of India’s massive market to incentivise domestic manufacturing. Apart from prohibitive tariffs and other barriers, this can be successful only with a mandate to purchase domestic produce. 

There are several product markets where market-making levers are available to the government. They include solar power and smart meters (where state-owned discoms are the monopsony buyers), telecom equipment (which are B2B markets), surveillance cameras and drones (which, while sold to consumers, also have a dual-use/security aspect). In these products, there’s a case for public policy to either mandate sales of domestic manufactured goods, or mandate a minimum domestic content, or raise disability bridging tariffs. Given the nature of these products and the volumes required, they are an unprecedented opportunity to catalyse a domestic ecosystem that covers the entire value chain involving component manufacturing, chip design, product design, and product manufacturing. Taken together, they have the potential to catalyse a serious deepening and broadening of India’s manufacturing base. 

However, in many products, Indian manufacturers will not be able to meet the domestic demand and that too with quality. Further, the domestically made goods will come at a much higher price. This gridlock can be broken only gradually. 

A prudent strategy would be to phase in the domestic purchases and domestic content requirements gradually. For example, the domestic manufactured equipment requirement can start with at least 5-10% in the first year, going on to 50-75% over five to seven years. Similarly, domestic content requirements can be progressively increased over time. Apart from facilitating the emergence of strong domestic manufacturing bases in these products, such phasing will also enable the domestic firms buying and selling these products to at least partially mitigate the high costs of domestic manufacturers. 

This strategy creates the risk of being captured by inefficient domestic vested interests. India’s memory of autarky is not too distant. The North East Asian economies mitigated this risk by building incentives around export competition and creating mechanisms to ensure that the market itself rewards the efficient manufacturers and weeds out the inefficient ones. Export focus would anyway be required to realise the economies of scale to become competitive with the Chinese manufacturers. However, given the political economy that emerges once such policies are put in place, this will be a big challenge for the government.

Such measures will invariably generate opposition from trade partners and likely violate WTO commitments. However, it appears that there is no other alternative. 

There’s a paradox with liberalised trade regimes. It’s like the bullies who favour the status quo. The US and the West created the WTO to institutionalise the prevailing global economic balance in their favour. The Chinese overcame this imbalance and turned it to their advantage. It’s therefore natural that they are now the most vocal supporters of the WTO. 

The WTO status quo is not in the interests of a country building its manufacturing base. The Chinese largely ignored the WTO regulations while building up its manufacturing industry, while enormously benefiting from the global market access it provided. This hard reality must be recognised while pursuing industrial policy. 

Monday, July 21, 2025

Bridging an important data gap in improving learning outcomes in India

Credible long-term performance measurement can be a powerful lever to transform systems. There’s a compelling case that the National Assessment Survey (NAS) (now PARAKH), administered nationwide by the NCERT, can be one such longitudinal data source. Started in 2001, it is a large-scale representative sample assessment of student learning outcomes in Grades 3, 5, 8, and 10, and is conducted every three years. 

A big frustration about school education policy making in India is the absence of credible learning outcomes data that can be compared over time and across geographies, and also which can be used to generate actionable insights for education system managers. The NAS can be an excellent source to address this deficiency. It can become the definitive source of data to design both pedagogy and school education policies at both national and, more importantly, at the state government levels.

But this would require certain important changes in the design, administration, and analysis of NAS/PARAKH. In particular, the following six measures are critical. 

1. The NAS should be conducted every year. The most useful takeaway from such surveys is often the directional trends with important parameters. Three years is too long a period for this data to generate meaningful and actionable takeaways. 

2. Instead of primarily being a mechanism for the Ministry of Education (MoE), Government of India, to compare performance across states, it should become a tool for state governments to understand where their schools stand and improve their education systems. India is too large and too diverse (in terms of the baseline of educational outcomes) to be able to derive meaningful, actionable inferences from nationwide surveys. Comparisons across states need only be a secondary outcome. 

3. Instead of being a centrally administered test, it may be more appropriate for NAS to be administered by state governments. This is necessary to ensure ownership by the state governments. To ensure the objectives are not compromised, it can be done by contracting with independent testing agencies using a standardised set of instruments. The contracts should be for 3-5 years to build capabilities, including at the supply side. 

ASER, for example, samples 600 households in each district through a two-stage randomisation process - 30 villages in the district and 20 households in each village. PARAKH 2024 was administered to 2.29 million students across 75,565schools. Tablets and digital technologies can be used extensively to administer these tests effectively. 

MoE can issue guidance on the instruments, administration and scoring of the tests, selection of independent agencies (including model RFP, contract agreement, etc.), analysis of the test scores/performance data, and analysis of the instruments for academic learning. This guidance can also help ensure comparability of the test data from different states. 

Alternatively, the NCERT must figure out ways to conduct the test in a collaborative mode with state governments and with their full ownership. This may be difficult given the legacy and NCERT’s own incentives and institutional culture. 

4. It should have two objectives: to evaluate test performance and to improve pedagogy. The former will be done by analysing the test scores, and the latter by analysing the responses in the instruments. The current NAS does little (or nothing) to directly address the latter. There’s a strong case that the latter is arguably more important. 

5. The test scores data should allow for the comparison of grade-wise and subject-wise performance across blocks and districts, and provide actionable insights for administrative-side improvement interventions/measures (analysis based on blocks, subjects, grades, gender, social groups, management, etc.). 

6. The student responses in the instruments, especially when they make mistakes, can offer important insights about how children understand concepts, and can help with academic-side improvements. It can help identify the most common types of mistakes made by students in each concept, and even why they are making those mistakes. This analysis can be used to create subject-wise and grade-wise libraries of the common mistakes for concepts mapped to the respective lessons. 

Given the critical importance of understanding concepts in achieving learning outcomes, this library can be an invaluable pedagogic tool for teachers. It can help teachers to make lesson plans and tailor their pedagogy to pre-emptively address the common misconceptions and mistakes that students tend to make. This library can be appropriately digitised and made available on Apps for teachers and students to engage with these concepts. 

The national and state councils for education research and training could build a body of pedagogic practices to remediate these common learning misconceptions and mistakes. The NCERT could develop a mechanism to bring together and compile a library of good pedagogic practices,

This can be called the Science of Learning (SoL) library, and can be continuously updated from the analysis of the emerging data from each NAS. It’s unlikely to vary significantly across states and can even be developed as a central SoL library by the NCERT and then made available to state governments to customise and adapt for their respective contexts. It can be a powerful global public good generated by India and is very useful in addressing the global challenge of lagging student learning outcomes.

The NAS/PARAKH instruments can be analysed to generate these academic-side insights. They must be shared with state governments. Given the effort put into administering NAS and its longitudinal nature, it is a great opportunity that must not be wasted. 

For a start, NCERT could share the instruments with state governments so that at least some interested states could analyse them to generate some versions of SoL libraries. The NCERT itself could create a dedicated unit with resources to analyse its vast repository of NAS student responses and build a SoL library on the lines mentioned above. 

A more comprehensive and practical agenda for school education reforms, covering these and more, aimed directly at improving student learning outcomes, is outlined here