There are certain public policy interventions whose effectiveness is measured by the decline in its application with time or by the minimisation of its need or off-take. For example, lower its uptake, greater the success of any market intervention measure that stabilises prices. This post provides two examples.
Consider the example of the US Federal Reserve's liquidity operations to backstop the municipal bond market,
Economists at the Fed have given glowing reviews to the central bank’s emergency credit line to states and cities, called the Municipal Liquidity Facility. Despite its soporific name, it was an unprecedented extension of the Fed’s “lender of last resort” powers: It inserted the bank into the municipal bond market, which states and cities basically use to even out revenue streams and finance some large projects. And it was successful in its primary mission: The Fed’s very entry into this market prevented its collapse and kept private lending flowing. It kept borrowing levels relatively near the prepandemic status quo. Still, because the Fed itself didn’t offer very generous loan terms compared with private lenders, the M.L.F. directly lent to only two borrowers — the state of Illinois and New York’s Metropolitan Transportation Authority.
The success of MLF was due to its limited actual use.
On similar lines, agriculture market interventions to stabilise prices obtained by farmers are most effective when they are calibrated in a manner that makes its use minimal. In other words, the objective should be the least intrusive manner of market intervention that stabilises market prices. As a corollary, the test for its effectiveness on a comparative basis is whether the intervention has declined or not.
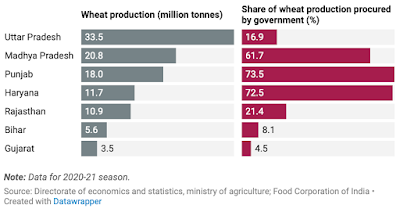
Livemint has a very good data article which points to the large variations in public procurements of wheat across states. In the 2020-21 Rabi season, wheat production soared to 109.2 mt in 2020-21 from 92.3 mt in 2015-16, wheat acreage rose to 34.6 m hectares, 14% more than the average of the last five years, and public procurement rose from 24.9% in 2015-16 to 39.6% in 2020-21. In 2020-21, 73.5% of wheat production in Punjab, the third largest producer, was procured, compared to just 17% in UP, the largest producer.
Further, the number of farmers using public procurement facility to sell wheat too has been rising steadily. The number of farmers benefiting from public procurement in 2021-22 is up 2.5 times of that in 2016-17.
So we have a trend where the share of production being procured is rising and the number of farmers using procurements is rising even faster, despite wheat prices in general being on the upward trend in the last six years (or at least not suffering a price collapse). The inference is clear - given the consistent trend over nearly six years, markets are not functioning well in providing adequate prices to the farmers and it appears to be getting worse.
Is it the case that the main objective of procurement is being crowded-out by the activity of procurement itself? Is more proactive, targets-based public procurement distorting incentives and interfering with the market mechanism?
Accordingly, in terms of evaluating such agriculture market interventions, there is a case that its success should be measured not in terms of the quantity of foodgrains procured but in terms of stabilising market prices. This makes the case for evaluating agriculture market interventions also in terms of some price stabilisation index as against only procurement targets.
The challenge though is with developing a credible index, one which measures both price recovery and stability and is also benchmarked with global market prices. Further, the inherently volatile nature of agriculture commodity prices can leave with no option but to do large procurements.
The broader point of the post is that less of an intervention is often more required in certain areas of public policy.


No comments:
Post a Comment