Substack

Saturday, September 6, 2025

Weekend reading links

Thailand’s Prime Minister Paetongtarn Shinawatra has been removed from office... The country’s constitutional court on Friday found Paetongtarn guilty of ethics violations over a phone call with Cambodia’s former leader Hun Sen, in which she criticised the Thai military in the run-up to the border violence... she is now the fifth holder of that office to be removed by the constitutional court in the past 17 years... Paetongtarn, a political novice, assumed office last year after her predecessor, property tycoon Srettha Thavisin, was dismissed by the constitutional court for appointing a previously jailed lawyer as a cabinet member, an ethical violation... The constitutional court has dissolved more than 100 political parties over the past 30 years, including Move Forward, which received the most votes in the last nationwide election in 2023.

2. Boeing and Airbus

The success of the A320 family has been the driving force behind Airbus’s ascendancy in its five-decade rivalry with its US competitor. For years, the two companies had a roughly 50:50 split of the market for commercial single-aisle aircraft. But by the end of last year, Airbus held a market share of 61 per cent measured by order backlog and 72 per cent by deliveries... Boeing delivered 348 jets in 2024, fewer than half the 766 that Airbus managed, as 737 Max output remained subject to a 38 per month cap pending improvements to quality control. A shortage of engines has been one of the most persistent challenges for both companies. CFM International, a joint venture between France’s Safran and GE of the US, and Pratt & Whitney have struggled to keep up with demand. Both companies’ engines for the A320neo have also had durability issues.

3. India uses half the capital to raise output by one unit compared to China.

4. FT effectively calls out corporate America as a bunch of bullies who flaunt their muscle before the weak and prostrate when they are in turn bullied.

When Zohran Mamdani resoundingly won the Democratic mayoral primary for New York in June, Wall Street and Silicon Valley erupted in outrage at his promises of free buses, rent freezes and city-run groceries. Hedge fund billionaires Bill Ackman and Dan Loeb, Jamie Dimon of JPMorgan Chase and tech entrepreneur Brian Armstrong of Coinbase all warned about the risk of heavy-handed interference in the city’s economy. David Solomon, chief executive of Goldman Sachs, took to LinkedIn to slam Mamdani’s proposal to freeze city-controlled rents. “When New York tried it in the 1920s and 1960s, it limited affordable housing, narrowed investment in new housing, and made housing outside the control area more expensive,” he wrote. The reaction over the past few weeks as US President Donald Trump has unveiled a series of blunt interventions into the workings of both the financial system and the operations of private companies has been very different... 
Yet as Trump has stepped up his attacks on the Fed, Wall Street’s leading figures have offered only limited criticism. And while many of his corporate interventions amount to the sort of European-style dirigisme that the US business elite once loved to deride, the response to Trump’s agenda has been near silence. Indeed, some business leaders have offered praise of the president’s attempts to direct the economy... The juxtaposition with Mamdani is striking: vociferous criticism of the frontrunner to be New York’s mayor from business leaders, but calculated restraint as the president reshapes the rules of free enterprise in America... the principal explanation lies in fear. Criticising Trump, they argue, is risky business. “They’re more afraid of the guy in power in Washington than of the potential mayor of New York,” says Ilya Somin, a law professor at George Mason University and scholar at the libertarian Cato Institute. “Even if Mamdani does become mayor of New York, he will not have the kind of power that the president of the US has.”... Jamie Dimon, who last month dismissed Mamdani’s economic views as “the same ideological mush that means nothing in the real world” and criticised “idiots” in the Democratic party, has stopped short of criticising Trump directly.  

5. India is now becoming a more expensive mobile services market. 

6. The Ken has a nice story on how India’s private sector is making UAE as a choice investment destination.

Personal-care and pharmaceutical company Himalaya Wellness; electric-vehicle maker Omega Seiki Mobility (OSM); electric-bus manufacturer (and subsidiary of commercial-vehicle giant Ashok Leyland) Switch Mobility; and iron-and-steel-pipe manufacturer Jindal Saw. These are just a few among Indian companies who’re planning to set up fully-operational manufacturing bases across free-trade zones in the UAE. Others, such as consumer-goods company Dabur, eyewear company Lenskart, and conglomerate Tata already have operations there. Tata’s presence, in particular, is sprawling—from hospitality ventures such as Taj Exotica and The Palm Dubai, to Tata Steel Middle East’s downstream facility to manufacture steel flooring in Jafza. Of the total 11,000 companies in the Jafza free-trade zone, 2,300 are Indian… While India currently has 276 operational SEZs with around 6,300 companies, the UAE—which is smaller than the state of Bihar in area—has 40 free-trade zones boasting over 200,000 companies… The incentive comes in the form of financial backing from UAE’s sovereign-wealth funds, joint ventures, or loans. For instance, before Lenskart’s Dubai factory became operational in 2024, it had received $500 million from the sovereign wealth fund Abu Dhabi Investment Authority (ADIA)… Similarly, Himalaya Wellness secured $80 million in loans in 2023 from the Emirates Development Bank for its upcoming plant in Dubai’s free-trade zone. Spanning 225,000 sq ft, it is expected to create jobs for 250 professionals and produce 3 billion tablets, 15 million syrup bottles, and 3 million ointment units a year by 2030.

The numbers are truly disturbing. There are 2300 Indian companies in just one UAE FTZ, compared to 6300 firms in all of India’s 276 SEZs! Even with all the obvious attractions of UAE - tax-free zones, ports and logistics facilities, and access to international institutional finance - this scale of exit should be a matter of concern. 

7. Gartner's annual "digital automaker index" which compares carmakers on their potential to monetise their software has the following line up

Clearly, the traditional car makers have fallen behind, being overtaken by the new American and Chinese firms focusing on electric vehicles. 
Ultimately, analysts warn that the auto industry is likely to go in the same direction as smartphones and PCs, with a small number of operating systems like iOS and Android eventually dominating the software space. They add that the transition will fundamentally tilt the industry’s modus operandi away from designing, building and selling cars — a business model characterised by mechanical engineering and relatively thin profit margins — and towards software and services. Toyota and its peers are aiming to use these to create new sources of revenue as the industry shifts to autonomous electric cars. Investment across the industry is already shifting from superior engines and external design to the computer systems that will control everything from batteries to safety features and, eventually, self-driving functions.

8. Unit economics of food delivery e-commerce.

Both Swiggy and Zomato typically charge restaurants a commission ranging from 15-30%, depending on the scale of the business, with smaller businesses often paying higher commissions. Most restaurants say nearly half the order value disappears before it even reaches them. Explaining the math, restaurateurs indicated to Mint that on an order of, say, ₹300, about ₹75- ₹90 goes to the aggregator as commission, while about ₹60- ₹90 is lost in discounts; ₹15- ₹30 goes towards marketing on the platforms just to stay visible. In the end, a restaurant is left with only ₹150- ₹90 out of an order worth ₹300. This is a generalized estimate and the actual numbers can be higher or lower depending on each restaurant’s commissions and ad spends. “Pre-covid, commissions were as low as 8-12%. Now, the base commission is 33% and with payment gateway charges, marketing costs, taxes, the sky's the limit. Cost-per-click (the cost a restaurant pays when a user clicks on the ad listing by a restaurant) used to be around ₹1.25 but now it is more than ₹7," the owner of a restaurant chain based in Assam told Mint... Spiralling costs aren’t the only concern for restaurants. Owners are also upset over arbitrary discounts, hidden features and a near-total lack of communication from the platforms. Several restaurateurs allege that Swiggy and Zomato launch discounts or even enable dine-in reservations without their consent.

9. Ajai Srivastava of GTRI points to how Quality Control Orders (QCOs) worsens the business environment in India. Sample this.

A recent example is the steel ministry’s June 13 order. It requires not only finished and semi-finished steel products, but also the raw materials used to make them, to have a BIS quality certificate. The rule took effect with barely one working day’s notice, causing shipments to be stuck at ports, contracts to be cancelled, and court cases to be filed... Now, every upstream raw material supplier — even if located in a third country — must also be BIS-certified... This policy imposes a double-certification requirement. The first certification — the one that matters — is for the final product, which is already in place under FMCS. The second, newly mandated certification is for upstream raw material suppliers, often in third countries far removed from the Indian market. Getting BIS certification takes 6 to 18 months, involves substantial fees, and requires performance guarantees and compliance audits. Small overseas mills producing modest volumes for an intermediary exporter have no incentive to invest the time and money needed for certification. This means limiting the number of foreign suppliers for Indian buyers...
Additional licensing for raw material suppliers adds no meaningful quality assurance. Existing safeguards — mill test certificates, port-level Positive Material Identification (PMI) tests, and customs inspections — already prevent substandard imports... No major steel-producing economy — the United States, European Union, or Japan — requires separate raw material certification if the final product meets national standards. Instead, they rely on traceability through Mill Test Certificates, accredited third-party testing, and mutual recognition agreements. India’s double-certification model diverges sharply from these norms and risks being classified as a non-tariff barrier (NTB) under World Trade Organization (WTO) rules... By forcing upstream suppliers with no commercial interest in India to undergo a burdensome certification process, the government has added avoidable costs, and jeopardised India’s reliability as a manufacturing partner.

10. Interesting that Cantor Fitzgerald, an investment bank run by the sons of Howard Lutnick, has been buying up tariff refund rights in the expectation that the US courts will finally rule the tariffs illegal and force the government to refund them. 

11. Palantir may be the most over-valued firm in history!

Palantir’s market value has already soared to $430bn, more than 600 times its past year’s earnings and nearly triple the equivalent multiple for Cisco (or, indeed, Nvidia) at its peak. Software firms often prefer to express their valuation in terms of underlying sales, which puts Palantir’s multiple at around 120. For comparison, in 2005, the year before the Oxford English Dictionary added the verb “Google”, Google’s price-to-sales ratio peaked at 22... Adam Parker of Trivariate Research, an investment firm, has published a note entitled “Could Palantir be the best short idea?” Writing in late May, he examined the ratio of enterprise value (which adjusts market value to account for debt and cash on the balance-sheet) to forecast sales for the coming year. On this measure Palantir then scored 73 and now scores 104. Mr Parker looked for other listed companies that had hit a multiple of 70 since 2000. Excluding financial firms and those with annual revenue of less than $50m, he found 14, the largest of which has a market value around a quarter of Palantir’s... To reduce its price-to-sales valuation to “only” Google’s at its peak in 2005, while maintaining its current share price, Palantir needs to multiply its revenue by 5.6—substantially more than the barnstorming progress it has made over the past five years. Doing this over the next five would require an annual growth rate above 40%.

12. Staggering statistic about electoral support for Trump.

According to Gallup, just 1 per cent of Democrats approve of Trump’s job performance, while 93 per cent of Republicans do — equalling the biggest split since this survey started in 1979.

13. Fascinating graphic that shows the over-representation of extreme views in social media.

Recent work by US researchers Claire Robertson, Kareena S del Rosario and Jay van Bavel among others… find that social platforms’ inbuilt tendency to reward indignant and hostile content creates incentives that systematically reward the production of simplistic messages and extreme positions, while rendering moderate views less visible… with social media we essentially have a plethora of fiercely anti-establishment and ruthlessly eyeball-chasing broadcasters, and they’re reaching much larger and broader swaths of the population. This proliferation of views and narratives formerly considered beyond the pale, spread via individuals and platforms outside the control of erstwhile political and media powers, has shattered norms that previously kept radicals on the fringe... 

A 2019 study found that communities in Italy and Germany that received broadband internet access earlier than others also saw earlier upticks in support for populist parties. In his 2024 book The Normalization of the Radical Right, Vicente Valentim shows that support for many populist positions and politicians has long been higher than widely appreciated, and that the discovery that many others share these views — a process facilitated by the internet and social media — has led to them being voiced more confidently, and embodied at the ballot box.

14. Excellent article about the rise of high-bandwidth memory (HBM) chips as the "new frontier of the AI revolution" and how SK Hynix has become the dominant maker of such chips. 

For decades, memory chips were the unglamorous end of the semiconductor industry, overshadowed by the logic or processor chips designed and produced by companies such as AMD, Qualcomm, Nvidia and TSMC to conduct calculations and control an electronic device’s operations. But HBM designs, such as the HBM3E produced at the Icheon factory, are transforming the memory industry. Joon-yong Choi, vice-president and head of HBM business planning at SK Hynix, notes that whereas in conventional dynamic random-access memory (Dram), “cost was prioritised by customers over power and performance, with HBM power and performance are prioritised over cost”. They are helping developers of so-called large language models alleviate the effects of the “memory wall” — where limitations in storing and retrieving data are an impediment to improving performance — as well as boosting efficiency and lowering costs at thousands of data centres under construction around the world...
Intel began life in the 1960s as a memory chip company, but exited the Dram sector in the 1980s under pressure from Japanese rivals Toshiba and NEC. They, in turn, were supplanted in the 1990s by Samsung and the chip division of Hyundai Electronics, or Hynix, which would later be acquired by the SK conglomerate. The two Korean groups and Micron, of the US, have dominated the sector ever since. Samsung was until recently the undisputed leader of the heavily commoditised market in Dram chips, which are powered and store data temporarily while a processor is running. It used its superior scale to invest in production capacity during the cyclical industry’s regular downturns...
HBM chips, which Hynix began developing in 2013... involved stacking layers of Dram units connected by copper wires a tenth of the thickness of a human hair, like a multistorey library with lifts to quickly transport piles of books between floors. That means HBM chips can offer 1,024 pathways for sending data to and from a processor, Choi explains, compared with 64 for conventional advanced Dram chips. “Think of it like the number of taps filling a water tank, or the number of lanes on a highway,” he says. “When it comes to the memory requirements of AI, nothing comes close to HBM.”... Hynix’s early adoption of an advanced bonding technology called mass reflow-molded underfill, or MR-MUF, as key to its HBM success. It involves the use of a special resin-based insulation material to prevent overheating, crucial when stacking up to 16 Dram chips on top of each other...
HBM chips offer profit margins of about 50-60 per cent, compared with about 30 per cent for conventional Dram units. Because each HBM chip needs to be designed to fit the specific AI graphics processing unit to which it is paired, orders must be placed a year before production, typically on one-year contracts... while compute performance is more important for training AI models, memory is widely considered more important for deployment, also known as inference.

Friday, September 5, 2025

The missing culture of global competitiveness in India's private sector

The US tariffs have sparked intense debates in India about the economic responses needed to address a challenging situation. 

On the one hand, it has reignited efforts to focus on self-reliance to insulate the economy from such future shocks, likely given the prevailing protectionist sentiments and the rising geopolitical uncertainties. On the other hand, some worry that this would mark a return to some form of the license-permit raj.

It has also sparked another debate between those who argue that India’s private sector’s lack of ambition, low risk appetite, weak ability to build, and general lack of global competitiveness are responsible for its economic dependence on others, and those who blame this failure on stifling government regulations and a lack of support

In this backdrop, it’s useful to step back and examine the problem using a simplified model to understand the contributors to economic competitiveness. It has four dependent variables:

  1. Internal economic conditions (physical infrastructure, financial capital, human resource availability, etc.), 

  2. Internal business conditions (regulatory environment, business creation and growth enablers, trade policy, market competition, etc.), 

  3. Domestic demand (affordability, size of consumption class, price sensitivity, demand for quality, etc.), and 

  4. Private sector culture 

While much has been written about the first two, and rightly so, the last two do not get anywhere near the attention they deserve. If anything, the last in particular is surprisingly and widely overlooked in public debates. 

I have blogged about the importance of domestic demand here, in that businesses need a large enough quality-conscious consumption class to be able to have the incentives to maintain quality and innovate. A mostly price-sensitive customer base, however large, that discounts quality for price, can be a significant deterrent to investments in quality and innovation. This is an important demand-side constraint. 

This can be significantly addressed if the businesses are exposed to global competition and pursue export markets. This is the point about export-competition (and letting go of the failing firms) that Joe Studwell and others have chronicled in the context of the high-performing Northeast Asian economies. All of them pursued protectionist policies but vigorously enforced export competition through public policies. 

It’s no exaggeration to say that the last variable, private sector culture, does not get any attention in mainstream debates. This is understandable given the difficulties with quantifying it and the limited research and studies that document the issue of business culture from the perspective of economic competitiveness.

In broad terms, we can evaluate business culture in terms of an innate quest for productivity, especially among the large firms. This has an economy-wide domino effect through multiple channels - suppliers, learning by doing, competition, etc. 

This culture is manifest in their R&D investments, attitudes towards innovation, focus on quality, the extent of scale manufacturing, intentions to invest for the long-term, and business dynamism in terms of ambition to continuously move up the value chain, expand business (scale manufacturing), pursue global markets, and so on, and generally aspire to be at the cutting-edge of the technology frontier and be a global leader in their industry. 

While, there’s some endogeneity between economic conditions and government policies and some of these attributes, it can also be argued that for the larger firms in an economy like India, many, if not most, of these attributes are within their control. 

Unfortunately, when evaluated against these metrics, Indian firms, especially the larger ones, fall woefully short. The low R&D investments are an egregious illustration, as also a lack of scale manufacturing, and a near total absence of global brands. Indian firms are conspicuously absent in the echelons of global business. This is generally true of the largest firms across sectors, and the software and pharmaceutical sectors in particular. In general, corporate India, across sectors, suffers from a lack of business dynamism. Even the country’s startups have struggled to imbibe this culture, preferring mostly to engage in copycat innovations

This disturbing deficit in the culture of private sector competitiveness also assumes significance given the history of global economic development. 

The figure below captures how domestic demand and corporate culture interact with each other. 

There are two broad economic growth trajectory choices available for countries like India that are transitioning to open economies. One, move from a relative autarky characterised by a poor competitiveness culture, to a liberalised regime without the private sector becoming competitive. In today’s world, this would be akin to becoming importers of (mainly) Chinese goods, allowing the existing manufacturing base to erode further and the private sector to remain uncompetitive. 

The second option is to build up private sector competitiveness by maintaining adequate protections and then gradually opening the economy as the private sector competitiveness rises. This strategy is especially relevant given Chinese import competition, which can quickly emasculate domestic manufacturing capabilities. Further, given the small size of the quality-conscious domestic consumer base, the only way for competitive domestic firms to emerge is by manufacturing for exports. This is essentially about Make in India for the World. 

This has been the trajectory followed by all the Northeast Asian economies recently, and the European economies long ago. Admittedly, there are strong headwinds that have emerged in recent years that come in the way of the pursuit of such growth. 

In conclusion, if India is to emulate the Northeast Asians, it’s essential to develop a competitive private sector. As discussed above, this is primarily a work for the private sector to pursue internally, with corporate India taking the lead.

Monday, September 1, 2025

Thoughts on affordable housing XI

This post in the series on affordable housing discusses the importance of transportation investments in promoting housing affordability. 

In an excellent 2014 paper, Katharina Knoll, Moritz Schularick, and Thomas Steger show that property prices remained constant in real terms for the major part of the development stages of 14 advanced economies (studied in the paper), driven in large part by transportation technologies and investments. 

This paper presents annual house price indices for 14 advanced economies since 1870. Based on extensive data collection, we are able to show for the first time that house prices in most industrial economies stayed constant in real terms from the 19th to the mid-20th century, but rose sharply in recent decades… By the 1960s, they were, on average, not much higher than they were on the eve of World War I. They have been on a long and pronounced ascent since then. For our sample, real house prices have approximately tripled since the beginning of the 20th century, with virtually all of the increase occurring in the second half of the 20th century. We also find considerably cross-country heterogeneity. While Australia has seen the strongest, Germany has seen the weakest increase in real house prices in the long-run. Moreover, we demonstrate that urban and rural house prices have, by and large, moved together and that long-run farmland prices exhibit a similar long-run pattern… 

While construction costs have flat-lined in the past decades, sharp increases in residential land prices have driven up international house prices… During the past four decades, construction costs in advanced economies have remained broadly stable, while house prices surged… Our decomposition suggests that about 80 percent of the increase in house prices between 1950 and 2012 can be attributed to land prices. The pronounced increase in residential land prices in recent decades contrasts starkly with the period from the late 19th to the mid-20th century. During this period, residential land prices remained, by and large, constant in advanced economies despite substantial population and income growth…

From the 19th to the early 20th century the transport revolution – mostly the construction of the railway network, but also the introduction of steam shipping and cars – led to a massive and well-documented drop in transport costs, often referred to as the transportation revolution. An important effect of the transport revolution was to substantially augment the supply of economically usable land… We show that this land-augmenting decline in transport costs subsides in the second half of the 20th century so that land increasingly became a fixed factor. At the same time, zoning regulations and other restrictions on land use also inhibited the utilisation of additional land in recent decades while rising expenditure shares for housing services added further to the rising demand for land…

Glaeser and Kohlhase calculate that the average cost of moving a ton a mile was 18.5 cents (in 2001 Dollars) in 1890 but had fallen to 2.3 cents at the beginning of the 2000s… The length of the railway network can serve as a proxy for the opening up of new territories over time. For our 14 countries, the length of the railway network peaked in the interwar period and has not grown materially since then… By 1930, essentially the entire world had been made accessible. Subsequent expansions of the transportation network through highways did not lead to a comparable fall in transportation costs… The dramatic efficiency gains in maritime transportation were also realized in the late 19th and early 20th century. The 19th century revolution in shipping rested on two developments: first, the fall of iron and steel prices that led to the introduction of metallic hulls; second, parallel advances in engine technology that led to much improved fuel efficiency Between 1870 and 1914 shipping costs fell by about 50 percent relative to the prices of commodities. By contrast, commodity-deflated real freight rates barely fell after 1950.

They offer a reinterpretation of David Ricardo’s hypothesis (made in the context of agricultural land, specifically where corn is grown) that, since land is a fixed factor, in the long run, economic growth will disproportionately benefit landlords. Further, given the unequal distribution of land, the rising land prices is likely to worsen inequality. They write,

The decline in transport costs kept the price of residential land constant until the mid-20th century. Yet the price surge in the past half-century could be an indication that Ricardo might have been right after all.

Illustrating the insights on the interaction between transportation developments and land prices, Binyamin Applebaum in the Times has an excellent article which shows how Tokyo has become a standout success in affordable housing on the back of a housing development strategy that revolves around mass transit. It has become the largest city in the world while also remaining affordable for its residents. Here’s a striking statistic.

Two full-time workers earning Tokyo’s minimum wage can comfortably afford the average rent for a two-bedroom apartment in six of the city’s 23 wards. By contrast, two people working minimum-wage jobs cannot afford the average rent for a two-bedroom apartment in any of the 23 counties in the New York metropolitan area.

This success comes with its costs and benefits

Maintaining an abundance of affordable housing has its downsides. Green space is scarce in Tokyo, living spaces are small by Western standards, and relentless redevelopment disrupts communities. But the benefits are profound. Those who want to live in Tokyo generally can afford to do so. There is little homelessness here. The city remains economically diverse, preserving broad access to urban amenities and opportunities. And because rent consumes a smaller share of income, people have more money for other things — or they can get by on smaller salaries — which helps to preserve the city’s vibrant fabric of small restaurants, businesses and craft workshops.

This is an important pointer to how Tokyo has managed a balancing act between urban growth and affordable housing.

From the air or from one of the city’s many observation decks, Tokyo appears as a vast sea of low- and midrise buildings laced with archipelagoes of high-rises, each island marking the location of a station along one of the city’s railroad lines.

This brilliantly captures the evolution of Tokyo’s housing landscape.

The Tokyu Railways Company developed the Den-en-toshi, or Garden City, line, which stretches southwest from the city center, in the 1950s as the backbone for a series of suburban neighborhoods of single-family homes… As Tokyo grew and demand for housing increased, the railroad has rebuilt the areas around its stations with condominium towers, shopping malls and office buildings. Around Futako Tamagawa Station, the largest of these new urban centers, Tokyu knocked down more than 100 homes to make way for more than 1,000 units in new apartment towers, as well as a new headquarters for the technology company Rakuten… 

The communities around the stations have grown denser, too, with apartment buildings interspersed among single-family homes. The population served by the Den-en-toshi line has increased from 20,000 people to more than 600,000. And the railroad, which once ran two-car trains three times an hour, now runs subway-style trains every few minutes, many of which continue into central Tokyo on a subway line. “We consider ourselves as a city-shaping company,” Hirofumi Nomoto, then chief executive of Tokyu, said in a 2016 interviewafter the completion of the Futako Tamagawa redevelopment project. “In Europe, for instance, railways companies simply connect cities through their terminals. That is a pretty normal way of operating in this industry, whereas what we do is completely different: We create cities.”

In stark contrast to Tokyo, cities like New York and others have stopped investing in mass transit lines and have strict restrictions on development along existing lines. And the consequences are evident in terms of housing unaffordability. 

This transit-led urban growth model has been supported by the city’s remarkably liberal zoning regulations.

In Tokyo, by contrast, there is little public or subsidized housing. Instead, the government has focused on making it easy for developers to build. A national zoning law, for example, sharply limits the ability of local governments to impede development. Instead of allowing the people who live in a neighborhood to prevent others from living there, Japan has shifted decision-making to the representatives of the entire population, allowing a better balance between the interests of current residents and of everyone who might live in that place. Small apartment buildings can be built almost anywhere, and larger structures are allowed on a vast majority of urban land. Even in areas designated for offices, homes are permitted. After Tokyo’s office market crashed in the 1990s, developers started building apartments on land they had purchased for office buildings.

Tokyo makes little effort to preserve old homes. Historic districts subject to preservation laws exist in other Japanese cities, but the nation’s largest city has none. New construction is prized. People treat homes like cars: They want the latest models. Between 2013 and 2018, new homes accounted for 86 percent of home sales in Japan, according to the most recent government data. In the United States, new homes typically account for about 15 percent of sales, according to data from the National Association of Realtors. One reason Tokyo looks forward is that little remains of the city’s past. Earthquakes, fires and American bombers destroyed much of the prewar city, and after the war, the rush to provide housing and the nation’s relative poverty produced a city that wasn’t meant to last… New buildings, and their occupants, also are more likely to survive the next earthquake… The ease of building in Tokyo means that new construction is not synonymous with luxury housing. Small workshops and factories are common…

Parks, too, are sometimes treated as unaffordable luxuries. Parks and gardens occupy just 7.5 percentof the city’s land, far below the figures for New York (27 percent) and London (33 percent). Mitake Park, once one of the few green spaces in the dense Shibuya neighborhood, is being transformed into a 26-unit apartment building. In the nearby neighborhood of Shinjuku, the government this year authorized construction of three high-rises that will eat into the Meiji Jingu Gaien, one of the city’s oldest and best-loved parks.

In another article in the Nikkei Asian Review, Benjamin Banzal and Jorge Almazan provide a nice description of Tokyo’s urban form.

After the firebombing of 1945, rebuilding was chaotic. Black markets flourished around train stations, while a severe housing shortage was often met with makeshift wooden homes on tiny plots, rather than large public housing. The government, constrained by weak institutions and scarce resources, was in no position to guide the city's recovery. When Japan's economic miracle took off in the 1950s, much of Tokyo's growth was driven by small, labour-intensive workshops embedded in residential districts. Zoning was flexible. Mixed-use, live-work arrangements were commonplace. Production chains were held together not by vertical corporate hierarchies but by horizontal social ties and local agglomeration economies. Subway expansion gradually allowed the city to grow outward, easing pressure on the center. Population density thus evened out across the metropolis. From above, Tokyo's vastness appears homogeneous, but its neighbourhoods remain distinct -- unified more by a shared set of local amenities than by architectural design. 

These amenities -- sento bathhouses, mom and pop stores, small manufacturing workshops, construction and building material contractors, eateries -- were tightly interwoven into the urban fabric and often owned and operated by local inhabitants, anchoring employment in neighborhoods. This model proved both functional and socially cohesive. With little open space, residents placed planters on pavements. Festivals were organised block by block. Economic growth did not produce stark urban divides. Tokyo remained relatively egalitarian in spatial terms.

The compact neighbourhoods that emerged in post-war Japan resemble the lightly planned, dense, mixed-use localities with small plots, narrow roads, limited public spaces, and low-rise multi-tenanted housing that characterise the majority of localities across all Indian cities. They have emerged organically through development by the original small plot owners, and encompass both slums and lower-middle and middle-class housing colonies. 

While in India, these colonies have largely remained stuck in time, with a slum-like quality of basic infrastructure. In contrast, Japan's provision of infrastructure and liberalised zoning regulations have allowed these colonies to become vibrant neighbourhoods that have retained their original character and social cohesion. 

The foundations of what we call the "Tokyo model" include dense, low-rise neighborhoods of around 20,000 residents per square kilometer woven together by narrow streets, gradually upgraded over time. Urbanism was "emergent," that is bottom-up and responsive to local needs… Private railway conglomerates such as Tokyu, Keio and Seibu also played a central role. They captured real estate value along their commuter rail lines -- building commercial hubs around stations and housing developments further out. In turn, Tokyo's transit system became one of the most efficient in the world, and helped spread the neighbourhood model across the metropolitan region… 

A mix of three phenomena around train stations added dynamism to this urban model. First, shotengaishopping streets, often covered arcades, branch off from station plazas and are filled with small, owner-run stores. Second, yokocho alleyways emerged when postwar black markets were regularised, allocating compact plots to bars and restaurants. These alleys still foster a strong sense of community. Third, zakkyobuildings -- narrow, multi-tenant towers on small lots -- stack diverse uses vertically, with their characteristic (neon) signage testifying to the vibrancy within.

Tokyo's urbanism has never been static. Over time, manufacturing gave way to services. Stricter environmental rules and broader economic shifts pushed industry out of the inner city. Height limits were relaxed, and taller apartment buildings began to rise along major thoroughfares. Since the 1980s, however, Tokyo's urban policy has increasingly tilted the balance toward top-down development. Floor-area-ratio restrictions were eased significantly. Special planning zones were introduced with looser urban restrictions. Tall, mixed-use towers -- especially near train stations -- became much easier to build, particularly since 2002… These towers often concentrate hundreds of apartments in a single building…

Unlike other countries that have incorporated tools for public participation, Tokyo's planning remains largely in the hands of powerful institutions: the central government, the Tokyo Metropolitan Government and its 23 special wards all have a say in decisions and have systematically sided with developers. As public consultation is minimal, community voices are rarely heard or often overruled. Over 200 redevelopment projects have already been completed since 2002 -- mostly in central areas like Roppongi, Shibuya and Toranomon. Many more are in the pipeline, including a second Roppongi Hills. As central areas will inevitably reach saturation at some point, developers are looking further afield in search of yield.

This is a good summary of the balance Tokyo has achieved between renewal and social cohesion. 

The Tokyo model deserves more recognition -- not out of nostalgia, but as a viable framework for future growth. Its buildings are constantly renewed. Its shops shift with demand. Its density supports both economic dynamism and social cohesion. It is a model built for change.

While I have quoted the trajectory of change in Tokyo’s urban form, the article itself cautions against the pace of change, which threatens the local character and social capital, replacing compact localities with homogeneous, gentrified high-rises. 

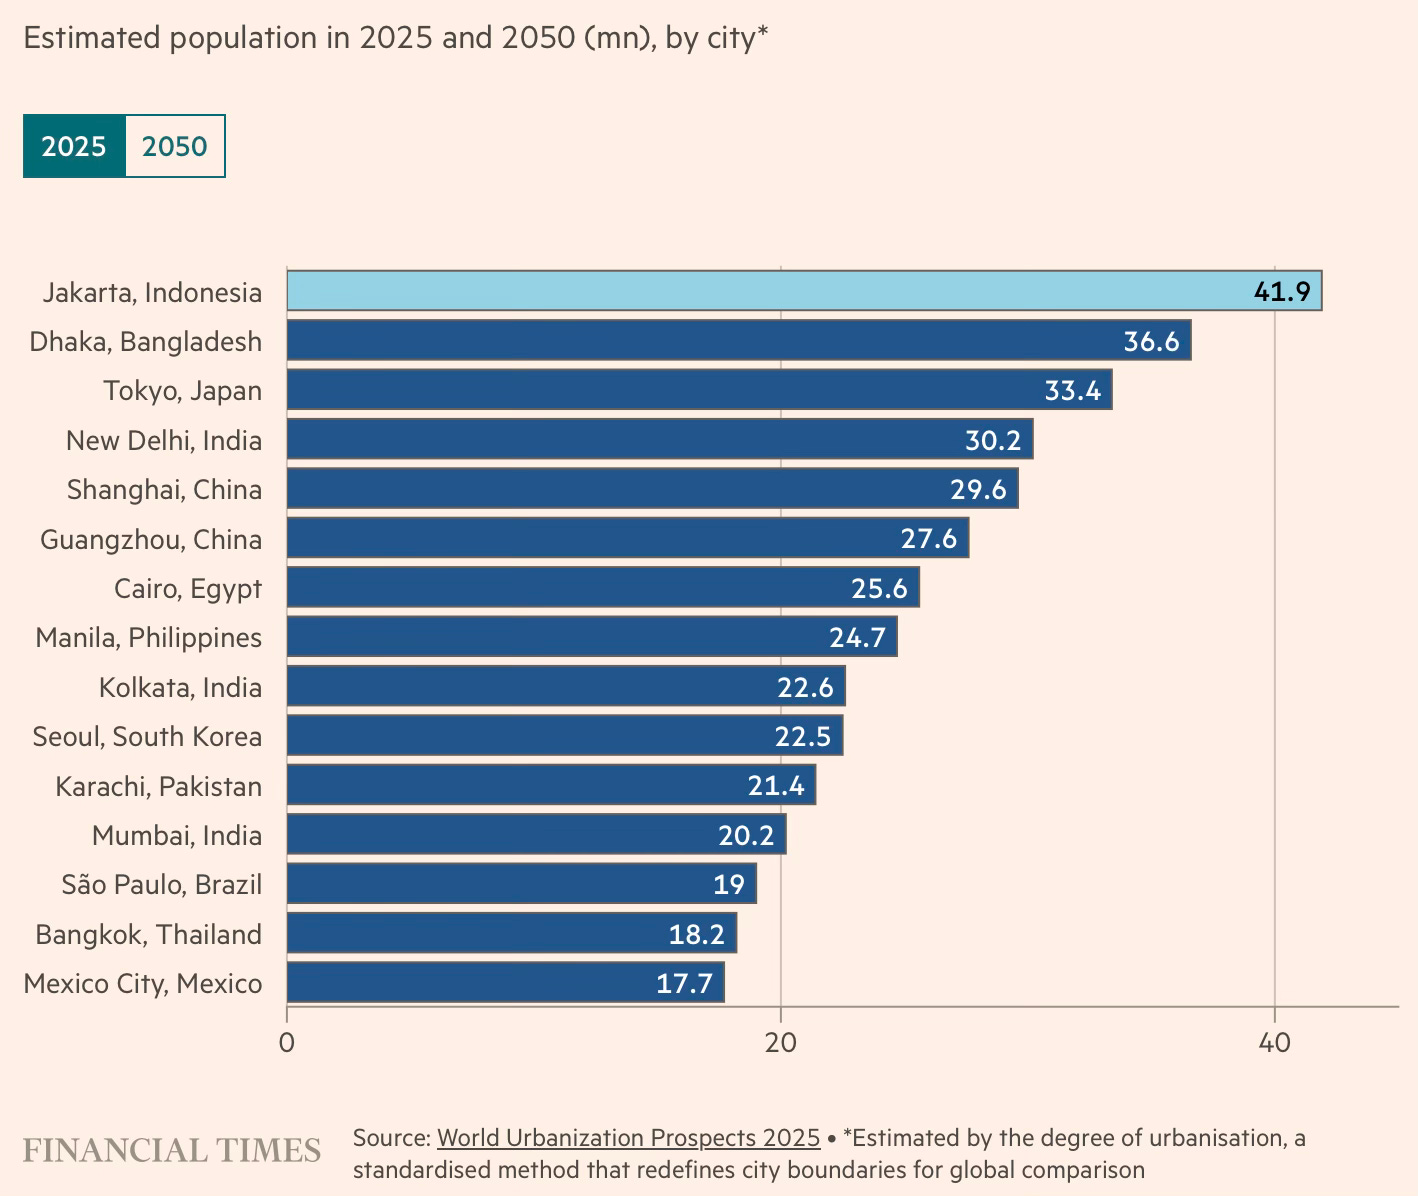
This has important lessons for developing countries like India, where the largest cities are already bursting at their suburban seams, mired in traffic congestion, and housing affordability is an acute crisis, with urban growth prospects facing strong headwinds. Sample this FT long read on Bangalore. 

The Tokyo example has strong relevance since Indian cities, too, are characterised by similar dense localities. Indian cities must create enabling mechanisms to allow them to shape and accommodate economic growth dynamically. It should allow, over time, pockets of high-rises to emerge so that the localities combine people from all economic classes.

This is important because the emerging landscape of India’s urban growth is that of older localities (both slums and middle-class colonies) frozen in time, increasingly congested, and with poor quality infrastructure (interspersed with pockets of affluent colonies), and suburban growth of homogeneous high-rise gated communities, interspersed with slums and squatter settlements. This is a deeply inefficient, unequal, socially dissonant, and growth-constricting form of urban development. 

A fundamental insight in urban development is that, given the fixed extent of land available in any city, there are only two ways to increase supply. The first is to develop vertically by raising the Floor Area Ratios (FARs), a topic discussed extensively in this blog (also this paper). The other option is to expand outward to encompass suburbs, while simultaneously building transportation infrastructure that shrinks the suburban sprawl and lowers commute distances. Tokyo illustrates how the combination of the two can keep housing prices affordable.

Transportation has traditionally been a performative aspect of urban planning in India, confined largely to instruments like road widths, land-use, and transport infrastructure creation (roads, Bus Rapid Transit, and metro railways). Unfortunately, public policy actions have largely been a form of isomorphic mimicry by transplanting top-down technocratic institutional arrangements (like UMTA/MTA and concepts like Modal Integration and Transit Oriented Development) that have worked in the cities of mature developed economies, without any thought for their integration with the local urban planning norms and without any meaningful social and political engagement and ownership by those stakeholders of the need for such changes. Even when implemented, they have remained only in form and have had little to show as substance. 

Accordingly, over the last two decades, we have seen that large transportation investments are made with limited changes to the master plan norms on land-use, FAR, and other measures to use the opportunity (presented by those investments) to shape urban growth and the future of the city. This is most egregiously manifest in the investments being made in new roads, road widenings, ring roads, BRT lines, metro-railway lines, and (now) the railway station redevelopment projects. In all these cases, there’s rarely any conscious, highest-level engagement to capitalise on the infrastructure investment’s geography-shrinking and housing supply-increasing potential by leveraging urban planning instruments. 

I blogged here that instead of being stand-alone PPP projects undertaken by the Indian Railways, railway station redevelopment projects should be viewed as urban regeneration projects that lay the foundation for the future of the locality and the broader city itself. I blogged here on the need to utilise metro railway investments as an opportunity to shape urban form by densifying the well-connected localities around stations through higher FAR and mixed land use. This and this are illustrative examples of transit-oriented development from London.

In conclusion, Indian cities require policy action at two levels. On the demand side, municipalities should adopt liberal planning regulations, such as those in Japan, that encourage renewal and vertical development, where feasible. The development of infrastructure,ties should complement thi roads and utilis. On the supply side, all transportation investments, especially metro rails, BRTS, or bus routes, should be approved only after easing planning regulations to permit significantly increased FAR and mixed-use developments around mass transit stations. This post provides more details on how to achieve such renewal.

Saturday, August 30, 2025

Weekend reading links

1. US equity markets fact of the day!
Nvidia, is now worth $4.3tn, or one-and-a-half times the UK’s entire FTSE 100 index, give or take... The 10 biggest companies in the US, which are mostly tech-flavoured, with some finance bolted on at the bottom, now account for some 40 per cent of the S&P 500 and for a third of the revenue growth across the index over the past year. Big tech has done all the heavy lifting for investors in the US this year, hence why the S&P 500 is up 9.5 per cent so far in 2025 while the Russell 2000 index, which tracks smaller stocks, is up a more modest 4.2 per cent.

2. Manufacturing reverses course in East Asia.

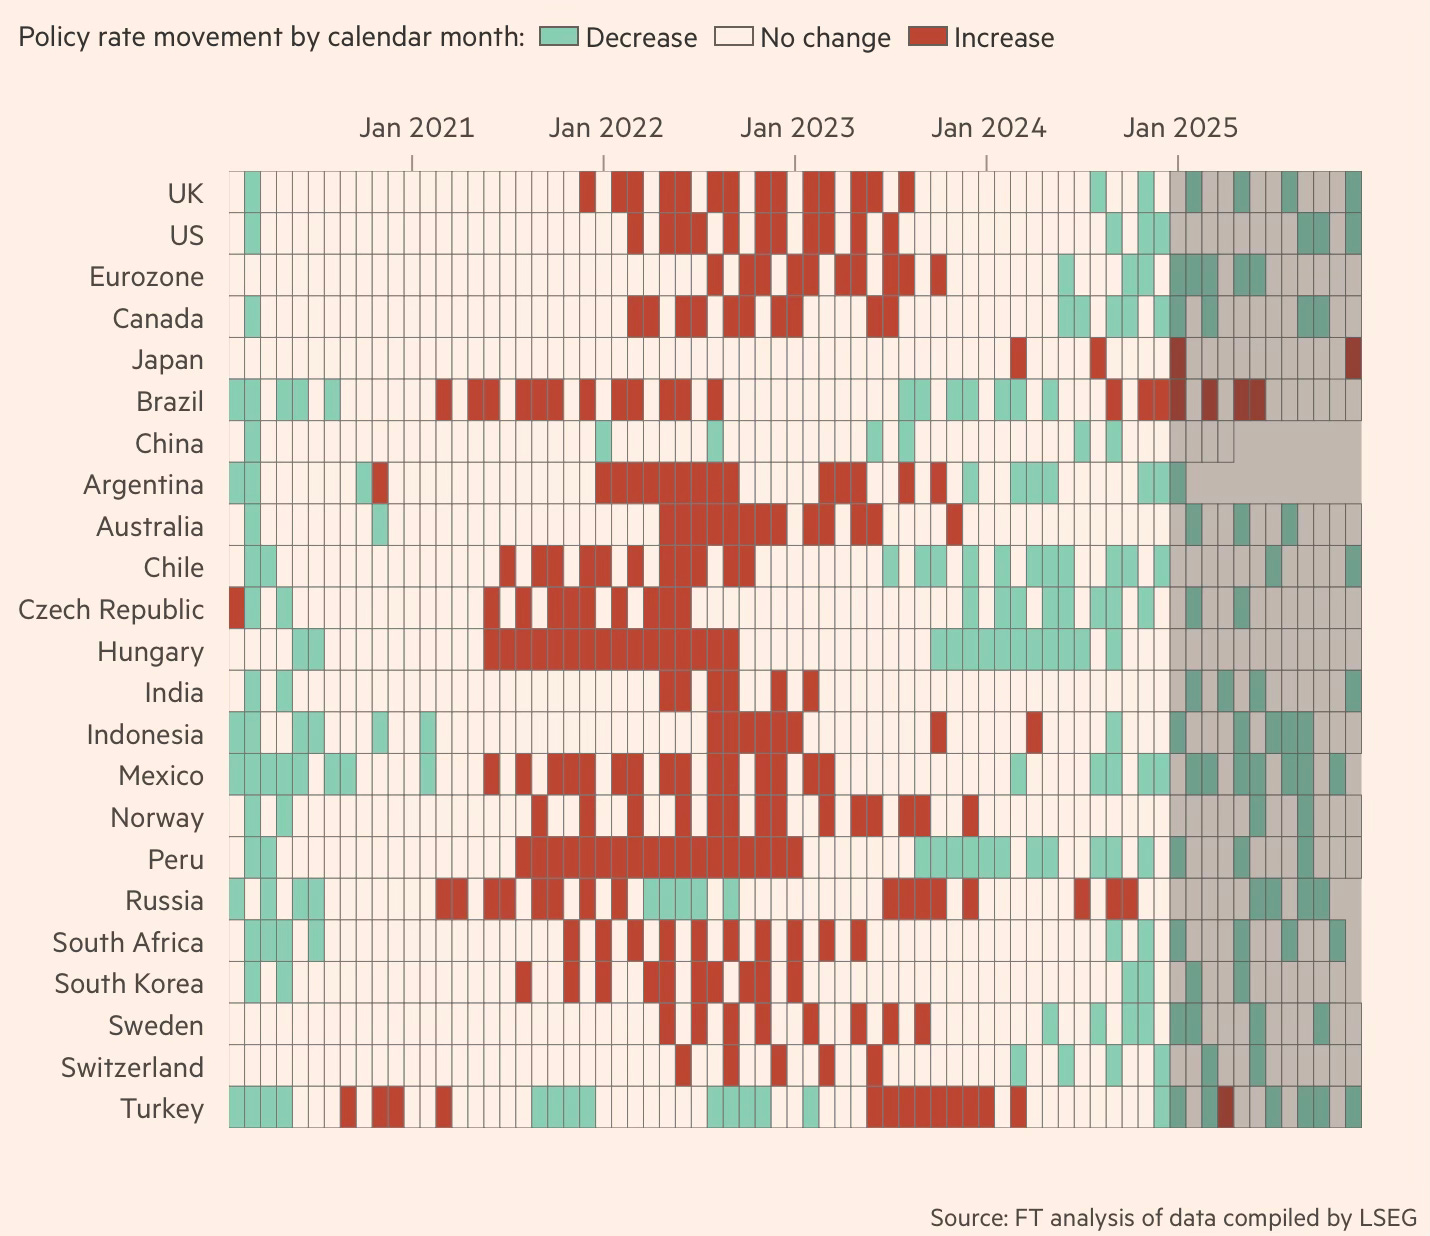
3. The days of independent central bankers may be closing, even as their credibility among the public is waning. 

Inflation targeting, a system pioneered in New Zealand in the 1990s under which rate-setters pledged to do whatever it took to hit their price goals, grounded independence with an intellectual framework... Volcker helped lay the foundations for governments around the world to give greater independence to economic technocrats. The Maastricht treaty of 1992 created the framework for control over monetary policy to be handed to the European Central Bank at the end of the decade. In 1997, Tony Blair’s new Labour government finally gave the Bank of England, then a more than 300-year-old-institution, freedom to set interest rates without political meddling.
4. Who benefited in India from the Russian oil imports?

5. Spain's solar energy glut.
In 2023 and 2024, Spain added more solar power capacity than any other European country except Germany, whose economy is more than twice its size... At some times in spring, as much as 60 per cent of Spain’s electricity comes from the sun. That has enabled Spain to slash its use of gas and coal-fired power stations. Consumers have reaped the rewards, as cheap electricity frees the country from the angst elsewhere in Europe over utility bills... Spain has built so much solar capacity that at certain times of day it produces far more electricity than it needs. Prices have plunged as a result, dragging down owners’ profits with them. Over the past year, “day ahead” wholesale electricity prices were zero or even negative 10 per cent of the time, according to data from grid operator Red Eléctrica. In May, they were at zero or below for one-third of the entire month... Today Spain has 36GW of total solar capacity...
No longer is the Spanish system centred on a few dozen fossil fuel and nuclear plants whose huge turbines are located close to urban demand hubs. Instead, it relies on a web of smaller renewable plants dispersed across rural areas, including 54,000 solar installations. They generate power intermittently, depending on cloud cover and the rotation of the earth, and do not help to stabilise grid frequency and voltage in the same way as giant gas and nuclear turbines. “This transformation has pushed the grid to the limits of the generation mix,” said José Bogas, chief executive of Endesa, a big Spanish utility, in May. But, he added, “we have continued to operate the system as we used to”. While Spain has championed investment in solar parks, the grid has been neglected. According to BloombergNEF, it has been Europe’s stingiest grid investor since 2020, putting only $0.30 into the grid for every $1 invested in renewables, versus a pan-European average of $0.70... As long ago as 2017 a group of European grid operators, Entso-e, warned that the growth of renewables risked creating instability in the grid and called for the deployment of devices that mimic the stabilising function of turbines, known as grid-forming inverters.

6. Good primer on where America gets its pharmaceutical active ingredients and drugs. This generally on drugs.

And this is on prescription drugs.

7. Top ten Indian exports to the US
Indian manufacturers are trying to adapt to the new tariffs by embracing a India+1 strategy of serving US markets from elsewhere.
Raymond might consider ramping up production in its Ethiopia factory for the US market. Ethiopia faces only a 10% tariff. He is not alone in considering a diversification of production outside India as a call of last resort. Godrej Interio, which exports office furniture, is also considering increasing production from its factories in Oman and Vietnam—countries with lower tariffs than India at present. The US has imposed a 10% tariff on Oman and 20% on Vietnam.

This is a good graphic that shows how India lost the labour intensive manufacturing race.

The data shows India’s share in global exports of apparel, leather, textiles and footwear (ALTF) initially grew from 0.9% in 2002 to a peak of 4.5% in 2013, but it subsequently declined to 3.5% in 2022. In contrast, Vietnam’s share has increased to 5.9% and Bangladesh reached 5.1% of global ALTF exports in 2022.

And this about India's failure to increase its textile exports

In 2010, China controlled 36 per cent of global exports; by 2018, its share slipped to 31.3 per cent due to rising wages. Vietnam and Bangladesh seized the opening, doubling their shares to 6.2 per cent and 6.4 per cent respectively. India’s share fell slightly, from 3.3 per cent to 3.2 per cent.  

8. Private equity faces strong headwinds as they struggles to raise money despite offering unprecedented enticements.

Private equity groups raised just $592bn in the 12 months to June: their lowest tally for seven years, data from Preqin show. The decline came even as firms offered more discounts such as management fee cuts, “early-bird discounts” for investors who commit quickly to new funds and other incentives... The industry’s fundraising has shrunk by nearly a third from its record levels in 2021. Higher interest rates and a slowdown in dealmaking have left firms unable to sell trillions of dollars in ageing investments, causing growing frustration from investors, many of whom are now refusing to back funds. Accentuating PE’s challenges are a flurry of newer entrants into the industry in the decade after the 2008 financial crisis, leaving the market oversaturated. It had left a record number of funds chasing every potential dollar of new investment, consultancy Bain said in June... As a result, more groups are offering discounts, such as pledging to return the transaction fees that were once charged to their clients, as well as volume-based discounts and novel terms such as caps on some legal and travel expenses. These types of enticements have reduced net management fees paid to PE groups by about half since the global financial crisis, Bain & Co. found.

9. Barry Scannell points to some important legal issues raised by the rise of AI.

Generative artificial intelligence poses two copyright puzzles. The first is the widely discussed question of compensation for work used to train AI models. The second, which has yet to receive as much attention, concerns the work that AI produces. Copyright is granted to authors. So what happens to work that has no human author? 

The US has drawn the clearest line in the sand to date. In 2023 the US Copyright Office granted copyright protection to the graphic novel Zarya of the Dawn but rescinded protection for any AI-generated images — protecting only the human-authored text and arrangement. More definitively, a federal appeals court ruled in March that the pretty, purple and green AI-generated artwork “A Recent Entrance to Paradise” could not receive copyright protection because works must be “authored in the first instance by a human being”. The message is unambiguous: AI prompts, however sophisticated, are not enough alone to warrant authorship. China has taken the opposite path. In 2023, the Beijing Internet Court ruled that AI-generated images could receive copyright protection, finding that a user’s intellectual investment in selecting prompts and refining outputs constituted human creativity. So far, the UK and Ireland occupy a curious middle ground. Both jurisdictions provide copyright protection for “computer-generated works”. But this protection may be on shaky ground. A consultation from the UK government last year asked whether it should be removed. Ireland’s AI Advisory Council has made a similar recommendation. 

Global divergence in legal frameworks can create problems for businesses. The same AI-generated content could be legally protected intellectual property in Beijing while residing in the public domain in Boston. That means an AI-generated jingle or AI-generated marketing copy made in the US could, in theory, be used by anyone. .. Litigation against AI companies from the likes of Getty Images and The New York Times centre on exploitation of existing works. So far the ownership of AI-created content has remained largely untested before the courts. But that could soon change.

10. Indian capital markets and foreign investors in 2025.

Foreign portfolio investors (FPIs), spooked by sluggish earnings and a sliding rupee, sold Indian equities worth ₹210 billion ($2.5 billion) in the first half of August alone, bringing outflows to ₹1.16 trillion ($14 billion) in 2025 till now. Foreign institutional investors (FIIs) sharply reduced their exposure to Indian equities in July, making India the most underweight market among emerging market portfolios. India’s relative weighting fell to a negative 2.9 percentage points versus the MSCI Emerging Markets (EM) index. Meanwhile, China, Hong Kong, and South Korea saw increased allocations.

11. Tamal Bandopadhyay has a very good summary of India's financial inclusion success with digital banking.

The total number of PMJDY accounts in the first week of August 2025 stood at 561 million. Collectively, these accounts make for Rs 2.64 trillion, with an average account balance of Rs 4,726. The number of RuPay credit cards issued to such beneficiaries is 385.9 million. Linking RuPay cards to PMJDY accounts had multiplied digital transactions. Public sector banks have played a spectacular role in this movement. They have opened 435.1 million accounts – 77.55 per cent of the total PMJDY accounts; followed by regional rural banks (105.6 million; 18.80 per cent), private banks (18.4 million; 3.30 per cent), and rural cooperative banks (around 1 million; 0.35 per cent)… Of the total PMJDY accounts, 66.75 per cent, or 374.4 million, are in rural and semi-urban India, and 33.25 per cent (186.6 million) are in urban India. Importantly, women outnumber men as beneficiaries. There were 312.7 million (55.70 per cent) women beneficiaries in the first week of August… 

Together, they have enabled direct benefit transfers (DBT) that deliver subsidies and welfare with laser precision — no middlemen, no leakage. The DBT coverage exploded from 28 schemes in 2013-14 to 323 schemes in 2024-25, and the quantum of funds transferred zoomed almost 10-fold during this period – from Rs 7,400 crore to close to Rs 7 trillion. A contributing factor to the growth of digital transactions is the RuPay card. The 386.8 million such cards issued under the PMJDY scheme, the installation of millions of POS machines, and the mobile-based payment system have together boosted the financial inclusion drive. On an average, a bank’s branch now serves 7,100 people… As of January 2025, 21.17 per cent of PMJDY accounts were inactive.

12. India dairying facts of the day.

The average Indian milch cow, according to US Department of Agriculture data, produced 1.64 tonnes of milk in 2024. The corresponding numbers were 4.60 tonnes for New Zealand, 7.33 tonnes for the EU and 10.97 tonnes for the US... The US, incidentally, had a mere 24,470 dairy farms producing milk from 9.3 million cows in 2022. India has upwards of 50 million farmers engaged in dairying with some 110 million milch cows and buffaloes.

13. Very good article that makes that highlights why the US tariffs against India for purchases of Russian oil are hard to justify

Analysis of Chinese data by Energy Aspects estimates that China’s buying of Russian oil via various means increased from 1.5 mb/d before the war to above 2 mb/d, with several grades of oil bought above the price cap. China does not have the refining capacity to absorb significantly higher volumes of Russian oil than they used to buy. Thus, geographically India became the logical clearing country for the Russian barrels... Have Indian refiners gained somewhat from discounted Russian oil? Yes, they have, as initial discounts ballooned to above $20 versus the Dubai benchmark, although higher costs of shipping following sanctions reduced the discounts India received. However, these discounts were also enjoyed by China, Turkey and Brazil (which buys Russian diesel) alike. And since 2022, India’s refinery production has barely risen on average and product exports are fairly steady as domestic demand has been rising and absorbing the increase. The challenge is that, if the west is serious about sanctions on either Russia or Iran or both, it will have to contend with the loss of more than 6 mb/d of crude, a number that is much larger than Opec+ spare capacity. This would lead to a surge in oil prices, probably to well above $100 — a level that Trump and Europe would be likely to balk at.

14. Australian web-design software company Canva eyes an IPO.

Founded in 2013, Canva develops web-based design software that is widely used in schools and large companies to prepare presentations. It is one of Australia’s most valuable technology companies, alongside enterprise software developer Atlassian, and is backed by the country’s main venture capital funds including Blackbird, Square Peg and Airtree. Its latest share sale boosts its valuation from $32bn last October and comes after its rival Figma listed in the US last month, spurring rumours that Canva may be plotting an initial public offering soon. The company said in June it had 240mn active users a month and annualised revenue — a metric used by start-ups to project full-year revenue based on a recent month’s sales — of $3.3bn. Figma made $749mn in revenue last year and had 13mn active users a month in the first quarter of this year, according to its IPO filing. The company priced its shares at $33, and the stock now trades at $69.41, valuing it at $34bn.

Where's India's Canva equivalent?

15. End of Fed independence?

Trump’s imprint is already present at the Fed. Two of its seven board members, Christopher Waller and Michelle Bowman, were selected by him during his first term in office. This month, Adriana Kugler, who was tapped to be governor by former president Joe Biden, announced she was stepping down before the end of her term next year, prompting Trump to pick Stephen Miran, one of his closest economic advisers, to succeed her. If Trump succeeds in ousting Cook, whose term runs to 2038, it would give his nominees control of the seven-member board of governors. Moreover, the presidents of the 12 regional Feds, all of whom serve five-year terms, will need to be renewed at the end of February 2026. The decision to renew their terms lies with the Fed’s board.

16. The Netherlands leads the way with four-day week becoming common.

Average working weekly hours for people aged 20 to 64 in their main job are just 32.1, the shortest in the EU, according to Eurostat. It has also become increasingly common for full-time workers to compress their hours into four days rather than spread them over five... In spite of its shorter average working hours per person, the Netherlands is one of the richest economies in the EU in terms of GDP per head. That is because shorter working hours are combined with relatively high productivity per hour, and a high proportion of people in employment: 82 per cent of working-age people in the Netherlands were in employment at the end of 2024, according to OECD data, compared with 75 per cent in the UK, 72 per cent in the US, and 69 per cent in France. Women, in particular, have high employment rates in the Netherlands, especially compared with countries like the US, where average working hours are longer. In addition, people in the Netherlands tend to retire fairly late... children in the Netherlands rank as the happiest in the rich world.

17. On China's rare earths grip over the world economy.

China has built up this strategic strength over many decades. In 1987, Deng Xiaoping, then the country’s leader, remarked: “The Middle East has oil. China has rare earths.” In reality, rare earths are found all over the world. It is China’s willingness to commit to the often filthy business of mining and processing critical minerals — and the rare earths that are a vital subset of them — that has given Beijing its near monopoly. As a result, the country is thought to mine around 60-70 per cent of the world’s rare earths and control around 90 per cent of their processing and refining. The west has long been aware of the theoretical dangers of its reliance on Chinese rare earths. As one Trump administration official told me: “We’ve sat around admiring this problem for decades.” His view is that the west was stymied by a mixture of environmental concerns and a reluctance to sanction state intervention in the market.

18. Some facts on foreign portfolio investments in India.

India has now gone five years with zero net foreign inflows into the public equity markets, an incredibly long time. This year too, flows are running at a negative $13 billion. Foreign ownership of Indian equities is at a 15-year low. India is now a consensus sell, with regional, global, and emerging market (EM) funds all underweight. In the same five years, domestic flows have exceeded $185 billion. Just as foreign investors have lost interest, domestic investors have never been more bullish... 

A hundred dollars invested in EM equities 15 years ago is today worth $180, compared to almost $500 if it had been invested in global indices. Within this context, India has massively outperformed. Over the past five years, MSCI India delivered dollar returns of almost 15 per cent per annum, compared to just 5 per cent for the broader EM index. 
Many investors have lost faith in the EM asset class, cut exposure, and India has been a funding source, given its relative outperformance.

19. H1B Visa facts.

In fiscal year 2023, more than 72 per cent of approved H-1B petitions were for Indian nationals, far outpacing China at 11.7 per cent. Currently, the annual H-1B cap stands at 65,000, with an additional 20,000 slots reserved for holders of advanced US degrees, all allocated through a lottery system.

20. Finally, Nvidia valuation fact.

Add up analysts’ estimates of the next five years’ worth of free cash flows, discount them back at a 10 per cent rate, and they total just $650bn. In other words, the remaining $3.8tn of enterprise value represents cash arriving from 2030 onwards. That “terminal value”, in analyst-speak, would be justified if Nvidia’s free cash flow were to grow at a 6 per cent annual rate for the rest of time, Lex calculates. But that’s a punchy assumption. Some of Nvidia’s customers are already designing chips of their own. Its 72 per cent gross margin, far ahead of anything ever reported by Apple, is an open invitation to competitors... Huang is optimistic. He believes, for example, that companies could earmark $4tn for AI infrastructure by 2030, much of it to buy servers incorporating Nvidia’s Blackwell, Rubin and Vera chips.