The McKinsey Global Institute have an informative report that highlights the role of a few large firms in driving national economic productivity growth. It analysed 8,300 large firms covering two-thirds of GVA in four sectors—retail, automotive and aerospace, travel and logistics, and computers and electronics—in three countries (Germany, the UK, and the US) over the 2011-19 period.
This research finds that a relatively small number of firms making bold strategic moves generated the majority of productivity growth in the period we studied (2011-19), in powerful bursts rather than in a smooth trickle of gradual change, and through strategic moves, top-line growth, and portfolio shifts more than efficiency gains. This was a more concentrated, dynamic, and sporadic pattern than existing literature tends to highlight, with progress on productivity being defined by a few firms moving a mile rather than many firms moving an inch. Single firms can move the productivity needle for entire economies—the “power of one”…
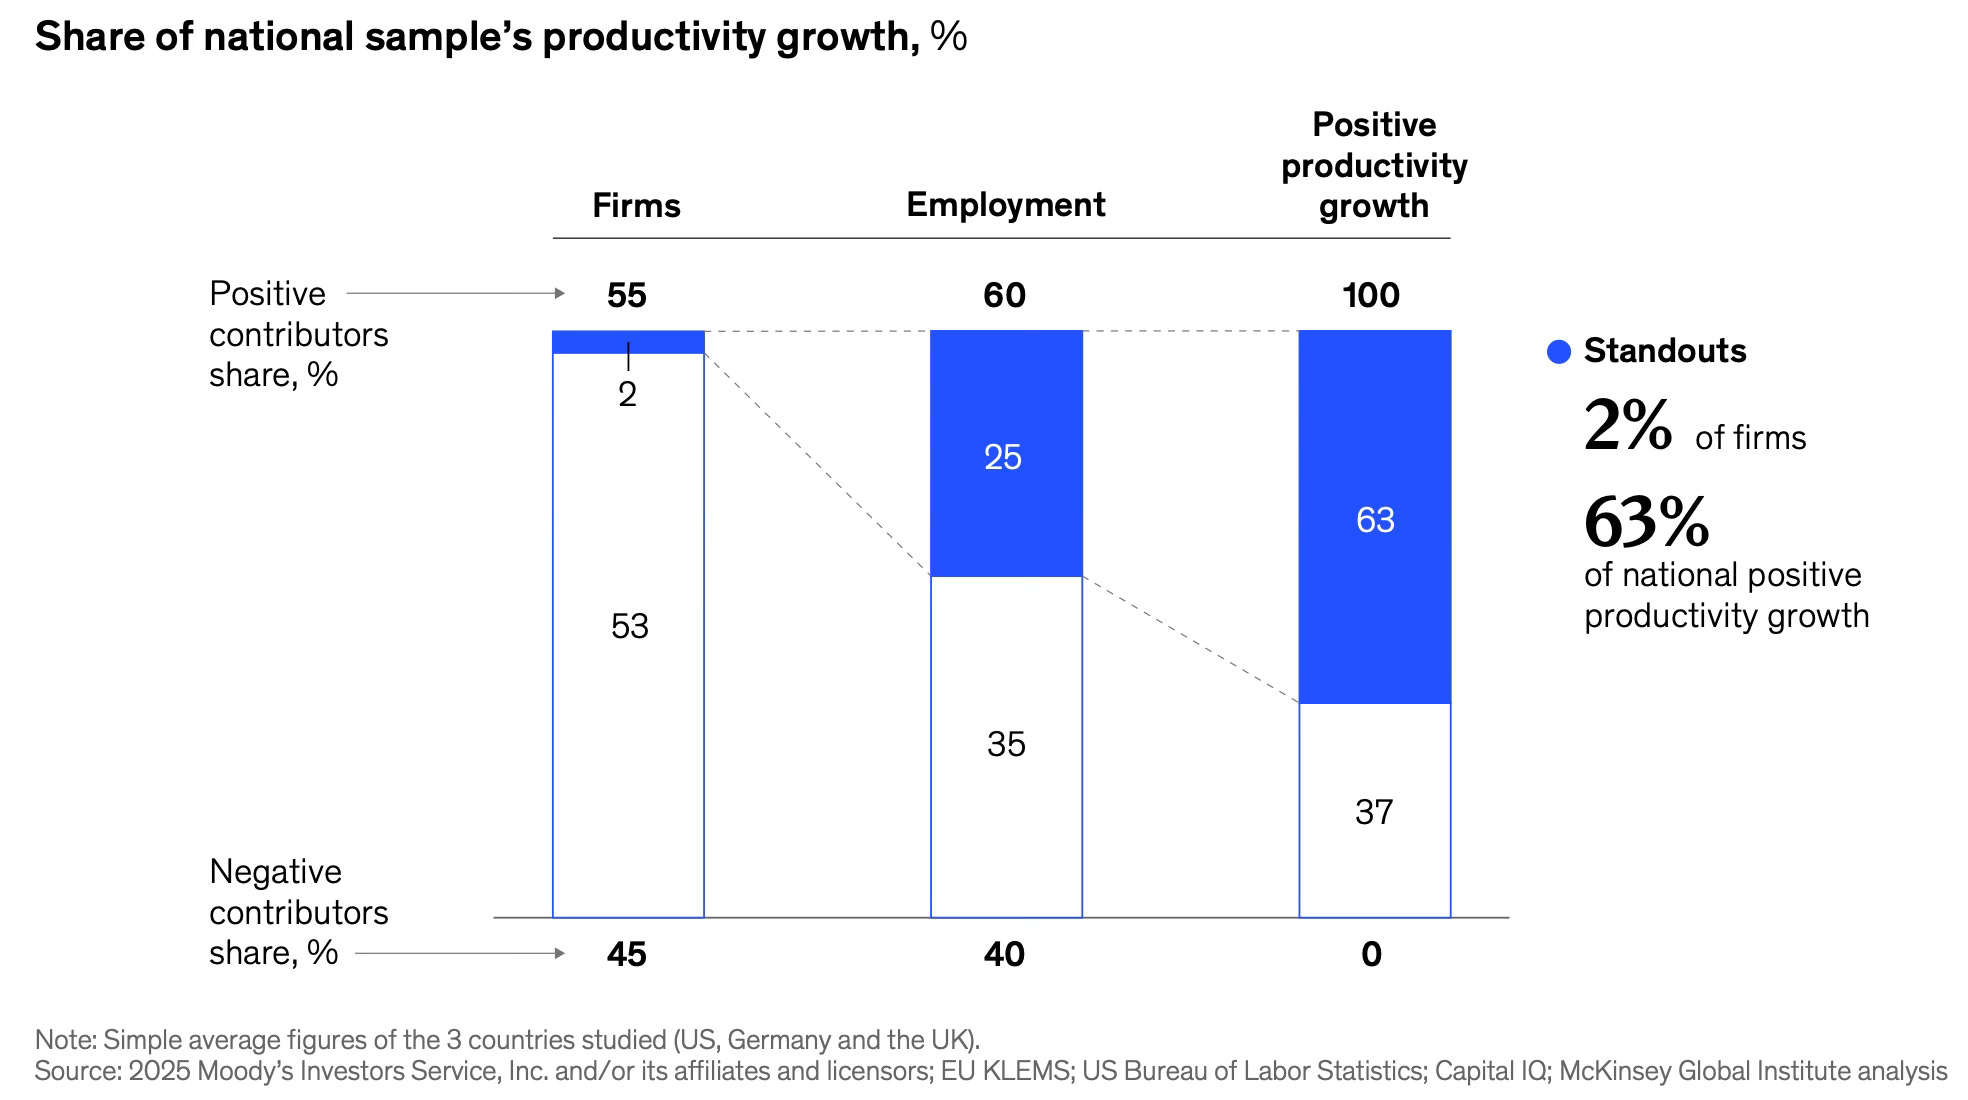
Fewer than 100 firms in our sample of 8,300—a group that we have dubbed Standouts— accounted for about two-thirds of the positive productivity gains in each of the three country samples we analysed. Standouts are defined as firms that added at least one basis point to their national sample’s productivity growth.
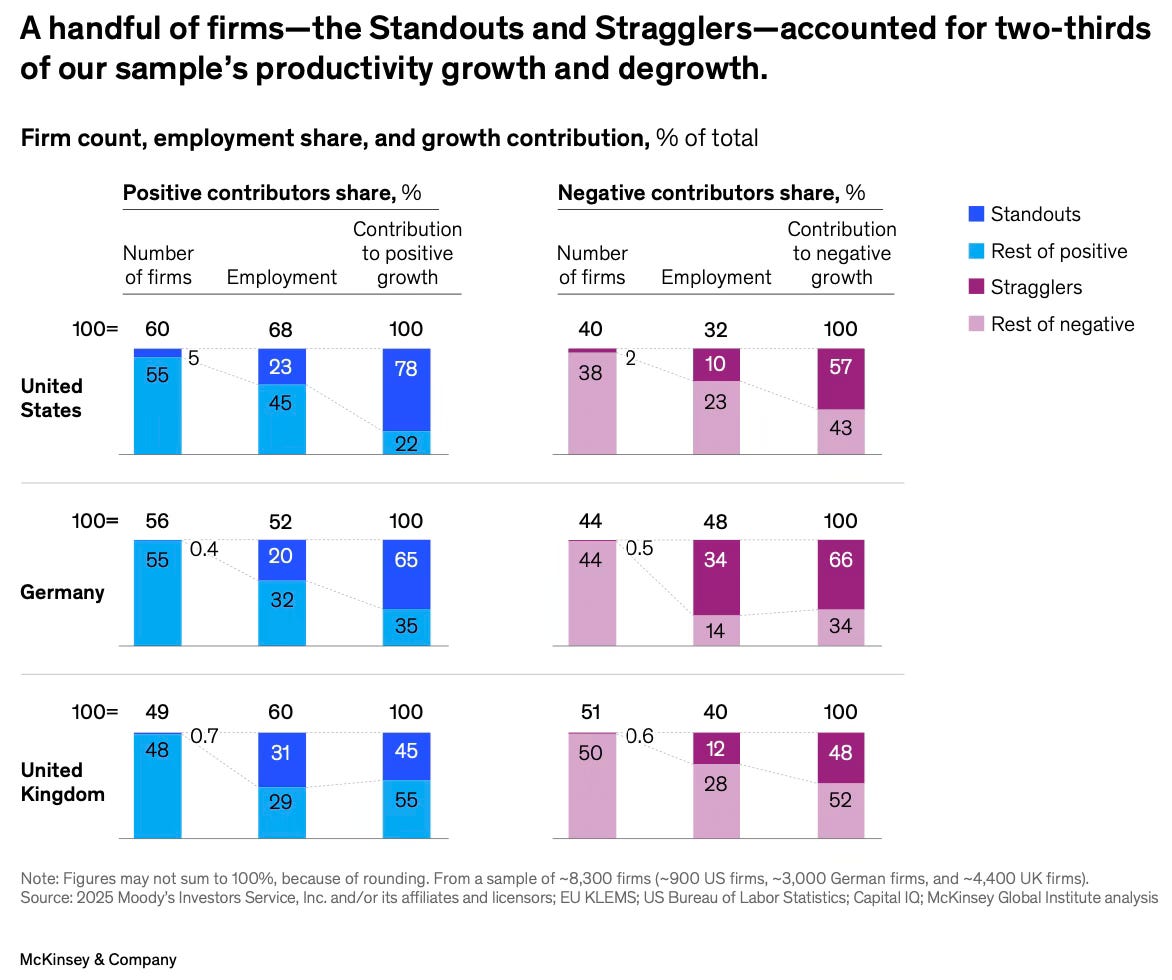
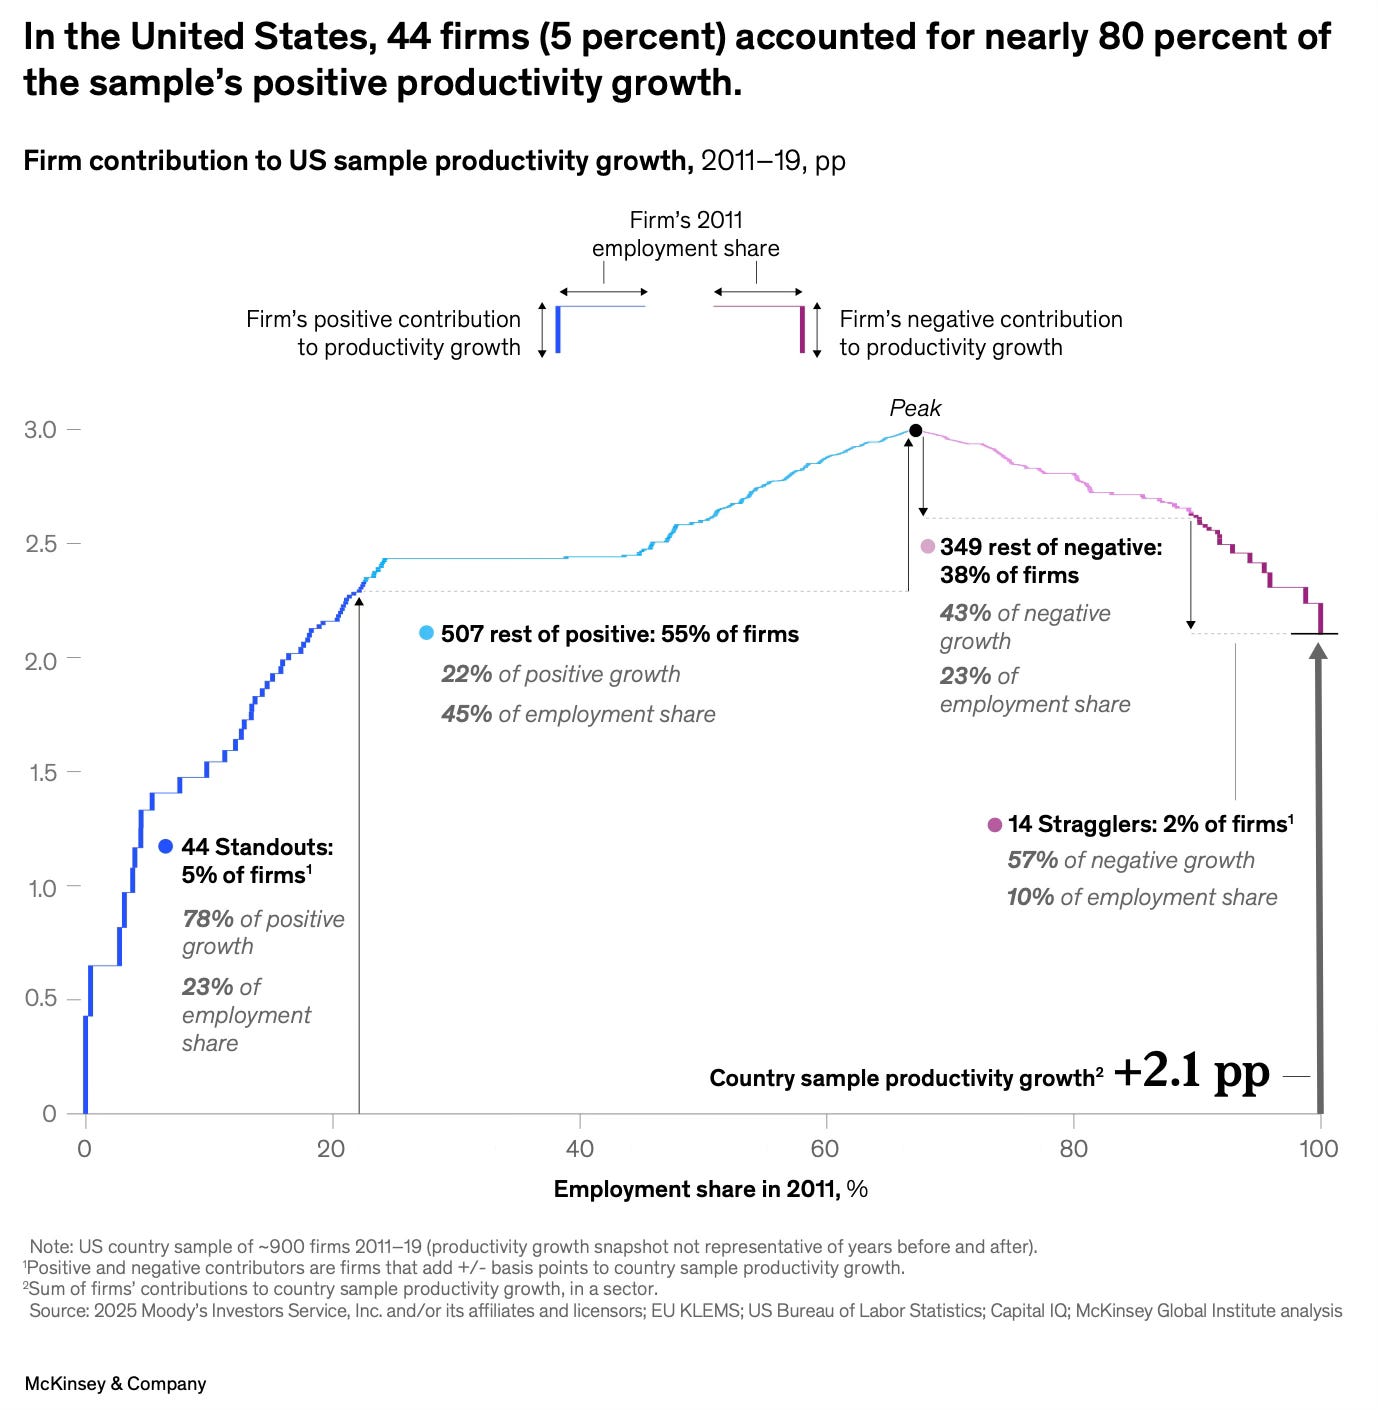
The number of firms that were responsible for the largest drags (negative contributions of at least one basis point) on productivity growth—we call them Stragglers—was even smaller. Only 55 Stragglers accounted for 50 to 65 percent of the firm-level productivity drag in the three country samples… In the United States, for instance, 44 Standouts—5 percent of sample firms, accounting for 23 percent of employment share—generated 78 percent of positive productivity growth. And 14 Stragglers—2 percent of sample firms, accounting for 10 percent of employment—were responsible for 57 percent of negative growth…
The ratio of Standouts (and their contribution) to Stragglers (and their drag) was the clearest factor in driving fast productivity growth. In almost all subsectors experiencing rapid productivity growth (defined as 2 percent per year or more), Standouts drove the bulk of that growth, and there was less drag from Stragglers… Standouts drive the growth of sectors, but some sectors also have the market dynamics, technology, regulation, and competitive setting that provide fertile ground for Standouts. There were more Standouts in sectors where firms could create new customer value and scale new business models than in sectors that were mostly about efficiency. For instance, the US computer and electronics sector came with many scalers and disruptors…
Productivity grows in powerful bursts as firms find new ways to create and scale new value. Think Apple expanding into services, easyJet shaping the discount airline trend, and Zalando pioneering apparel e-commerce. This is not the efficiency transformation nor the gradual diffusion described by conventional wisdom… In the United States, the most productive firms expanded and unproductive firms restructured or exited. This contributed half of US sample productivity growth while sticky underperformers dragged down growth in Germany and the United Kingdom. This fresh view of productivity growth calls for a new playbook. It suggests focus on the power of the few more than the broad swath, on value creation more than efficiency, and on reallocation of resources to leading businesses.
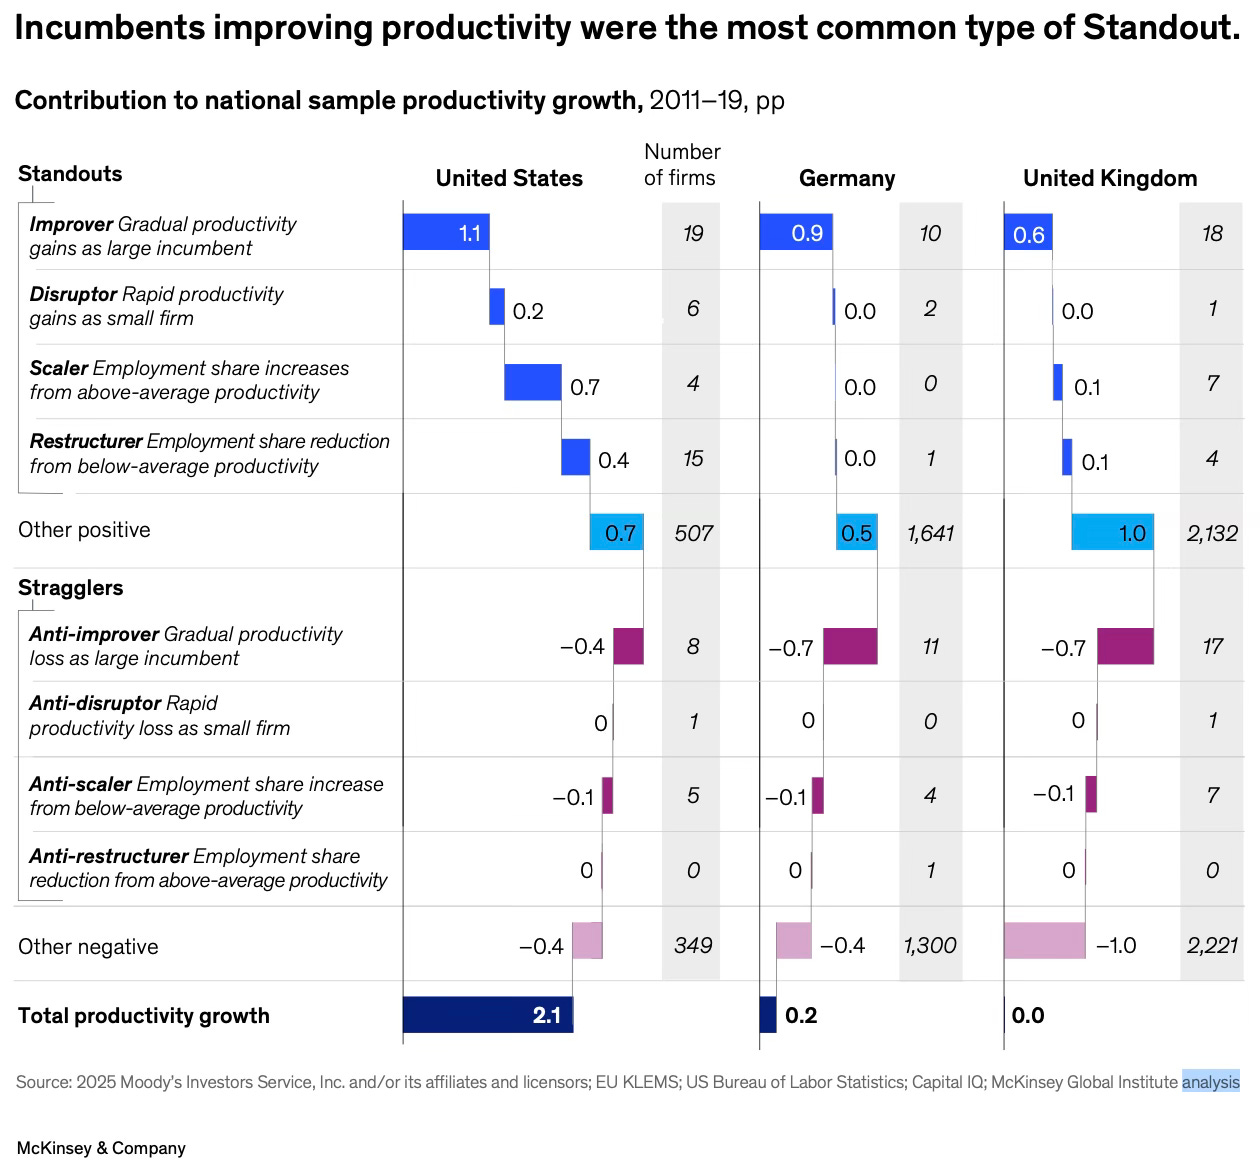
The report analyses the Standout category of firms
Improvers—large firms that mainly contribute by advancing their productivity levels—made the largest contribution to productivity growth. Disruptors, or small firms that grew productivity and share very rapidly, actually made the smallest contribution. Scalers, which were already far above the sector’s average productivity and grew their share of employment, and therefore drove productivity growth mostly via employment reallocation, made the second-largest contribution. Restructurers are less productive firms that made a positive contribution by losing market share and employment to more productive firms or exited altogether…
Large firms did not make an outsize contribution for their employment share. For example, in the United States, the top 10 percent of firms by size that made positive contributions had 54 percent of the employment share but accounted for only 68 percent of positive productivity growth. Meanwhile, US Standouts had a 23 percent share of employment but accounted for 78 percent of positive growth… MSMEs collectively accounted for less than one-third of productivity growth. In short, in our sample, a handful of Standouts out of a million firms would account for more than half of productivity growth. This is a much more extreme concentration than commonly appreciated. Some Standouts remain Standouts over long periods, but many change over time. With limited sample, we find that about two-thirds of Standouts in 2011–19 remained Standouts in 2019–23.13 The other one-third fell back, while new firms emerged as Standouts—including former Stragglers turning around.
This graphic disaggregates among Standouts and Stragglers.
Another insight from the report is the dynamics of productivity improvements. It happens in short bursts rather than at a gradual pace, more in the form of doing things “differently” than “more efficiently”. It states that Standouts used a combination of five types of moves to increase productivity, four of which related to scaling productive businesses or finding new ways to create value, and only one is primarily about efficiency and cost…
1. Scaling more productive business models or technologies. Examples include Apple shaping the mobile internet wave, Amazon shaping e-commerce, Zalando successfully scaling e-commerce in apparel, and easyJet helping to set the low-cost carrier trend.
2. Shifting regional and product portfolios toward the most productive businesses or adjacencies. Examples include doubling down on product lines that have higher customer value relative to the hours needed, such as Nissan expanding electric vehicle (EV) offerings in automotive, and other players doing likewise for SUVs; Apple and Broadcom shifting their product portfolios to higher-margin services; General Motors exiting unprofitable geographies; and Amazon venturing into cloud computing through Amazon Web Services (AWS).
3. Reshaping customer value propositions to grow revenue and value added. This strategy can be effective in both high-end niche segments and mass markets, and it often comes in response to trends or competitive attack. Examples in mass markets include US retailer The Home Depot improving customer experience both in-store, with a wider assortment and denser network, and online, integrating buying online and picking up in-store; and UK supermarket chain Tesco responding to pressure from hard discounters in addition to cost reduction, portfolio adjustments, and price reductions by improving the premium assortment offering and fully leveraging its convenient locations. US airlines including Delta and American Airlines provided distinct value propositions and value-added services to loyalty customers. In niche segments, examples include Nvidia building a winning value proposition for graphics processing units (GPUs) and scaling it up; Zeiss providing cutting-edge tech in extreme ultraviolet (EUV) lithography; and Danaher in high-tech life sciences.
4. Building scale and network effects. Examples of firms offering more for less include Amazon scaling its fulfillment capabilities to make them available to more shoppers and partner retailers; logistics conglomerate Hapag-Lloyd driving growth through acquisitions and geographic expansion; and US airlines improving route networks and aircraft capacity utilization, including through mergers.
5. Transforming operations to raise labor efficiency and reduce external cost at scale. Examples include Tesco’s multibillion-pound cost-reduction program (in addition to competing on price and quality with discounters) and easyJet’s fleet modernization to reduce operating cost (alongside shaping a winning customer value proposition). While this is the lever most commonly associated with productivity growth—at least among businesses—it was very rarely the most important one in our case studies.
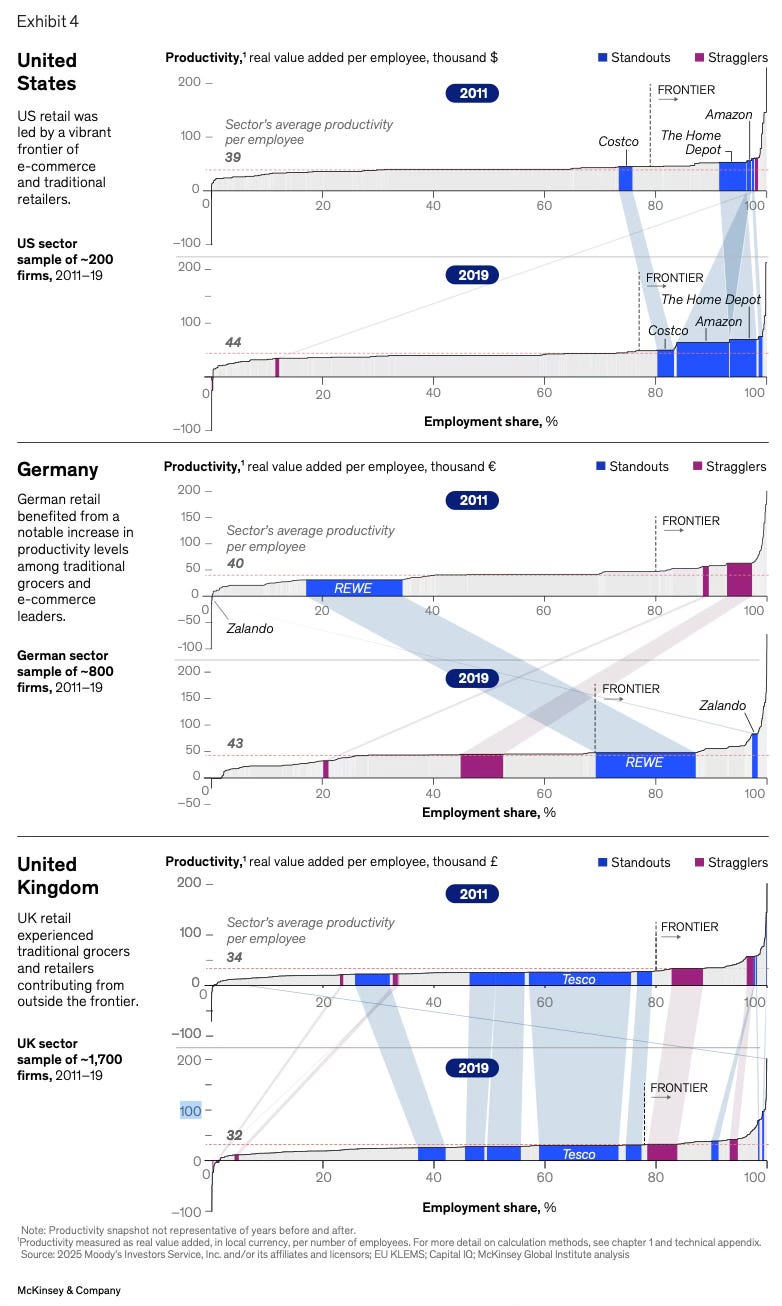
The report shows that beyond the presence of Standouts and absence of Stragglers, subsectors and countries that experienced rapid productivity growth were also characterised by frontier firms contributing disproportionately; leaders pulling ahead drove rapid subsector growth as often as laggards catching up; and employment reallocation from lagging to leading firms mattered nearly as much as productivity advances within firms and more than new entries or exits… Firms leaving or entering the market—traditional creative destruction—mattered less. It is notable that, in virtually all positive-growth subsectors, exits added to growth, sometimes substantially, while in almost half of these subsectors, entries detracted from growth. New entrants proved too small or unproductive to leave a mark during the 2011–19 snapshot period.
The graphic below captures the contributors to productivity growth in the three countries studied.

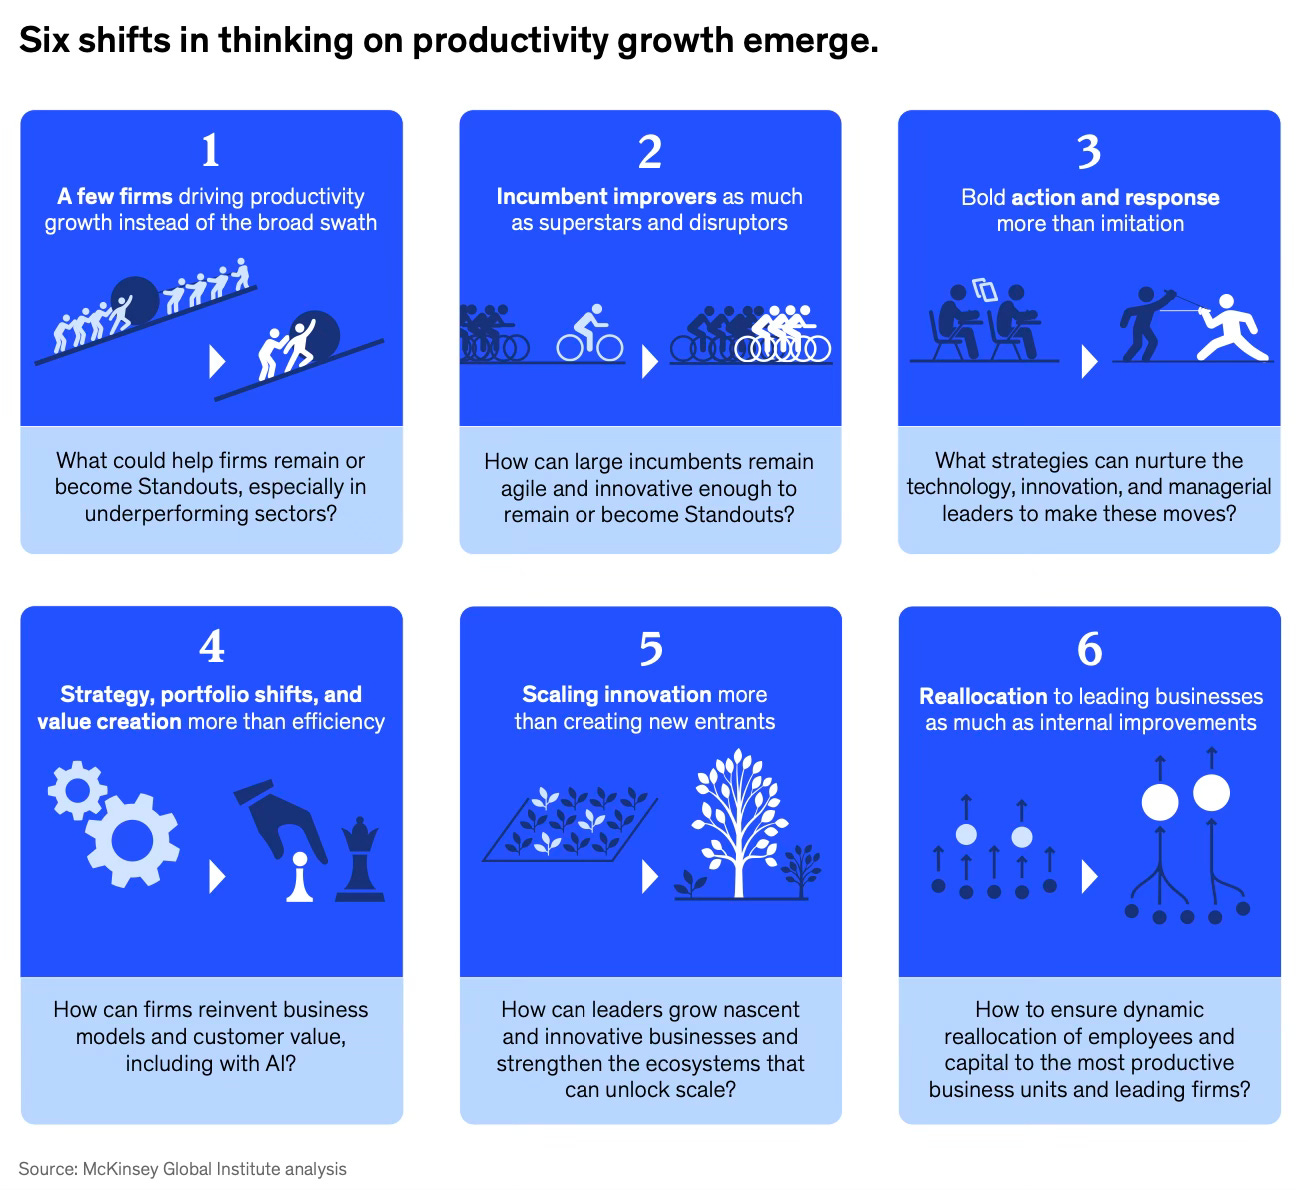
The report concludes by pointing to six shifts in the thinking on productivity growth.
Apple is a good illustration of these trends. This is an illustration of Apple’s productivity improvements in the 2011-19 period.

And this shows how it translates to national economic productivity growth. A and B constitutes the firm productivity contributor and C and D form the reallocation efffect.

The overarching takeaway from this report is that a handful of big firms, through bursts of activity, drive productivity growth. However, it may not be accurate to generalise this across countries and times.
This analysis is confined to three advanced countries - Germany, the UK, and the US - and the period from 2011-19. In these countries, the baseline of productivity is already high, including among the SMEs (which constitute the overwhelming majority of firms). In these conditions, meaningful increases in productivity can come only from step-change innovations in technologies, practices, business models, etc. Such step changes will generally be led by a few first movers who will benefit from the productivity increases. Given that the information technology sector is the main likely contributor to any growth in our times, it’s a stark reality that large incumbents are likely to be the first adopters of emerging innovations and likely beneficiaries. Others benefit in due course with the gradual diffusion of productivity across them.
I’m not sure this story would apply to developing countries like India. In these countries, the baseline of productivity is very low, and there are disproportionately few medium and large-sized firms. Significant productivity improvements can therefore come both from increased overall baseline and from the growth of middle and large firms. And given the lower baseline of productivity, the pipeline of innovative technologies, practices and business models available for adoption will be much longer, and their diffusion is likely to happen quicker across a larger subset of firms.
This explanation does not contradict the argument about the importance of big firms in contributing to knowledge spillovers by forcing their suppliers to adopt newer technologies and practices, and generally in focusing on quality improvements. The role of Apple in the general improvement of manufacturing quality in China is a good example.
No comments:
Post a Comment