Substack

Showing posts with label RBI. Show all posts

Wednesday, April 29, 2026

Some thoughts on the RBI's exchange rate management policy

The pressure on the rupee in the aftermath of the Gulf War has generated considerable attention and discussion. I have blogged here on the implications of the Gulf War on India’s external account. 

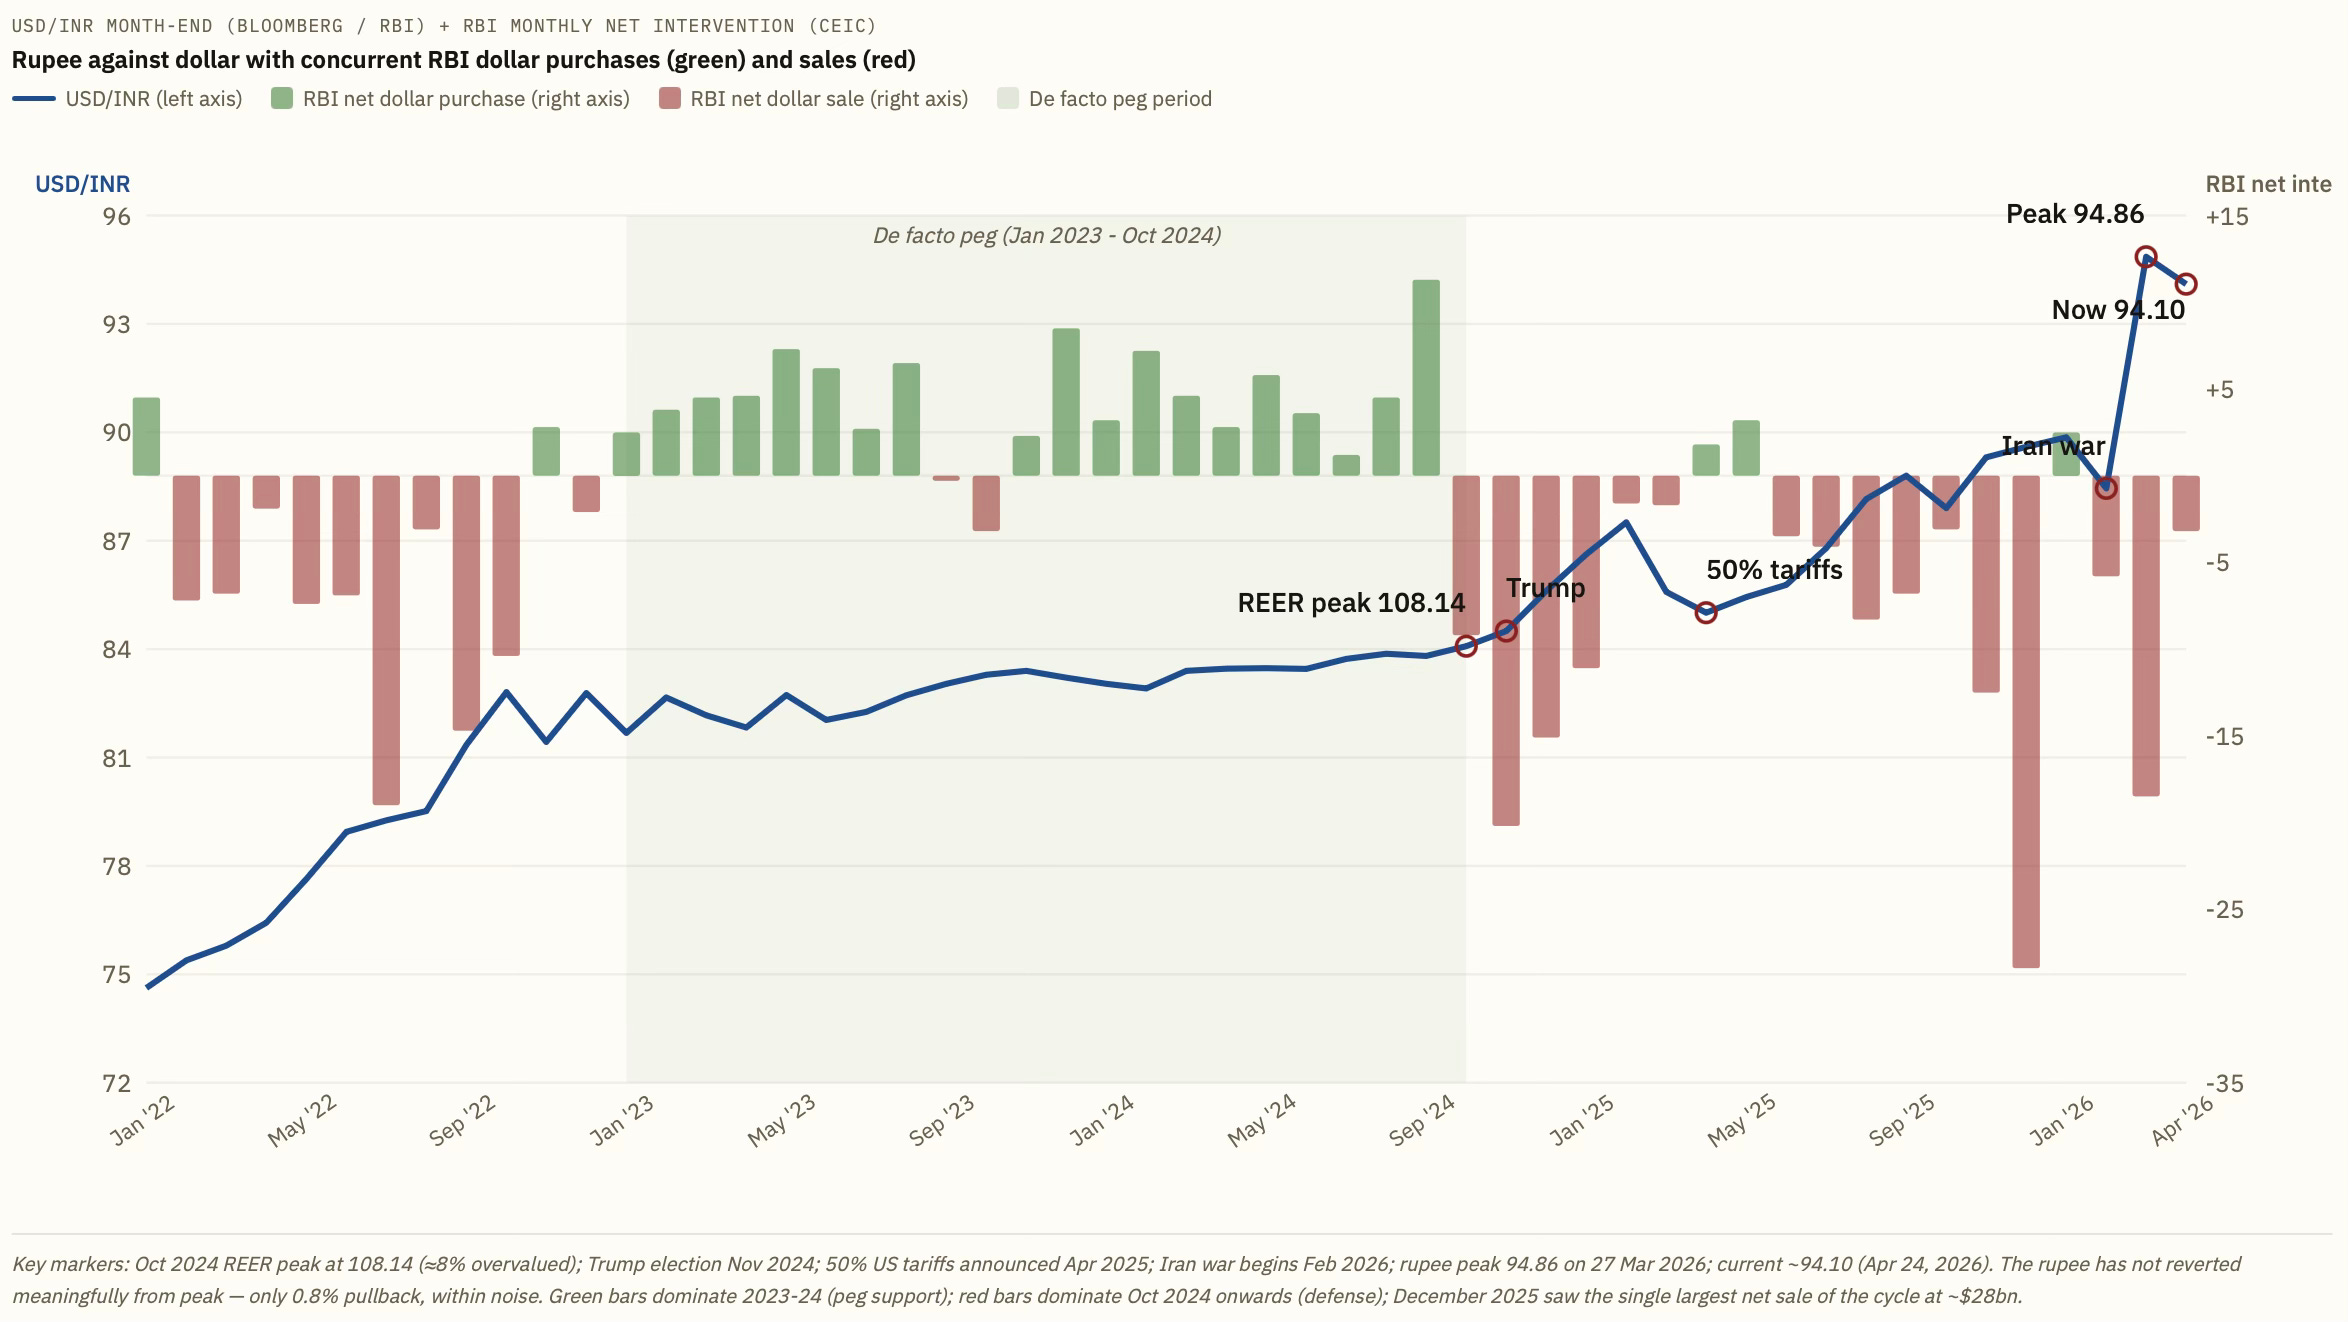
This may also be a good time to examine the dynamics driving the rupee downward. The rupee’s weakness is nothing new. Since the beginning of 2025, the rupee has been the weakest-performing EM currency, behind only the Turkish lira. As reported here, the rupee has weakened from 107 in early 2025 to 92 in the 40-country trade-weighted real effective exchange rate index, despite the RBI intervening heavily to backstop the decline. In fact, since October 2024, foreign investors have pulled out at least $45 billion, and their shareholding in Indian equities is currently at a 15-year low.

The graphic shows that the rupee held steady for two years, from at least the beginning of 2023 to the end of 2024, on the back of rupee purchases to prevent it from depreciating and find its level. In fact, compared to an annual USD-INR volatility of 5% in the 2000-22 period, the INR-USD volatility fell to just 1.8% during this period, the lowest in over 20 years, lower even than the 2000-2004 period when INR was effectively pegged! 
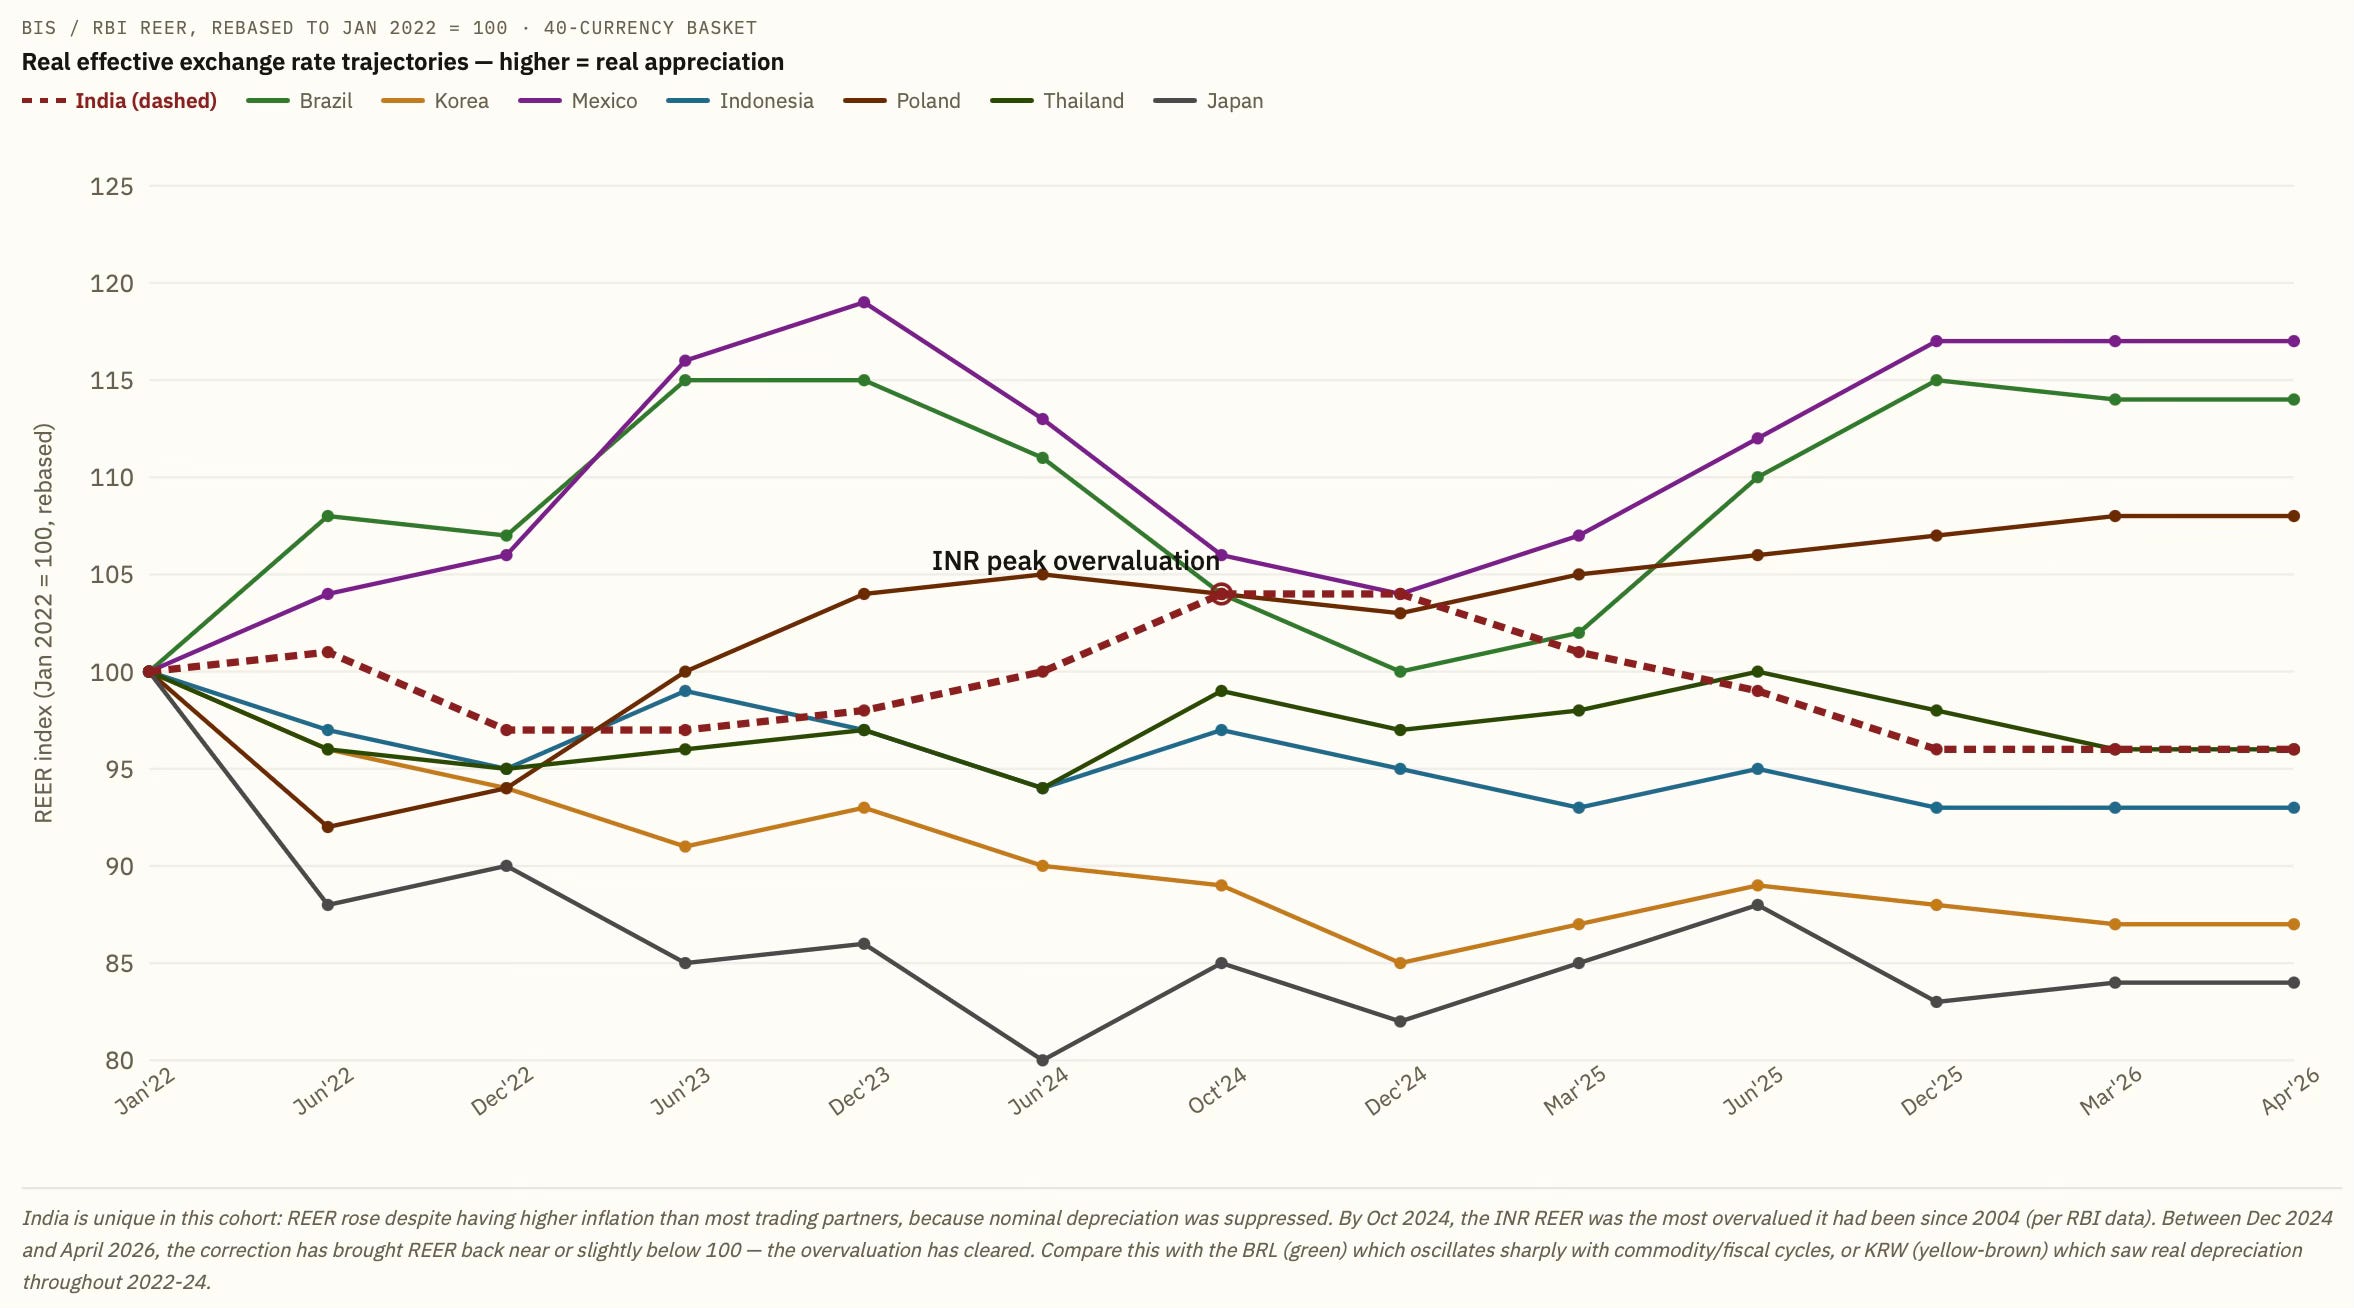
This drastic volatility suppression, combined with India’s higher inflation (CPI averaging ~5%) vs trading partners (2-3%), produced the biggest REER overvaluation build-up in the emerging-market universe during this cycle. The rupee’s 40-currency REER (base 2015-16) peaked at 108.14 in November 2024, and since then has depreciated sharply to below 95 by March 2026. This depreciation has been far in excess of any peer.
Similar trend is visible with respect to USD too. The rupee stands out for its unique flat trajectory through 2022-24 even as peers depreciated substantially in response to the Fed tightening cycle. However, since Oct 2024 the rupee has depreciated steeply, overtaking several peers.
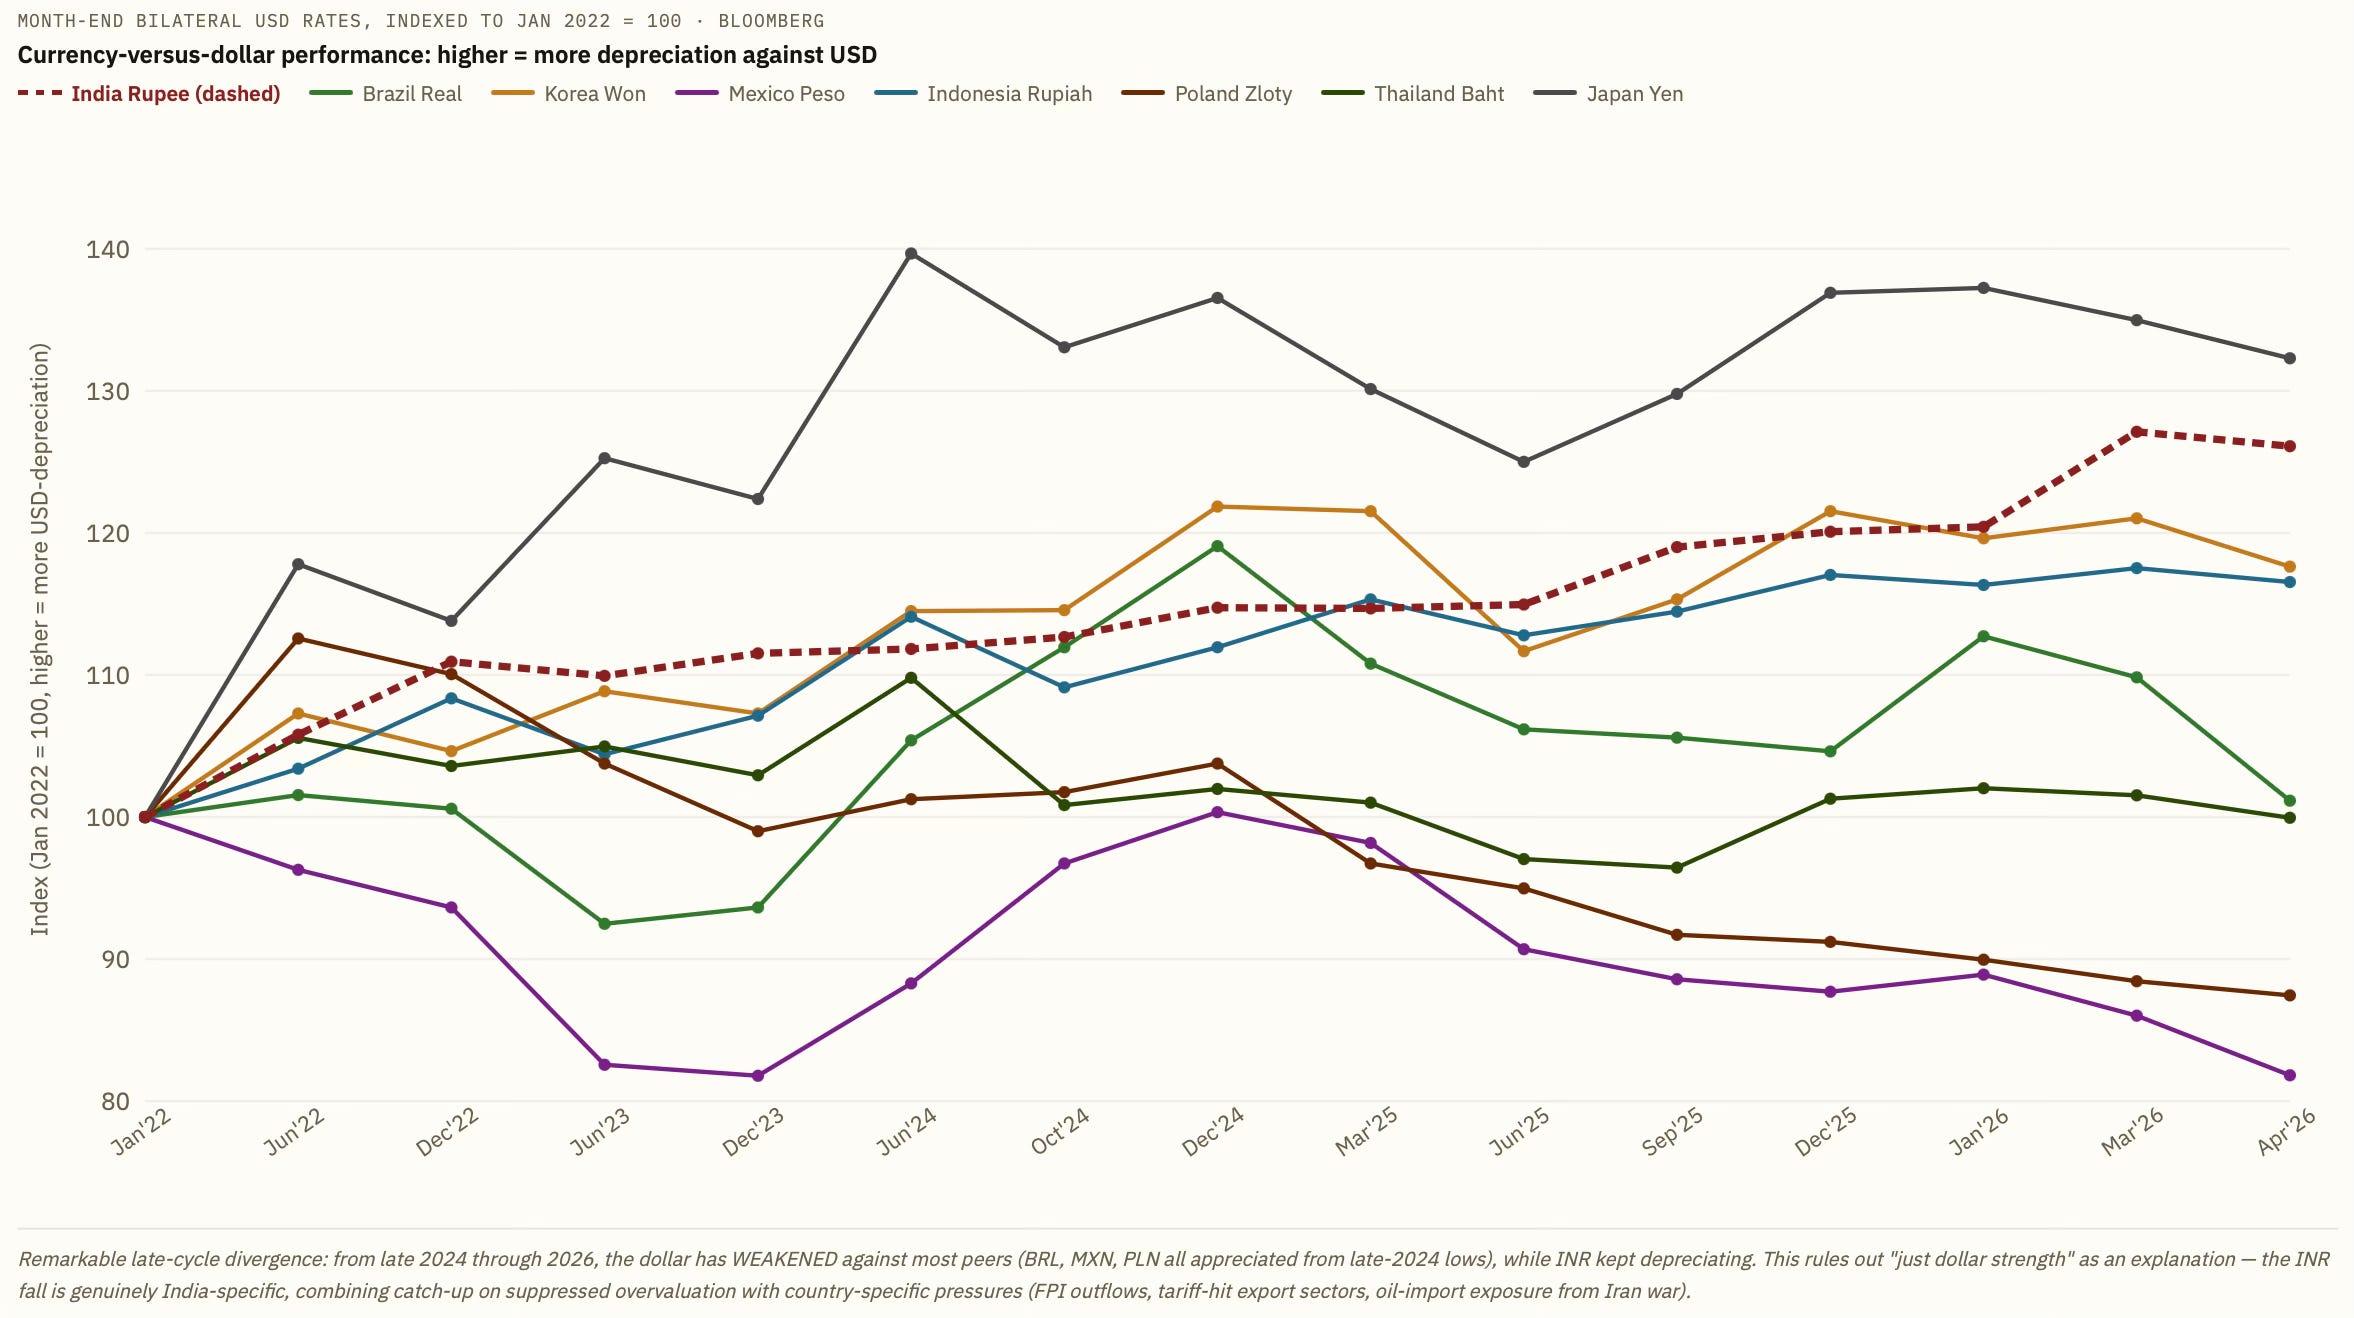
It becomes clear that the rupee was held artificially overvalued for over two years. This, by itself, should have been reason enough that pressure mounted for a corrective depreciation. In addition, there was the pressure from the spike in oil prices (and associated worsening of the external account, already weakening from the tariffs and FPI repatriation) and the general trend of risk-off and capital flight to the safety and liquidity of the dollar. 

By itself, the Gulf War would have put enough pressure on the currency. But its combination with the stress built up due to the forced overvaluation amplified the capital flight induced by the Gulf War, thereby exacerbating the pressure on the rupee and worsening the depreciation when it happened. 

The table below is a quantified decomposition of what drove the 11.9% depreciation. It shows two alternative decompositions at the peak (Mar 2026), which capture the overshoot moment, and at current levels (Apr 2026), after partial reversion. 
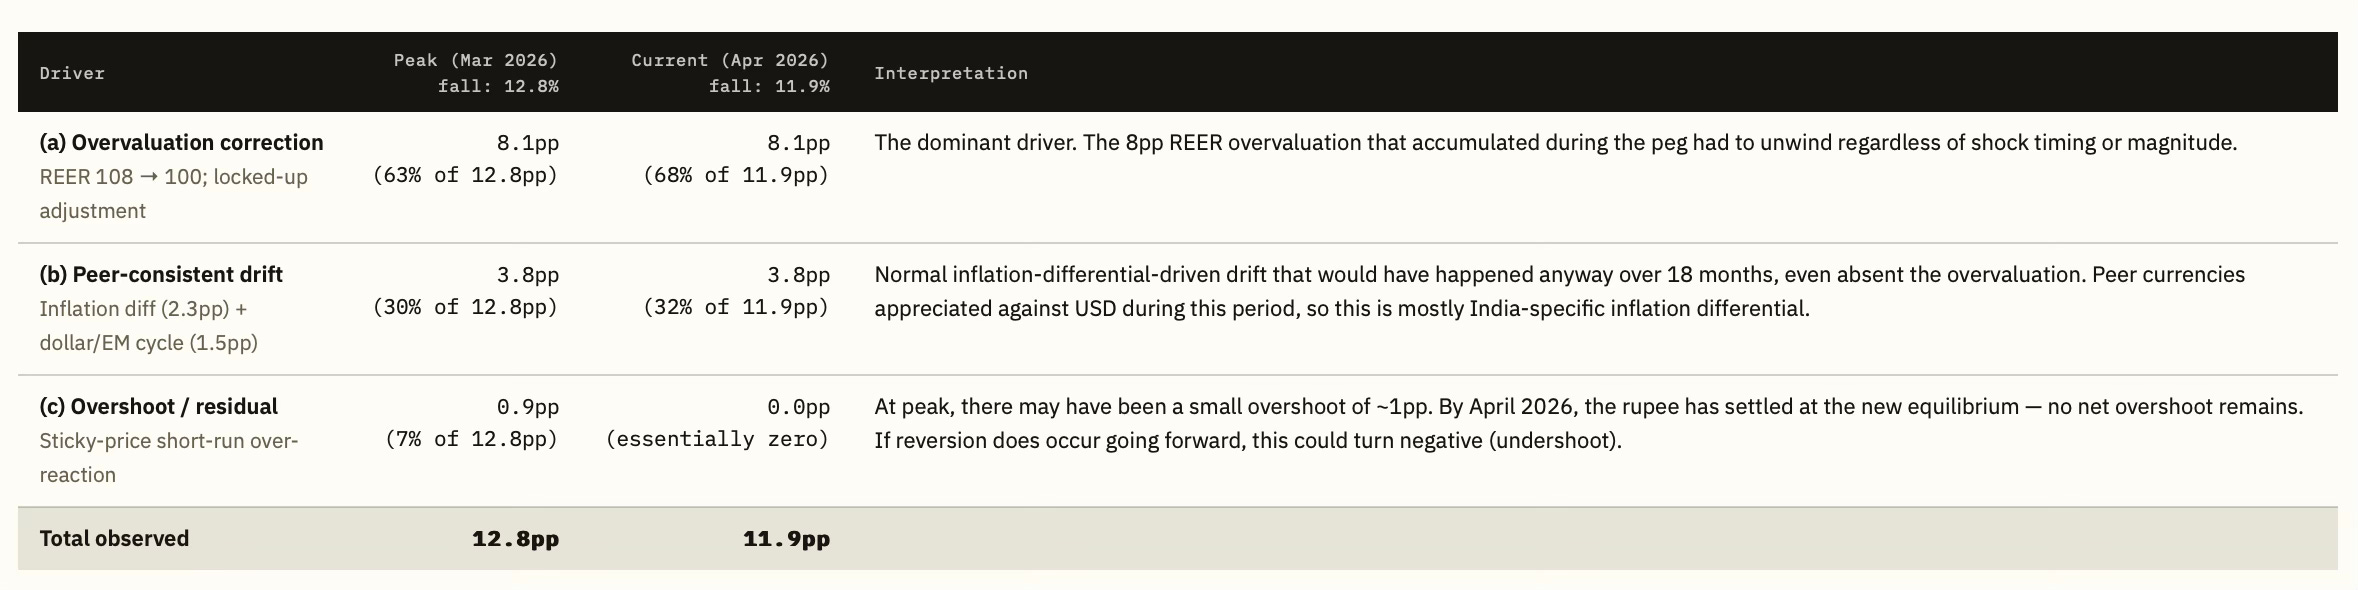
At peak (Mar 2026), the biggest driver by far was the overvaluation correction (63% of the fall), which is the “hidden cliff” the RBI’s peg concealed and which was unique to the rupee. The general market volatility (36%), experienced by all peers, was a secondary driver, reflecting genuine dollar/EM repricing. The net overshoot, at least till now, has been negligible.

Has there been a Dornbush overshoot? Rudiger Dornbusch's 1976 overshooting model predicts that when exchange rates are flexible, but goods prices are sticky, a monetary or policy shock causes the exchange rate to overshoot its long-run equilibrium before reverting. In simple terms, if the currency has been artificially propped up, the "stickiness" is extreme, and therefore, when the adjustment finally comes, the overshoot magnitude is larger than in a regime of continuous flexibility. However, the Dornbusch overshoot and reversion are not yet visible. The reversion might happen in the coming weeks.
So what are the lessons?

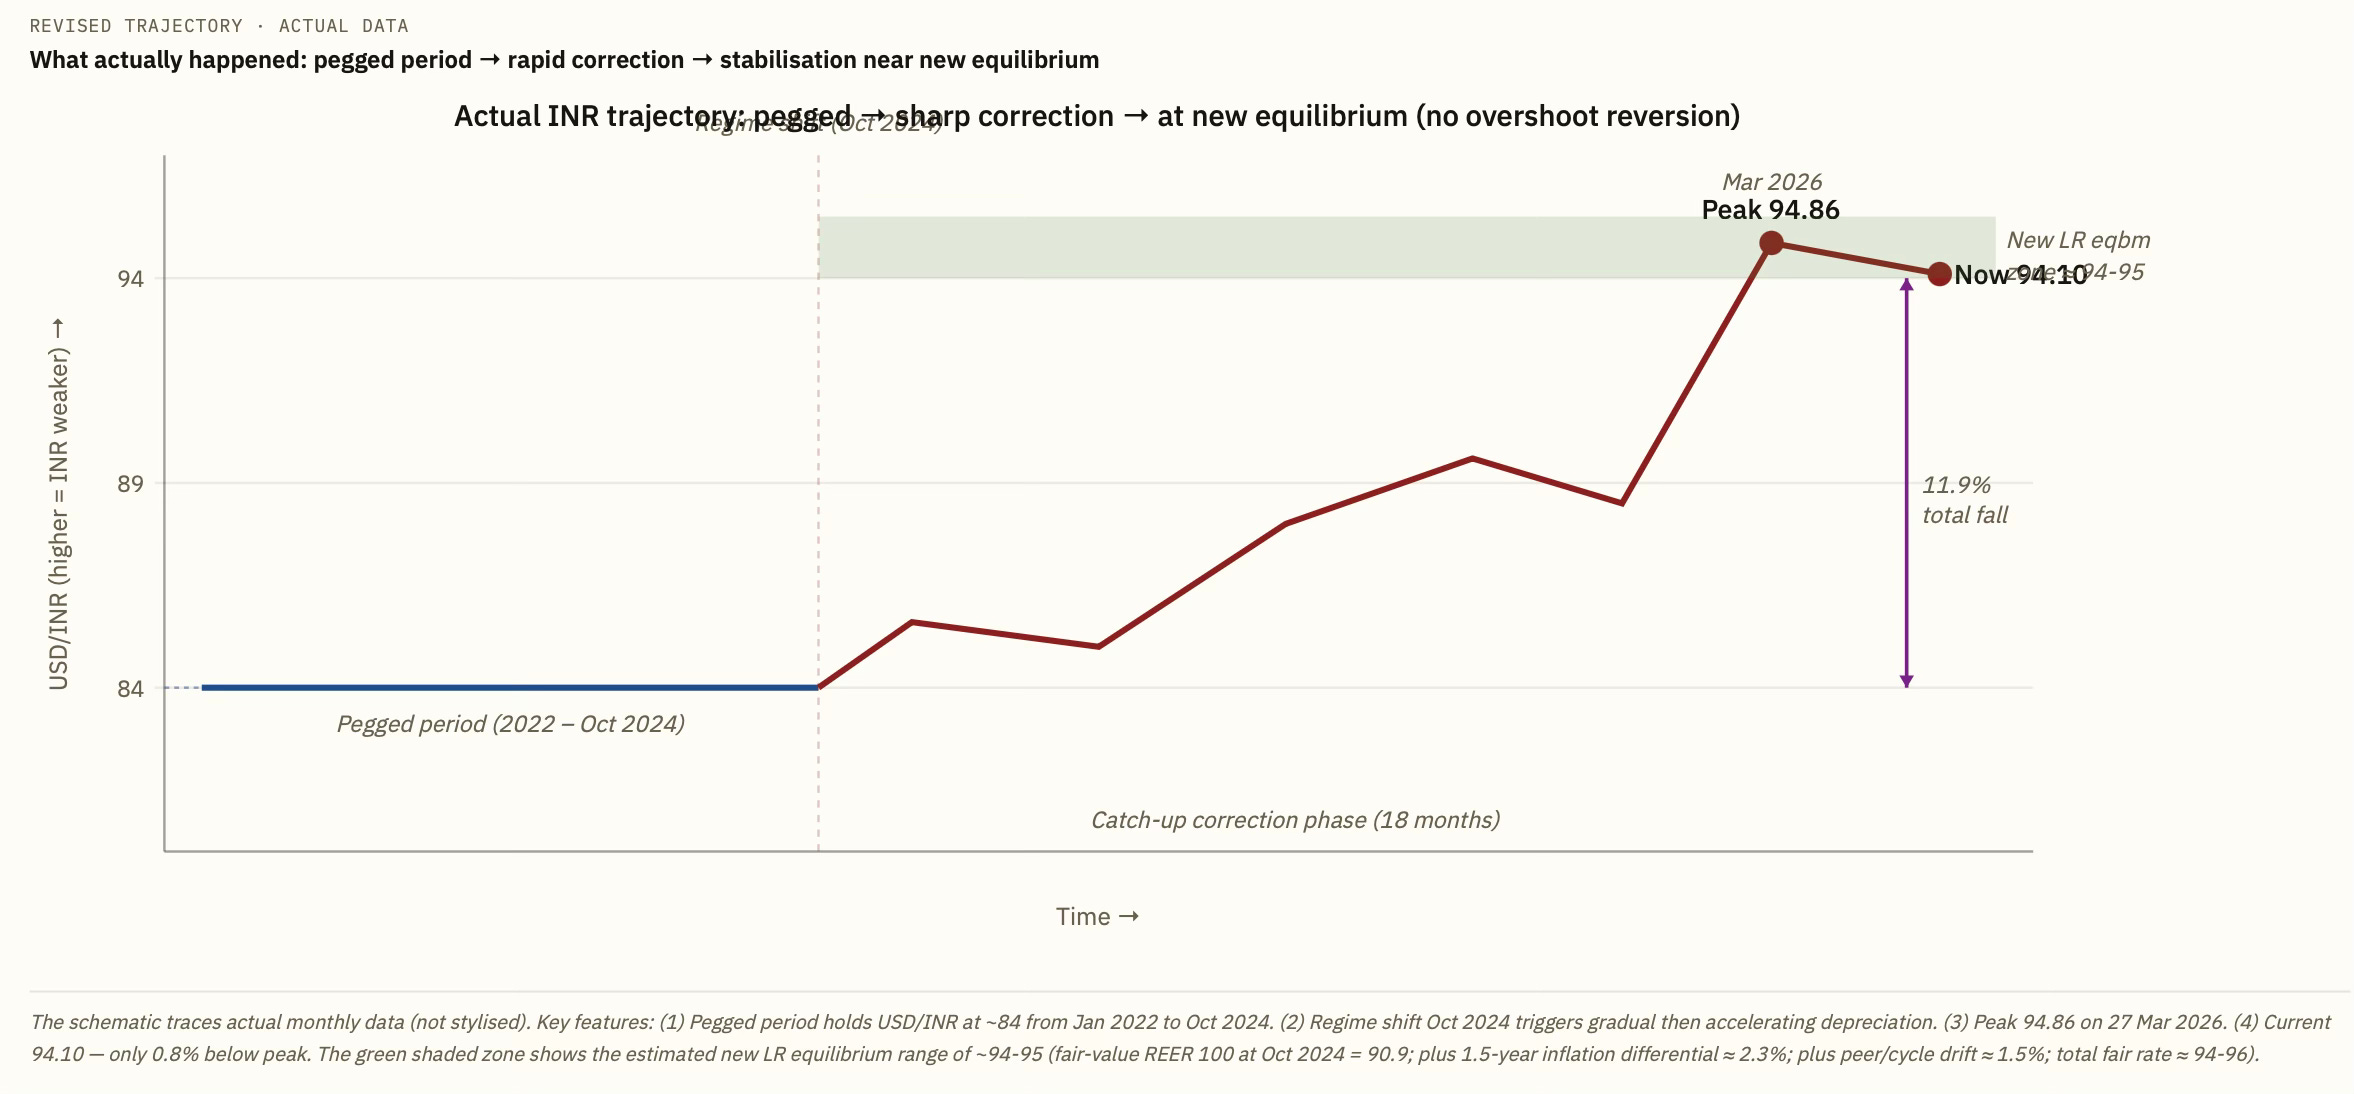
By maintaining the rupee as a de facto pegged currency from 2023 to October 2024, the RBI accumulated an 8% REER overvaluation that had to be corrected. When the regime shifted — Trump election, FPI outflows, US tariffs, Iran war — the correction was both deeper and faster than peers experienced, precisely because the catch-up component (8pp) was additive to normal drift (3.8pp). The rupee is now at or near its new equilibrium of ~94-95, down 11.9% from Oct 2024.

The RBI’s 2022-24 intervention pattern - buying ~$400bn in forex reserves while keeping the rupee rigid - converted exchange-rate risk into reserve-allocation risk. When the regime shifted, reserves fell by $80bn in four months without preventing the correction. Further, the sharp Mar 2026 overshoot caused imported inflation, margin stress on exporters who had hedged at 84, and a sudden repricing of corporate foreign-currency debt. A gradual depreciation path through 2023-24 (releasing 3% per year against the peer-consistent rate) would have spread this adjustment at much lower systemic cost. The rupee has done exactly what a freely-floating currency would have done gradually over 3 years, but compressed into 18 months because the peg delayed adjustment, and with serious credibility cost (for investors). 

The speed of adjustment was consistent with Dornbusch dynamics (7.2% in a single month from Feb to Mar 2026 is unprecedented for INR). However, the second half of the Dornbusch pattern - reversion toward long-run equilibrium - has not so far materialised, though it could yet in the coming weeks. The rupee is currently 94.10, only 0.8% below its 94.86 peak. This is within noise, not meaningful reversion. 

This is a teachable moment on currency management for central banks. Policies that keep a currency overvalued are always counter-productive, especially for developing countries that are always at risk of being caught in an episode of sudden stop and capital flight. When such episodes are triggered, the overvalued currency invariably experiences a steeper slide and greater overshoot, with all attendant consequences. Most importantly, steep devaluations convey a macroeconomic instability signal to investors. It increases the country risk for investors, who must now factor in the likelihood of episodes of sharp depreciation risks while making their investments. It is a dent in the central bank’s credibility. 

The rupee is going through one such episode. The original sin may have been committed in the 2023-24 period. 

Monday, September 2, 2024

Thoughts on India's inflation targeting debate

There’s a debate in India on whether food prices should form part of the inflation index that the Reserve Bank of India uses for its inflation-targeting monetary policy regime. The current IT regime has a CPI (Combined) inflation target of 4% with a band of 2-6%. 

There are at least two reasons for arguing against keeping food out of the headline index. One, food inflation is caused mostly by supply-side factors like rainfall and other weather patterns that demand-side measures cannot influence. Worse still, monetary policy tightening in response to such supply shocks can compound the problem by acting as a pro-cyclical measure. Two, keeping interest rates high in response to inflationary pressures driven by food prices has adverse economy-wide impacts. 

These are universally valid arguments and have been made for long by those who oppose having food prices included in the CPI index. In general, there has always been a well-founded concern that interest rate hikes are blunt when faced with price increases resulting from supply shocks like weather, pandemics, wars etc. 

A nuanced reason for keeping out food components is that it betrays a bias against farmers. While higher prices hurt consumers, it must be acknowledged that it does benefit farmers as producers. To this extent, the presence of food prices in the index (and consequent actions to bring them down) ends up hurting farmers. There’s an asymmetricity in this response given that monetary policy does nothing to stabilise the prices upwards if food price inflation is negative. 

There’s merit in this argument since there’s enough evidence that the Indian farmers suffer from adverse terms of tradewhich is exacerbated by government policies like bans on imports, exports, open market sales etc. And now monetary policy adds to the set of such policies. This becomes especially relevant to agriculture crops which are prone to very high price volatility over the years. 

However, there are several reasons to take these arguments with caution. For a start, there’s a large body of evidence that points to the strong causal link between inflation 

A very good case against any modification to the inflation index used by RBI is made here by the RBI economists themselves, and here. In fact, the RBI report shows how food inflation has come to have an increasingly high role in inflation expectations. 

Besides, there are other empirical arguments to stay the course. Consider this analysis by Tulsi Jayakumar of the monthly CPI and food inflation data for April 2014 to July 2024.

We found that CPI inflation exceeded 6% in 34 of the 124 months studied (27% of the time), while in two months it was less than 2%. On the other hand, in 52 of the 124 months (42% of the time), food inflation was above 6%. Notably, in 20 months, food inflation was below 2%, of which seven months recorded negative inflation, while 13 months recorded positive but under 2% inflation… A more granular analysis reveals that food inflation was actually below the CPI-C rate in 64 of the 124 months, while in one month both were the same. Thus, in 52.4% of the months, food inflation remained equal to or below the retail rate, with the peak negative deviation taking a value of (-)4.01 percentage points; and 59 of the 124 months had food inflation exceeding the general rate, with a peak positive deviation of 4.8 points.

These figures show that food inflation has not been wildly distorting the CPI inflation data. It also underscores the tight relationship between CPI and food inflation. 

The analysis also points to the dissonance between inflation and inflation expectations (median three-month ahead and median one-year ahead between December 2015 and July 2024) in India and how it could widen further if the food component is removed from the inflation index used in IT.

Interestingly, even in the months when food inflation was negative, inflationary expectations (for both time spans) were significantly higher than actual inflation. For instance, in June 2017, when current inflation was 1.46% and food inflation was -1.17%, inflation expected three months ahead was 7.5% and one-year ahead was 8.6%—5.1 and 5.9 times the actual rates. From December 2015 to July 2024, the average three-month ahead inflationary expectation has been twice the actual inflation, while the average one-year ahead expectation has been 2.2 times actual inflation… While inflation has moved away from the 2-6% target band’s upper limit set under India’s inflation-targeting framework only 27% of the time, inflationary expectations have remained ‘unanchored’ throughout this period, with expectations hovering above 7.2% and 7.9% respectively on both time-ahead scales. Over the span of December 2015 to July 2024, peak inflationary expectations for the three-month ahead and one-year ahead period touched 12.3% and 12.6% respectively. A central bank monetary policy that disregards food inflation, which so clearly drives inflationary expectations, will not be seen as credible, which could lead to those expectations getting unanchored even more. This would risk setting off a vicious cycle of high inflationary expectations followed by higher trend inflation.

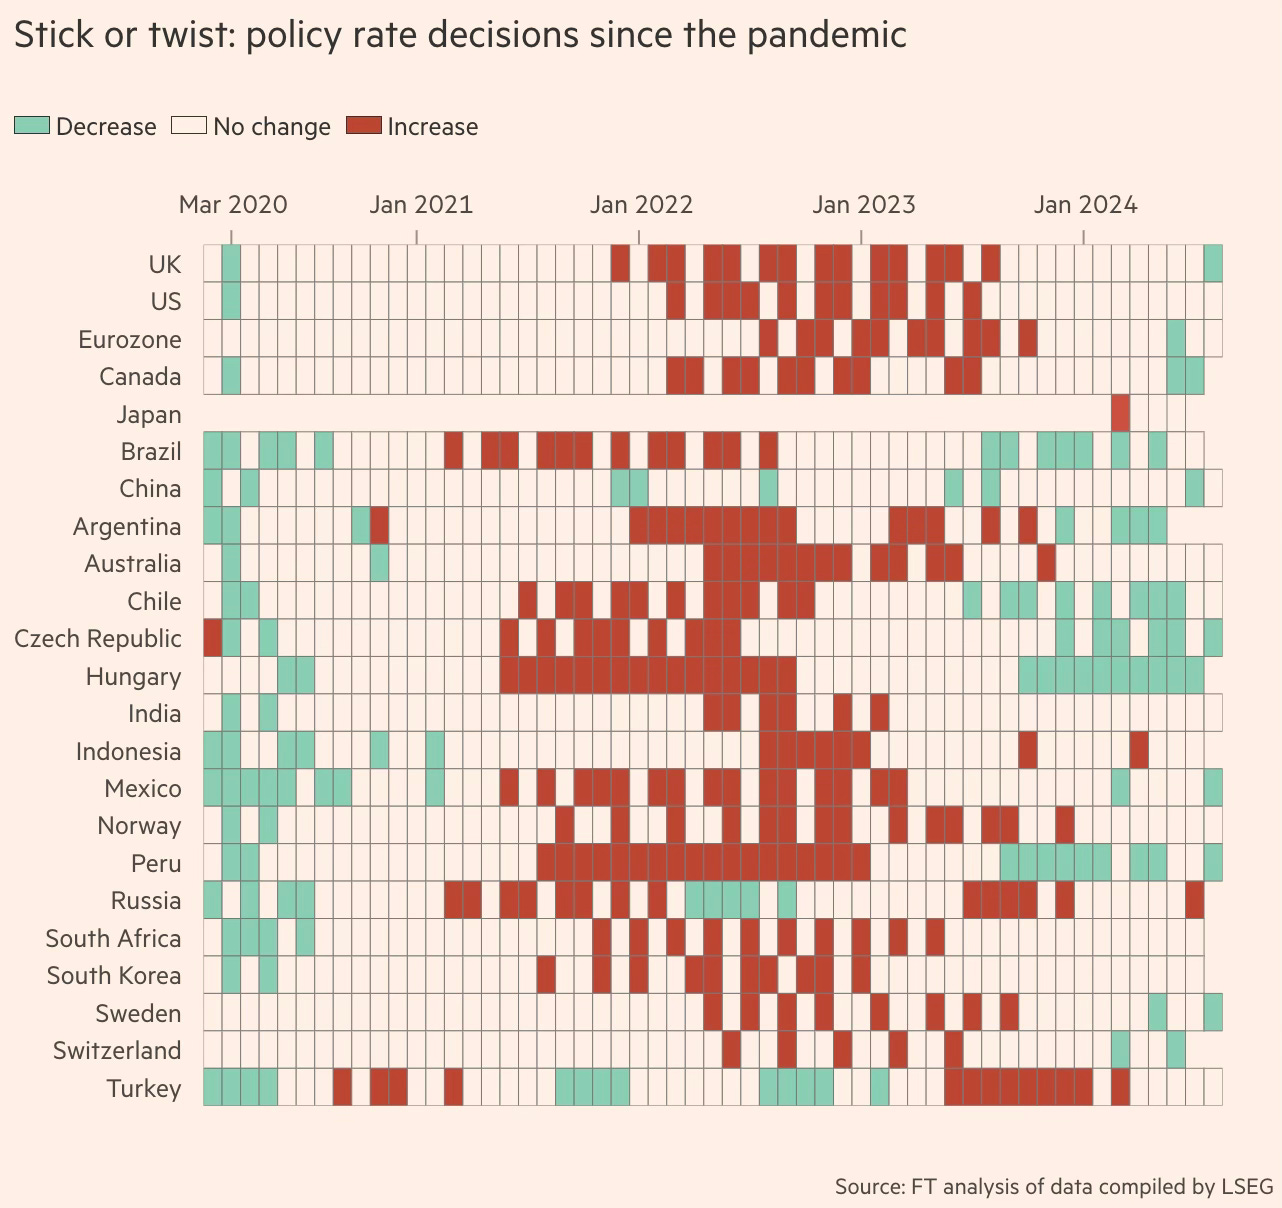
A second illustration shows that since the pandemic, apart from the Bank of Japan and the Swiss Central Bank, the RBI has undertaken the least number of interest rate changes. And rate hikes too. 

While it’s arguable as to what’s responsible for such strongly anchored inflation, clearly the RBI’s current IT regime has been associated with remarkable monetary policy stability during the tumultuous period during the pandemic and its aftermath. 

In addition, there are a few other points worth considering in favour of retaining the food components in the inflation index used for IT. 

1. In a lower middle-income country like India where the vast majority of people survive at subsistence incomes, where at least 40% of the consumption basket consists of food, it’s important that governments keep food prices stability as a top priority. And the CPI inflation index is the salient indicator of inflation that feeds into public debates on price trends. 

It’s therefore important for the political economy that that component of price level trends that impacts people the most is captured in the central policy framework that engages on the issue of inflation. 

2. The theory of adaptive expectations informs that current inflation (and other macroeconomic trends) shape people’s expectations about future inflation. The increasing price levels as felt by consumers, irrespective of their source, will feed into inflation expectations. And if the price levels rise on the largest component of the consumption basket, it inevitably shapes expectations.

3. The classic pathway for inflationary expectations to take hold is the wage-price spiral. People feel the pinch of the rising costs of their consumption basket and demand higher wages. Irrespective of whether the CPI index consists of food or not, if the consumption basket feels inflated then it sets the stage for the wage-price spiral. 

The reasons posited in the second and third points are empirically borne out in the vast body of research that explores the links between food prices and core inflation. In conclusion it can be argued that food consumption being essential is inelastic, and also forms a very large share of the Indian consumer basket, and therefore any food price increase invariably leaks out as economy-wide inflation.

It’s important to eschew any quick fixes and wish away the challenging struggle for price stability. A lower inflation figure achieved by stripping out the food component cannot overlook the reality of rising prices impacting the major part of the consumption basket for the vast majority of Indians. Likewise, it cannot also be used as the fig leaf by the central bank to lower rates. Any temporary relief achieved by such means is only likely to create bigger problems ahead. 

In any case, the RBI is a professional technocratic institution. It clearly understands the limitations of using interest rates to dampen price rises arising from supply shocks. It does not pursue monetary policy based on a mechanistic application of headline rates into an objective function. It uses the collective judgment of the MPC on its interest rate decisions. It considers the contributors of inflation and its impact on the economy-wide aggregate prices, and whether interest rate decisions can influence those contributors (like with inflation arising from supply shocks). 

For this reason, there is a distinction already existing between headline and core inflation levels. Central banks like the RBI consider the trends on both inflation indices while making decisions. 

None of the arguments here should be taken to mean that there’s nothing wrong with the current IT regime nor it should not be tweaked at the margins. The short point is that deleting the food components from RBI’s IT regime may not be advisable.

Saturday, August 31, 2024

Weekend reading links

1. On mangoes

India is the world’s biggest mango producer, with volumes greater than the next nine growers combined, according to Tridge, a data firm. Yet its share of the global export market by value is a meagre 7%. Mexico, which produces a tenth as much as India, accounts for a quarter. The reasons are many, writes Sopan Joshi in “Mangifera Indica”, a new book about mangoes. Chief among them are the delicate nature of the fruit, poor growing practices in India and strict standards in Western markets.

2. Interesting fact about the state where US companies are getting incorporated, Delaware stands out with over 70%.

3. Data does not bear out signatures of deglobalisation.
4. Some facts about Big Tech 
Since early 2019 the combined worth of the tech giants (Microsoft, Google, Amazon, Meta, and Apple) has more than tripled, to $11.8trn. Add in Nvidia, the only other American firm valued in the trillions, thanks to its pivotal role in generative artificial intelligence (ai), and they fetch more than one and a half times the value of America’s next 25 firms put together. That includes big oil (ExxonMobil and Chevron), big pharma (Eli Lilly and Johnson & Johnson), big finance (Berkshire Hathaway and JPMorgan Chase) and big retail (Walmart). In other words, while the tech illuminati have grown bigger and more powerful, the rest lag ever further behind...

Since 2019 the five tech giants and Nvidia have doubled their capital expenditures, to $169bn last year. Tot up the 25 next firms’ capex and it was just $135bn—up only 35%. As for brain power, over the same period, the big six added 1m jobs, doubling their headcount. No one can accuse them of resting on their laurels. They have invested in ai startups, ploughed fortunes into building large language models and, in Meta’s case, created open-source offerings that almost anyone can use. This year they are doubling down on their ai spending if only to protect their flanks.

5. Striking facts about the importance of immigrants to the US economy.

Immigrants are 14% of the population in America, 16% of inventors and directly produce over 23% of innovation, measured by patents, patent citations and the economic value of those patents, the authors estimate. Taking into account how they make their native-born collaborators more productive, they are responsible for a staggering 36% of total innovation.
6. Law of unintended consequences strikes at the Chinese government ban of tutoring centres for the gaokao entrance examinations.
Researchers at Peking University... analysed surveys of household spending before and after the tutoring ban and found that low- and middle-income families were, on average, spending less on after-school education. The richest families, though, were spending more. Tutors were still active. But because they were acting illegally, they charged more, pricing most people out.

7. Very good summary of the performance of State Bank of India under Mr Dinesh Khara who stepped down as CMD after four years. These are very impressive numbers

Between October 7, 2020 and last week, SBI stock has delivered a 328.36 per cent return to investors, compared to Bank Nifty’s 122 per cent return and Bankex’s 122.9 per cent. During this time, the Nifty returned 111.4 per cent, and the Sensex 103.3 per cent. The largest private bank, HDFC Bank Ltd, saw its stock rise 39.9 per cent, while ICICI Bank Ltd rose 214.6 per cent in this period. For SBI, the return on assets (RoA) moved from 0.43 in September 2020 to 1.10 in June 2024. During this period, return on equity (RoE) increased from 8.94 to 20.98, and earnings per share (EPS) from 19.59 to 76.56... While the bank’s assets have grown over the past three-and-a-half years at a compounded annual growth rate of 10.56 per cent, from Rs 43.58 trillion to Rs 61.91 trillion, its gross non-performing assets (NPAs), as a percentage of total assets, have more than halved, from 4.77 per cent to 2.21 per cent. After provisioning, net NPAs have decreased from 1.23 per cent to 0.57 per cent. Meanwhile, the net interest margin (NIM) — loosely the difference between what it spends on deposits and earns on loans — has risen marginally from 3.31 per cent to 3.35 per cent.
Who said public sector institutions must be inferior also rans compared to their private sector counterparts?

8. Since the pandemic, apart from the Bank of Japan and the Swiss Central Bank, the RBI has undertaken the least number of interest rate changes
It's also one of the very few that have not yet moved on reducing rates. 

9. Ruchir Sharma talks about a return of emerging market economies in the coming years. For a start, corporate earnings are growing faster in EMs than elsewhere.
This means that we could see a reversion of the trend since 2010.
10. Some numbers to put in perspective why the US equity markets stand alone globally
At the beginning of the 20th century, the US accounted for about 15 per cent of world market capitalisation, second only to the UK, which was at 24 per cent. By 1910, the US had crossed the UK to become the largest equity market in the world. It has since retained this title, unchallenged except for a brief period in the late 1980s when Japan held the top position. Japan peaked in 1989 at 40 per cent of world market capitalisation, while the US was second at 29 per cent. Today, the US remains unchallenged, accounting for more than 62 per cent of world market capitalisation. The next largest market is Japan at 6 per cent, followed by the UK at 3.7 per cent, and China at 2.8 per cent (all based on the FT World Index and free float adjusted). Just 12 markets, including India, account for 90 per cent of world equity market capitalisation. Looking at the longest available data series on equity market performance (1900-2023), spanning 124 years, we see that the US has delivered the best real returns, with an annualised rate of 6.5 per cent. The only market even close is Australia at 6.45 per cent in dollar terms, though there is no comparison in terms of size or absolute market capitalisation created. The UK has delivered 4.9 per cent real return, while Germany and France lag with return profiles of only 3.3 per cent and 3.16 per cent, respectively. Japan delivered 4.2 per cent (all in dollar terms). Compared to the 6.5 per cent real return of the US, the world ex-US, delivered 4.3 per cent, a gap of 2.2 percentage points compounded over 124 years. This leads to huge differences in terminal value. The US has undoubtedly been the right place to invest. If an investor had been exclusively invested in the US for the entire 124 years, their return would have turned one dollar into $2,443 in real terms. The same dollar invested in non-US markets would have grown to only $191, not even one-tenth of the US investment portfolio.

And about India

Over this 30-year period (ending July 30, 2024), MSCI India has delivered a nominal annualised return of 8.65 per cent in dollar terms, compared to 5.3 per cent for MSCI.

11. FT has a nice report from Panyu, a suburb in the southern Chinese city of Guangzhou, which is nicknamed the "Shein village" for its centrality in the retailer's business. The $66 bn valued firm, due for listing at the London Stock Exchange, has shaken up fast fashion with its $5 dresses and $2 T-shirts. 

The article captures the reasons for Shein's competitive advantage.

But going to the heartland of Shein’s supply chain, it was clear that its low prices are in spite of, not because of labour costs, which have been rising in China as the working-age population shrinks and young migrant workers shun factory jobs for the lower-paid service sector. Factory workers that source to Shein typically get paid between Rmb7,000 ($982) and Rmb12,000 monthly, depending on how many clothes they finish. By contrast, the average wage for other blue-collar workers in the area is between Rmb5,500 and Rmb6,500. Part of the reason the clothes are cheap is, well, because they are cheap. One factory manager held up a baggy dress — probably destined for the US or UK — and joked that she would never sell such low-quality clothes to a more discerning Chinese clientele. She says she uses cheaper fabrics for Shein orders than for Alibaba’s Taobao, because the domestic platform gives more money to the factories to cover their costs. 

Shein has also cut out expensive middlemen by shipping goods directly from warehouses in China to shoppers in the west — a model that has the added benefit of the great majority of its packages bypassing import duties. Panyu highlights the attraction of Chinese manufacturing. Like other manufacturing hubs specialising in anything from socks to sex toys to steel pans, it has the entire supply chain concentrated in one district. That means factories can within half an hour place an order, take delivery of fabric or get an engineer to fix sewing machines with components made nearby... China’s migrant worker population also brings it an edge. While in Vietnam and Bangladesh workers tend to return home to their families at night, the labourers in Panyu sleep in nearby dormitories, cutting down commuting time and meaning they can work longer hours if a large order arrives.

12.  Good graphic that shows how the markets over-react to economic news.

Robert Armstorng writes in Unhedged in FT.

Here is the futures market’s expectations for what the federal funds rate will be in December 2024, as well as the Fed’s projections from its quarterly summary of economic projections (the last SEP was released in early June)... One cannot help but notice the pattern of overreaction and correction on the market side. It’s like a car on an icy road. There is a whole sub-industry — Unhedged is part of it — that spends its time arguing about why the Fed is too loose or too tight. But in retrospect we probably overstate the importance of the current and expected level of rates. What matters is keeping expectations anchored on the one hand, and avoiding an unnecessary recession on the other.

BCG has admitted it paid millions of dollars in bribes to win business in Angola, and agreed to give up more than $14mn in profits from contracts it won with the country’s economy ministry and central bank. The consulting firm sent money to offshore accounts controlled by middlemen connected to Angolan officials and members of the ruling political party, according to a US Department of Justice investigation made public on Wednesday. The bribes were paid by BCG through its office in Lisbon, Portugal, between about 2011 and 2017, the DoJ said... BCG agreed to pay an agent with ties to Angolan officials between 20 per cent and 35 per cent of the value of the contracts it won, routing the money through three different offshore entities, the DoJ said... The period of the bribes coincided with the end of the rule of the late José Eduardo dos Santos, who stepped down in 2017 after 38 years in power... In total, BCG won 11 contracts with the Angolan ministry of economy and one with the National Bank of Angola over the years in question, bringing in $22.5mn in revenue. The firm will return the $14.4mn in profits that the contracts generated.

14. But KPMG and UK validates the adage that the more things change, more they remain the same

KPMG has won a UK government contract worth up to £223mn to train civil servants, the second-largest public sector contract awarded to the Big Four firm and agreed before the Treasury set out plans to drastically reduce Whitehall’s reliance on external consultants last month. Under the 14-month deal with the Cabinet Office, which commenced this month, the consulting firm will manage learning and development services across Whitehall, including overseeing courses on policymaking, communications and career development. The maximum value of the contract represents close to 8 per cent of KPMG’s annual UK revenues, making it the second-biggest public sector contract awarded to the firm, according to data provider Tussell. The most valuable piece of public sector work awarded to KPMG was a separate learning and development deal with the Cabinet Office worth £237mn, Tussell said. That four-year contract, which expires in October, involves the firm overseeing technical training for civil servants, such as professional qualifications. The lucrative contracts demonstrate a return to positive relations between the government and KPMG. The Big Four firm stopped bidding for UK government contracts in 2021 following a threat by the Cabinet Office to ban it from winning public sector work after its involvement in a series of scandals. It resumed bidding for public sector contracts in 2022. They also come as the Labour government has committed to halving Whitehall spending on consulting firms during this parliament, with chancellor Rachel Reeves last month ordering departments to stop all “non-essential spending” on external consultants. A government spokesperson said the KPMG contract was agreed before July’s general election. The Conservative party also pledged to halve Whitehall spending on external advisory firms in its election manifesto. The Treasury estimated in July that reducing the government’s reliance on advisory groups would save £550mn in the 2024-25 financial year and a further £680mn in 2025-26, when the policy to halve total spending on consultants came into force. The savings would, in part, help fund significant public sector pay rises, the chancellor said.

15. Very good article on how Nvidia is working to protect its domination of the high-end chips design market. 

The key issue is when the main focus in AI moves from training the large “foundation” models that underpin modern AI systems, to putting those models into widespread use in the applications used by large numbers of consumers and businesses. With their ability to handle multiple computations in parallel, Nvidia’s powerful graphical processing units, or GPUs, have maintained their dominance of data-intensive AI training. By contrast, running queries against these AI models — known as inference — is a less demanding activity that could provide an opening for makers of less powerful — and cheaper — chips... Nvidia’s lead in this newer market already looks formidable. Announcing its latest earnings on Thursday, it said more than 40 per cent of its data centre sales over the past 12 months were already tied to inference, accounting for more than $33bn in revenue... But how the inference market will develop from here is uncertain. Two questions will determine the outcome: whether the AI business continues to be dominated by a race to build ever larger AI models, and where most of the inference will take place. Nvidia’s fortunes have been heavily tied to the race for scale... Yet it is not clear whether ever-larger models will continue to dominate the market, or whether these will eventually hit a point of diminishing returns. At the same time, smaller models that promise many of the same benefits, as well as less capable models designed for narrower tasks, are already coming into vogue. 

Meta, for instance, recently claimed that its new Llama 3.1 could match the performance of the advanced models such as OpenAI’s GPT-4, despite being far smaller. Improved training techniques, often relying on larger amounts of high-quality data, have helped. Once trained, the biggest models can also be “distilled” in smaller versions. Such developments promise to bring more of the work of AI inference to smaller, or “edge”, data centres, and on to smartphones and PCs... The range of competitors with an eye on this nascent market has been growing rapidly... The data centre market, meanwhile, has attracted a wide array of would-be competitors, from start-ups like Cerebras and Groq to tech giants like Meta and Amazon, which have developed their own inference chips. It is inevitable that Nvidia will lose market share as AI inference moves to devices where it does not yet have a presence, and to the data centres of cloud companies that favour in-house chip designs. But to defend its turf, it is leaning heavily on the software strategy that has long acted as a moat around its hardware, with tools that make it easier for developers to put its chips to use.

16. Finally, Japanese startup scene is finally waking up after long drawn persistent efforts by the Government.  

The ambitions are charged with the faith that start-ups can drive GDP growth and productivity, rescue the country from a long-term innovative tailspin and channel its talent in the right — or at least less wrong — direction. It has a belated, even desperate feel to it, but start-ups now seem to be Japan’s core industrial policy. The extent of both central and local government backing is striking. In addition to the many subsidies now on offer, state-backed entities like the Japan External Trade Organization have been drafted into the effort by providing acceleration programmes and other services. The government-backed Japan Investment Corporation has invested close to $1bn into 32 private venture capital funds. Under heavy government pressure, Japan’s three biggest banks have recently begun offering start-ups loans backed against current and future cash flow, breaking their long, entrepreneurialism-crushing habit of only lending against hard collateral such as the property of a would-be start-up founder. By many metrics, all this is working. In 2013, said the Ministry of Economy, Trade and Industry in a recent paper, the total investment into start-ups in Japan was a minuscule $600mn; a decade later, that had risen to over $6bn. Between 2014 and 2023, the number of university start-ups more than doubled to 4,288, with METI research showing that roughly half of university students would prefer to start their careers at one.

Saturday, March 30, 2024

Weekend reading links

1. Is the stock market boom peaking? It may be so if insider share sales are any indication.
Many of the biggest sales this quarter have come from technology executives. Thiel, co-founder of data analytics group Palantir, sold $175mn this month, according to regulatory disclosures, his biggest sale since offloading $504.8mn of the company’s stock in February 2021. Amazon founder Bezos sold 50mn shares worth $8.5bn in the ecommerce group in February. Andy Jassy, Amazon’s chief executive, sold $21.1mn of stock this year, compared to $23.6mn in 2023 and 2022 combined. Zuckerberg, Meta’s chief executive, has sold millions of dollars of the company’s shares for years. But he has increased selling this year as its stock hit all-time highs. In early February, he sold 291,000 shares for $135mn, his first sale of that size since November 2021. He still has 13.5 per cent of the company’s outstanding shares, which makes him its largest shareholder.

2.  Tamal Bandopadhyay has an excellent article that puts into perspective the RBI's recent regulatory push.

The RBI doesn’t want to see a house on fire and call the fire brigade; instead, it wants to ensure that no fire breaks out. The recent actions against some of the regulated entities point to this... The RBI’s new-found enthusiasm for punishing the naughty boys needs to be seen in the right context. This is the time to do so since the resilience of the financial sector is at its peak. The level of non-performing assets on banks’ books, as a percentage of overall loan assets, is at a historic low. Besides, their provision coverage ratio (the amount of money set aside to take care of bad assets) has been on the rise. Also, the banks are well capitalised. When did we last see such a healthy Indian banking system? Smart regulators take tough calls when the going is good.

3. Merlin Entertainment, the owner of Legoland, Sea Life, and Madam Tussauds announced the introduction of dynamic/surge pricing at its top 20 global attractions by the end of 2024. This comes as a trend emerges where the entertainment industry adopts dynamic pricing by following in the footsteps of the airline and hotel industries. The US restaurant chain, Wendy's had announced dynamic pricing for burgers during peak demand from early 2025. 

4. The global unlisted infrastructure market stands at an AUM of $1.3 trillion as on June 2023, with $150 bn aimed at Asia-Pacific. Led by names like Macquarie, Brookfield, Global Infrastructure Partners (GIP), iSquared Capital (seeded and spun off from Morgan Stanley), Stonepeak, Antin Infrastructure (seeded and spun off from BNP Paribas), infrastructure has arrived as a major unlisted asset class. 

From a tiny sliver of the private investment market, infrastructure has surged since the global financial crisis. Its scope too has expanded to cover areas like gas export facilities, mobile phone towers, data centres etc., apart from the traditional infrastructure assets. The long period of ultra-low interest rates have been a major driver of this growth. 
During the 1980s and 1990s, Macquarie underwrote a wave of privatisations across Australia, Europe and Canada, countries where governments were looking to sell state monopolies such as utilities, airports and toll roads. It then began investing directly in the businesses that were being privatised. But translating that strategy to the US was initially challenging. Federal and state governments were less likely to sell assets, fearing a political backlash. The existence of large municipal debt markets, which carried tax advantages for domestic investors and generated funding for public bodies, meant there was less financial incentive to privatise...

A small number of deals sparked investors’ interest. In 1999, the provincial government of Ontario sold a lease on 407 ETR, a toll road around Toronto, for about $3bn — a price that in Dorrell’s eyes wildly undervalued the highway. Macquarie quickly became a large investor and by 2019, 407 ETR was valued at around $30bn. “It is arguably the most successful infrastructure asset ever,” says Dorrell. Canadian pension funds and those in Europe and Australia began pouring money into infrastructure and US municipalities started to sell assets such as the Chicago Skyway Bridge, acquired by Macquarie and Cintra for $1.8bn in 2004. Before long, large investment banks including Goldman Sachs, Credit Suisse, Citigroup, Morgan Stanley and Deutsche Bank were building their own dedicated investment teams. But the 2007-08 financial crisis brought the boom to an abrupt end and left many institutions nursing big losses.  

But the inflows into the sector is mostly bound for North America and Europe, with even Asia-Pacific getting just $7.8 bn out of around $175 bn in 2022, and just $3.1 bn out of $89 bn in 2023. 

5. Times has an article on the problems facing Boeing which has been struggling on the face of two fatal recent crashes of its Max 8 planes that killed 350 people. 

Some of the crucial layers of redundancies that are supposed to ensure that Boeing’s planes are safe appear to be strained, the people said. The experience level of Boeing’s work force has dropped since the start of the pandemic. The inspection process intended to provide a vital check on work done by its mechanics has been weakened over the years. And some suppliers have struggled to adhere to quality standards while producing parts at the pace Boeing wanted them... Several said employees often faced intense pressure to meet production deadlines, sometimes leading to questionable practices that they feared could compromise quality and safety... “For years, we prioritized the movement of the airplane through the factory over getting it done right, and that’s got to change,” Brian West, the company’s chief financial officer, said at an investor conference last week... 

One quality manager in Washington State who left Boeing last year said workers assembling planes would sometimes try to install parts that had not been logged or inspected, an attempt to save time by circumventing quality procedures intended to weed out defective or substandard components. In one case, the employee said, a worker sent parts from a receiving area straight to the factory floor before a required inspection... Employees would also sometimes go “inspector shopping” to find someone who would approve work, the worker said... Several current and former employees in South Carolina and in Washington State said mechanics building planes were allowed in some instances to sign off on their own work. Such “self-verification” removes a crucial layer of quality control... Another factor at play in recent years has been that Boeing’s workers have less experience than they did before the pandemic. When the pandemic took hold in early 2020, air travel plummeted, and many aviation executives believed it would take years for passengers to return in large numbers. Boeing began to cut jobs and encouraged workers to take buyouts or retire early. It ultimately lost about 19,000 employees companywide — including some with decades of experience... the company did not always provide new employees with sufficient training, sometimes leaving them to learn crucial skills from more experienced colleagues... District 751 of the International Association of Machinists and Aerospace Workers union, which represents more than 30,000 Boeing employees, said the... proportion of its members who have less than six years of experience has roughly doubled to 50 percent from 25 percent before the pandemic.

This is another example of how businesses trade off efficiency and profits, against resilience. 

6. Good explainer on the troubles associated with GDP estimation in India, specifically the deflator. Rajeswari Sengupta points to two problems.

First, the National Statistics Office (NSO) does not use the international standard measure of output prices — the producer price index — to deflate GDP. This is because India does not have a PPI. The NSO proxies the PPI with the wholesale price index (WPI). However, the WPI does not track producer prices very well. It is, in fact, heavily skewed towards commodities such as oil and steel which are essential inputs in commodity importing countries like India. Also, the WPI does not measure the price of services, and services constitute two-thirds of the economy. This skew in the composition of WPI means that whenever commodity prices fall steeply, the WPI will decline, even if producer prices are still rising. This has been a major issue recently. Since September 2022, consumer price index (CPI) inflation has been above 5 per cent, as producers kept increasing prices, but WPI inflation has steadily declined, because global commodity prices have fallen. During April-December, 2023, WPI inflation averaged -1.0 per cent. This persistent fall in WPI inflation artificially inflated real GDP during 2023-24.

Second, most G20 countries calculate real gross value added (GVA) in the manufacturing sector using a methodology known as double deflation. In this method, nominal outputs are deflated using an output deflator, while inputs are deflated using a separate input deflator. Then the real inputs are subtracted from real outputs to derive real GVA. India, by contrast, deflates nominal numbers using a single deflator. It matters because if input prices diverge from output prices, single deflation can misstate growth by a big margin. Consider what has been happening recently. When the price of inputs falls and price of output increases, profits increase and nominal value added goes up (it helps to think of GVA as profits, which go up when input prices fall). Since real GDP is supposed to be measured at “constant prices”, this increase needs to be deflated away. Double deflation will do this easily. But single deflation using an input price index like WPI will amplify the nominal increase. So, if the nominal increase in GVA is 10 per cent as the result of rising profits, while WPI falls by 1 per cent, the real increase will be calculated as 11 per cent, even if real output has not changed at all.

7. Capital expenditure has risen across state governments too

On capital expenditure, the Centre has succeeded in raising it from a level equivalent to 2.5 per cent of gross domestic product (GDP) in 2021-22 to 3.2 per cent in 2023-24. Something similar, and indeed better, has happened with the states. At the aggregate level, these 20 states have raised their capex as a percentage of their gross state domestic product (GSDP) from a lower level of 2.09 per cent to 3.36 per cent in the same period.

8. For all talk of rebalancing, the Chinese economy continues to be excessively reliant on capital investment. 

The only rebalancing that's happening is the shifting of credit from property and infrastructure into the three emerging areas of electric vehicles, Lithium-ion batteries, and solar photovoltaic cells manufacturing. The exports of the latter three rose 30% to $147 billion in 2023. This has naturally raised criticism of state-support offered by Beijing. 
Beyond China’s shores, many experts and government officials view the prospect of Beijing’s increased reliance on manufacturing for growth as an emerging threat. Comparisons of industrial policy are notoriously difficult. But the Center for Strategic and International Studies describes Chinese state support as “uniquely high”, estimating it at $406bn, or 1.73 per cent of GDP, in 2019. That compares to 0.39 per cent of GDP in the US and 0.5 per cent in Japan. In the US and Europe, politicians fear that such heavy spending will result in a wave of low-cost high-tech exports from China that could displace domestic industries and pose risks around national security... In private conversations with their Chinese counterparts, American economic officials have warned Beijing that the US and its allies will take action if China tries to ease its industrial overcapacity problem by dumping goods on international markets.

Saturday, April 15, 2023

Weekend reading links

1. A very comprehensive presentation by Nathaniel Bullard on the various issues involved in the decarbonation project. This is a stark reminder of the problem with modern economic growth - 1950s appear to have been the CO2 emissions take-off period.

But per capita CO2 emissions appear to have peaked

As a result, economic growth and emissions appear to have decoupled.
In the US, the entire net additions in primary energy is from renewables.

2. Saudi Arabia led OPEC announce further cuts in oil production to shore up prices. While this would be a blow to a world economy already grappling with inflation and an impending slowdown, it would be a boon to the Russians.

3. As China conducts a high intensity naval exercise in international waters near Taiwan and Japan in response to the Taiwanese President Tsai Ing-wen's visit to the US, Gideon Rachman has an oped in FT calling for western unity in containing China's aggressive intentions.
There are three main arguments for sticking up for Taiwan. The first is about the future of political freedom in the world. The second is about the global balance of power. The third is about the world economy. Together they amount to a compelling case to keep Taiwan out of Beijing’s clutches... the Indo-Pacific region as a whole has several thriving democracies including Japan, South Korea and Australia. They all depend to some extent on a security guarantee from the US. If China crushed Taiwan’s autonomy, either by invading or by strongarming the island into an unwilling political union, then US power in the region would suffer a huge blow. Faced with a prospect of a new hegemonic power in the Indo-Pacific, the region’s countries would respond. Most would choose to accommodate Beijing by changing their foreign and domestic policies... The implications of Chinese dominance of the Indo-Pacific would also be global, since the region accounts for around two-thirds of the world’s population and of gross domestic product. 

If China dominated the region, it would be well on the way to displacing the US as the world’s most powerful nation. The idea that Europe would not be affected by that shift in global power is absurd... Taiwan produces over 60 per cent of the world’s semiconductors and about 90 per cent of the most sophisticated ones. The gadgets that make modern life work, from phones to cars and industrial machinery, are run with Taiwanese chips. But the factories that produce them could be destroyed by an invasion. If Taiwan’s chip factories survived but fell under Chinese control, the economic implications would be huge. Control of the world’s most advanced semiconductors would give Beijing a chokehold over the world economy. As the US has already discovered, replicating Taiwan’s semiconductor industry is much harder than it sounds. All these considerations — economic, strategic, political — make a compelling case for the US and its allies to protect Taiwan. No one in their right mind wants a war between America and China. But now, as in the past, it is sometimes necessary to prepare for war — to keep the peace.

The operative part is that it's necessary to prepare for war to keep peace. 

This is sound advice for appeaceniks like Emmanuel Macron who has implied France will not protect the island since there is a "great risk" for Europe in getting "caught up in crises that are not ours." At a time when China has been conducting aggressive naval exercises and tensions between China and US are on the boil, it's difficult to see Macron's statement, and that too while on a visit to China, as anything other than appeasement. The damage it would have in adversely impacting the delicate deterrence on Taiwan is real. This is a good summary.

Sensing the damage, Germany's foreign minister Annalena Baerbock during a visit to Beijing and EU's foreign policy chief Josep Borrell have both warned China against using military force against Taiwan. Baerbock said that "a unilateral, to say nothing of a violent, change of the status quo would be acceptable to us Europeans."

4. Ruchir Sharma points to how dominant Big Tech has become in the US and how non-disruptive US capitalism has become

Today, all of the top five US companies are tech businesses and together they represent more than 20 per cent of the stock market — the highest concentration since the 1960s and more than double the figure a decade ago. The decline in competitive churn is a side-effect of the rescue culture that has been growing since the 1980s. Ever since the US Federal Reserve stepped in to prop up the market after the 1987 crash, the stock market has grown dramatically, from half the size of the US economy to two times larger at its peak in 2020. One might assume an expanding market should create room for more churn, but no, not in America. The number of US companies that remain in the top 10 from one decade to the next has risen steadily, from just three in 1990 to six at the end of the 2010s. And while churn has weakened in the US, it remains relatively robust across much of the world. From the start to the end of the 2010s, just two companies remained on the top 10 list in Japan, four in Europe, four in China and two in the global list, Microsoft and Alphabet. Today, the top five US companies are bigger than the next five by the largest margin since the early 1980s. The top two alone account for nearly half the market cap of the top 10, up from 35 per cent at the start of the pandemic. Apple is now number one, and is nearly six-times larger than UnitedHealth Group, in 10th place. Three decades ago, Exxon was number one but just over twice the size of the tenth company, BellSouth.

The biggest beneficiary of the bank bailouts in the US are the big technology companies. This is reflected in the rebound in their stocks after the bailouts were announced. The bailouts also reflect the regulatory capture by Big Tech, a point highlighted by the Texas mayor 

In Texas, the mayor of Fort Worth recently said that the “main thing” worrying business leaders is this question: if SVB had served the oil industry rather than tech, would the government “have stepped up the same way?”

5. The recent banking crisis that was triggered by SVB had its roots in classic asset-liability mismatches, excessive exposure to long-term government securities (50% of assets, compared to 29% in India), concentration of credit risk (startups), and liquidity risk (disproportionate share of bulk deposits). In its context, TT Rammohan draws attention of the RBI's "intrusive" regulatory approach which has prevented bank runs in India,

It is fair to suggest that the Indian banking system is better equipped to pre-empt the sort of risks we are talking about...The average holding of government securities in the Indian banking system today is 29 per cent of liabilities. The majority of holdings are held to maturity and hence insulated from market risk... The Reserve Bank of India (RBI) monitors concentration risk closely. It has in place stringent norms for risk exposure to a borrower. Exposure to “sensitive” sectors, namely, real estate, commodities and the capital market, is restricted. The RBI is quick to draw attention to excessive exposure to any industrial sector or product. As for liquidity risk, the RBI watches dependence on “bulk” deposits like a hawk. Where the dependence is high in absolute terms or out of line with that of peers, the RBI asks for the proportion to be brought down in a specified time-frame. 

The RBI’s monitoring of boards and management is more intense than elsewhere. Appointments to the posts of chairman and managing director at banks require the RBI’s approval. The RBI typically approves terms of three years but may approve a shorter tenure. There are age limits for the managing director and chairman. There are norms for the composition of bank boards and for the audit and risk management committees. Most regulators limit themselves to fixing the ratio of variable pay to fixed pay of the chief executive officer (CEO). The RBI does this and, in addition, regulates the fixed pay of the CEO. It understands only too well the link between executive pay and systemic risk in banking. Two reports that the RBI makes available to bank management are noteworthy: The Annual Financial Inspection report and the Risk Assessment Report. These highlight the entire gamut of risks, shortcomings in systems and processes, the functioning of the board, lapses in compliance, etc. Those who have sat on bank boards will vouch for the high quality of these reports.

The RBI need not be apologetic about its approach to regulation and supervision. The approach is intrusive, no doubt. It can be irritatingly prescriptive. It will be seen as micro-management. But it serves a purpose, namely, shoring up stability in banking.

6. Poonam Gupta points to the bias with credit rating agencies in their assessments of developed and developing countries

A UN paper attributes the bias to the location and origin of the staff of the credit rating agencies. The headquarters of credit rating agencies are located in the US. This itself contributes to the bias in favour of the US. Besides, they fear being legally sued by advanced economies for granting them ratings lower than what they think they deserve. A majority of the managers and analysts in the rating agencies have been trained at universities based in advanced economies, resulting in “group think” and “home bias”. Finally, given the oligopoly in the rating industry, the raters mimic one another, perpetuating the bias...
Our own analysis of the credit ratings of the G20 countries confirms this bias. We compute the average numerical ratings of the three largest credit rating agencies, viz., Moody’s, S&P Global, and Fitch, on a scale of 1 to 20. While the average rating of an advanced economy is almost a perfect 19, that of an emerging market is 7.5 points lower, at close to a junk grade of 11.6 (the junk grade is accorded to a rating of 11 and below). The differential is not explained by the levels of growth rate, debt or fiscal deficit of these countries. The emerging countries live under the perennial threat of a potential downgrade to below the junk grade. India’s average rating in 2022 was 12, just one notch above the speculative grade.

7. Interesting article on the changing trends in urban planning, from grids to radial plans to cut de sacs.

8. Finally on the importance of property prices to the developed economies,

In developed economies... real estate is formalised, and mortgages are 30 per cent to 60 per cent of banking credit... Not only is housing an important source of economic demand, accounting for 10 per cent to 24 per cent of gross domestic product (GDP), but it is also an important asset for most households. Most importantly, being a long-term asset, its value is highly sensitive to interest rates... In major markets, nearly a fifth of loans have loan-to-value ratios more than 80 per cent: A 20 per cent price drop would mean a distressed mortgage... We estimated a 0.9 percentage point impact on global growth if housing construction in the US, China, Germany, Canada, and Australia were to fall back to trend: Most of it due to slower construction, and the rest due to weaker consumption caused by negative wealth effects as house prices fall.

The Economist has an update on property markets in developed countries.