Substack

Showing posts with label Poverty. Show all posts

Wednesday, January 17, 2024

Addressing poverty and human development in India

I’m a strong believer in the argument that there are no grand narratives or explanations for most intractable social, political, and economic problems in the world. Neither are there similarly all-encompassing solutions for these problems. Almost always, the explanations and solutions are mani-fold and often vary widely across contexts for the same problem. 

Importantly, most often the solutions are about persistent and long-drawn efforts, more like hundred small steps than two or three big bang measures. These small steps create the conditions for change in culture, norms, attitudes, behaviours and practices. The challenge is to bring these steps together in a Big Push, with collective commitment and execution diligence. 

On the same lines, I think that the answer to India’s economic development lies in a carefully tailored heterogeneous and varied basket of measures. There are no universal and time invariant one-size-fits-all big bang measures. Instead there should be different bouquets of measures for different localities and regions, depending on history, culture, remoteness, backwardness, caste and (even) religion. These bouquets would vary in their prioritisations and thrust on some specific set of measures aimed at the specific context. 

But these measures have to be supported with a set of uniform interventions - infrastructure (mainly irrigation, roads, electricity, and drinking water), public goods (public health, schools and hospitals), human resources development (nutrition, learning proficiency etc.,), livelihoods (skilling, industrial clusters, parks etc.,), policy enablers (simplify regulations on land and labour, facilitate access to credit, ease of doing business), and good governance.

Hitherto the focus has been on a few uniformly applicable set of interventions that are mostly in the nature of brick-and-mortar infrastructure and logistics development and ease of doing business. We need to go beyond this. These measures by themselves are unlikely to address the chronic and entrenched constraints that entrap localities and regions in backwardness and under-development. 

In this context, I recently came across an eye-opening presentation by Dr Sekhar Bonu, previously Director General of the Directorate of Monitoring and Evaluation, NITI Aayog. He has graciously allowed me to blog on it. In the unpublished work, he uses the existing survey data from NFHS, PLFS, and other sources to document the wide geographical variations across a host of economic and human development parameters. He uses GIS maps involving districts to illustrate the wide variations across geographies (even adjacent districts) to show why it’s futile to think of one India when we design policies to address development deficiencies. In fact, for sustainable and meaningful efforts, aside from the aforementioned common interventions, we should be thinking in terms of districts as the unit of iteration. 

In another recent paper published in the EPW, Anirudh Krishna and Sekhar Bonu mapped out similar significant inter-district variations and clustering of lagging districts by intergenerational changes in education. 

I’ll sample a few from the as-yet unpublished work, with his permission. He uses wealth, consumption, and human development data to highlight the differences across districts. 

Household wealth index shows that poorer households reside largely in the Eastern part of North India, North East India, and East India. But per capita household wealth, a more accurate representation of wealth, show the desert districts of Rajasthan with higher backwardness, while North East districts show less backwardness. 
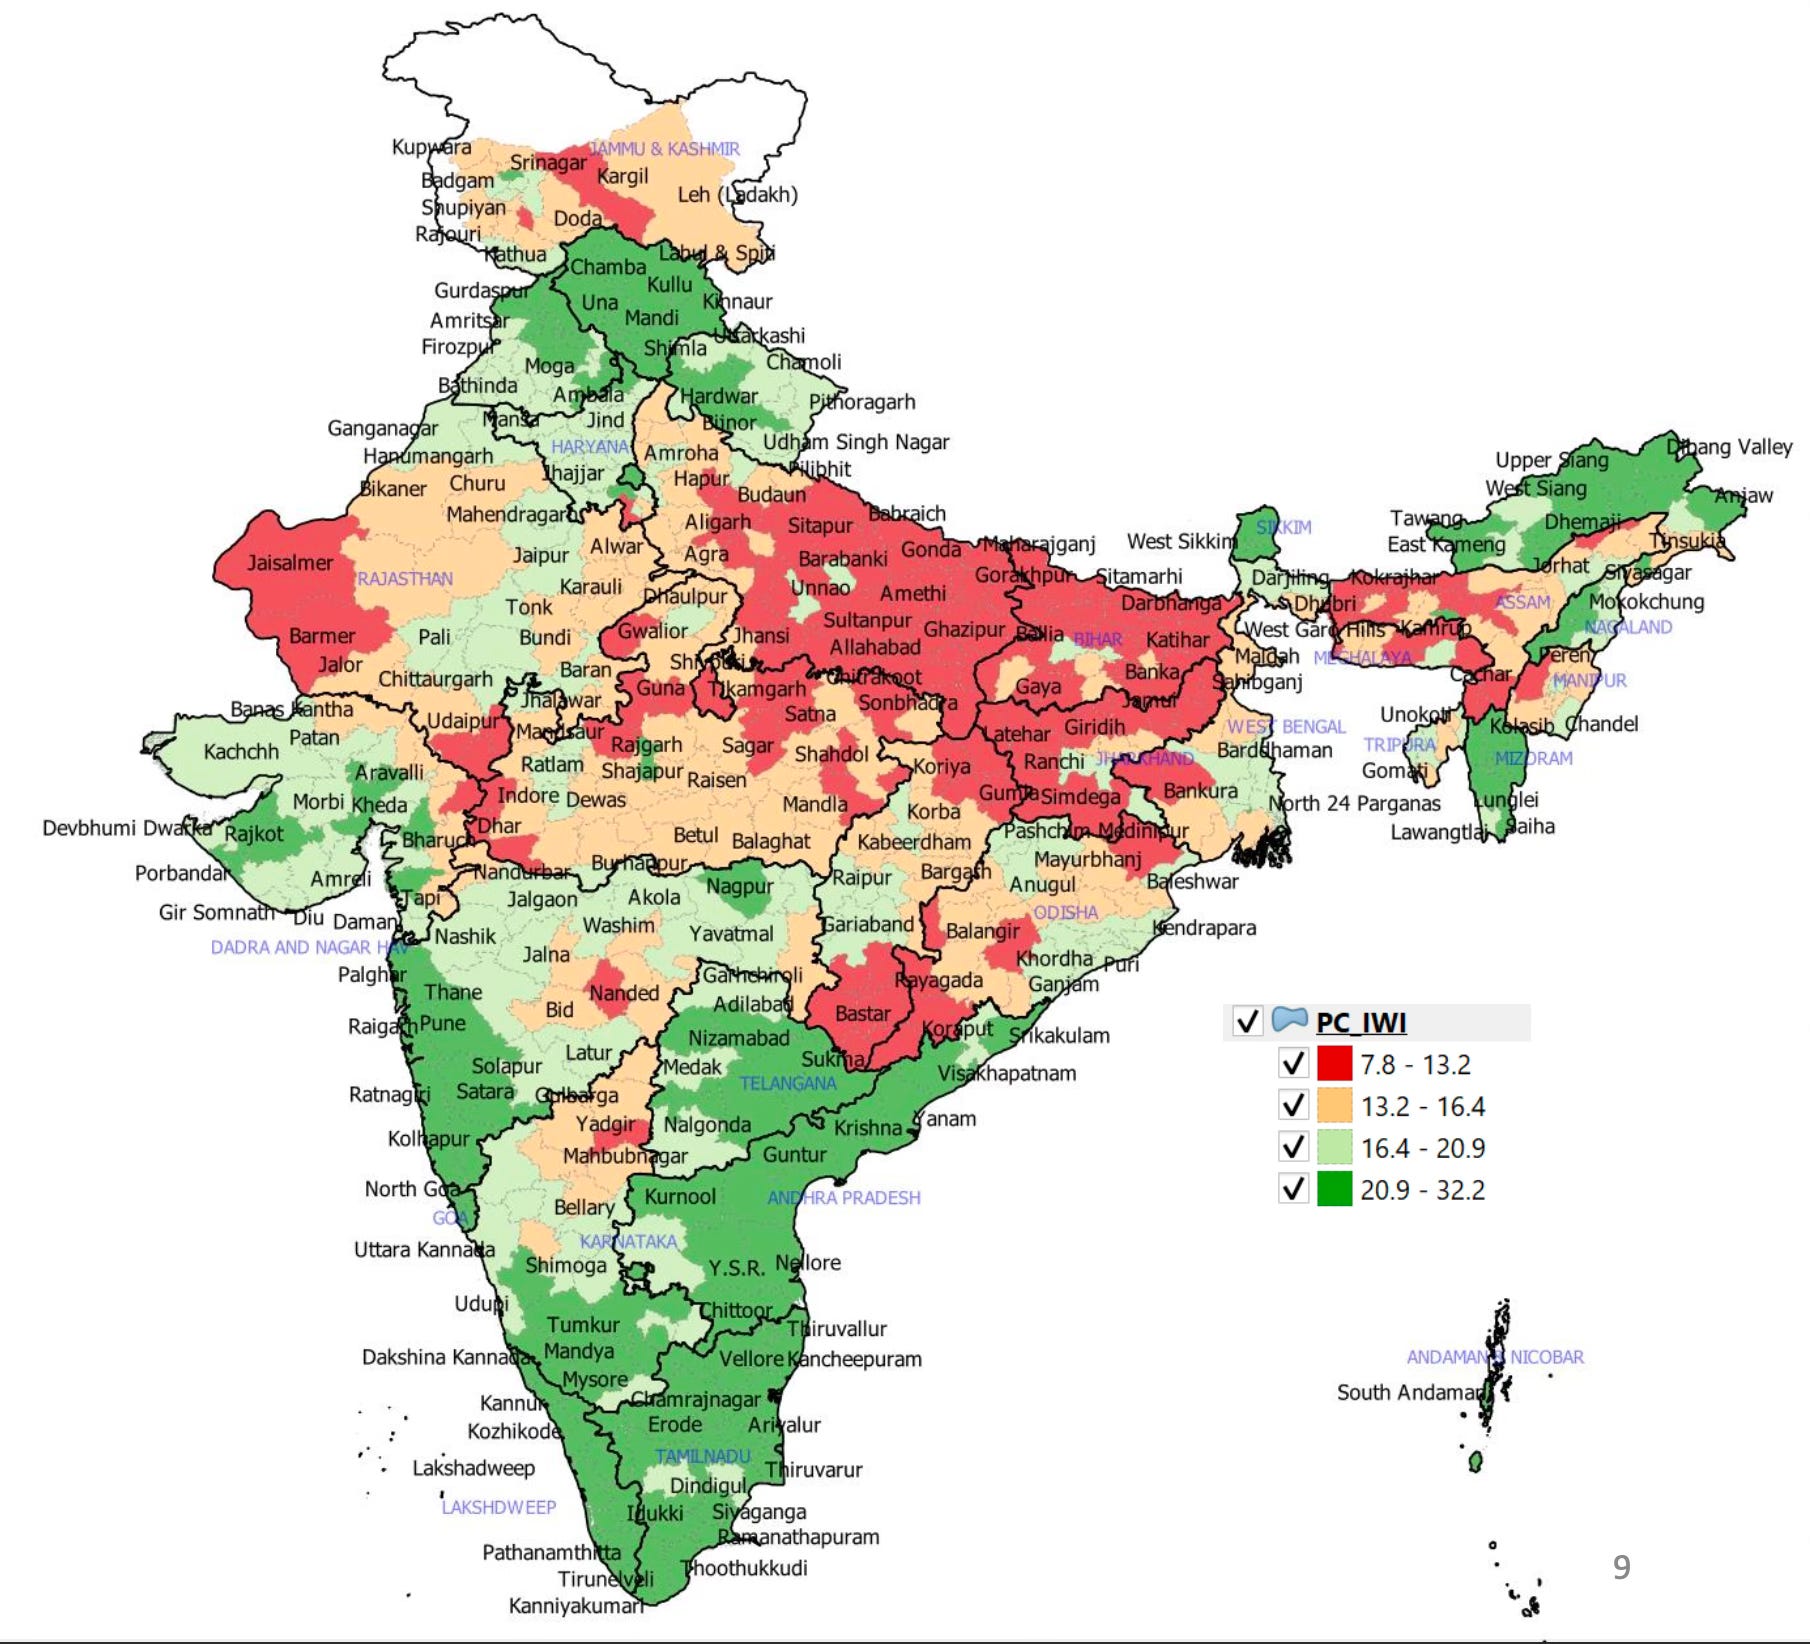
Percapita consumption map shows North East and Rajasthan have relatively higher household monthly expenditure compared to household wealth standing, whereas pockets of low expenditures can be seen in Telangana, Karnataka, Maharashtra, TN, and Gujarat. 

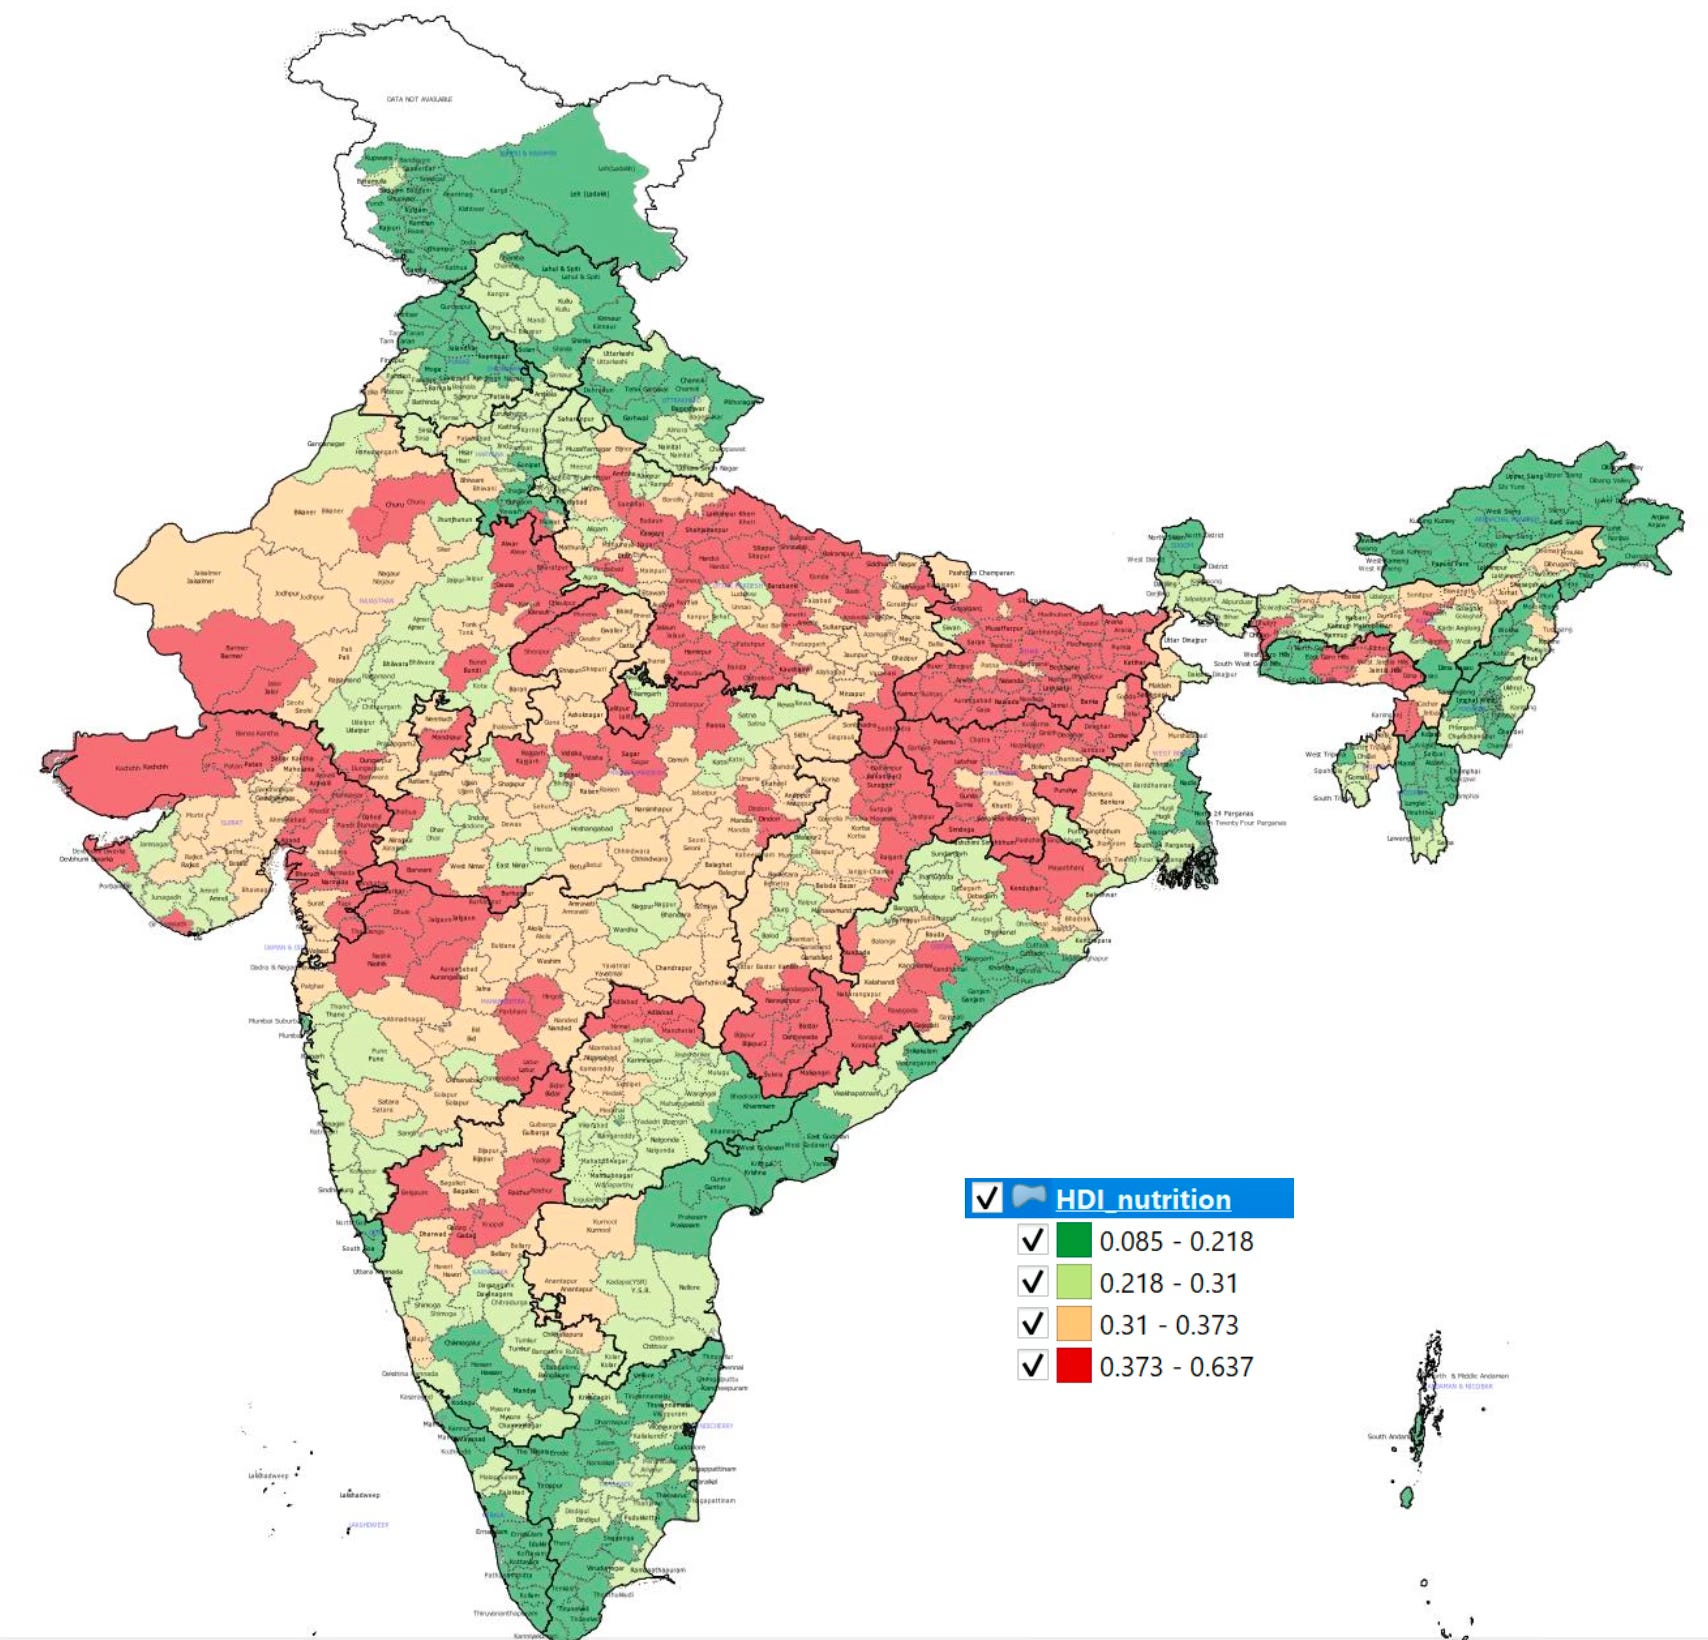
On nutrition while there is significant overlap with wealth and consumption expenditure, districts in AP, Gujarat, Maharashtra, and Karnataka are unique to Nutritional backwardness
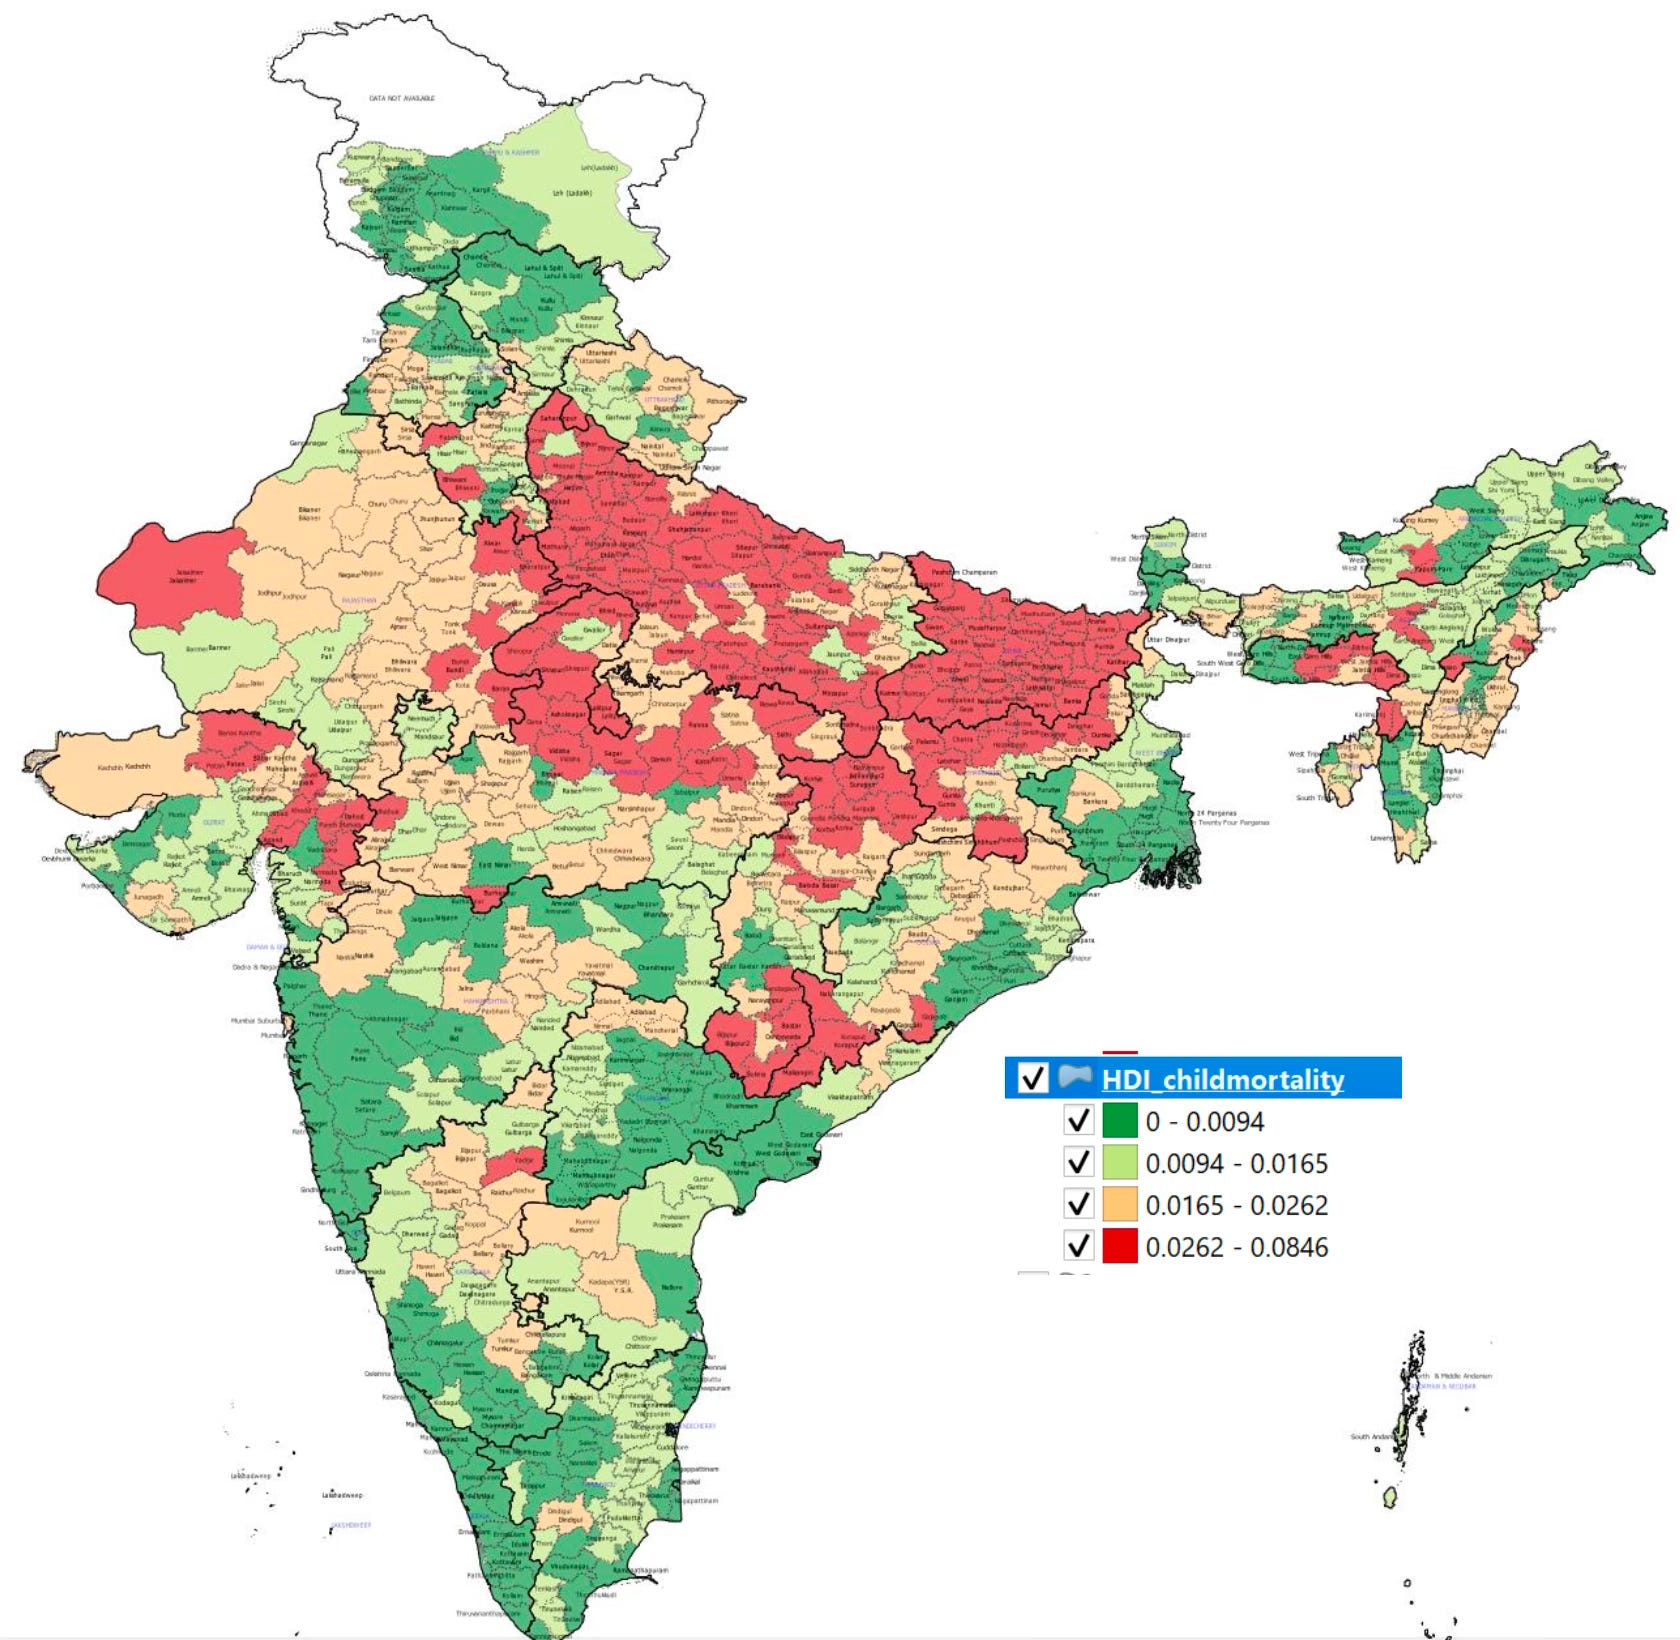
On child mortality, while there’s significant overlap with wealth and consumption, some districts in Karnataka and Gujarat are unique to child mortality
On years of schooling (where not even one member of the household aged 10 years or older has completed six years of schooling), Andhra and Telangana in particular are uniquely backward. 
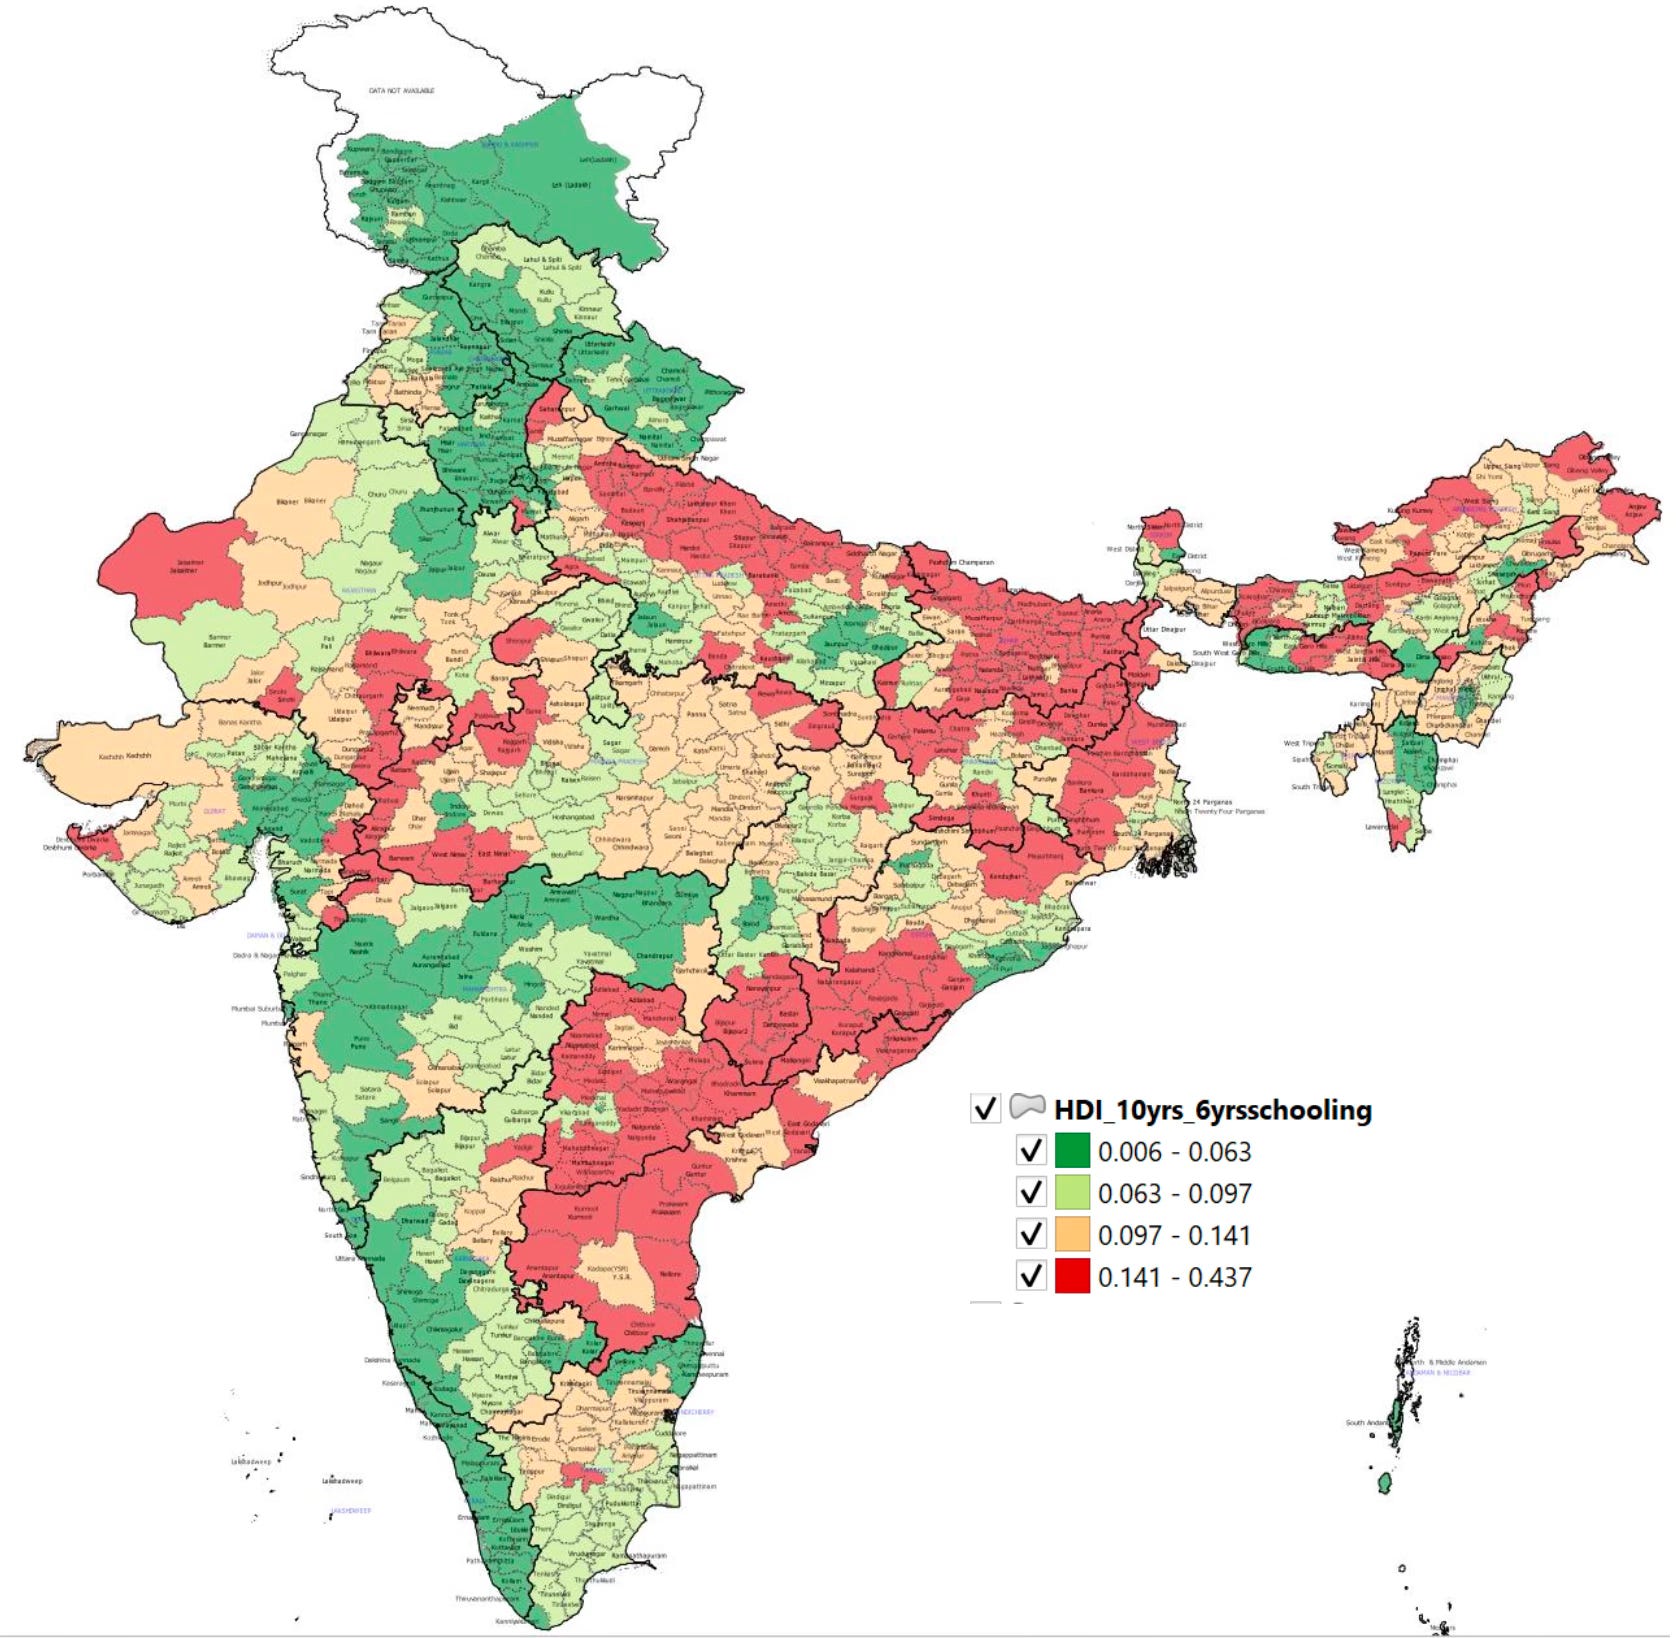
Bringing all together, he does a composite scoring of all districts based on the three kinds of parameters. Almost all districts in Bihar, large parts of UP, tribal belts of Orissa, Chhattisgarh, and Jharkhand, tribal cluster covering Gujarat/Rajasthan/MP and Maharashtra, a pocket in Karnataka emerge as the areas requiring support. 
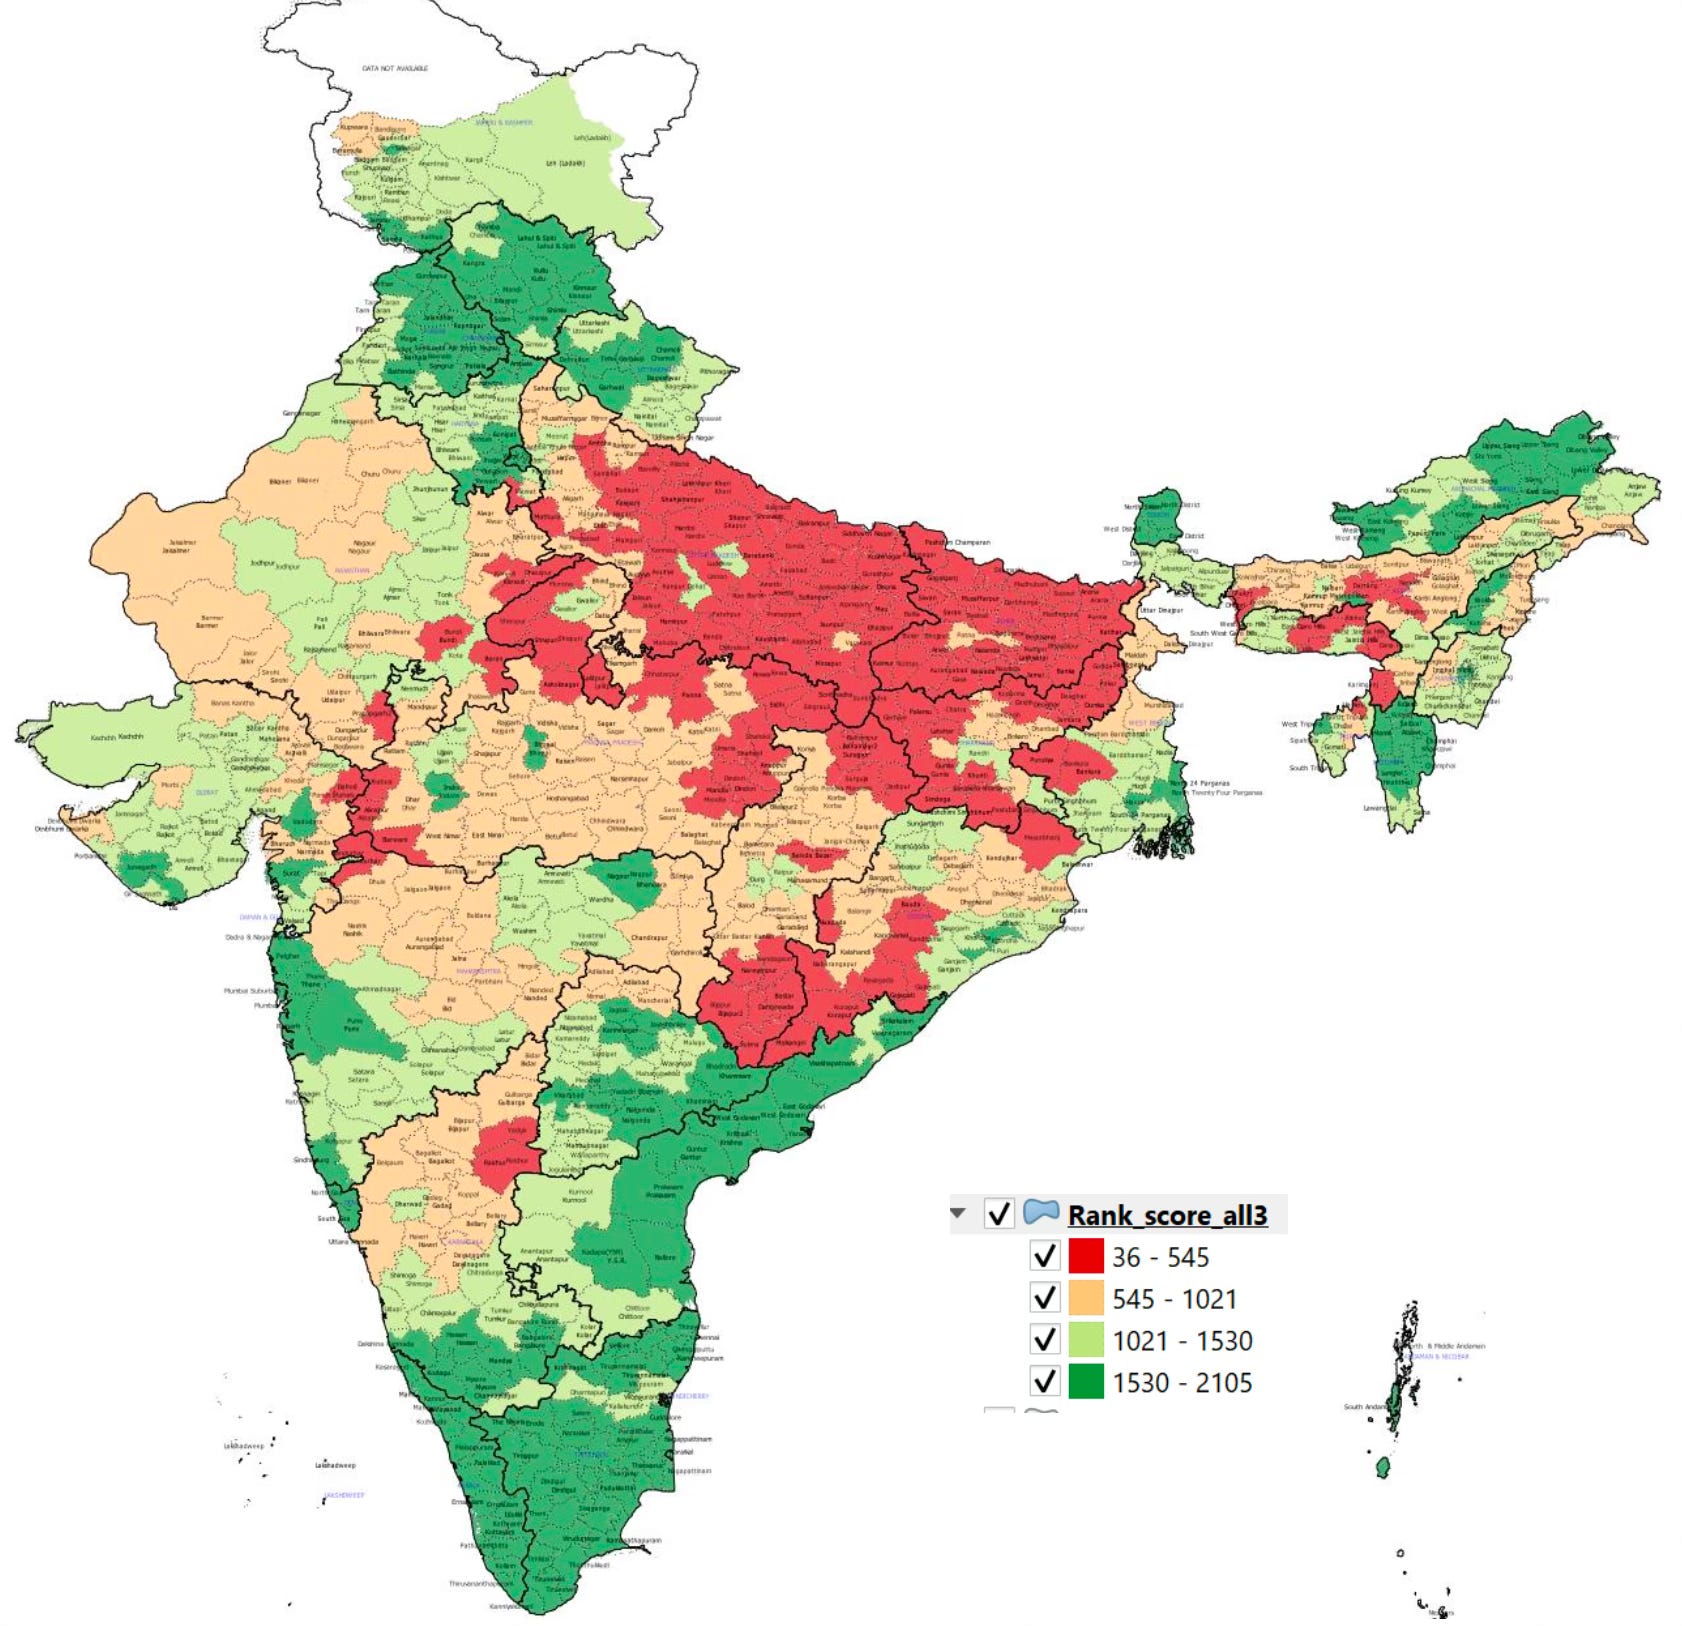
While the maps show several instances of districts as islands of underdevelopment, it also finds that backward districts are contiguous and clustered. It therefore advocates cluster and state-based approach over and above district-based approach to deal with extreme backwardness. It points to geographical factors of vulnerability - floods, forest, dry lands, remoteness - and historical/cultural factors among tribes, scheduled castes, and minorities. 

Some general observations:

1. The maps convey a world of wide variations across districts within the same state, underlining the point that there’s no one India nor even one state when it comes to human development and economic growth. At best, there are geographical clusters. 

2. If we take all these maps together, it’s clear that in terms of states, Bihar, Uttar Pradesh, Jharkhand, Madhya Pradesh, and Chhattisgarh are where India’s biggest human development and economic growth challenges lie. Kerala, Tamil Nadu, Andhra Pradesh, and South Karnataka stand out, followed some distance behind by west India including North Karnataka. Maharashtra and Karnataka pose a problem given the co-existence of prosperity and development with backwardness and underdevelopment. 

3. This also means that reconciling these variations with practical administrative convenience, we can perhaps have four or five broad categories of national programs on education, health, nutrition, skilling, drinking water, irrigation, housing, rural electrification, social welfare etc. One for the core southern states; another for Punjab, Haryana, HP, J&K, and Delhi; one for the west; another for the northern states; and a fifth for North East. Perhaps the first and second could be merged. Maybe we start with just three. This could be a prudent first step in reforming the current one-size-fits-all approach of central share and central sector programs. 

4. The clusters and contiguous districts can perhaps be significantly be addressed through Big Push measures, primarily focused on irrigation, connectivity, and electricity. But this alone will not be sufficient. It’ll also require some economic growth catalysis. This part is difficult. For example, these clusters could benefit from some growth anchor or igniter - a town/city within the region, an industrial cluster/corridor, a large new investment, a large government institution etc. 

The isolated district (or 2-3 districts) are a much bigger problem. They are entrapped in bad historical equilibriums and would require more concerted district-wise efforts to relax cultural, historical, caste/religious constraints. 

5. I’m not sure about the mechanics of implementation of the second layer of context-specific interventions. For simplicity, I can only say that these interventions will need to be carefully thought out by involving stakeholders, prioritised, and a 20 year plan made with clear outcome objectives and intermediate milestones and timelines. This will include prioritisation of infrastructure investments, economic growth interventions, and measures to relax the social-cultural constraints. As a note of caution, the danger here is that this exercise will get outsourced to some management consultant, thereby signifying a kiss-of-death even before the implementation has started. This effort will be blunt without an explicit acknowledgement of state capability weakness and poor governance, and efforts to address them. 

6. I can think of two areas to build on this work. One, change in these economic and human development parameters over time based on investments in roads (PMGSY), irrigation (PMKSY and projects coverage) and electricity, and programs like NREGS, Poshan Abhiyan etc. Apart from being an evaluation of these flagship programs, it would also throw up insights on whether these alone are creating any impact and whether there’s the need for complementary interventions. 

The second is to introduce elements of state capability and governance. I’m inclined to believe that whatever one does with hard infrastructure and public goods, and enablers, without good governance it’ll be hard, if not impossible, to break out of entrenched backwardness and poverty. What are good indicators of governance? I can think of comparisons on vacancy of teachers, nurses, and doctors in primary schools and primary health facilities; average expenditure percentages of certain important programs (or program components); some measure of institutional penetration (Police Station, Post Office etc per unit of population or area). For sure, there’ll be endogeneity in many of these with backwardness. 

Saturday, May 20, 2023

Weekend reading links

1. Brett Christophers has a very good article which links to several examples of infrastructure funds and private equity ownership of infrastructure assets gone wrong. It has become conventional wisdom that governments should stay out of infrastructure and should, at best, use public finance to de-risk projects so that private investors can come and invest. The main source of private investment in infrastructure is nowadays from infrastructure funds. Christophers writes that the number of global infrastructure focused funds rose from fewer than 100 in 2016 to more than 250 by 2020, with the total assets under management having quintipled since 2009. 

Led by Macquarie, an Australian financial services group that is the sector pioneer, asset managers began investing substantially in Asian and European infrastructure in the early 1990s. Today, in countries such as South Korea and Britain, infrastructure funds are the leading owners of major infrastructure assets in a range of sectors, among them energy, transportation and water.

The story of asset-manager-led infrastructure investment is overwhelmingly a negative one. Asset managers are focused on optimizing returns on the assets they control by maximizing the income they generate while minimizing operating and capital costs. Many users of infrastructure that has come under asset manager ownership have suffered, as service rates have risen quickly and service quality has deteriorated. Nowhere is this better illustrated than in Britain. There, numerous types of infrastructure have come substantially under asset manager ownership. This has led to consistently negative outcomes in, for example, care facilities, schools and water supply. Many observers have concluded that essential infrastructure and asset manager ownership simply don’t mix.

And in South Korea, Macquarie’s eight-year investment in Metro Line 9, part of the Seoul subway system, involved a bitter spat with the metropolitan government over a proposal to hike fares by nearly 50 percent. That led Macquarie and other shareholders in 2013 to unceremoniously sell their stake, in what commuters came to call the subway line from hell. Local critics charged Macquarie with taking excessive profits without assuming any risk, an accusation that has been a consistent drumbeat accompanying the phenomenon of asset manager infrastructure investment around the world. Macquarie said that it is committed to its operations in Korea and that its Korean infrastructure fund is a “passive financial investor” that has cooperated fully with the city of Seoul. 

The story has been much the same when housing is owned by asset managers. There have been allegations of skimped maintenance and egregious eviction practices in some areas. Such outcomes have been reported in Spain, for example, a notable hot spot of asset manager investment in housing since the global financial crisis, by a series of academic researchers. If the United States has been a relative laggard in asset-manager-owned infrastructure, it has been in the vanguard of asset-manager-owned housing.

2. Productivity booms lag behind inventions.

3. FT feature on South Africa's izinyoka's or copper thieves who steal for survival or to maintain drug addiction.
Copper was the new gold, as far as their gang was concerned, and anywhere it could be found was fair plunder. Theoretically, the sale and export of scrap copper is carefully controlled by South African officials. But the properties that make it the world’s third most-used metal also make copper a smuggler’s dream. Malleable and recyclable, it is easily melted down, after which its origin becomes virtually untraceable. It was February 2021 and prices had hit a 10-year high, reaching $9,000 a tonne on international markets. Any number of unscrupulous dealers would buy the coveted metal, then resell it in South Africa or, more likely, help smuggle it to booming markets in China and India... That made a ragtag group of izinyoka the first link in a lucrative supply chain ultimately controlled by international syndicates... in their time working together, they had all hacked down telephone poles, dug up underground cables and broken into industrial plants. Train stations were a favourite target. By the end of that year, izinyoka had ripped out more than 1,000 kilometres of overhead cable from Transnet, the state-owned freight rail operator, prompting it to contemplate switching from hybrid electric locomotives to diesel-only models that don’t require cabling...

In January, the consequences of industrial-scale theft in South Africa included: three security guards killed during heists; three hospitals scaling back operations because stolen copper plumbing hampers their ability to pipe oxygen to intensive care units; trains cancelled due to stolen signalling cable or track sleepers; parts of the city going without electricity for days after thieves toppled pylons. Mining, South Africa’s largest industry, has been severely disrupted. Pits across the country churn up gold, gemstones, rare earth metals and coal, and the country is home to about 90 per cent of known deposits of platinum, vital for electronics and electric vehicles. One morning in March, a platinum operator discovered 300 metres of copper cabling had been stolen from a production site. Workers at Royal Bafokeng Platinum laid new cables the following day, but the thieves were back by nightfall... City Power, Johannesburg’s main power utility, reported the cost of replacing cables stolen between July 2022 and February this year at R380mn ($21mn).

4. Edward Glaeser and Carlo Ratti write about reviving New York City, which like other cities around the developed world is facing large office vacancies in the aftermath of the pandemic

New York needs to attract the rich and talented, but the poem beneath the Statue of Liberty reminds us that the city’s greatness comes just as much from being the landing site for “your tired, your poor, your huddled masses” that it is now pricing out. One way to balance these two governmental imperatives — to help the poor and generate tax revenue from the affluent — is to view the city as a for-profit real estate development company wholly owned by a nonprofit poverty-alleviation entity. The for-profit company focuses on keeping the city attractive to the rich, and the revenue it generates gets plowed into schools and support for the poor.

This about how the office spaces can be converted into residential spaces and people brought back to the streets

Modern office towers have deep floor plans meant to maximize square footage, but units in residential buildings need windows and their natural ventilation and daylight. To achieve conversion at scale, we must therefore look past the architecture of the traditional apartment. Deep-core office buildings could be converted into new kinds of spaces optimized for co-living and co-working. Bedrooms, with windows, could line the perimeter while common areas for cooking, laundry, work, exercise and socializing could fill the middle. Such arrangements could also help meet one of the social challenges of our time: loneliness... The urban playground should be constantly rearranged: Streets could be cleared for weekends, annual festivals and temporary exhibitions; food bazaars and pop-up shops could multiply. Movie theaters struggle to compete with boundless streaming catalogs available on cheap 4K televisions. More outdoor screenings on summer nights could tip the balance back toward collective experience. These easy interventions are especially useful for garnering public support. To draw people into the Playground City, we need to show, not tell.

5. TSMC is facing a crunch on its most important resource, skilled chip engineers. Taiwan's chip sector employs around 326,000 engineers. There is an acute shortage of chip engineers, with China reporting an estimated shortage of 200,000 engineers. 

6. The debate on the proper role of the corporation has a century old echo

Chief executives have been debating the proper role of corporations — to make profits for shareholders or to serve society at large? — for more than a century. The Michigan Supreme Court considered the question in 1919, when the Dodge brothers, as shareholders in the Ford Motor Company, complained that Henry Ford was diverting profits into expanding the business and lowering the price of cars, rather than paying dividends. More than 50 years before Milton Friedman would famously declare that an executive’s responsibility was to make “as much money as possible,” Ford argued the opposite, saying the purpose of a corporation was to increase employment and pay good wages, and only incidentally to make money. The court ruled in favor of the Dodges. Some business leaders sided with Ford. Owen Young, the chairman of General Electric, said in the 1920s that, in addition to paying a “fair rate of return,” corporations had an obligation to labor, customers and the public.

7. Norway is at the vanguard of the shift to electric vehicles

Last year, 80 percent of new-car sales in Norway were electric, putting the country at the vanguard of the shift to battery-powered mobility. It has also turned Norway into an observatory for figuring out what the electric vehicle revolution might mean for the environment, workers and life in general. The country will end the sales of internal combustion engine cars in 2025. Norway’s experience suggests that electric vehicles bring benefits without the dire consequences predicted by some critics. There are problems, of course, including unreliable chargers and long waits during periods of high demand. Auto dealers and retailers have had to adapt. The switch has reordered the auto industry, making Tesla the best-selling brand and marginalizing established carmakers like Renault and Fiat. But the air in Oslo, Norway’s capital, is measurably cleaner. The city is also quieter as noisier gasoline and diesel vehicles are scrapped. Oslo’s greenhouse gas emissions have fallen 30 percent since 2009, yet there has not been mass unemployment among gas station workers and the electrical grid has not collapsed.

8. The Economist has an article which suggests that in relative economic terms China may already have peaked and it may never surpass the US GDP. 

Capital Economics, a research firm, argues that China’s economy will never be number one. It will reach 90% of America’s size in 2035 and then lose ground. In so far as the Peak China thesis can be captured in a single projection, this is it. What accounts for the lower expectations for China’s economy? And how much of a reduction is warranted? The answers hinge on three variables: population, productivity and prices. Start with population. China’s workforce has already peaked, according to official statistics. It has 4.5 times as many 15- to 64-year-olds as America. By mid-century it will have only 3.4 times as many, according to the un’s “median” forecast. By the end of the century the ratio will drop to 1.7...

The biggest swing in sentiment relates not to population but to productivity. Back in 2011 Goldman Sachs thought labour productivity would grow by about 4.8% a year on average over the next 20 years. Now the bank thinks it will grow by about 3%. Mark Williams of Capital Economics takes a similar view... As China ages, it will have to devote more of its economic energies to serving the elderly, leaving less to invest in new kit and capacity. What is more, after decades of rapid capital accumulation, the returns to new investments are diminishing... 

If China’s prices or exchange rate fail to rise as Goldman Sachs expects, then China’s gdp might never overtake America’s. If China’s labour productivity grows just half a percentage point slower than Goldman Sachs envisages, its gdp, everything else constant, will also never surpass America’s (see chart). The same is true if America grows half a point faster (as Capital Economic projects). If China’s fertility rate declines further (to 0.85 children per woman by mid-century), it might eke out a lead in the 2030s only to lose it in the 2050s. Even if China’s economy does become the biggest in the world, its lead is likely to remain small.

9.  For all the talk about its decline, The Economist points to some staggering numbers about the American economic progress over the decades, and it continues.

America’s $25.5trn in GDP last year represented 25% of the world’s total—almost the same share as it had in 1990. On that measure China’s share is now 18%... In 1990 America accounted for 40% of the nominal GDP of the G7, a group of the world’s seven biggest advanced economies, including Japan and Germany. Today it accounts for 58%. In PPP terms the increase was smaller, but still significant: from 43% of the G7‘s GDP in 1990 to 51% now... A hundred dollars invested in the S&P 500, a stock index of America’s biggest companies, in 1990 would have grown to be worth about $2,300 today. By contrast, if someone had invested the same amount at the same time in an index of the biggest rich-world stocks which excluded American equities they would now have just about $510... 

America’s working-age population—those between 25 and 64—rose from 127m in 1990 to 175m in 2022, an increase of 38%. Contrast that with western Europe, where the working-age population rose just 9% during that period, from 94m to 102m... between 1990 and 2022 American labour productivity (what workers produce in an hour) increased by 67%, compared with 55% in Europe and 51% in Japan... TFP in America increased by about 20% between 1990 and 2019. The G7 as a whole averaged less than half that... roughly 34% of Americans have completed tertiary education... Only Singapore has a higher rate... America is home to 11 of the world’s 15 top-ranked universities in the most recent Times Higher Education table.

And some pointers of economic dynamism,

In 2013 a Gallup survey found that about one in four adult Americans had moved from one city or area within the country to another over the past five years, compared with one in ten in other developed countries. About 5m move between states each year... Stockmarket capitalisation runs to about 170% of GDP; in most other countries it comes in below 100%... about half of the world’s venture capital goes to firms in America... 5.4m new businesses started in 2021, an annual record and a 53% increase from 2019... an OECD measure of the personal cost of failure for entrepreneurs consistently puts America and Canada at the bottom... (in the) World Management Survey America sits at the top of their ranking. Fierce competition... helps to explain America’s corporate culture. Bosses are more comfortable with firing employees... Markets are readier to reward companies for evidence that they are well run. America’s managerial strength, the survey finds, explains as much as half of the productivity lead that it has over other developed countries.
10. Novovax struggles with getting countries to comply with their advance market commitments to purchase Covid 19 vaccines. The lack of demand has led to governments either reneging or seeking to renegotiate their AMCs. The same problem is there with other vaccine makers' AMCs too. 

11. Berggruen Institute Governance Index for 2022 is here. This is the report. 

12. Indian Express article on Kerala's neighbourhood women's groups, Kudumbashree, that is the largest women's collective in the world and has completed 25 years of existence. 

It runs 49,200 micro-enterprises — 31,589 individual units and 17,611 group enterprises. So ubiquitous that in every half a kilometre in the state, you bump into one initiative or the other of Kudumbashree... Kudumbashree’s 46,16,837 members have organised themselves into 3,09,667 neighbourhood groups (or NHGs, called ayalkootam in Malayalam). The neighbourhood group is the primary level unit of Kudumbashree that has a three-tier hierarchy. The next rung is the Area Development Society (ADS) that functions at the level of the ward, followed by the Community Development Society that works at the local government. The NHGs usually begin with thrift and credit programmes, lending money to members using the group’s savings. Subsequently, NHGs are graded and once they qualify, they are eligible for bank loans. These loans address the immediate financial needs of the group members. Subsequently, the state government supplies grants and subsidies, besides administrative support. Banks provide loans to members at low interest rates. The total thrift collected by NHGs in the state, according to Kudumbashree’s website, stands at Rs 5,786.69 crore and the internal loans generated are to the tune of Rs 23,852.45 crore.

This is a striking achievement

Besides social mobility, the movement has armed women with political mobility too. Of the 11,000-odd seats reserved for women, 7,038 were won by active Kudumbashree members in the 2020 local body elections, up from 848 in 2005.

13. Argentina's latest bout of hyper inflation, spike in interest rate, currency collapse, foreign debt default, IMF bailout, economic contraction is on.

Argentina will announce on Monday a new round of emergency government measures, including raising interest rates 600 basis points to 97 per cent, to try to stave off the country’s worst economic crisis in two decades. The Peronist government is desperate to avoid a big devaluation before elections in October. But the South American country is also running out of foreign exchange reserves as Argentines abandon the fast-devaluing peso and embrace the US dollar. Fuelled by money-printing to finance a large government deficit, Argentine inflation hit 109 per cent a year in April, the highest level since 1991. The economy ministry said the new measures, to be announced Monday, would involve the central bank stepping up intervention in the foreign exchange market to try to slow the peso’s fall. Economy minister Sergio Massa is also trying to persuade the IMF to bring forward the disbursement of agreed loans and will travel to China on May 29 to seek greater use of the renminbi in foreign trade.

14. The Business Standard has an article which analysed 10 infrastructure stocks over the last twenty years and found them big wealth destroyers. 

Companies in the construction and infrastructure sector have been among the biggest underperformers and wealth destroyers in the stock market in the past 20 years. The sector has also seen a wave of corporate failures and bankruptcies, making it tough for retail or non-promoter shareholders to make money on their investments. The numbers suggest that companies in the infrastructure sector go through a typical boom-and-bust cycle. First, there is a sharp rally in the share price as companies report rapid growth in revenues and profits, but then earnings growth loses steam, triggering a big sell-off in these stocks and a further decline in share prices that lasts for years. For the poor showing by these companies, analysts blame high debt, poor return on capital and equity, and the inability of these firms to sustain growth and earnings when financial and macroeconomic conditions turn adverse.

15. Ghana signs a $3 bn bailout from IMF following defaulting on its $34 billion debt in December last. The IMF estimates another 19 countries in the continent could face the same fate. 

The government borrowed heavily to insulate the economy from the effects of the pandemic and may have avoided a recession as a result. But the country’s debt as a percentage of GDP went from 62.7 per cent in 2020 to more than 100 per cent last year, according to finance minister Ken Ofori-Atta. Debt servicing now takes up about 70 per cent of government revenue... The administration stopped charging for mains water and brought in cheaper tariffs on electricity... The government saw an opportunity in leveraging the Covid pandemic to engage in reckless expenditure in view of the 2020 election... Much of the Ghanaian government’s spending took place in a world of low-interest rates. Ghana gorged on cheap money, raising almost $17bn in eurobonds that the Ministry of Finance frequently said were oversubscribed for nine straight years. But as central banks began raising rates to control inflation — the Bank of Ghana has raised rates by 1,250 basis points since March 2022 — Ghana found itself shut out of international debt markets as concerns grew over its ability to repay what it owed. The government has since been forced to rely heavily on a domestic capital market, where interest rates are as high as 40 per cent, and central bank financing of 37.9bn cedis ($3.2bn) in 2022. Some of the money being injected into the economy by the central bank may have helped to fuel inflation.

Historically, Ghana, like Sri Lanka, has been a relative good performer in the region.

16. Finally, Gillian Tett has more data on how bad mobile phone use is on children's mental health.

A group called Sapien Labs, which studies mental health, has polled almost 28,000 18-24-year-olds. Part of Gen Z, Sapien describes this cohort as “the first generation who went through adolescence with this technology”. It’s no surprise that this research shows that Gen Z’s mental state is worse than earlier generations. As psychologist Jean Twenge notes in Generations, teenage mental health has worsened sharply in the past decade, the period after smartphones went mainstream. Covid-19 has exacerbated the problem, according to the Centers for Disease Control and Prevention. What’s most interesting, however, is that Sapien tracked the age at which respondents first got cell phones and compared this with their reported mental health. This showed a clear pattern: kids who received phones at a younger age had worse mental health, even after adjusting for reported incidents of childhood trauma. The share of females experiencing mental health challenges ranged from 74 per cent for those who received their first smartphone at age six to 46 per cent who received it at age 18. For males, the numbers were 42 per cent and 36 per cent... The pattern was particularly stark in one of six mental health categories, known as the “social self”, which tracks how we view ourselves and relate to others.  

Thursday, January 19, 2023

Incidence of indirect taxes illustrated

Econ 101 informs that indirect tax incidence is higher on the poor and therefore are regressive and encourages a greater share of national tax revenues come from direct taxes. However, in countries like India revenues from indirect taxes are almost equal to that from direct taxes (in 2021-22, direct tax to GDP ratio was 6.1%, compared to 5.6% for indirect taxes). 

A new Oxfam report has a hugely informative table on what proportion of indirect taxes is contributed by different income categories.

As a corollary, the share of income spent on indirect taxes is orders of magnitude higher for the bottom half compared to the top decile. 

The report also points to high levels of wealth inequality in India

By 2020, the income share of bottom 50% was estimated to have fallen to only 13 per cent of the national income and have less than 3 per cent of the total wealth... This is in stark contrast to the top 30 per cent who own more than 90 per cent of the total wealth. Among them, the top 10 per cent own more than 80 per cent of the concentrated wealth. The wealthiest 10 per cent own more than 72 per cent of the total wealth, the top 5 per cent own nearly 62 per cent of the total wealth, and the top 1 per cent own nearly 40.6 per cent of the total wealth in India.

Thursday, December 29, 2022

India income distribution graphic of the day

Fascinating graphic on income distributions and income gaps in 16 countries.

India has the highest income gap between the 90th and 99th percentile, the most closely bunched distribution between 20th and 80th percentile, the poorest first quintile, and the lowest median income. It points to an important insight about the nature of India's income distribution - the extremes of wealth and poverty, much higher than elsewhere, and a very narrow base of consumers.

This squares us with data from elsewhere. The Pew Research Centre, using the updated ProvcalNet household consumption based income database also used by the World Bank, found that at the end of 2020 while only 5% of Indians live on less than $2 per capita (at PPP) per day, 87% live between $2-10, 7% between $10-$20, 2% live between $20-$50, and just 0.2% (or 3 million people) earn more than $50 per day. 

All this points to the very narrow base of India's consumption class and the large base of those requiring welfare support. As I have blogged on several occasions, and also written in Can India Grow, the growth of the consumption class requires making the nature of economic growth more broad-based. 

Saturday, September 24, 2022

Weekend reading links

1. Fascinating graphic which shows how the US and UK resemble societies where the poor are poorer than the developed country average, and the rich are richer.

While the top earners rank fifth, the average household ranks 12th and the poorest 5 per cent rank 15th. Far from simply losing touch with their western European peers, last year the lowest-earning bracket of British households had a standard of living that was 20 per cent weaker than their counterparts in Slovenia... In 2007, the average UK household was 8 per cent worse off than its peers in north-western Europe, but the deficit has since ballooned to a record 20 per cent... The rich in the US are exceptionally rich — the top 10 per cent have the highest top-decile disposable incomes in the world, 50 per cent above their British counterparts. But the bottom decile struggle by with a standard of living that is worse than the poorest in 14 European countries including Slovenia.

2. I have blogged here about the difficulties presented in evaluating the current episode of economic slowdown. As the graphics show, on most parameters of labour market health, the current situation is far better than in any recession over the last ten years. 

The picture is mixed on the consumption


... and production sides.

3. Indian cinema industry fact of the day
Affluent southern states often have more cinema screens than the Hindi-speaking heartlands. Tamil Nadu, with a population of less than 80mn, has 1,104 screens; Hindi-speaking northern Uttar Pradesh, India’s most populous state with nearly 230mn inhabitants, has just 539.

4. Local government financing vehicles (LGFV) in China have stepped in as buyers of last resort in the property market, thereby allowing cash strapped local governments raise money by selling lands and also backstopping the real estate market from crashing.

According to official data, land acquisitions by LGFVs rose to Rmb400bn ($57bn) in the first half of the year, up more than 70 per cent compared with the same period in 2021. This is despite overall land purchases, which have previously been dominated by private developers, falling by almost a third as Beijing cracks down on real estate speculation. The buying spree is intended to help cash-strapped local authorities, for whom selling land is an important source of income. But the LGFVs, which play a critical role in funding long-term infrastructure development, are being forced to borrow more from state banks and issue bonds to finance the deals... Most LGFVs, which typically have little experience in property development, are leaving their newly purchased plots idle. This, combined with the larger housing market meltdown, means the short-term relief that local authorities get from the financing vehicles’ land purchases ultimately risks bigger problems for China’s already faltering economy...

Official data show LGFVs accounted for almost a quarter of land sales in the first half of this year, compared with 9 per cent in the same period a year ago. The ratio exceeded 50 per cent in some less-developed small cities... To make up for the lack of bidders, many cities have raised the minimum price for land auctions. That has often forced LGFVs to pay a premium even as the market is weakening... Most LGFVs face cash flow constraints as they derive the bulk of their income from government-backed infrastructure projects with long-term horizons for returns. In the meantime, state lenders are willing to either issue loans to LGFVs against land as collateral or buy the latter’s bonds in the hope authorities will step in if a crisis occurs.

5. The global race to dominate semiconductor manufacturing

The article outlines what China is doing to achieve self-sufficiency in the cutting-edge technology sectors. It's packing its bureaucracy with technocrats instead of bureaucrats, and picking winners among emerging businesses and supporting them with fiscal concessions.
At a national meeting held this month in the eastern province of Jiangsu, China named 8,997 enterprises as “little giants”, putting them in line for tax breaks so they can help China compete with the US and other western powers... In the past few years, China has overseen the establishment of more than 1,800 so-called government guidance funds, which have raised more than Rmb6tn ($900bn) to invest largely in tech sectors that Beijing deems “strategic”. The funds’ salient feature is that they are mostly run by provincial and local governments or by state-owned enterprises... Companies had to be vetted by local governments in the first instance, opening up the potential for favouritism and corruption. At the same time, government officials can be poor assessors of a company’s prospects, especially when it involves technology that is hard to understand.
6. Tamal Bandopadhyay has some interesting snippets about government bond market in India,
Till the last week (September 16), the government has raised Rs 7.72 trillion without any hiccups. Net of redemptions, the net borrowing has been Rs 4.39 crore... In FY2019, it had borrowed Rs 5.71 trillion gross amount (net Rs 4.23 trillion). The next year, the gross borrowing was Rs 7.10 trillion (Rs 4.74 trillion). In the Covid-hit FY2021, the gross borrowing zoomed to Rs 13.7 trillion (Rs 11.43 trillion). Last year, it dropped to Rs 11.27 trillion (Rs 8,63 trillion) before rising to its historic high of Rs 14.31 trillion this year (Rs 11.61 trillion)... In FY2019, the gross SDL was to the tune of Rs 4.78 trillion (Rs 3.49 trillion); in FY2020, it rose to Rs 6.35 trillion (Rs 4.87 trillion) and further to Rs 7.99 trillion (Rs 6.52 trillion) in the next financial year. Last year, the states raised Rs 7.02 trillion (Rs 4.92 trillion). Till September 16 this year, the states have raised just Rs 2.44 trillion (net Rs 1.29 trillion) from the market, much less than the estimated Rs 4.01 trillion in the first half of the financial year.

The article also had an interesting factoid which underlines the problem of low investment appetite among corporates

Till June, the net corporate bond issuance has been negative. This means, redemptions of old bonds have been higher than fresh bond floats. Contrast this with Rs 4.04 trillion net issuance in FY2022 and Rs 3.59 trillion in FY2021.

7. Fascinating set of stats about Roger Federer, Novak Djokovic, and Rafael Nadal.

More on Roger Federer. Barney Ronay in The Guardian

And with Federer greatness was as much about style and form and texture. There was a sense in his talent of something that never quite reached its end point. Even at its most concentrated pitch one never felt one got to the limits of what Federer might do. There is probably still a bit in there, Rog, if you ever feel like giving it another go... His backhand was frankly ridiculous, overblown, hilariously good. This, one thought, watching that thing – the flex of the knee, the flourish of the wrist – is a kind of artefact, a European cultural treasure, like a Bach cantata or a complete acorn-fed Iberian ham, the kind of backhand a power-crazed Bond super villain might try to steal from its laser-guarded case and transport to the moon... It was not the styling, the deep, piercing (woof) eyes, the balletic grace in his movements. The real Federer hit was the way these things were combined with accuracy, power, shot selection, competitive will. Federer was never just getting the ball back or staying in the rally but challenging to live at this pitch, to exist in his sporting world.

8. In an interview with CBS News, President Joe Biden has clearly indicated that the US would defend Taiwan from a Chinese attack by sending US forces to defend Taiwan. 

Whether he intended it or not, there is a game being played out here. Hitherto there was a strategic ambiguity about the likely American response in case of a Chinese invasion. This and the three previous statements by President Biden should serve as sufficient enough indication to the Chinese that there may no longer be any ambiguity about US response. To this effect, it has atleast significantly reduced, if not removed, from the Chinese calculations the possibility of US staying out in case of an invasion. One can reason that this, coupled with the outcomes from the ongoing Ukraine crisis, would have significantly reduced, at least for now, any possibility of a Chinese invasion.  

9. From Martin Wolf, in the context of UK economy, the point about limited correlation between tax rates and economic prosperity.

And this about product and labour market regulation among western economies.
10. Business Standard reports that the RBI has cracked down on outsourcing of loan recovery operations by lending institutions. 
The Reserve Bank of India (RBI) on Thursday barred non-banking financial services company Mahindra & Mahindra Financial Services(MMFSL) from outsourcing recovery agents, days after a 22-year-old pregnant woman died in Jharkhand’s Hazaribagh while trying to block loan recovery agents from taking away her father’s tractor and was crushed under the vehicle. The loan was taken from M&M Financial. “The RBI has… in exercise of its powers under Section 45L(1)(b) of the Reserve Bank of IndiaAct, 1934, directed MMFSL, Mumbai, to immediately cease carrying out any recovery or repossession activity through outsourcing arrangements, till further orders,” the RBI said... This is probably the first time the regulator has cracked down on lenders on recovery by coercive methods, which is typically a hallmark of outsourced recovery agents.

As the report says, given the widespread use of this practice, it remains to be seen how the RBI will be able to enforce its circular. 

It has become an increasingly common practice among banks to outsource its two critical activities - credit-worthiness assessment and recovery operations. In the circumstances, the lender becomes a fund manager who takes deposits, manages it, and transacts through the third parties. If you add securitisation of the loan book, the lender has limited skin in the game. 

11. Following concerns raised by Amundi Asset Management's Chief Investment Officer Vincent Mortier a few weeks back, now Mikkel Svenstrup, the CIO at ATP, Denmark's largest pension fund has compared the private equity industry to a pyramid scheme

Mikkel Svenstrup... said he was concerned because last year more than 80 per cent of the sales of portfolio companies by the private equity funds that ATP has invested in were either to another buyout group or were “continuation fund” deals, where a private equity group passes it between two different funds that it controls. “We’re a big fund investor, we have hundreds of funds and thousands of portfolio companies,” he said. “This is not good business, right? This is the start of, potentially, I’m saying ‘potentially’, a pyramid scheme. Everybody’s selling to each other . . . Banks are lending against it. These are the concerns I’ve been sharing.” ATP is a major investor in private equity funds. It has $119bn under management and has committed money to 147 buyout funds, according to PitchBook data...Mortier said some parts of the private equity industry “look like a pyramid scheme in a way”. Svenstrup said the “exponential growth” of the private equity industry in recent years, as investors have poured cash into its funds, would stop “at some point”, adding that this was “just a question of time”.

These calls may be the canary in the coal mine with respect to the PE industry. 

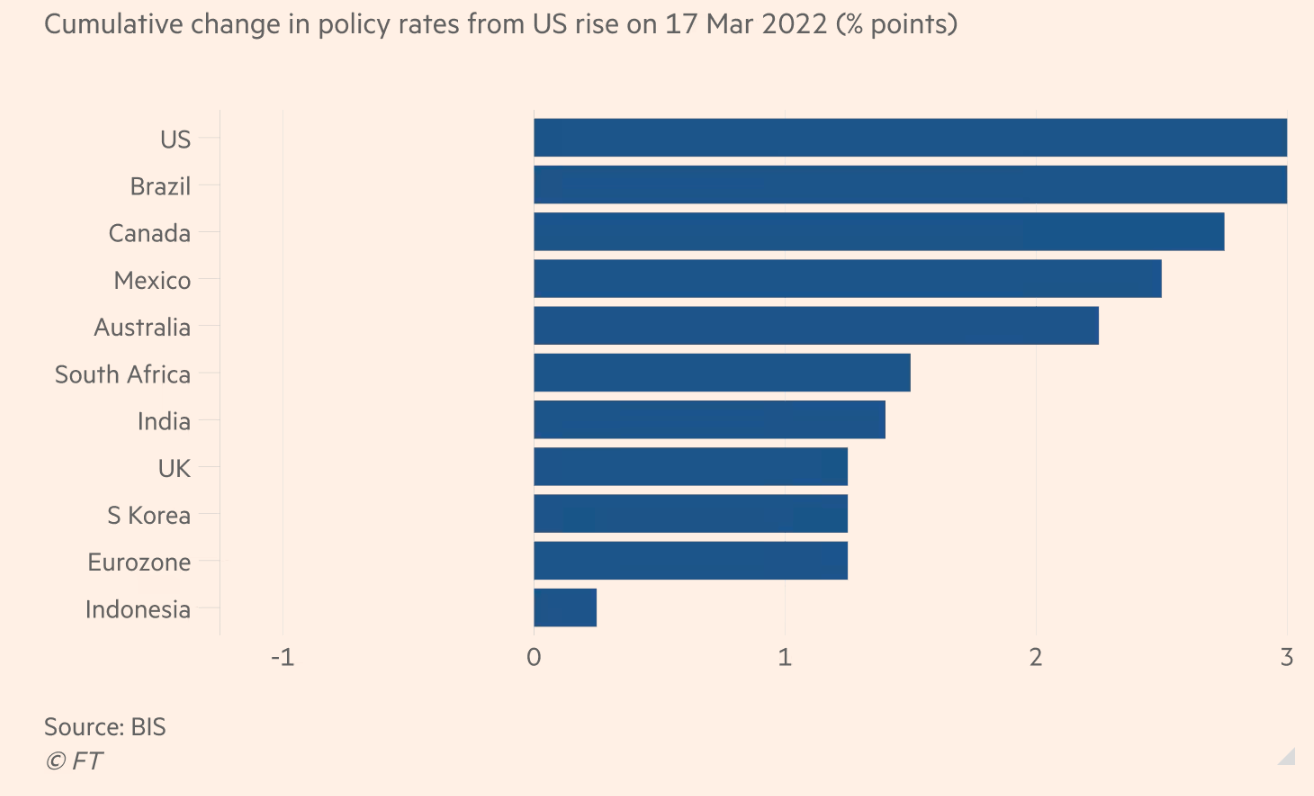
12. In The Rise of Finance, we discussed the adverse effects of US monetary policy spillovers on developing countries. The ongoing rate hikes and consequent strengthening of dollar, and associated sudden stops and capital flows reversals and imported inflation into developing countries is only the latest instance

The Fed, which on Wednesday made its third 75 basis point increase in a row, is playing catch-up. While that may be the best course of action for the US economy, its aggression is triggering what Maurice Obstfeld, of the Peterson Institute for International Economics, labels “beggar-thy-neighbour” policies. The consequences of the Fed‘s mistakes are effectively exported from the US, burdening America‘s trade partners. Higher US rates have bolstered the dollar, exacerbating inflation elsewhere by raising the cost of commodities which are, more often than not, priced in the greenback. A “reverse currency war” is in full flow, with monetary authorities across the world now ditching their standard quarter-point increases in favour of 50, 75 and — in the case of Sweden and Canada — 100 basis point moves in order to stem dollar declines. Rate rises, while necessary to quell inflation, have become so aggressive the World Bank 
warned last week they risk sending the global economy into a devastating recession that would leave the world’s poorest countries at risk of collapse... Since the 2008 global financial crisis the Fed and other major market central banks have deployed wave after wave of stimulus. That left global interest rates at ultra-low levels for years on end. The result of that — plus the pandemic — is international debt levels are close to all-time highs. As financing costs rise, more and more of the world’s poorest countries are seeking support from the IMF and the World Bank.  

13. On gastronomy and air travel,

Business and first class account for about one-third of all airline seats but generate up to 70 per cent of revenue. The promise of a better meal is part of what motivates passengers to buy a premium ticket... At 35,000ft, the human tongue goes partially numb, causing you to lose about one-third of your taste buds. The microclimate of an aeroplane is drier than most deserts, which has an effect on the nose roughly equivalent to stuffing one nostril with toilet paper. Even the sound of the engine changes the way food tastes. Exposure to the background noise of an aeroplane, which can reach 80-85dB, dulls your sensitivity to salty and sugary flavours, while enhancing your perception of the proteinous fifth taste, umami. This explains the enduring love affair between air passengers and tomato juice, which is ordered as much as beer in flight. If you drink it in the sky, it will taste richer, more savoury, and less acidic.

14. Finally, Andy Mukherjee calls for greater scrutiny of the drivers of wealth creation of Gautam Adani.

Adani’s commodities, energy and transportation empire the $255 billion stock-market juggernaut it is today, even when the combined annual net income of its seven publicly traded firms is less than $2 billion... Elara India Opportunities Fund, which has amassed $4.2 billion — practically all of its assets under management — from three stocks: Adani Transmission Ltd., Adani Enterprises Ltd., and Adani Total Gas Ltd. APMS Investment Fund Ltd., whose $3.6 billion portfolio also includes Adani Power Ltd., has done it with four. There are three more of these Mauritius-based entities among major shareholders: Cresta Fund Ltd., LTS Investment Fund and Vespera Fund Ltd. A sixth, Albula Investment Fund Ltd., has exited Adani firms, with its portfolio shrinking to about $240 million from $1.6 billion in December, according to Bloomberg data. Between them, these publicity-shy investors own a combined $12 billion of Adani stock.

And the staggering reach of the conglomerate

The coal he mines, moves through his ports, and burns at his power stations provides electricity to Indians. Adani supplies families with piped gas when they’re sitting down to dinner, in which the cooking oil is also his, and the wheat probably stored at his warehouses. The new structures that will adorn the landscape of an underbuilt India over the next couple of decades will take construction materials from Adani, who just acquired 70 million tons of cement capacity and now wants to double it in five years. The businessman will collect toll on roads in the states of Gujarat and Andhra Pradesh, and host Indians’ data when they’re browsing the internet, waiting for a flight to take off from one of his airports. He’ll also help book the airplane tickets. And before you complain about the impact of coal, cement, palm oil and data centers on the environment, Adani says he’ll invest $70 billion into “cooling the planet down” with green hydrogen, wind turbines and solar panels. Throw in forays into media and money-lending to small businesses, and Adani may soon command a bigger share of an average Indian’s life than Amazon will ever garner from a typical American’s wallet.

Friday, October 29, 2021

Location is destiny - India edition

Branko Milanovic's seminal work illustrated the importance of location (country of residence) as the biggest determinant of global inequality. He argued that more than luck or effort or specific circumstances, people's economic outcomes are driven by the level and distribution of income within their country. 

The Opportunities Project work of Raj Chetty and Co highlights the importance of place of birth in determining future life outcomes of Americans. 

In the context of India, Prakash Loungani and others from the IMF have a paper that explores the role of location in determining living standards in India. 

Their headline finding,

It's not for, instance, caste or class that are really the dominant sources of your income. But as we were discussing, the fact of whether or not you were born in a poor rural community versus being born in an urban community, really is what determines 20, 25% of your income, just this one factor... we find that almost a third of living standards is likely to be determined by location alone.

Friday, July 30, 2021

India Covid 19 impact

It's now very clear that, like elsewhere in developed world, the formal economy in India too has rebounded smartly from the huge economic shock. It's even more impressive that this has been achieved with minimal fiscal stimulus. 

But it's with the informal economy that there was always doubts about its resilience to a shock of this nature. The Pew Research estimates that the Indian middle class has shrunk by a third, the number living below poverty line ($2 and below) has more than doubled to 134 million, and the poverty rate has risen to 9.7% in 2020, up from the January 2020 forecast of 4.3%. 

The net result is a widening of the base of the income pyramid, wiping out decades of impressive progress.  

It may be a matter of debate as to the degree of widening, but the reality of worsening of poverty and is hard to dispute. It deals a big blow to the second most impressive poverty reduction stories of last two decades. 
A study by the Azim Premji Institute has found that the number of individuals who lie below the national minimum wage threshold of Rs 375 per day increased by 230 million during the pandemic (comparing July 2019 and February 2020 to March-October 2020), an increase of 15 and 20 percentage points in rural and urban areas respectively. Given pre-pandemic income trends, without the pandemic, poverty would have declined by 5 and 1.5 percentage points and 50 million would have been lifted above poverty line. 
Further, nearly half of formal salaried workers moved into informal sector between late 2019 and late 2020. 
These findings are corroborated by research from elsewhere, including the World Bank. The Bank finds that 150 million people would be added to extreme poverty by 2021, with a large share coming from India.

There is limited macroeconomic data to capture the poverty trends given that most of the poor work in the informal sector, whose measures are inherently difficult to capture. However, there are other strong proxies of the impact. One has been the persistence of the high demand for NREGS works - in January 2021, 26.28 million households sought work which was 39.12% higher than last year. 

Or this about food insecurity,
Surveys of food insecurity during last year’s lockdown collated by Jean Dreze and Anmol Somanchi show that between 50 and 80% of households surveyed were eating less than before.
Other good proxies have been the trends from night lights data which too point to significant impacts on incomes.

On the labour market side, Mahesh Vyas points to a possible 11 million job losses since the pandemic struck. 
Employment in February 2021 compared to the average of 2019-20 shows a loss of 3 million jobs among business persons, a loss of 3.8 million jobs among salaried employees and 4.2 million among daily wage earners.

Finally, from an excellent data series by Pramit Bhattacharya in Mint on the impact of the pandemic. This on inter-state poverty trends and this on inter-country trends. India has contributed more than half of the global increase in poverty.

This on the steep wage cuts by the small firms as they struggle to survey.
This on the impact on schools and learning. India's school closures have the fifth longest, and the poorer children have suffered disproportionately especially with the shift in focus on remote and digital learning. It exacerbates pre-existing learning gaps.
Finally, this is the latest from The Economist,
Bank loans against gold jewellery, India’s most traditional way of saving, jumped by 82% in the past fiscal year. A poll of white-collar workers by Grant Thornton, a consulting firm, found that 40% of employees had suffered a pay cut last year. Another survey, of 3,000 mostly informal workers in Delhi, the capital, found that male breadwinners had on average suffered a 39% fall in income in the past year. Of the more than 38,000 respondents to another survey—carried out online, meaning all were rich enough to enjoy internet access—more than three-quarters said they expected their incomes to fall in the current year.

The recovery in the formal sector will become unsustainable without more broad-based recovery.  

Update 1 (10.08.2021)

More signs of labour market distress from the GoI's latest Periodic Labour Force Survey (PLFS),

It shows a sharp increase in employment in agriculture from 42.5 per cent of the total employment in 2018-19 to 45.6 per cent in 2019-20... Such a large shift of labour in favour of agriculture cannot be voluntary. It is a sign of distress in the labour market where non-agricultural sectors are unable to provide employment and labour is forced to shift to agriculture. The forced or at least involuntary nature of this migration is evident from the wages data provided by the PLFS. Salaried jobs provide wages of the order of Rs.16,780 per month. Self-employment provides wages of the order of Rs.10,454 per month. These translate into wage rates of Rs.558 per day and Rs.349 per day, respectively. In comparison casual labour which is the type of employment provided by agriculture yields much lower wages – of the order of Rs.291 per day. Labour would not voluntarily shift to this lowest wage-rate sector unless it had no better option. Agriculture provides a low wage safety net for labour during times of distress in India... PLFS estimates are for a 12-month period from July 2019 through June 2020...

According to the PLFS, the losers are manufacturing, construction and transport, storage and communication. The share of manufacturing in total employment fell from 12.1 per cent to 11.2 per cent. Of all the specific sectors for which PLFS provides data, the manufacturing sector saw the biggest fall (0.9 percentage points). The next largest loser is construction (0.5 percentage points). And then it is transport, storage and communication (0.3 percentage points). These three account for a little over half of the increase in the share of employment in agriculture.

Update 2 (19.08.2021)

The Covid 19 period have seen a steep rise in gold loans, a proxy for economic distress,
Gold loans have surged nearly 85 per cent over the past year, to Rs 60,464 crore… The outlier growth in gold loans compared to any other segment was also aided by the Reserve Bank of India’s (RBI’s) move to hike the loan-to-value (LTV) ratio for such loans from 75 per cent to 90 per cent… Take a look at the gold auctions. Mannapuram Finance had auctioned Rs 8 crore worth of the yellow metal in the first three quarters of FY21. This shot up to Rs 404 crore in the fourth quarter and further to Rs 1,500 crore in the June quarter.