Substack

Showing posts with label Indian Economy. Show all posts

Monday, July 27, 2026

The demand side constraint of the Indian economy

I blogged here, arguing that Indian businesses face a structural cost constraint similar to that of developed economies that erode their global competitiveness. This cost constraint on the supply side must be seen alongside a constraint of a consumption class that is far smaller and shallower than imagined. In other words, a developed country's cost structure in a low-income country's market size. 

This point has been a consistent argument of this blog and was documented in great detail in Can India Grow? in 2016, much before it became more widely recognised.

India’s demand-side problem is twofold. For a start, it already has a low per capita income, the lowest among its emerging market peers. Second, this itself conceals a low base of the consumption class that is also not widening proportionately with economic growth. The nature of economic growth is such that it is not only not broad-based enough but is also widening inequality. 

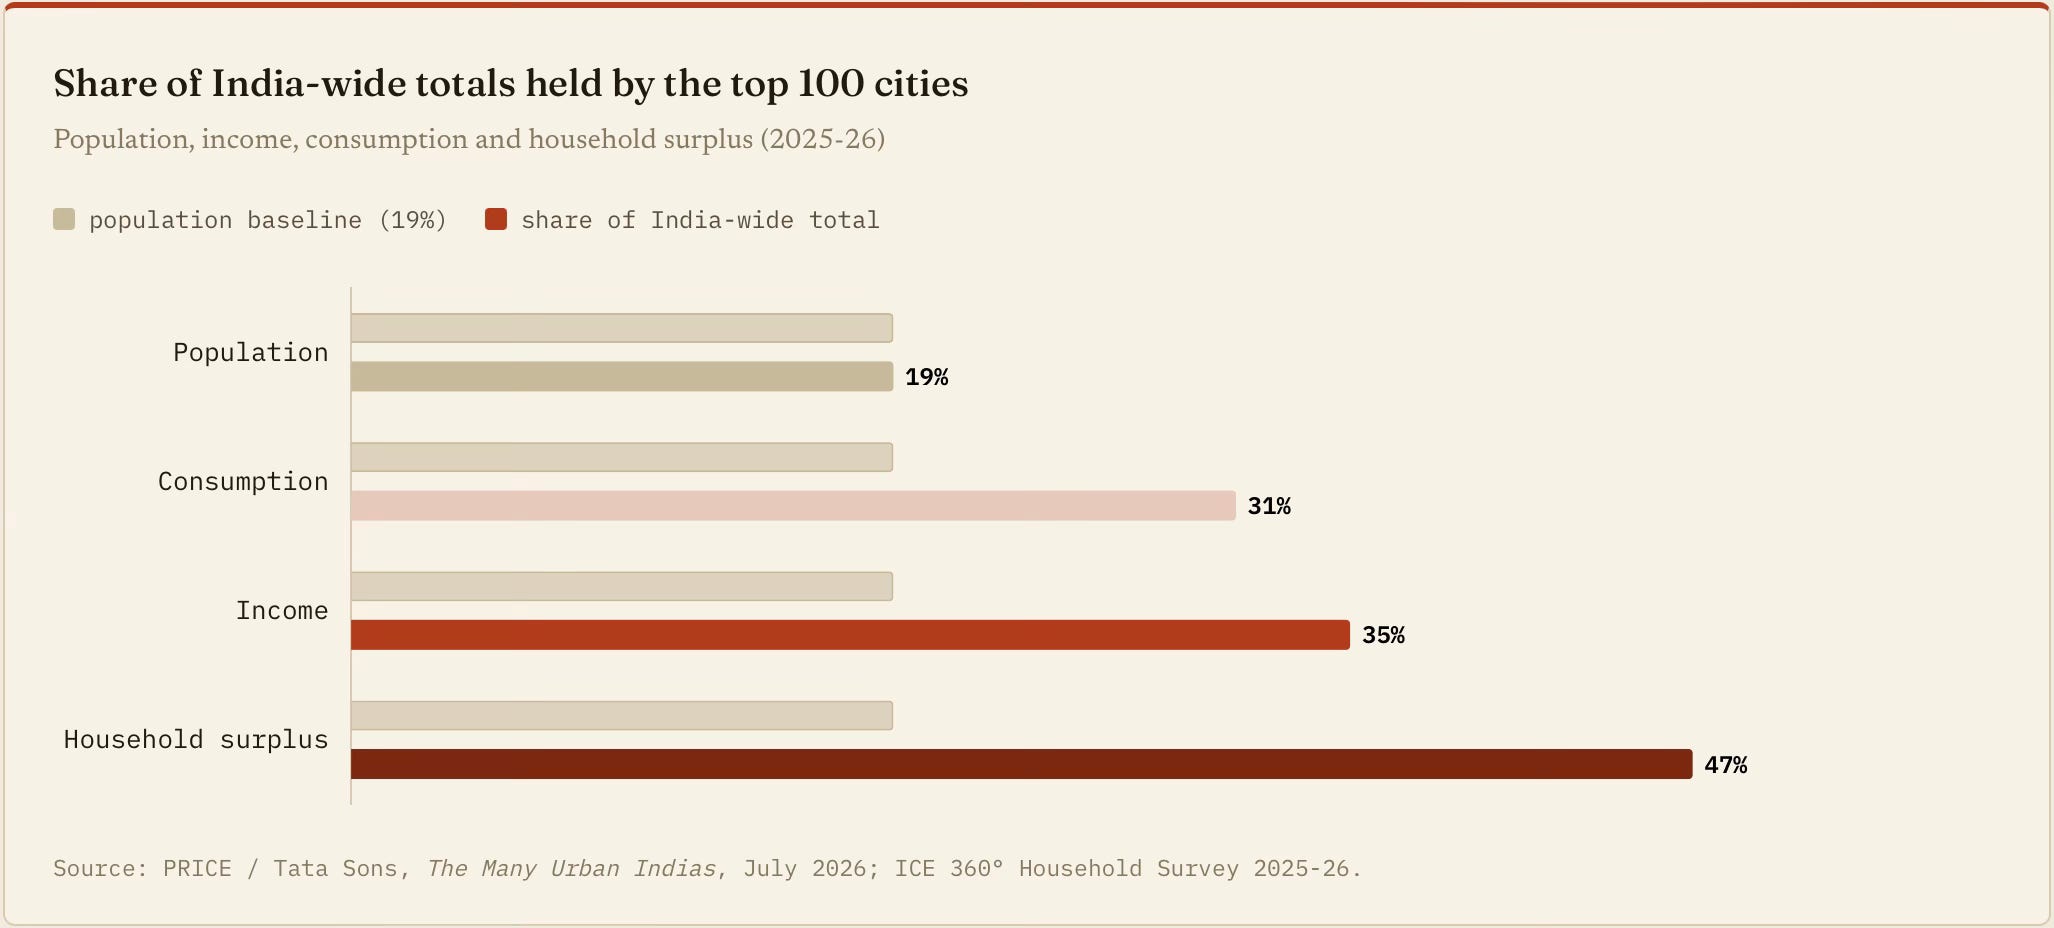
The recently released PRICE - Tata Sons Many Urban Indias report is a confirmation of the demand-side constraint. It finds that the top 100 cities, with just under a fifth of the population, capture almost half of all household surplus, the closest measure to genuine discretionary spending capacity. What sits outside, the other 81% of India, holds only about 53% of surplus combined, and most of that is in the top slices of tier-2/3 towns and the productive rural belt. The surplus-generating layer of the economy is essentially urban and already fully contained. There is no large pool of "middle India" outside urban India waiting to broaden the base.
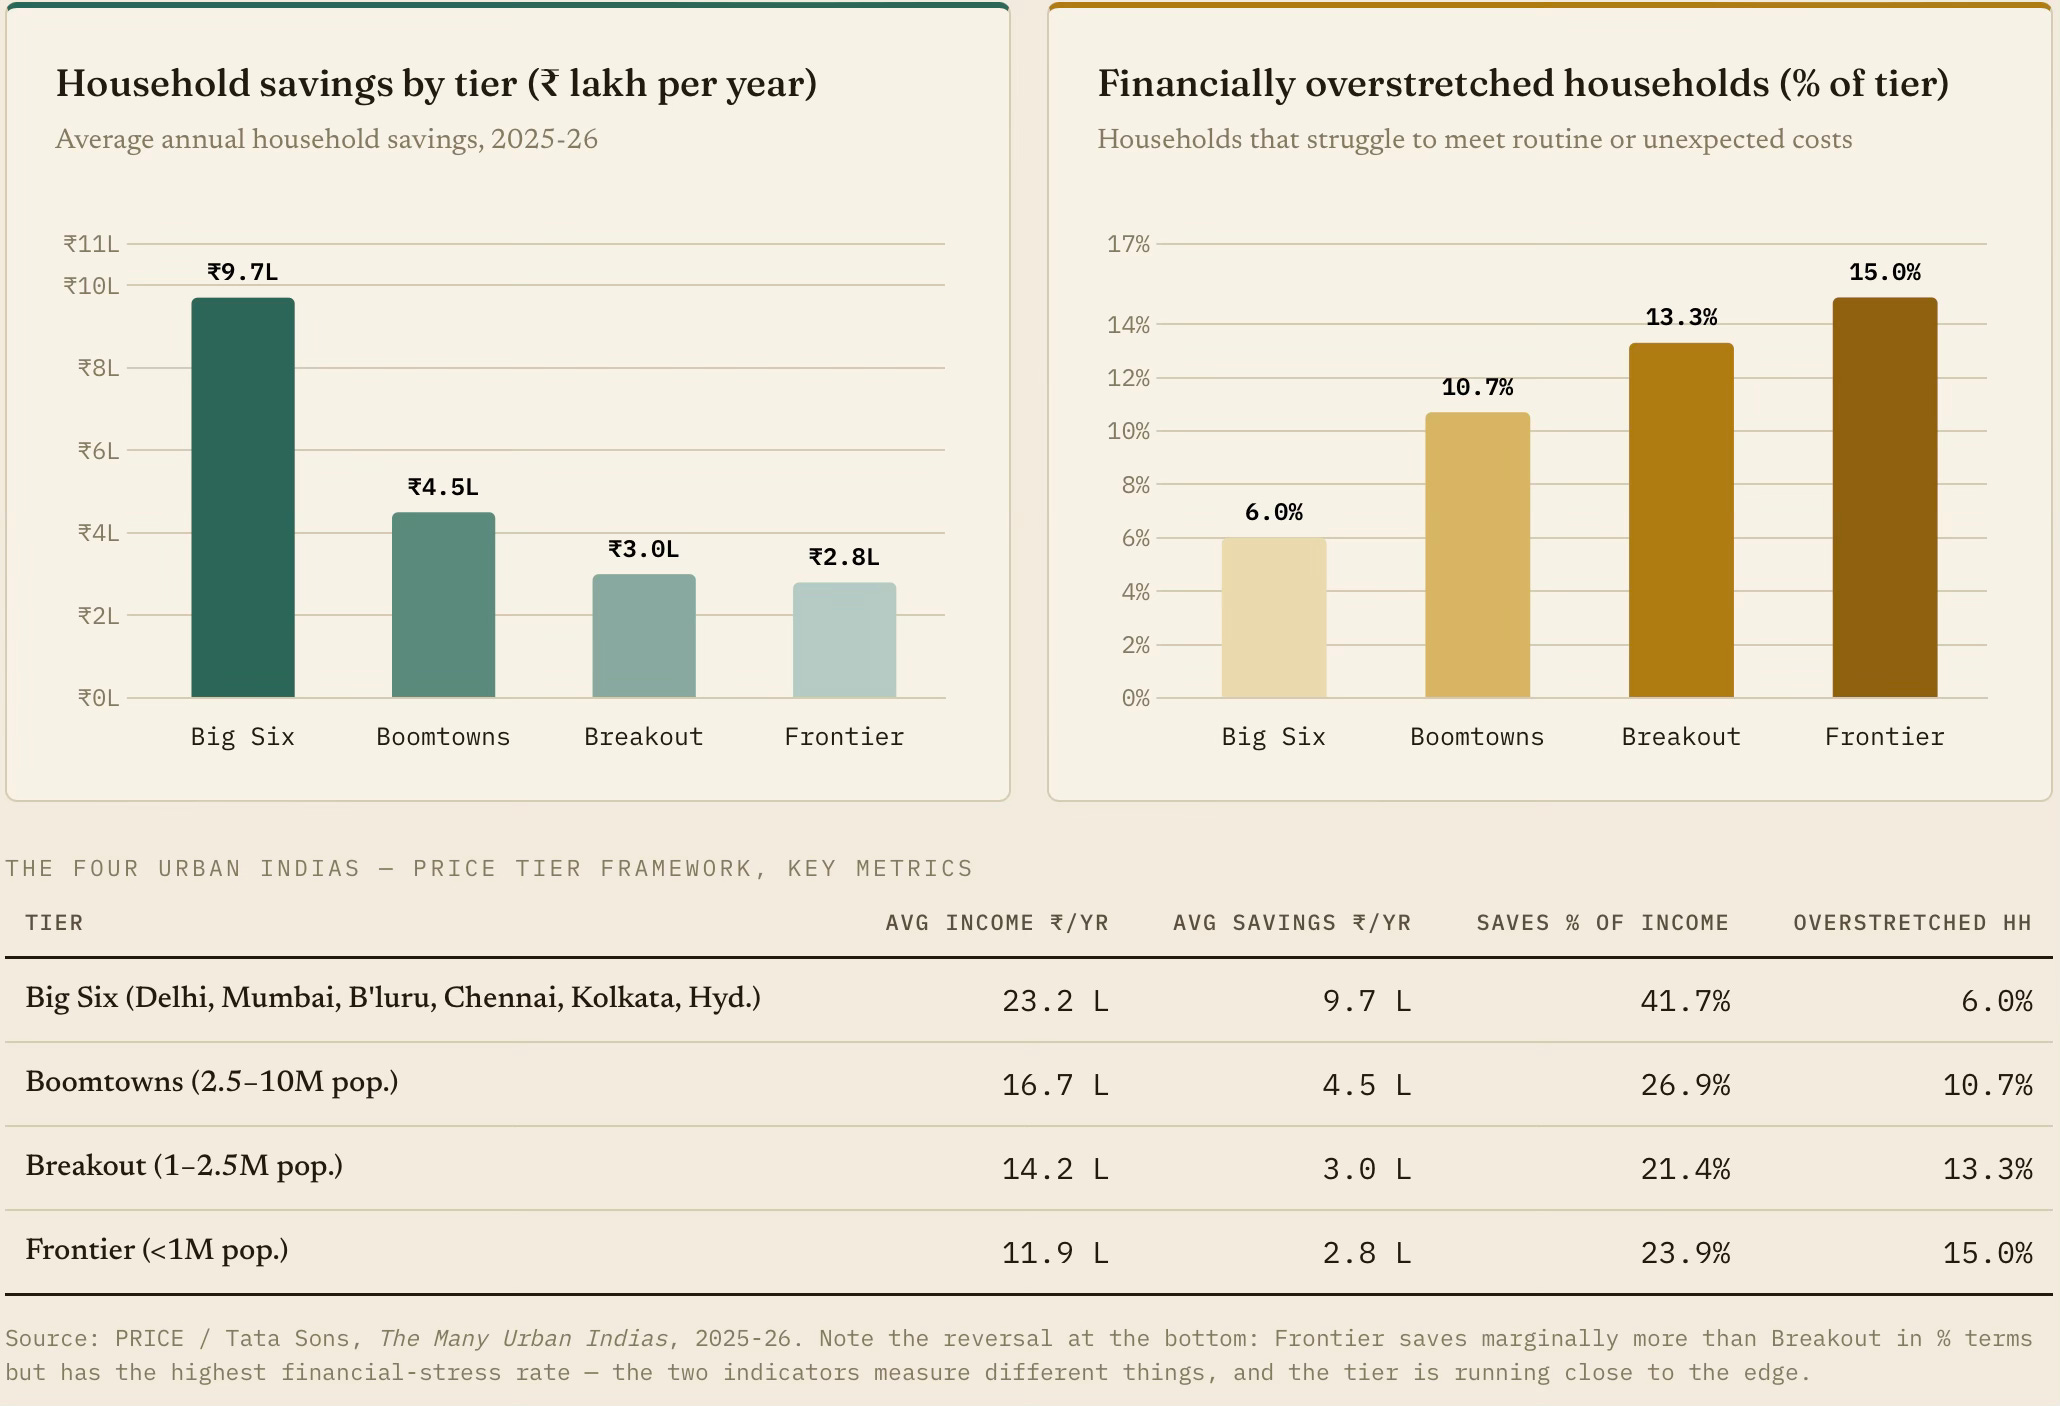
PRICE's top-100 city-tier framework (Big Six, Boomtowns, Breakout, Frontier) is the empirical proof that "urban India" is not a homogeneous consuming class. The gap in savings between the top and bottom tiers is nearly 3.5×, and one in six Frontier-city households is already financially overstretched. This is what “narrow” looks like at the city level. 

The top 15 cities have two-thirds of all top-100 consumption, and the Delhi NCR alone has 15% of all urban consumption. The consuming class is a stratum within the Big Six, not the Big Six themselves. Even within the six megacities, PRICE reports that 24% of households are low-income. The consuming class is not "urban India" (~500M) or even "top-100 city India" (282M), but a stratum of prosperous households scattered across the Big Six and the top of the Boomtown tier. 
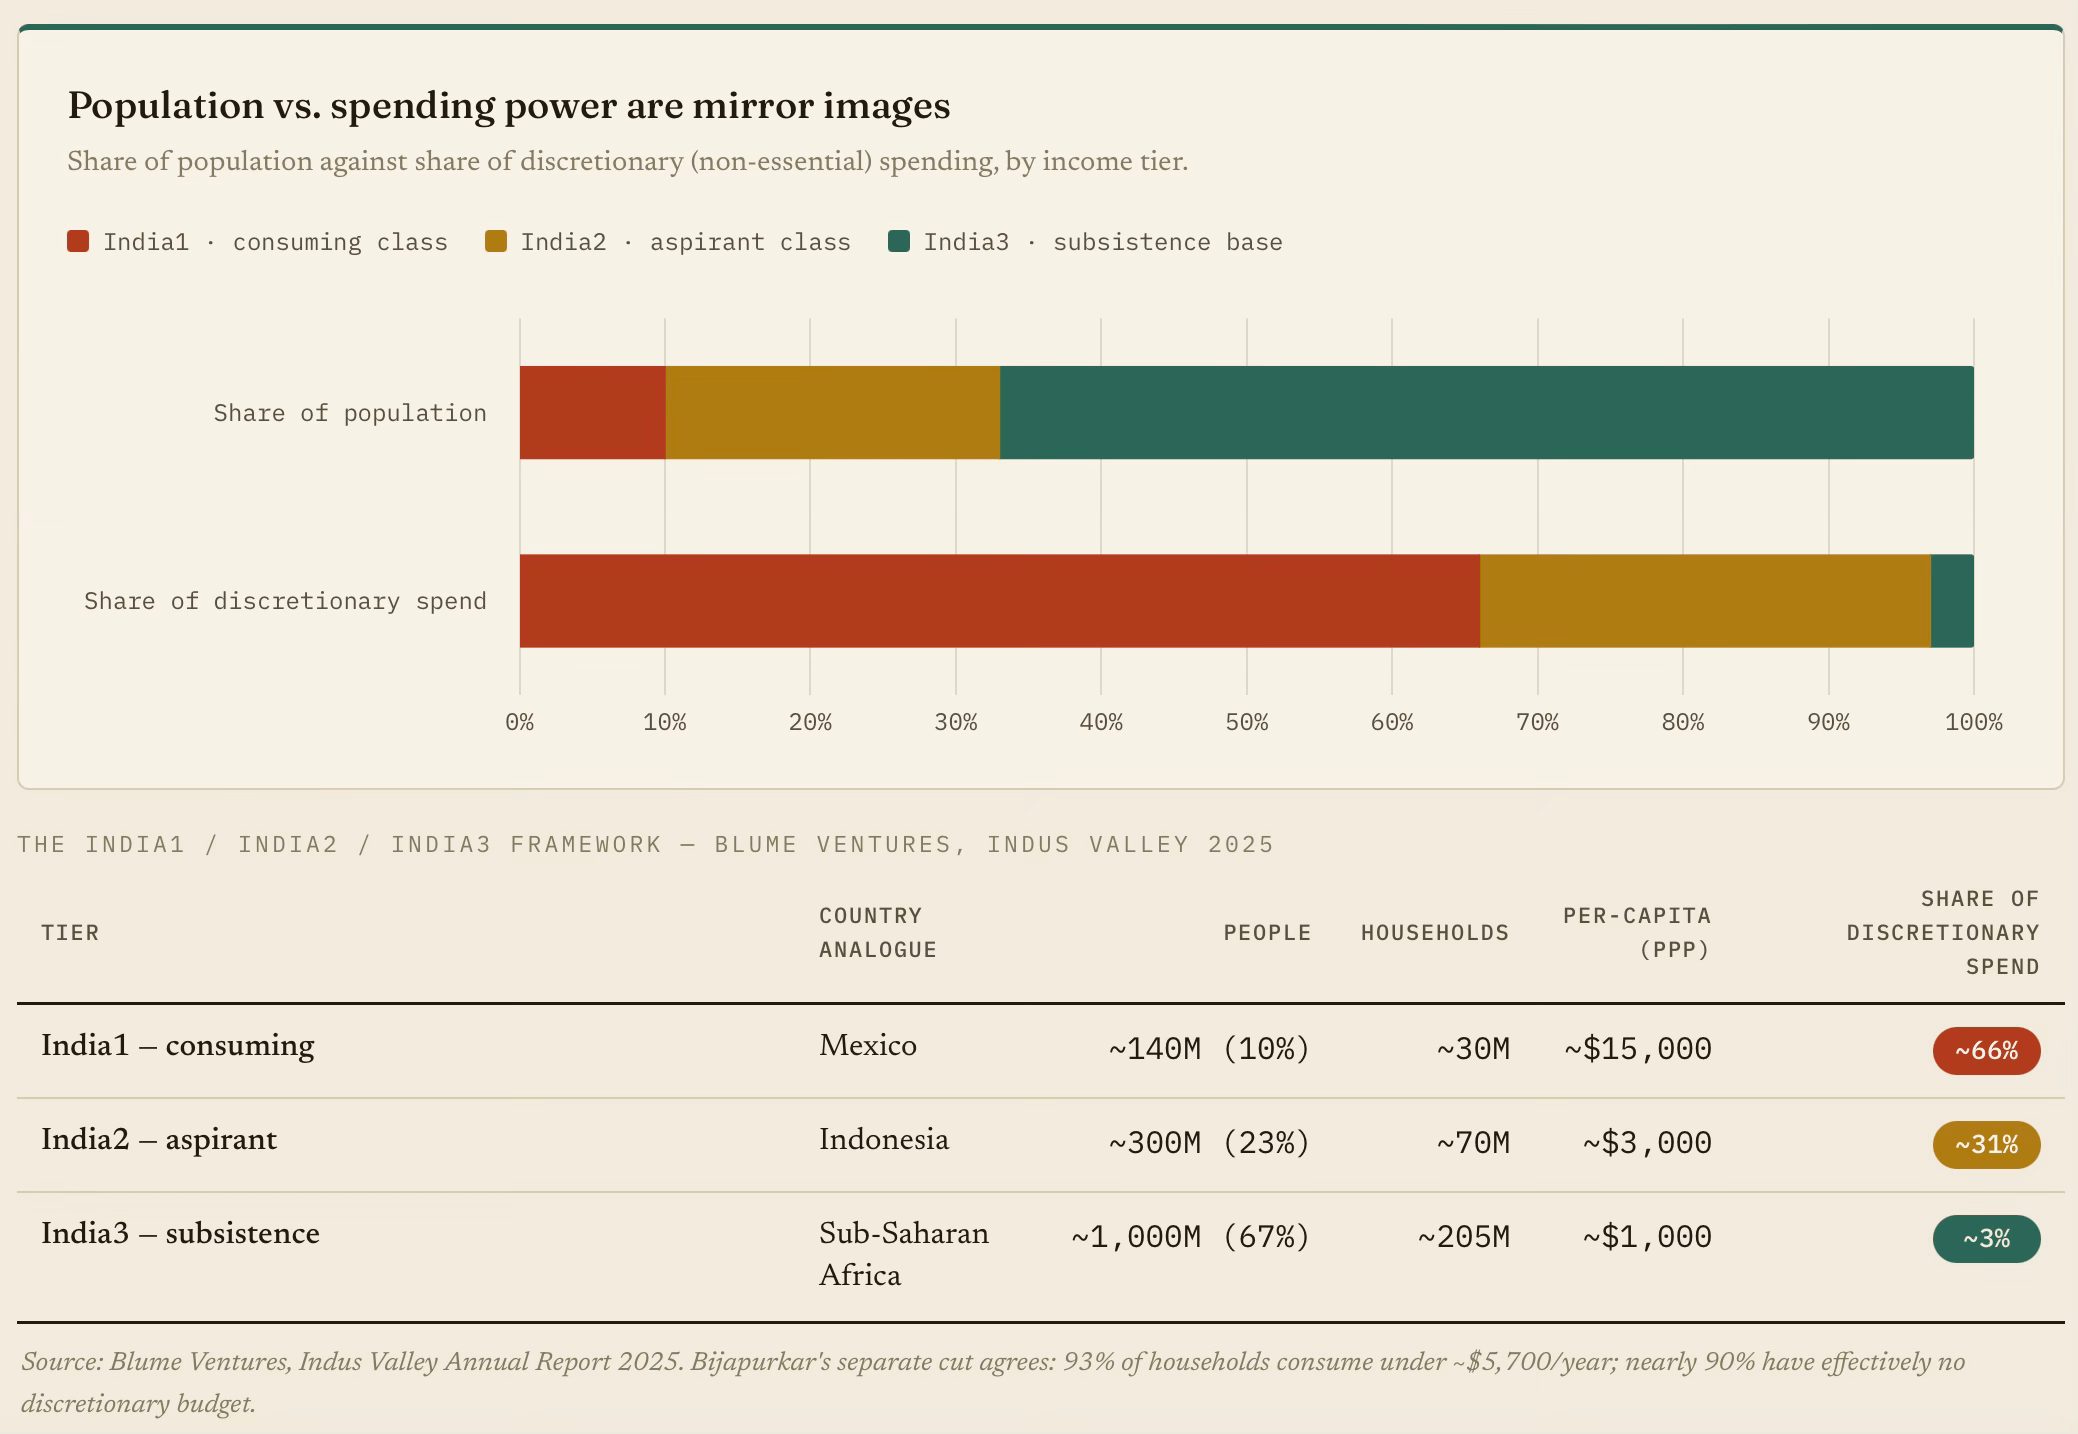
The Blume Ventures categorisation of India’s consumption class finds three groups, with the first comparable in size to the population of Mexico at 30 million households (the Blume Rule of 30, or 10% of Indian households). A worrying finding is that the consuming class that anchors private demand is small and getting deeper, not significantly wider. A vast base has almost no discretionary spending power at all. This is the inverse of the broad, upwardly mobile middle that sustains private investment.
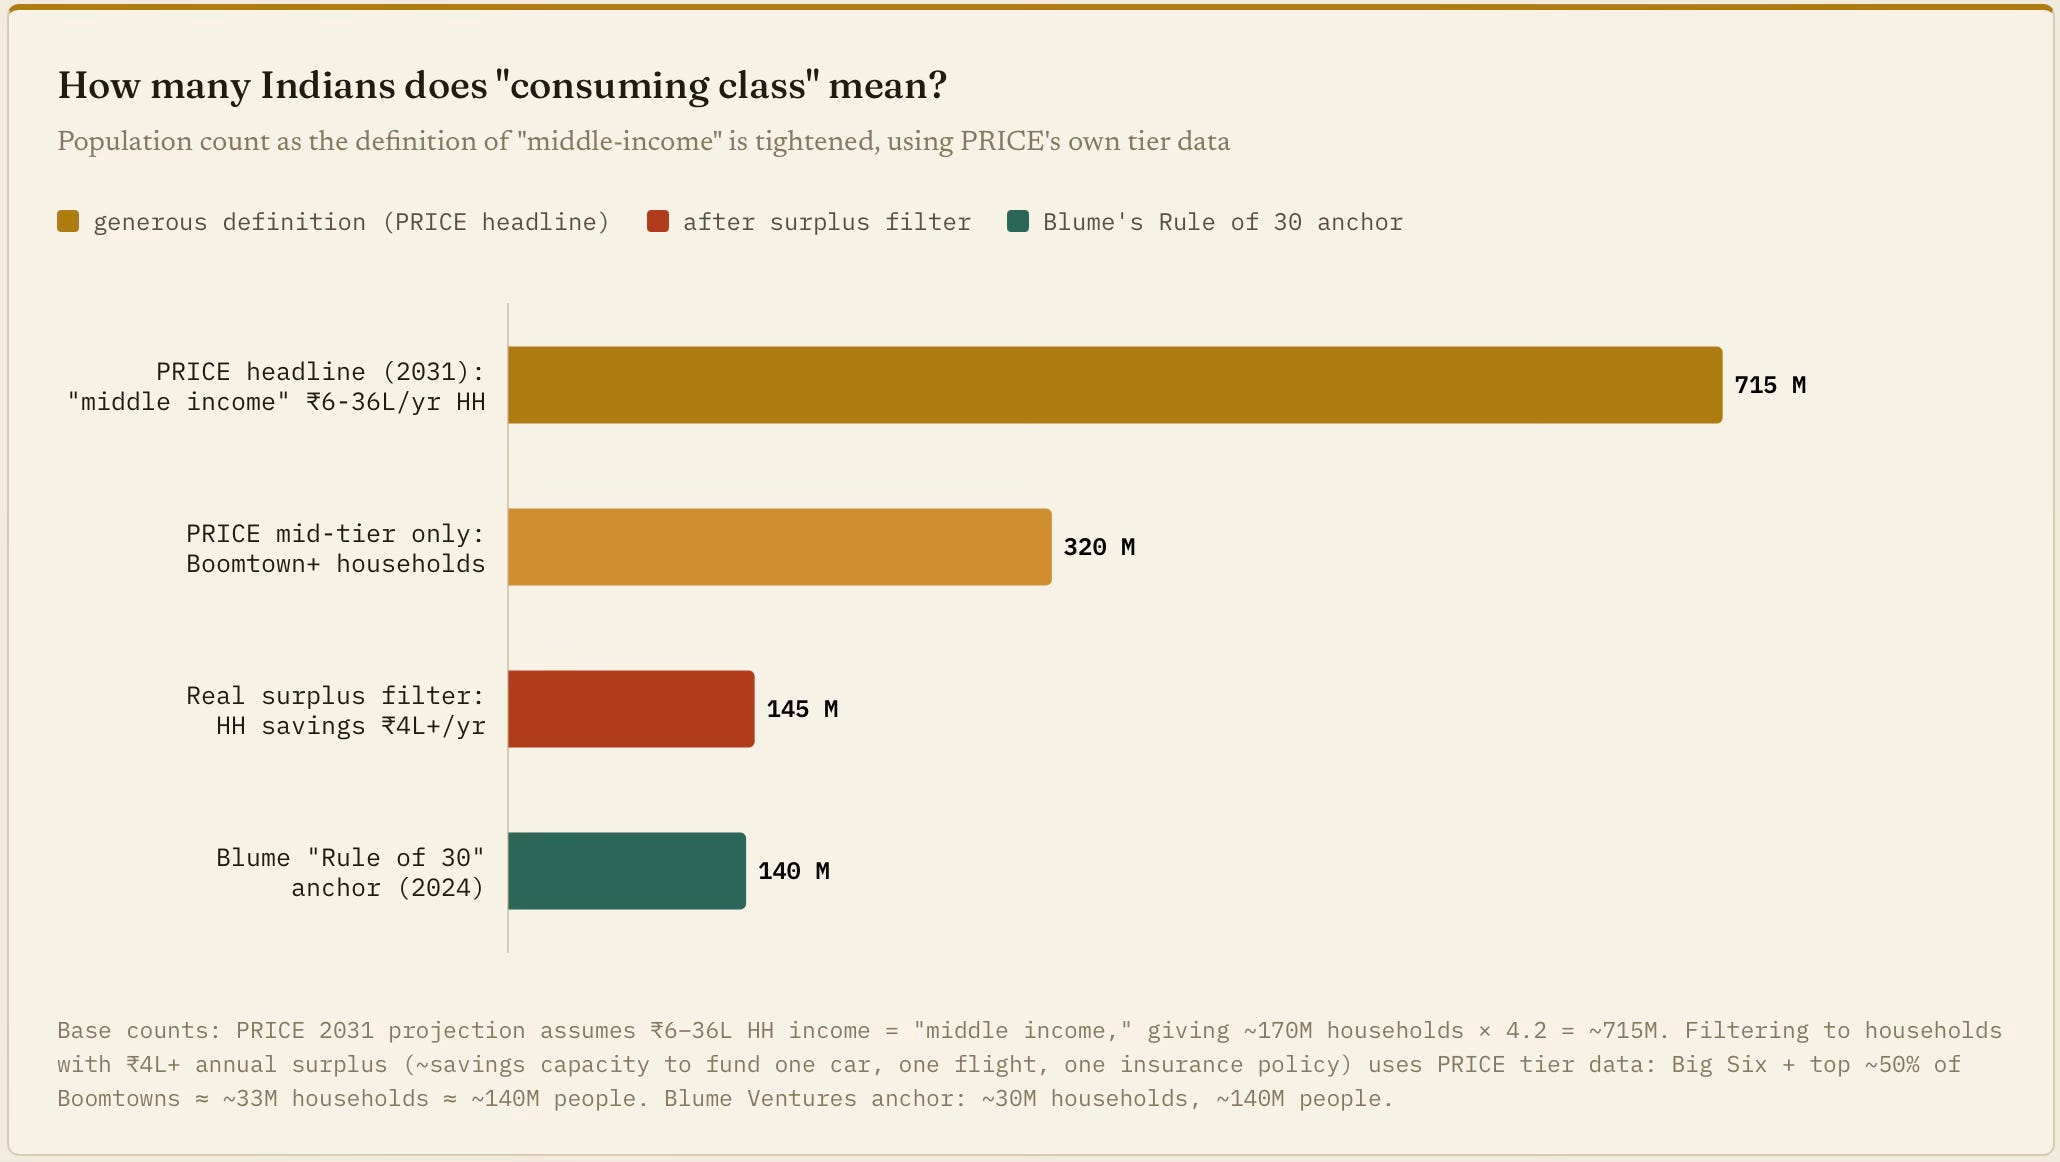
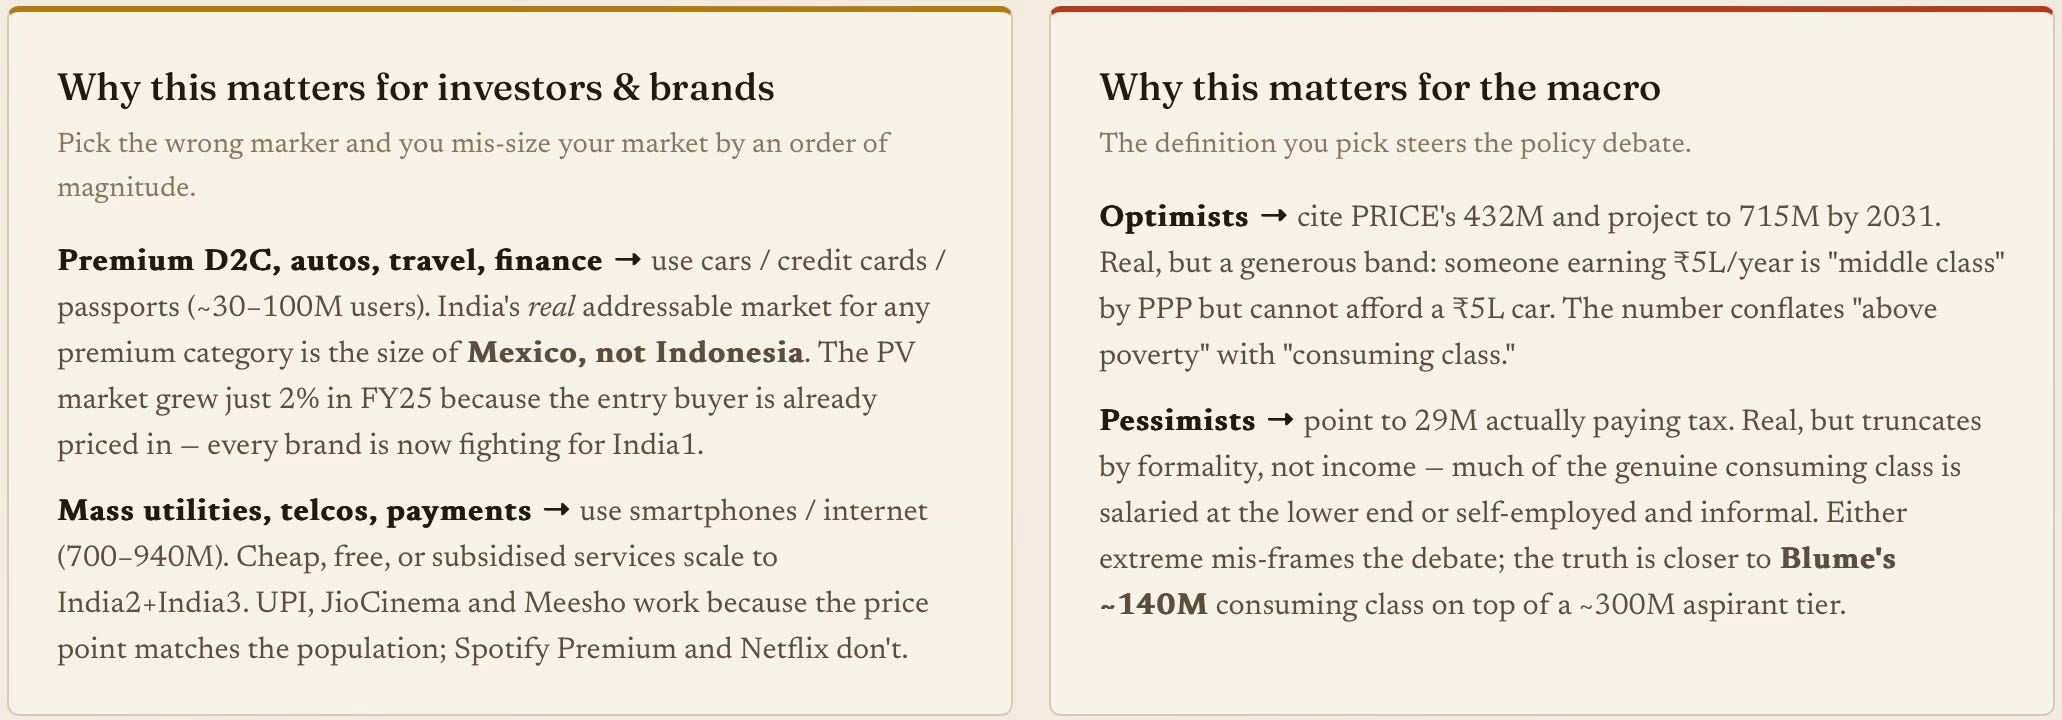
The PRICE report's optimistic headline (~715M "middle income" people by 2031) conflates a household that shares a scooter with one that services a car EMI. Once you apply a real surplus filter - savings above ₹4 lakh a year, which is roughly what it takes to run a car, insure a family, and take one flight - the number lands where Blume said it did. In simple terms, PRICE's 715M by 2031 measures how many Indians will earn enough not to be poor, a significant achievement. Blume's 140M measures how many can act as a consuming class today - the market a brand can actually sell a car, an AC, a holiday abroad or a health-insurance policy to. 
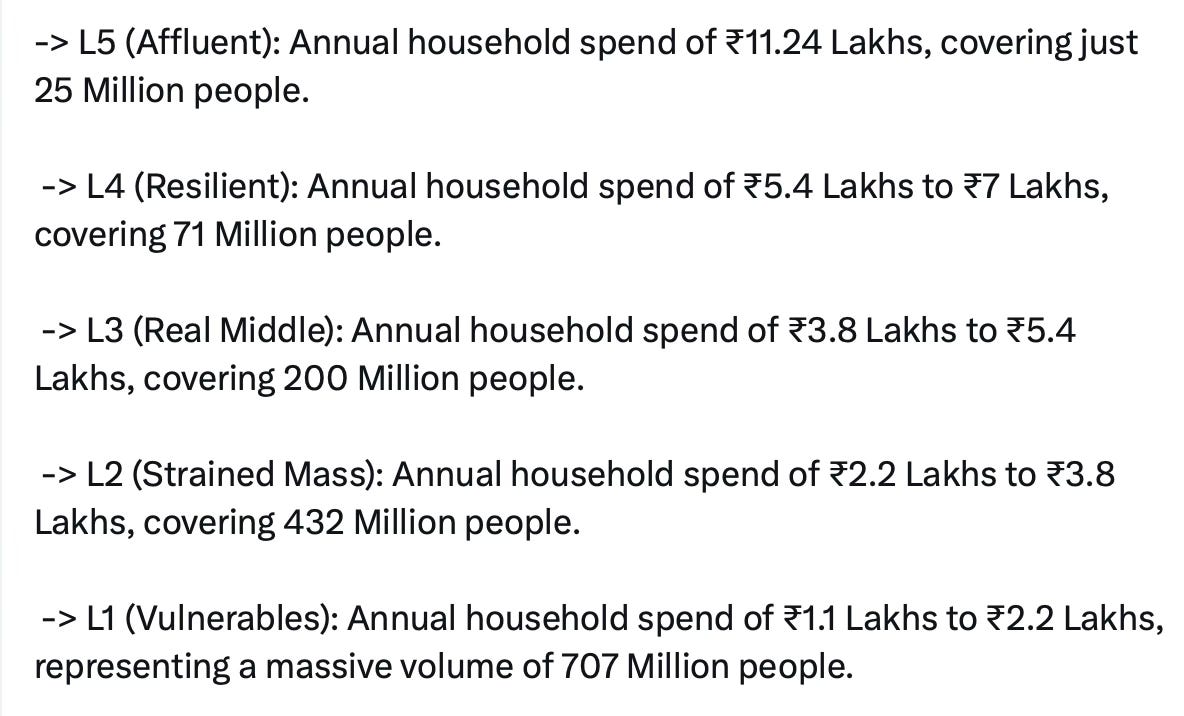
The numbers are further validated by other sources. An income assessment by Rama Bijapurkar points to a more differentiated group, but a similar narrow base of the consumption class. She estimates that 93% of households have annual consumption of less than $5,700. 
The data on penetration of discretionary goods and behaviours corroborates the Blume survey data. Almost every independent marker lands near the same Blume Rule of 30. Whether you measure cars, ACs, credit cards, foreign travel, or who actually pays income tax, the consuming class converges on the same narrow apex. If anything, the Blume data itself looks too optimistic. 
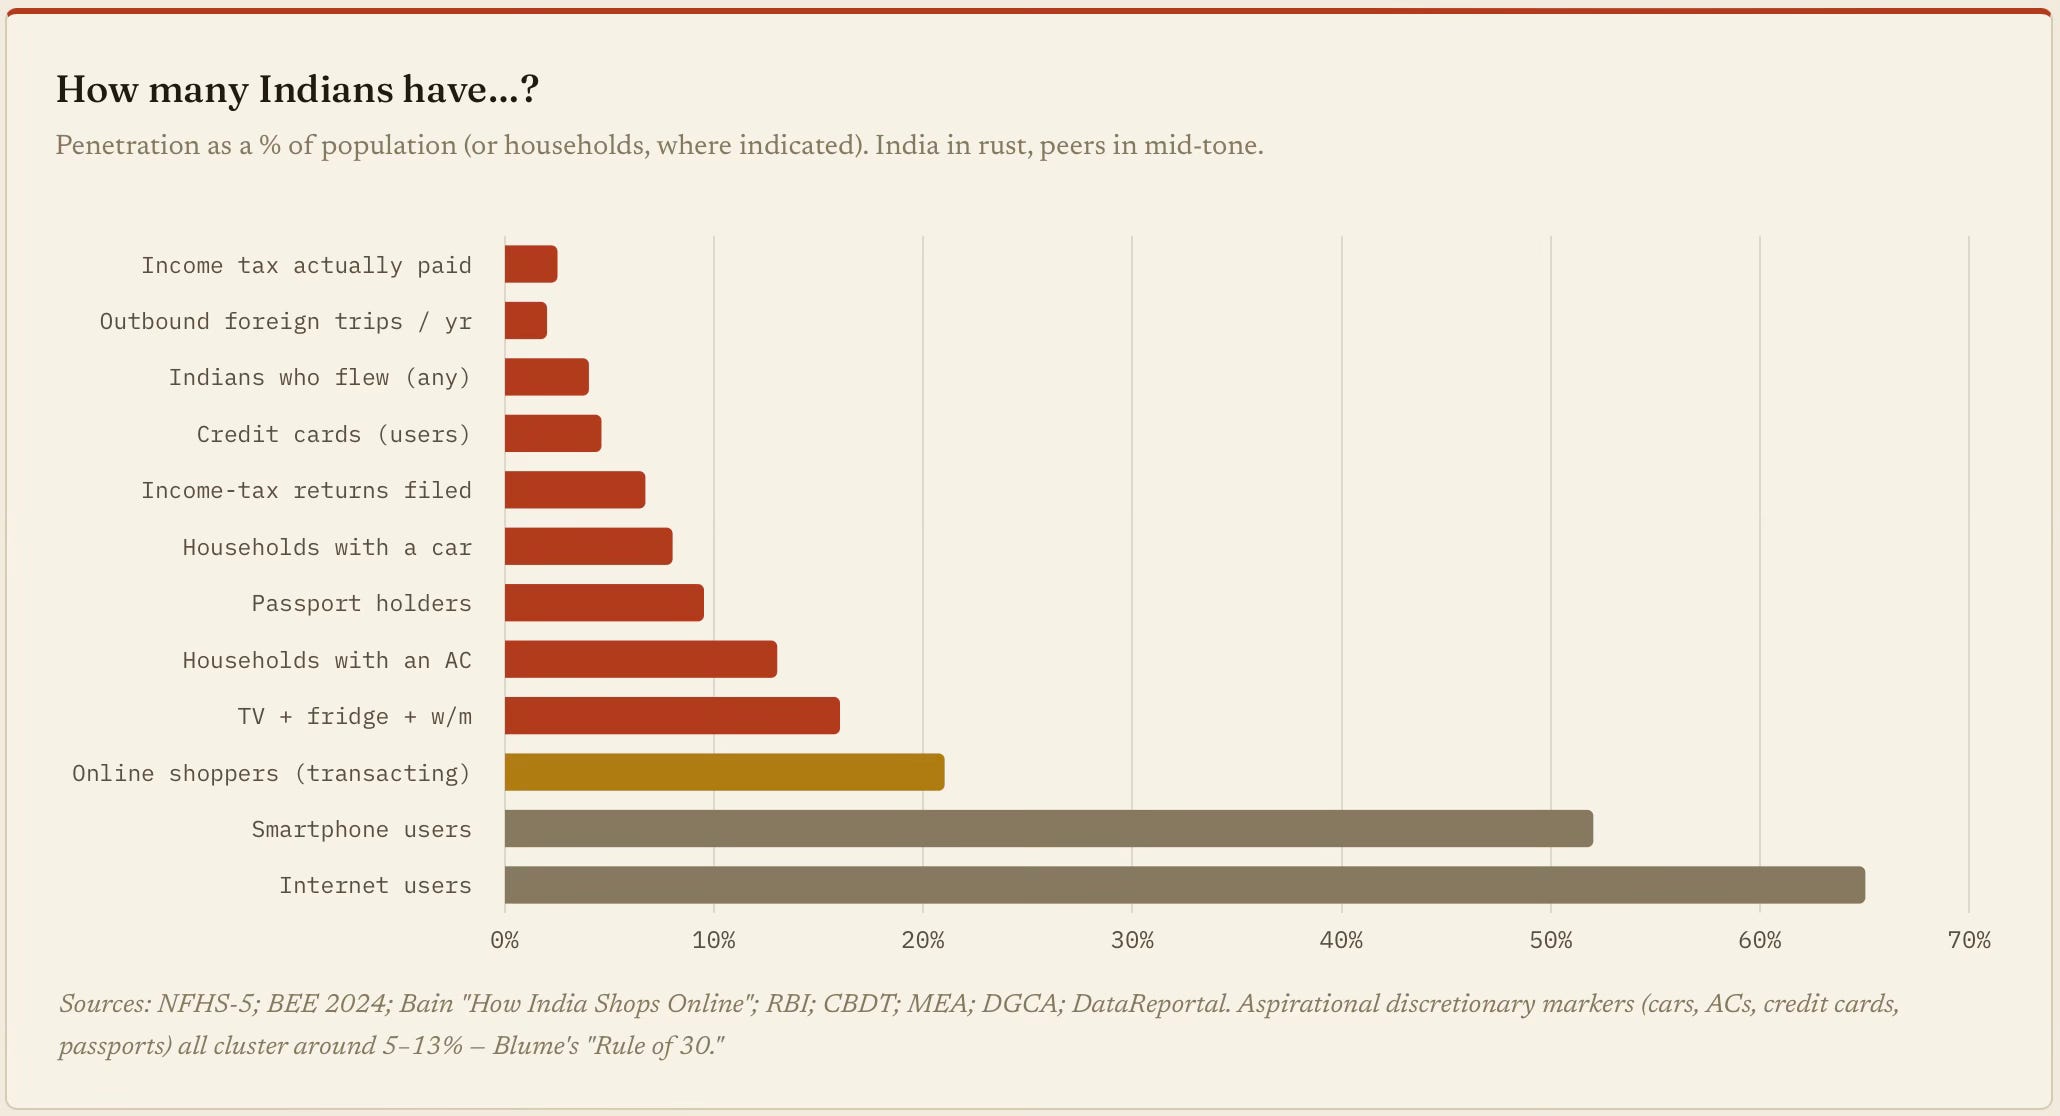
Whichever marker you pick - cars (8%), ACs (13%), passports (~10%), income-tax payers (1.5–3%), credit cards (4.6%), foreign trips (2%) - the consuming class lands at ~10% of households or fewer. That is also exactly where the bottom-up Blume spending model, income surveys of Bijapurkar, and asset penetration estimates of NFHS/Bain lands.
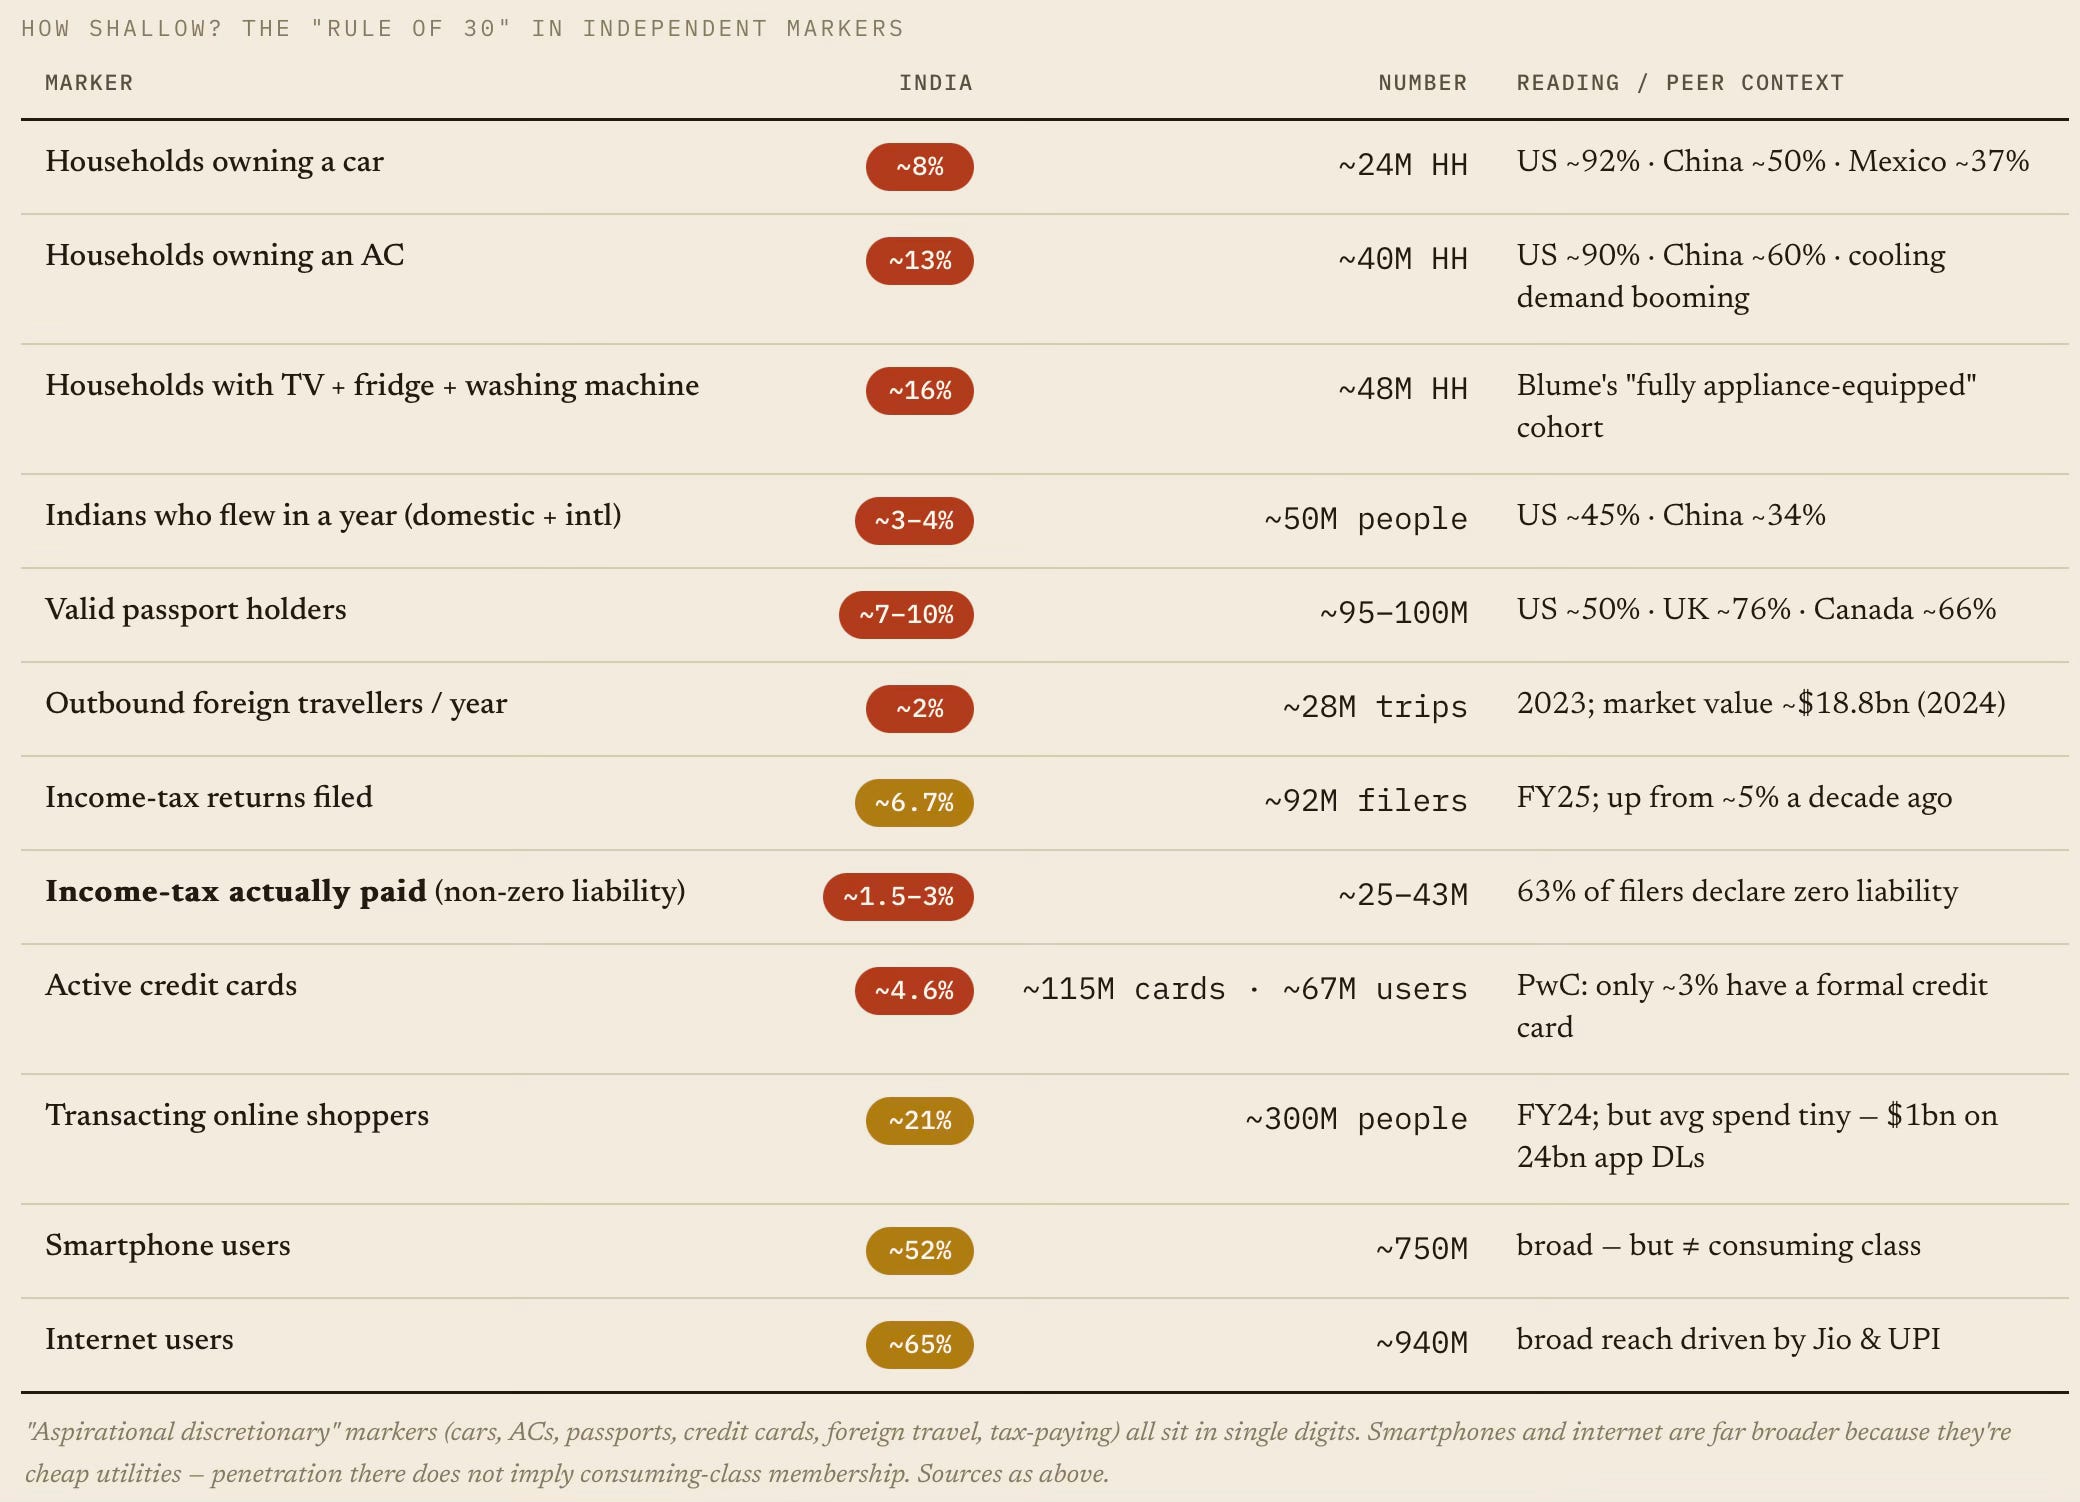
India's "middle class" has been estimated at 29 million people one way and 600 million another, a multiple spread of 20 that reflects what one is choosing to count. 
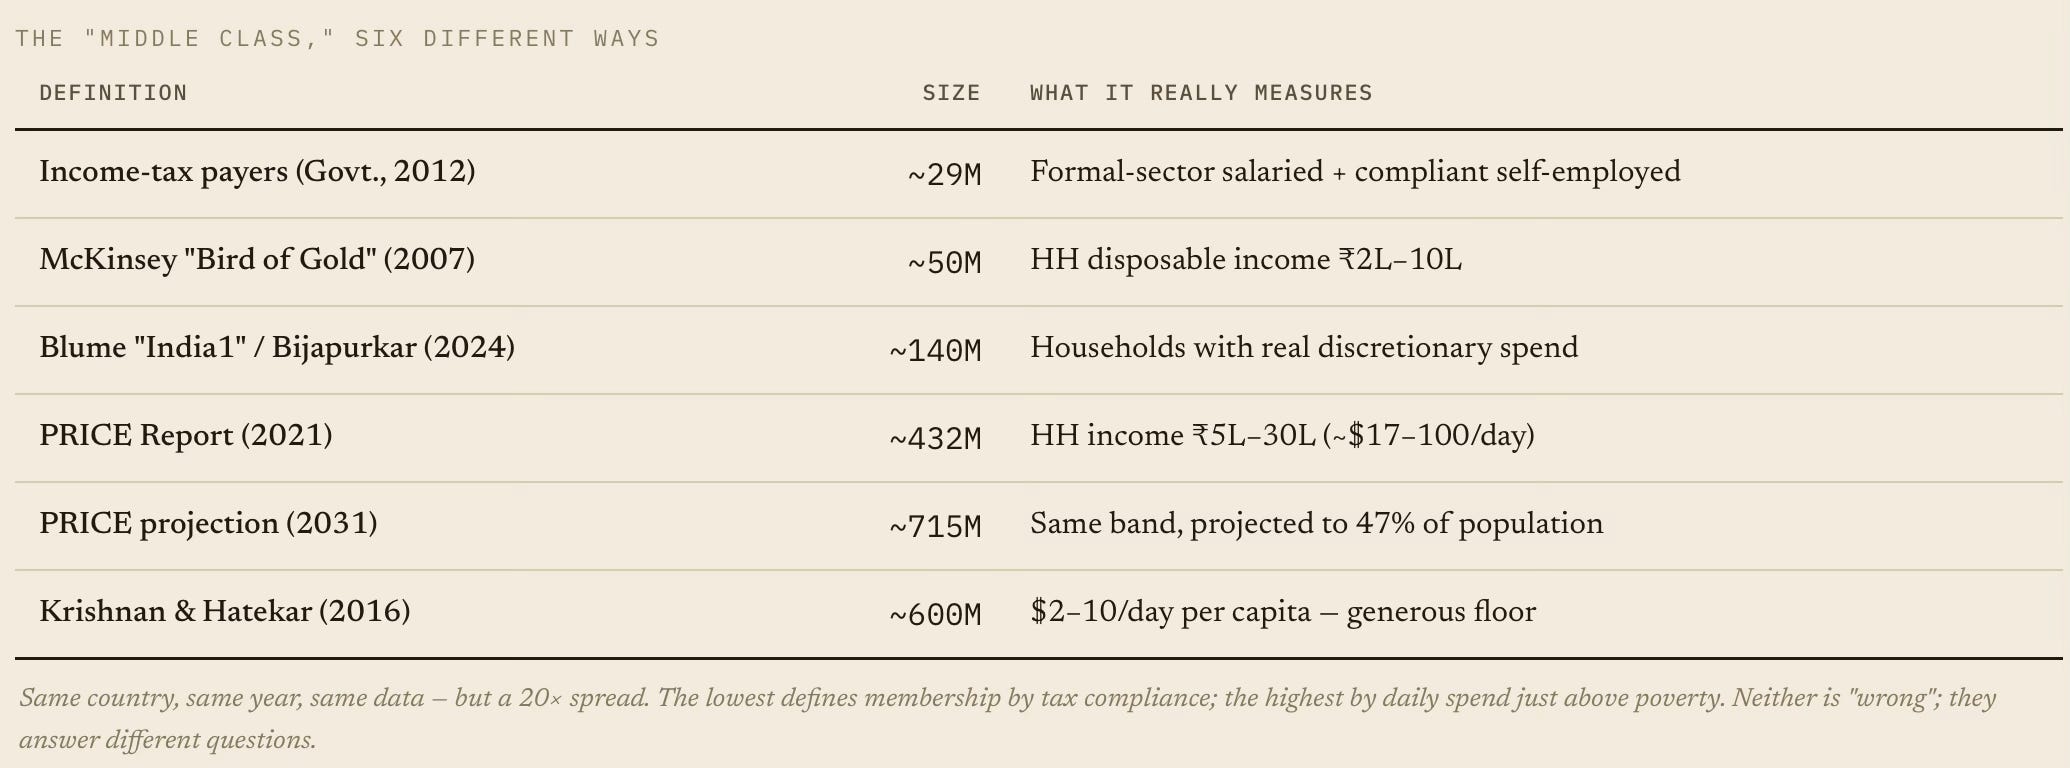
India has a consuming class of ~140M, an aspirant class of ~300M moving toward it, and a base of ~1bn for whom the "middle class" debate is moot. That picture is consistent with every methodology once you ask which question each one answers - how many can afford a car (~10%), how many are above poverty by global standards (~30%), how many participate in the digital economy (~65%). Conflating them is the single most common error in India market-sizing. This is a very nice summary of why nobody gets the elephant in full.
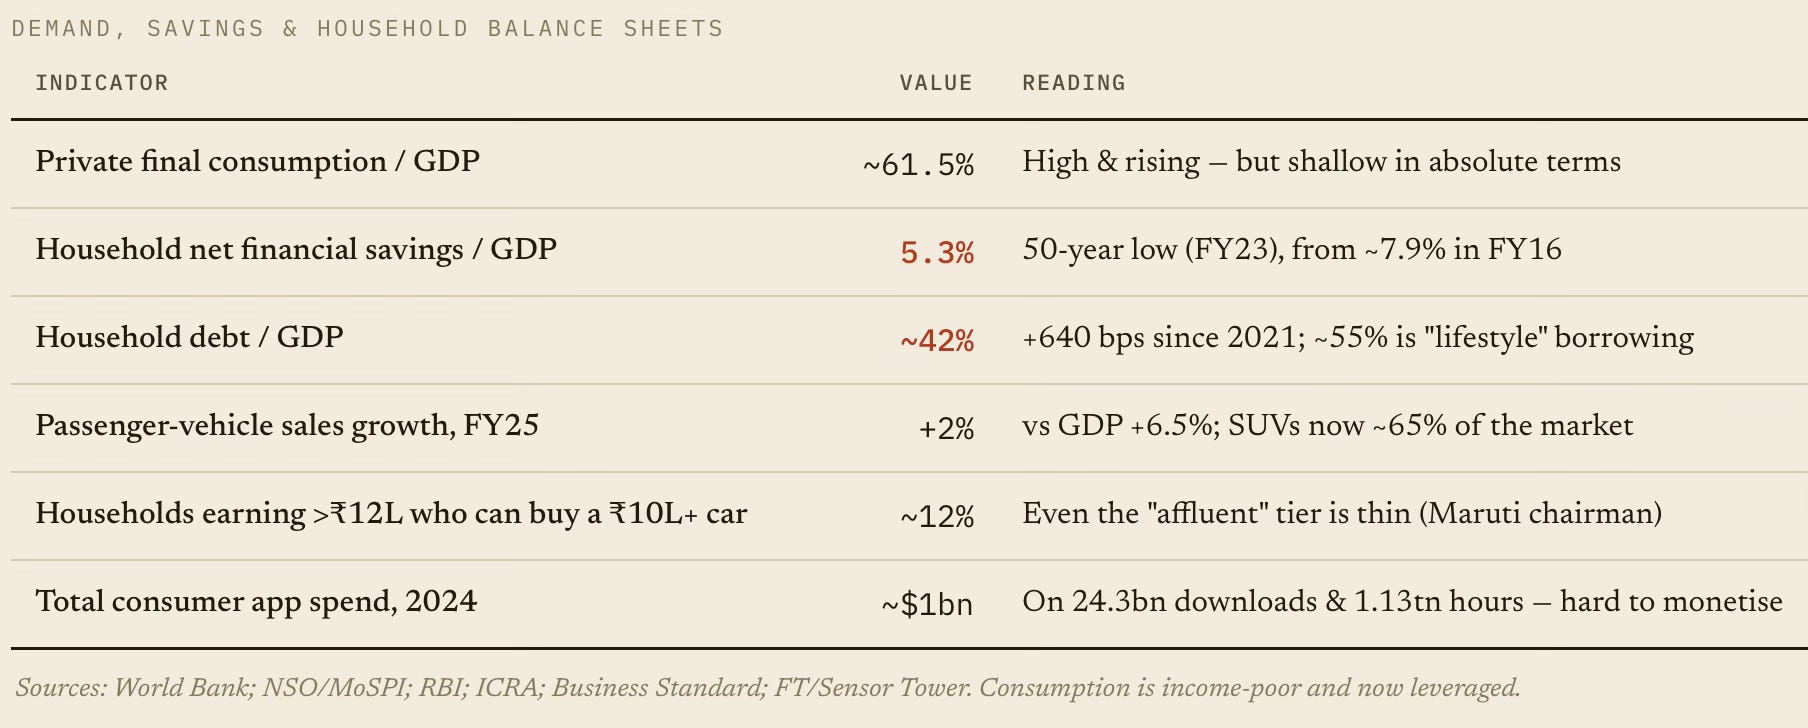
In this context, it is also useful to draw a nuance on India’s high consumption rate of 61% of GDP, which is far higher than China’s ~38% of GDP. India’s problem is that while it is already a consumption-led economy, the problem is the quality of that demand. It is too thin per person, skewed to the top decile, and increasingly financed by debt as households run down savings. In other words, the demand side constraint is not the consumption share of GDP, but that there are too few middle-income earners to generate broad, income-financed volume. That points policy at jobs, wages and investment, not at “stimulating consumption.”
Fundamentally, all the above is a reflection of two important factors - the low per-capita income and the widening inequality in sharing the benefits of aggregate growth. 

India's per-capita output (PPP) trails Vietnam and Indonesia and is under half of China's. Its Mexico-like consuming tier is real, but at best, only ~10% of the country.
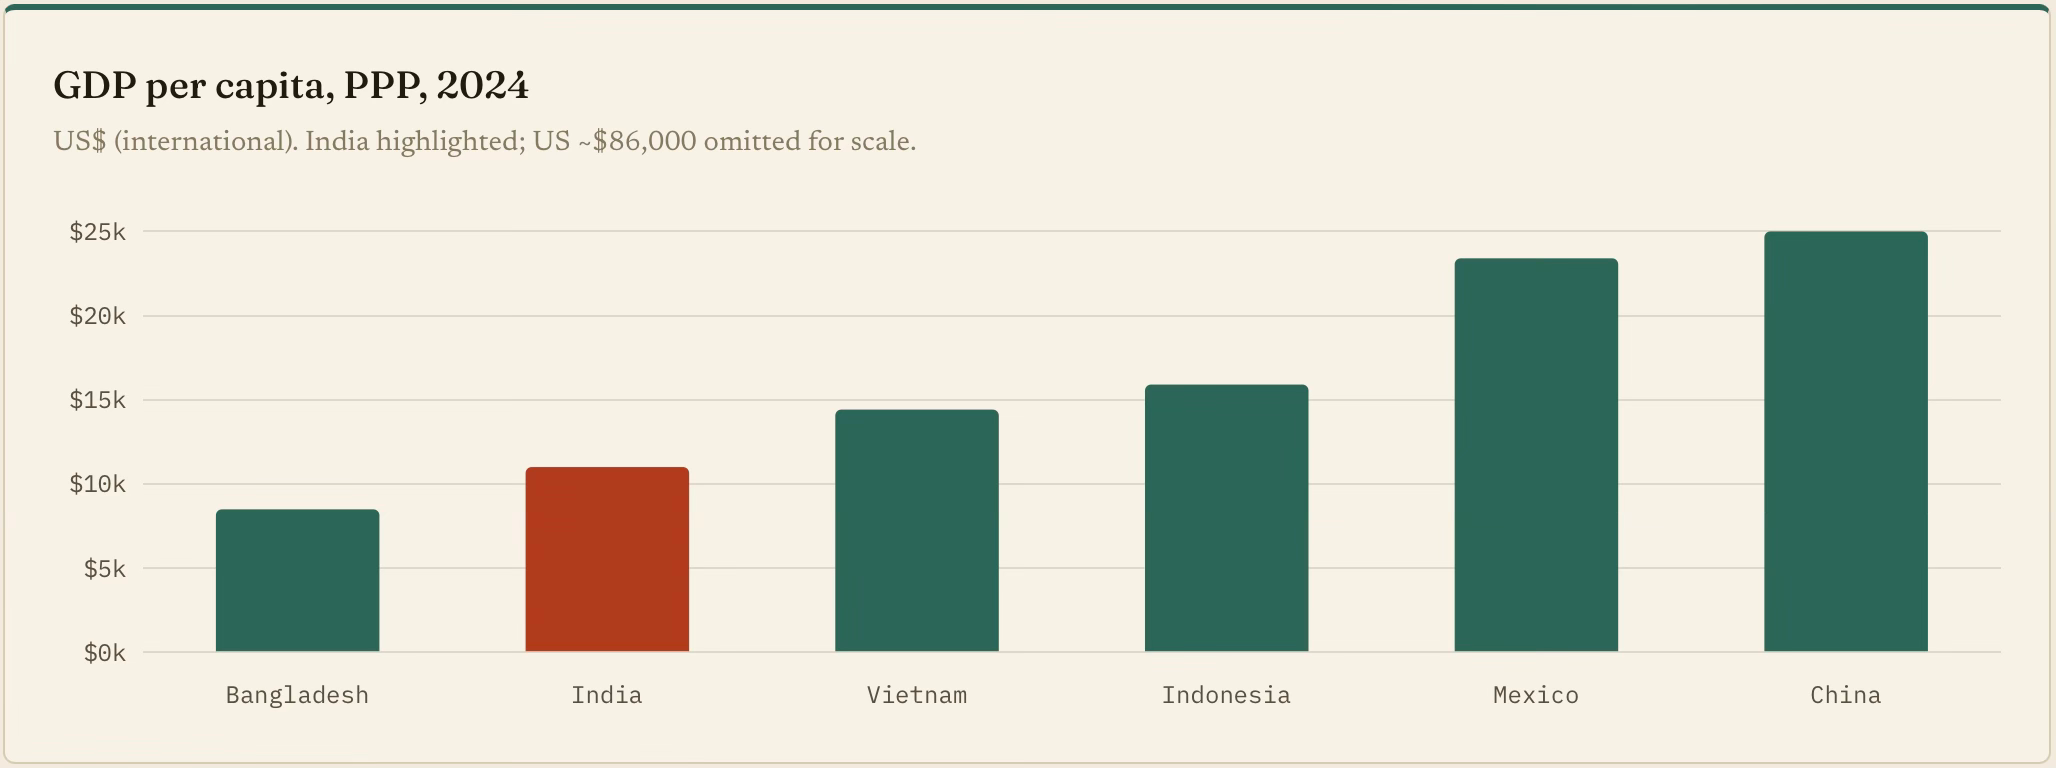
India imposes rich-country costs on poor-country incomes in capital, fuel and land - and because those costs are policy-made, they are the actionable half of the problem. The demand blade can only be widened the slow way: through jobs, wages and productivity.

Unfortunately, corporate surpluses are being captured, not recycled into the wages that would create the next tier of consumers. Profits race ahead while sales, jobs and pay lag far behind.
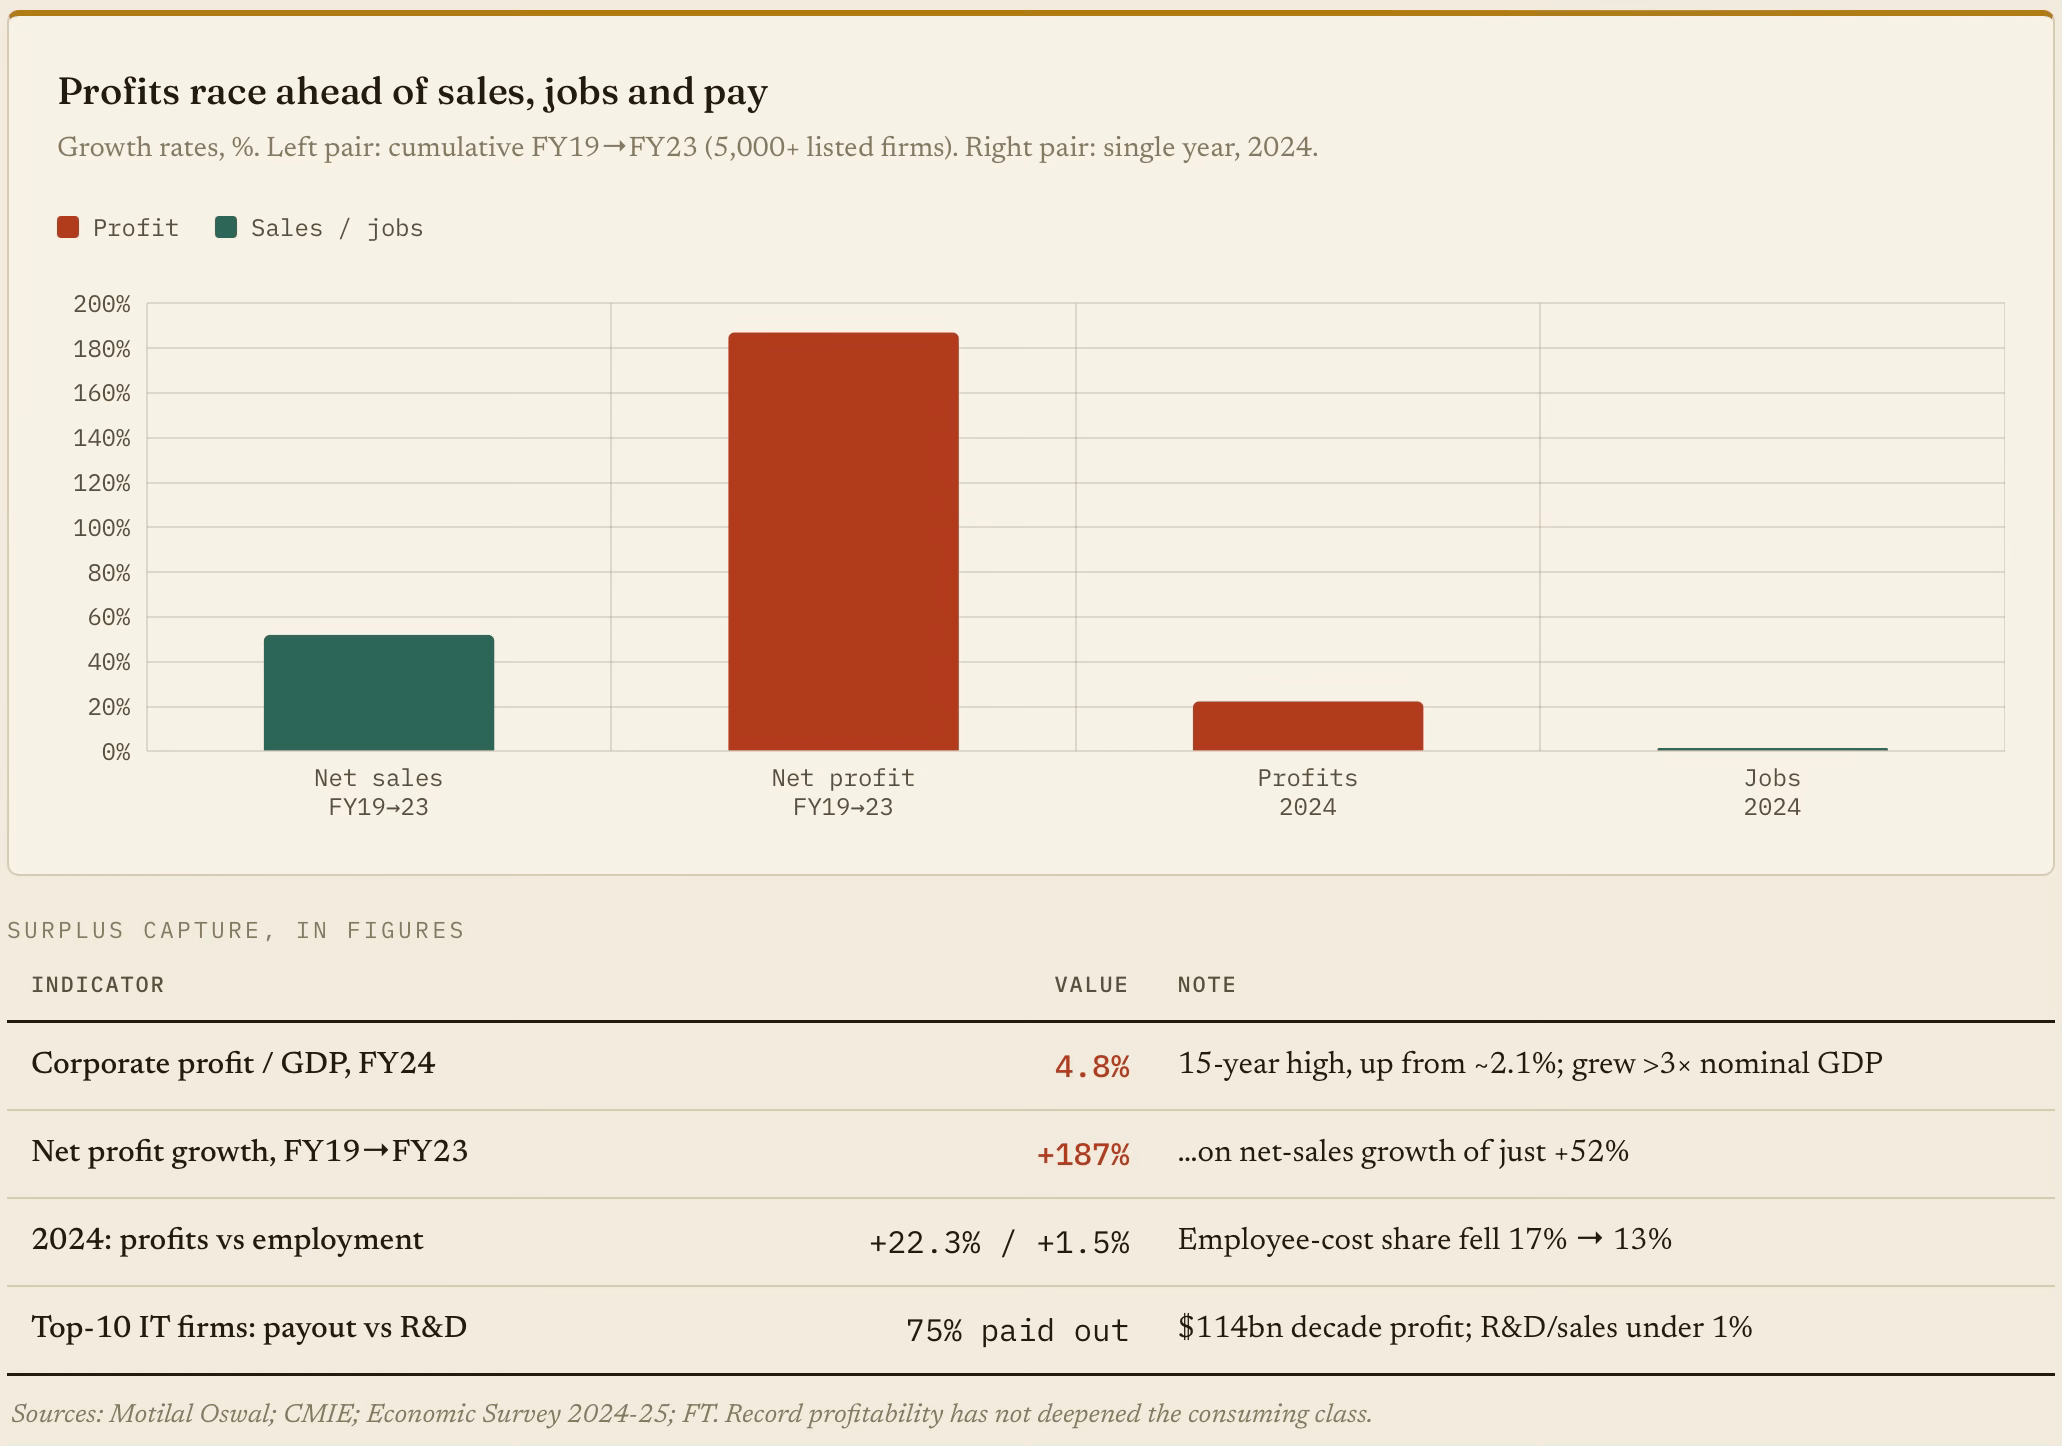
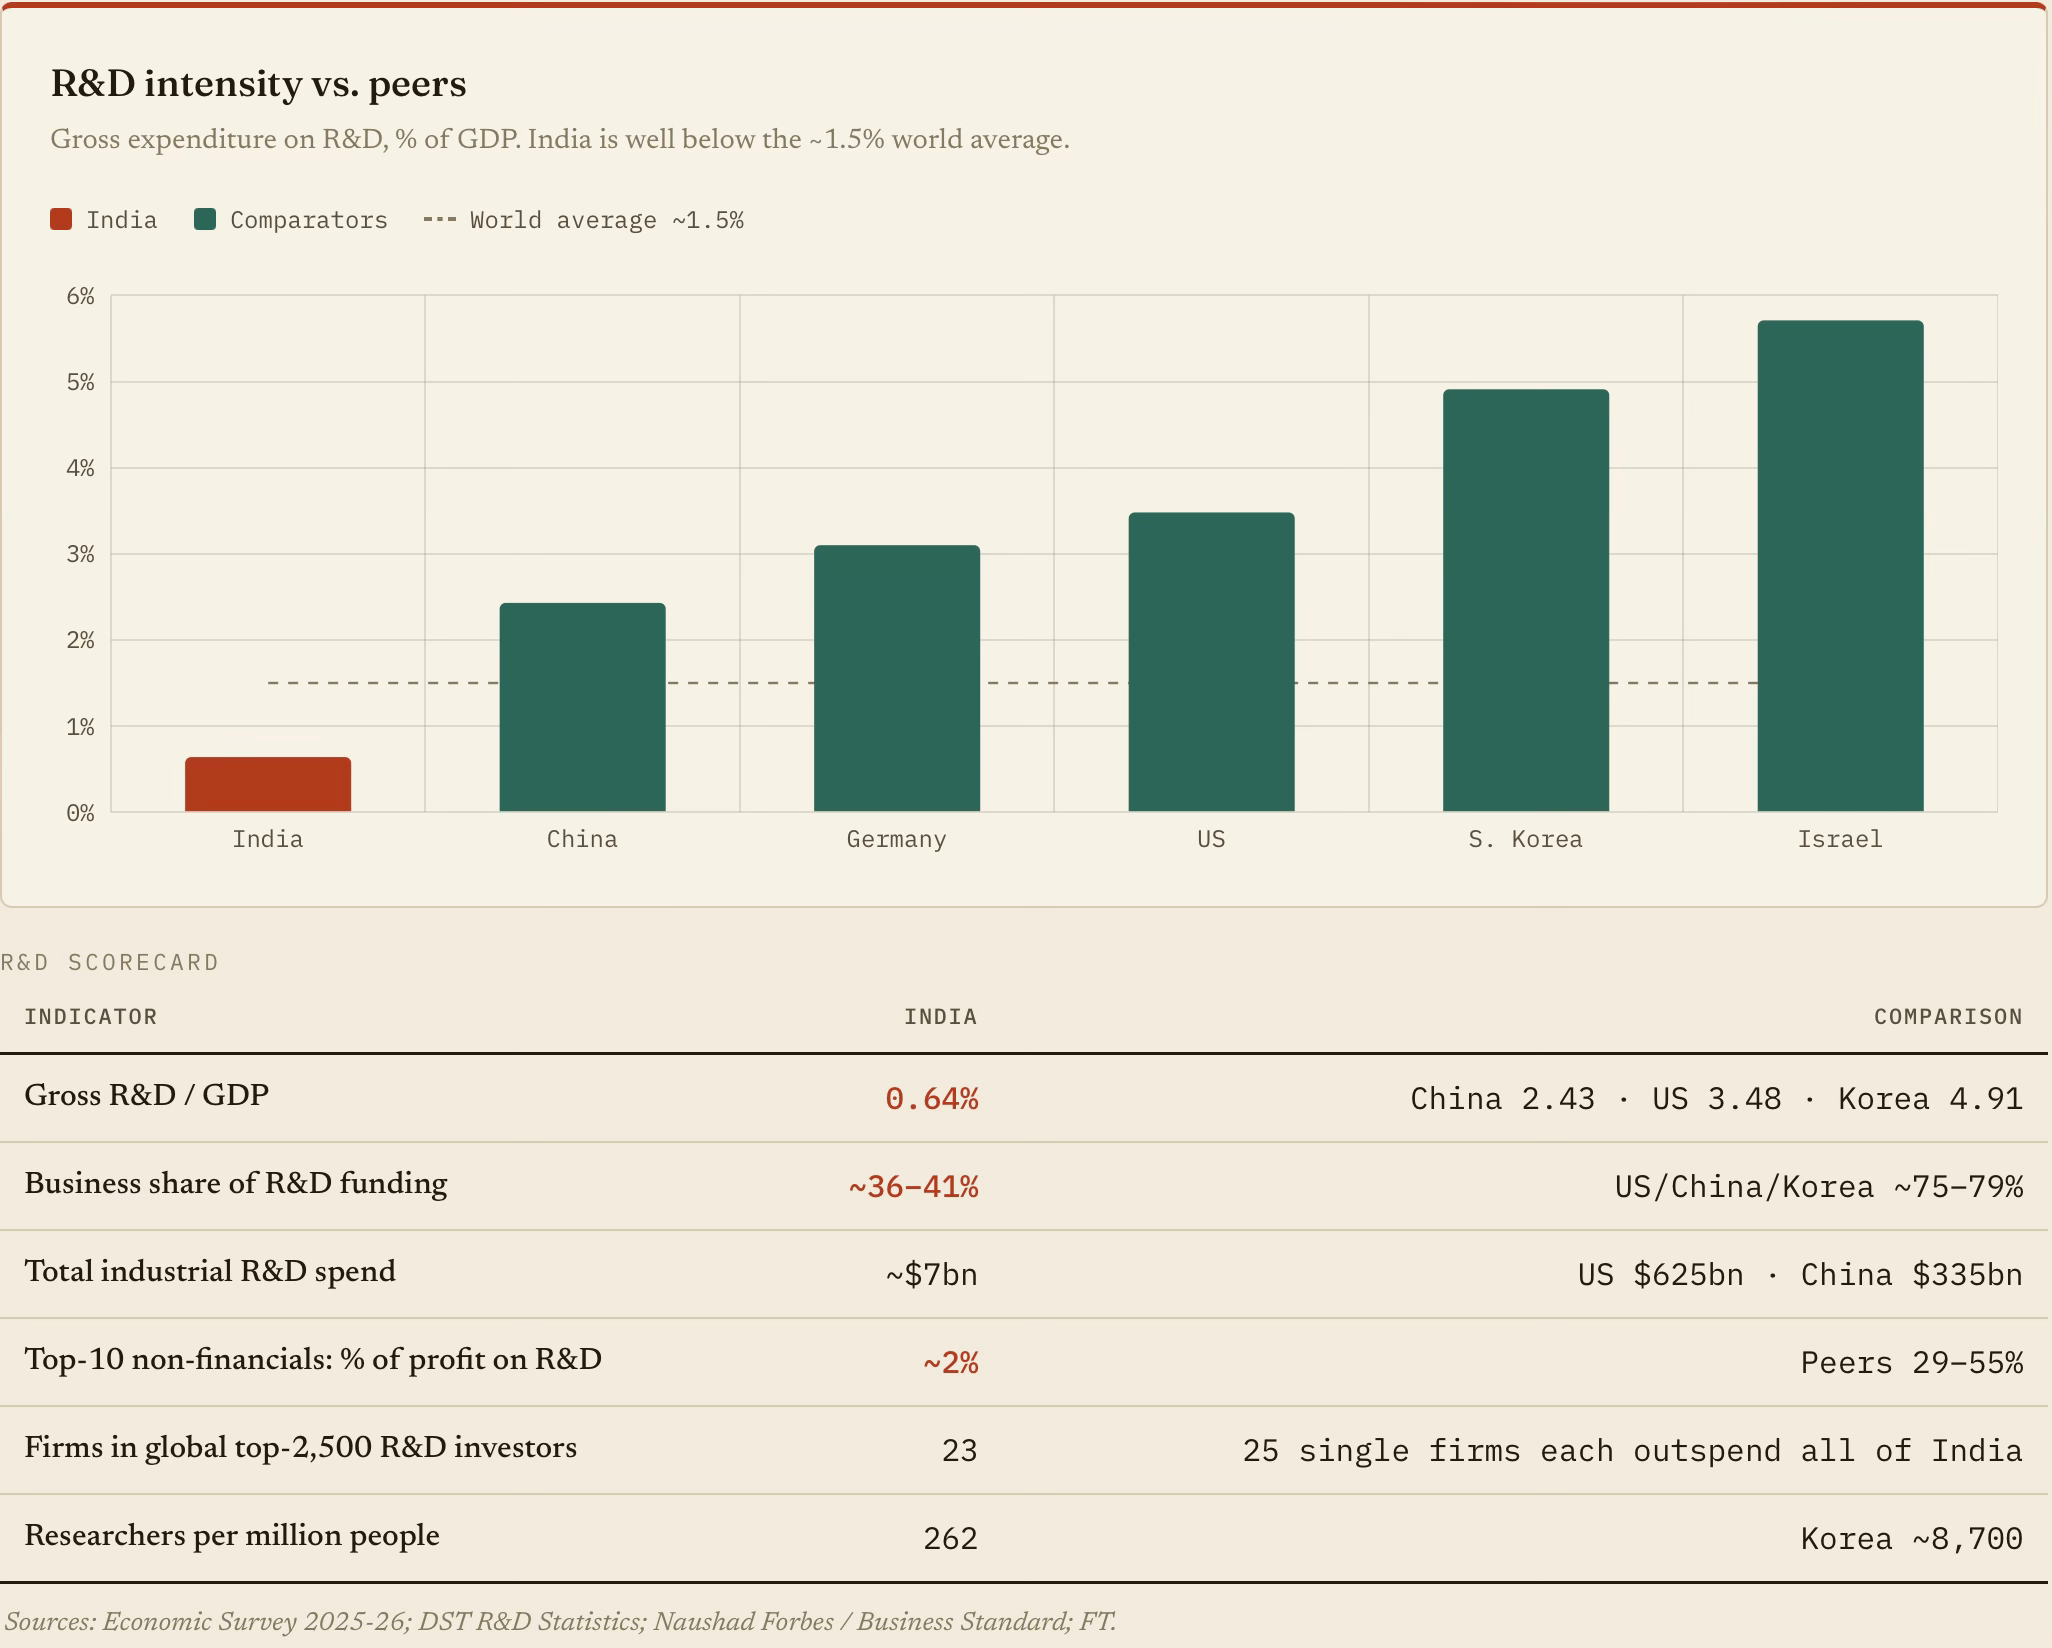
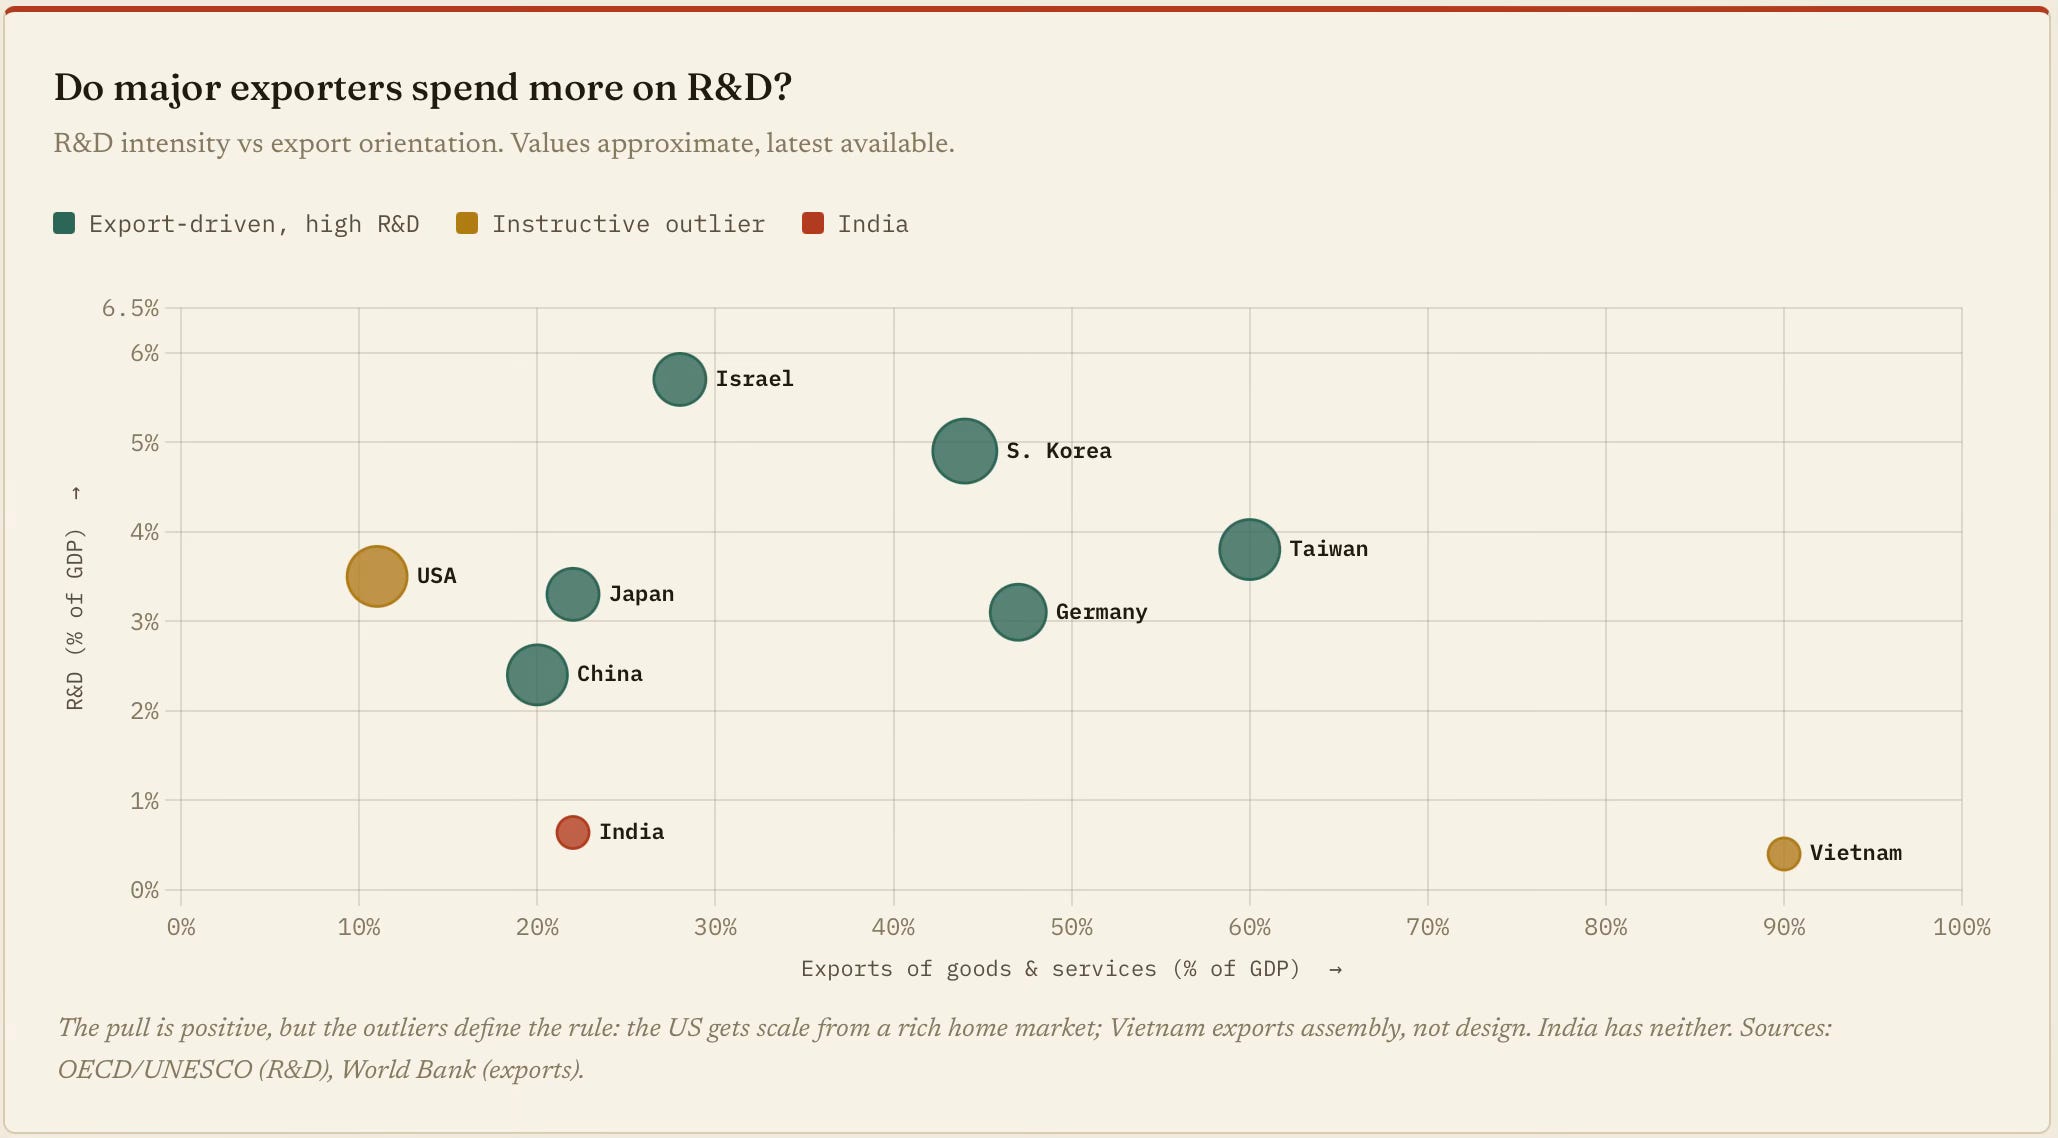
It also does not help that Indian businesses across sectors are averse to spending on R&D and innovation

R&D is a fixed cost that only pays off over a large, contestable market. A thin domestic market depresses the return to it, which is why the economies that lead on R&D expenditures are either big-and-rich at home (the US) or export-driven (Korea, Germany, Taiwan). India is neither, and sits alone in the low-R&D corner.
This is an instructive comparison of India with China and South Korea.
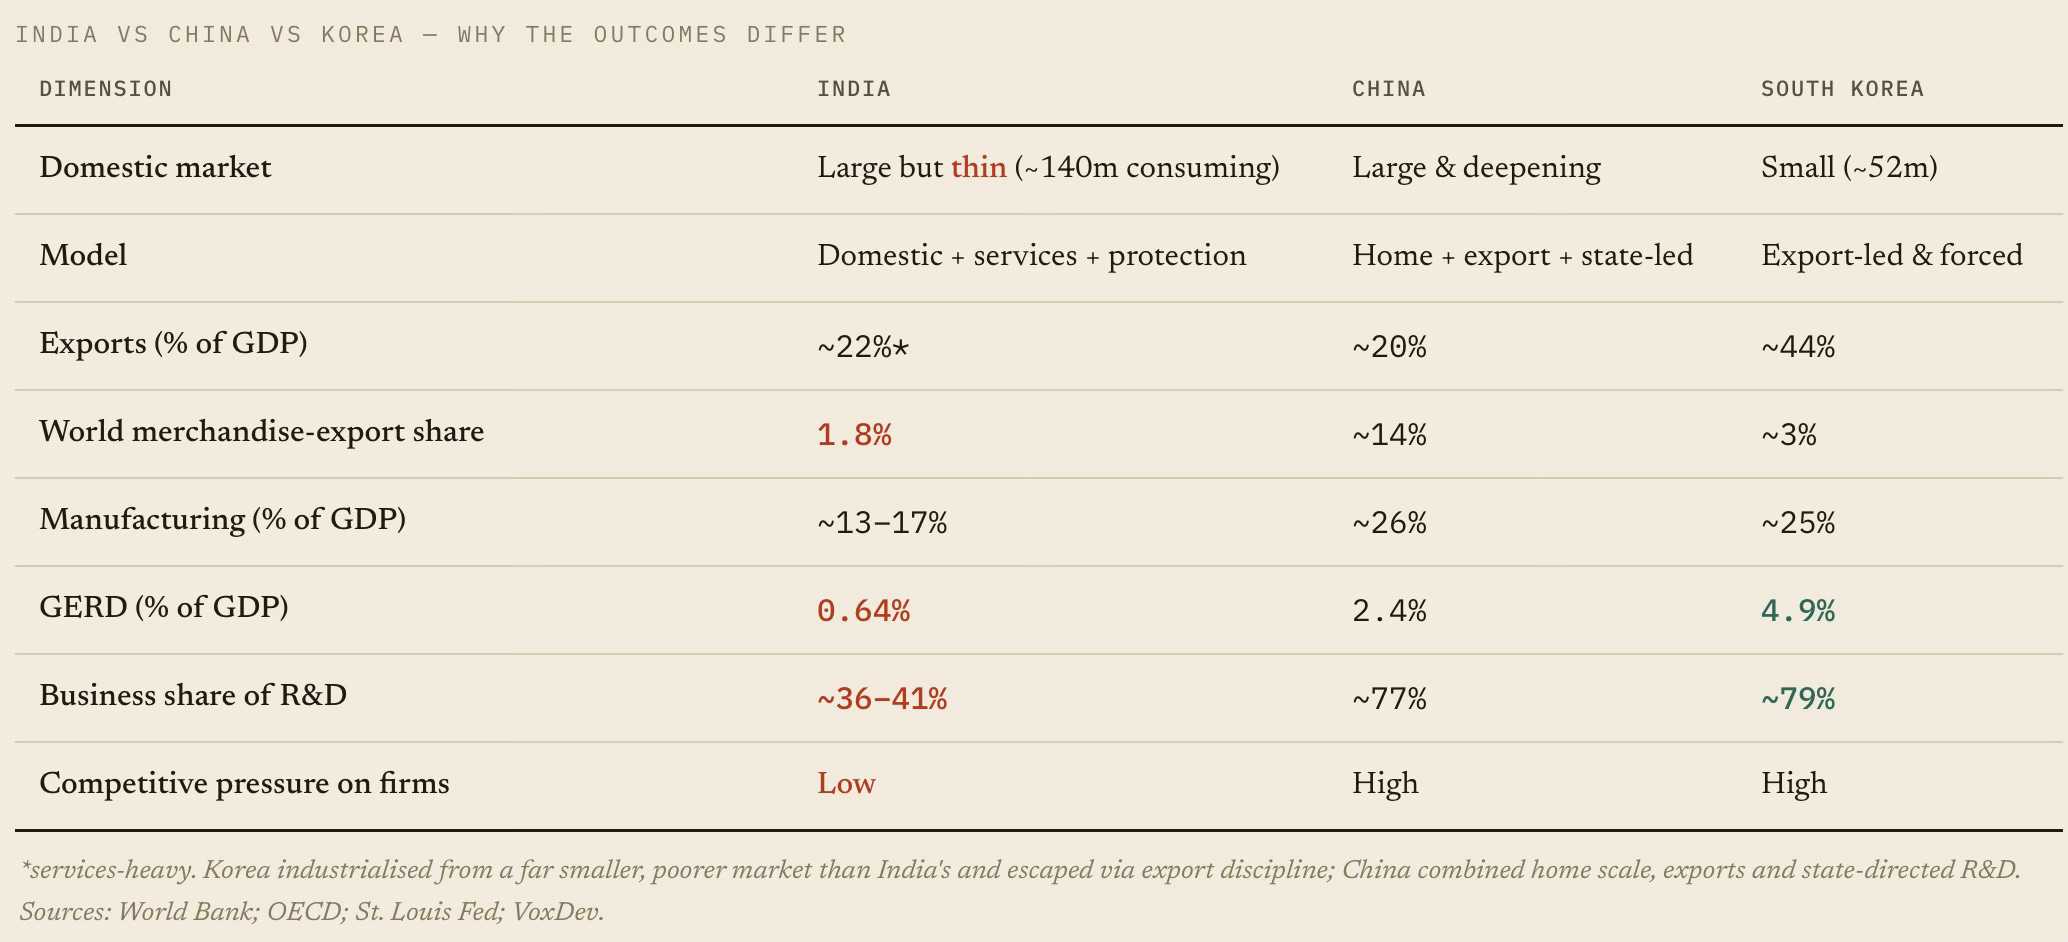
The main takeaway is that India’s existing consumption class, confined to just 10% of the households, is too narrow to sustain high growth rates for long periods. It requires considerable broadening. But broad basing economic growth requires access to good jobs, a daunting task given that the gig economy is the biggest source of job creation and elsewhere it is mainly contractual jobs. Worsening matters is the reluctance of the private sector to invest or innovate

Saturday, July 18, 2026

Weekend reading links

1. Are people overreacting to small struggles?

When asked if they would consider someone experiencing typical fluctuations in mood (described as broad happiness but occasional moments of worry, frustration or loss of confidence) as having a mental illness, more than half of young Americans say yes, up from just a fifth 15 years ago.

2. A picture of state finances.

3. The promise of quantum computing.
Quantum computers can transcend the limitations of the traditional binary computer bit, which can exist in two states, denoted by zero and one. By contrast, quantum bits, or “qubits”, can exist in both those states at once. This allows quantum machines to survey multiple potential solutions simultaneously, rather than dealing with them one by one like a conventional computer. One analogy is a maze. Where a quantum computer can examine the whole map to find a way through, a traditional machine will keep exploring dead ends until it finds the route. Quantum computers’ superior processing power should make them better able to generalise from small amounts of data and sift through multiple complex patterns...
But many companies are already experimenting with the technology because of its promised leap in capability, predicting early uses for the machines in areas such as chemistry and materials science. The idea is that because of their own workings and structure the computers will be better able to analyse and predict chemical behaviour determined by atomic and subatomic interactions governed by quantum rules. In a sense, they will be speaking the same language rather than translating an analysis into a string of ones and zeros as a traditional computer does. As a result, a sufficiently powerful quantum machine should in theory be adept at predicting the interactions between drugs and living cells that determine whether a new pharmaceutical will work. Such possibilities have already led tech companies to pair up with industrial groups.

4. India's trade account in a nutshell.

In 2025-26, its exports of services, at $421.3 billion, was close to the export of goods worth $446.1 billion. On the other hand, imports of goods ($783.4 billion) were way above the imports of services ($204.7 billion). Thus, while India recorded a merchandise trade deficit of $337.3 billion, it had a surplus of $216.6 billion on the services account.

5. Brilliant article by Simon Kuper on how football came to be dominated by Western Europe.

Western Europeans didn’t start by asking, “How can we win the World Cup?” Instead, they pursued a different goal: making amateur football cheap and widely available. The intended outputs were happiness, community and public health. Winning World Cups was a byproduct... I began playing football aged six, in 1976, after moving from London to Leiden in the Netherlands. Most Dutch boys I met belonged to a football club... The little Leiden region had dozens of football clubs. Some fielded 20 senior teams, seven teams of under-eights and so on. Many people built their identity and social life on being the right-back or linesman of the 14th team. The Netherlands in the 1970s reached two World Cup finals. Everyone played and understood how to play. Football is geometry — about creating space when you have the ball, and shrinking it when you don’t. That knowledge is all around you in western Europe, unlike in Asia, Africa, the US or Brazil... In 2017, the average Dutch person lived 1.6km from a football field. Neighbouring Germany’s football federation is the world’s largest sports association, with more than 7.7mn members...

As a father, I raised three footballers in Paris, now the game’s deepest talent pool. Almost all Parisian suburbs, or banlieues, have well-kept sports complexes, with artificial fields, used nonstop: at half-time of any amateur game, children storm on to the field for a kickaround. So structured is the system that my son had to earn a coaching diploma to train his little club’s under-eights. His own beloved coach, Mustapha Sangaré, who only joined a football club aged 15, now plays for Bulgaria’s Levski Sofia and Mali. He is far from an anomaly: almost 100 players across all squads in the current World Cup were born in France and just under 70 in the Netherlands.

In another article Tej Parikh looks at why China and India does so badly in football.

This is a striking statistic, pointing how globalised football has become and how the leading European clubs have become the feeding grounds for national teams. 

At this World Cup, more than 72 per cent of players appear for a club outside the country of their national team, and almost one in four are foreign born. (More than half of Cape Verde’s squad was born outside the nation and ply their trade in various European leagues.)

6. In what will prove to be a dramatic decision, DP World, which operates the Jebel Ali port that has been paralysed by the closure of the Strait of Hormuz, is reportedly planning to build a new port and a container terminal on the UAE's eastern coastal area of Fujairah. 

Shifting some of the port’s capacity outside Dubai marks a seismic change for the emirate, which has established itself as a global trade and finance hub partly off the back of Jebel Ali’s growth... But DP World’s plans align with a broader UAE government initiative to attempt to bulletproof its economy against future hostilities with Iran by reducing its dependence on the strait, where shipping has been disrupted by Iranian drones and missile strikes since the US-Israeli attack. The new project would deepen DP World’s presence on the Gulf of Oman, allowing containers to enter and leave the country without having to pass through the strait, before moving them on trucks overland to Dubai, Abu Dhabi and neighbouring Gulf countries. Since the war began at the end of February, Iran has fired nearly 3,000 drones or missiles at the UAE — more than any other country... DP World’s plans underline how the Iran war has forced governments and companies in the region to reconsider infrastructure and economic corridors developed on the premise that there would be uninterrupted passage through the strait.

7. Rote memorisation in schools is celebrated in China.

The guidelines to the gaokao, an exam for 18-year-olds and the world’s largest standardised test, describe memorisation as “the most basic level of ability”, placing it first among six traits that include comprehension, analysis and synthesis, appreciation and evaluation, expression and application, and inquiry. At the simplest level, the Chinese script itself, which operates at the level of the syllable and involves thousands of individually meaningful characters, requires years of memorisation... It is hard not to draw a contrast with the English-language west, where rote memorisation has taken on a faintly pejorative meaning. More than a century and a half ago, at the height of Britain’s industrial age, Charles Dickens was skewering the “facts alone are wanted in life” approach of fictional educator Gradgrind in the novel Hard Times.

8. Trump's makeover of the US State Department

Abandoning the precedent of the past 60 years, Trump has brushed aside the foreign service officers who have typically run at least two-thirds of embassies. Of the 101 nominations for ambassadorships in his second term, just nine were career diplomats. All this is against the backdrop of swingeing cuts to the department, whose workforce has shrunk by more than 3,000, over 20 per cent, since Trump resumed office.
9. China's remarkable success in reducing air pollution by 60% since 2013. 

10. Interesting that the IT sector explains half the difference in productivity growth between the US and EU.
Strikingly, even though the tech sector was only 9.2 per cent of US GDP, against 5.4 per cent of the EU’s, almost half of the difference in productivity growth between the two economies was explained by differences in the relative size of this one sector. Moreover, productivity growth in the EU’s (relatively small) tech sector was also measured as being lower than in the US one. So, overall, the tech sector alone accounts for well over half of the overall difference in growth of GDP per head.

This is important

Life expectancy for US men was 76.5 in 2024, against an average of 80.5 in comparable high-income countries. For women, it was 81.4 against 84.8. That is despite spending a far higher proportion of its GDP on health. The US homicide rate was 5.9 per 100,000 in 2023, against 1.3 in France and 0.9 in Germany. Its prison population was 542 per 100,000 in 2023, against 130 in France and 69 in Germany. Thus, if one takes a wider view of human welfare, the US is very far from superior.

11. China reports the lowest quarterly growth rate in decades at 4.3% for the second quarter of 2026. Industrial production and exports are propping up growth, even as consumption declines.

Retail sales added just 1 per cent in June from a year earlier, while fixed-asset investment was down 5.7 per cent year on year for the first half of the year, compared to 4.1 per cent in the first five months. Industrial production, one sign of strength, grew 5.3 per cent last month on a year earlier... Separate data on Tuesday showed exports soared 27 per cent year on year in June, adding to signs of reliance on trade to support economic activity... Julian Evans-Pritchard, head of China economics at Capital Economics, noted that the GDP data brought it “closer in line” with the consultancy’s alternative measure, which has been around 3 per cent.
Underlining the importance of exports, there was a surge in China's EV exports in June.
China’s monthly car exports rose to a record 1mn cars in June as part of an overall surge in trade that will heighten tensions with partners such as the EU. Shipments of cars rose 71.2 per cent from a year earlier to 1.06mn, putting the country on track to export more than 10mn cars this year, up from 7.1mn last year and more than double the 4.9mn in 2023. The surge in exports comes as domestic sales slow sharply following the phaseout of EV subsidies and a decline in demand for fuel-powered cars... The wave of Chinese exports has been driven by lower-cost cars boasting superior software, further threatening carmakers from Japan, South Korea, Europe and the US... China’s exports of rare earths in June fell 34 per cent year on year and 6.4 per cent in the first half, following tight export controls on the minerals, which are essential for high-technology products... The NBS’s Wang said China’s exports of green energy-related products such as lithium batteries and wind turbines increased 37.6 per cent and 35.6 per cent, respectively, during the first half.

And this highlights how production and exports have sustained growth.

Industrial production rose by 5.4 percent in the first six months of the year, versus the same period last year. High-tech manufacturing rose by more than 13 percent over that period. But fixed asset investment — which includes infrastructure, property construction and manufacturing — fell by 5.7 percent. Real estate development dropped 18 percent. The value of China’s exports surged by more than 20 percent in the first half. But consumer spending, which a Moody’s Analytics report said “remains the economy’s weakest link,” faltered. Retail sales of consumer goods increased by 1.3 percent over the first half of the year.
12. Ruchir Sharma holds that peak China was reached in 2021, and since then it has been a story of decline, papered over by exports and AI.

Since then, China’s share of global GDP has fallen in nominal terms from 18 to 16.5 per cent, while the US share has risen to 26 per cent. China’s growth rate has dropped below the rest of the world, including the US. In real terms, independent estimates now put China’s growth in real terms closer to zero than to the official target of 4.5 to 5 per cent... China’s population also peaked in 2021. Last year, births hit a record low, and deaths hit a record high. The working-age population is on pace to shrink by 75mn every decade this century... After adding little in the 2010s, net exports now account for about a third of the country’s growth, driven mainly by AI-related goods... And though every country now hopes for an AI-driven productivity miracle, the expected boost in China is about a third of a percentage point by 2030, hardly enough to halt its decline.

13. India agriculture statistics

If one looks at the growth areas in agriculture in the 12 years between 2011-12 and 2023-24, production of paddy and wheat rose by just 27 per cent. Fruit and vegetable production rose by 52 per cent, and milk production by 85 per cent, even though they did not receive any substantial support by way of subsidies or minimum support price procurement by the government. The true growth areas in agriculture are out of direct central government support and depend largely on producer enterprise... In 2023-24, the value of output of cereals (mainly paddy and wheat) was ₹8.5 trillion, while the value of the largely cooperative-controlled milk sector was ₹12.2 trillion.

14. Outbound corporate investments from India on the rise.

Indian companies have announced overseas equity investments worth more than $14bn in the first four months of the fiscal year that began on April 1, compared with $18.7bn in the previous 12 months. The outflows come as foreign investors flee India’s markets at the fastest pace ever this year, pulling out more than $23bn as of the end of June over a lack of AI champions.

15. Simon Kuper on Lionel Messi.
On the field, Messi sees everything. All his career, he ignored the ball for the first five minutes and instead walked around, memorising the position of each opponent and the spaces between them. But now he spends almost the entire game walking and scanning. When he breaks into a run, his teammates know he has seen an opening. They play to serve him. When he moved to the right wing against Egypt, seeing space there, the team remade itself around him. Argentina, two goals down after 78 minutes, won 3-2. Scaloni said afterwards: “We were not the ones who told him to go out to the right.” Messi moved right again against England and again Argentina came back to win.

16. The AI-boom is spilling over to energy sector.  

Initial public offerings for energy firms raised $12.6bn in the first half of this year, according to data firm Dealogic. That marks the highest half-year level since the peak of the dotcom bubble in late 1999 and the highest first-half figure on record. It is well above 2025’s full-year total of $4.3bn. The surge in fundraising comes as access to the vast amounts of energy needed to run data centres emerges as a bottleneck in a multi-trillion-dollar AI investment boom... US electricity demand is projected to increase 39 per cent between 2026 and 2035, according to consultancy ICF, in large part due to ballooning demand from data centres...
Companies that have been able to raise money on public markets include those involved in complex, capital-heavy projects such as nuclear and geothermal power plants, while investors have also been willing to back businesses trying to develop new technologies... “This is a moment in which speculative projects are being funded and underwritten,” said Julien Dumoulin-Smith, a Jefferies research analyst covering power, utilities and clean energy. “They’re not just limited to venture capital or private equity.”... Nearly two-thirds of the energy companies that floated this year and last are now trading below their offer price, according to Dealogic. That compares with less than 40 per cent of IPOs across all sectors that are underwater.

And Wall Street Banks are already AI trades

Four of the five big Wall Street banks reported yesterday: JPMorgan Chase, Bank of America, Citigroup and Goldman Sachs (Morgan Stanley chimes in today). The numbers were outstanding, as one would expect in a quarter when markets whipped around and big deals were done. In aggregate, equity and debt trading revenue at the four hit $38bn, up more than a third from a year ago and 60 per cent higher than two years ago. Investment banking fees, at $10bn on the quarter, have grown almost as much... It is AI that has markets churning and drives capital-raising. The banks are another example of the false “broadening” of the stock market that has also driven up industrial and utility stocks in the past few years. All these sectors have lived, and could die, with AI.

And their profits are not confined to the US, with even Asia becoming a major source.

Equities trading in Asia is helping power a record-breaking run from Wall Street’s banks, with the region on course to surpass Europe as the industry’s second-largest source of revenue behind the US. In the past 12 months, clients of large investment banks have ploughed into companies in Asia that provide critical infrastructure to the AI semiconductor industry, including South Korean SK Hynix, Taiwan’s TSMC and China’s Cambricon Technologies... In the most recent quarter, the largest investment banks collectively reported an unprecedented $25.7bn in earnings from equities trading and called out Asia as a crucial factor in the growth.

17. Even by the low standards of Trump 2.0, this is surely an outrageous example of private profiteering from public office

Donald Trump’s social media company has discussed charging traders and investors as much as $100,000 a month for faster access to the US president’s posts on his Truth Social platform. Trump Media & Technology Group (TMTG) has quoted the six-figure monthly sum in talks with prospective buyers of the “Truth API” data service, according to people familiar with the matter. Proprietary trading firms and hedge funds pay huge sums for ultrafast data feeds because every millisecond counts when reacting to market-moving news. Trump often makes major announcements on Truth Social that trigger huge fluctuations across global markets... TMTG, which is majority owned by the Trump family, controls Truth Social...
A pitch sheet circulated by TMTG to promote Truth API, seen by the FT, lists 10 “documented market-moving posts” from the president’s Truth Social account. On April 9 2025, for example, the document says Trump’s “THIS IS A GREAT TIME TO BUY!!!” post “restored” $4tn to the market capitalisation of the S&P 500. Trump’s post in early June that the US would hit Iran “very hard tonight” caused a 6 per cent intraday jump in oil prices, the document says. “When @realDonaldTrump Truths, the world reacts,” the document continues. “No comparable signal exists. No official API has ever been offered. Until now.” Trump has also touted specific stocks, complimenting companies such as Nvidia and Apple and fuelling rallies in their share prices. More recently after the outbreak of the war with Iran, Trump posted on March 23 that there had been “very good and productive conversations with Iran”, sending oil prices falling sharply.

Monday, June 29, 2026

Indian economy's cost competitiveness constraints - a graphical summary

I had blogged here, arguing that the Indian economy faces a cost-competitiveness constraint. I had written that on many inputs, domestic firms face the cost structure of a developed country. This post will examine the empirical evidence in this regard. 

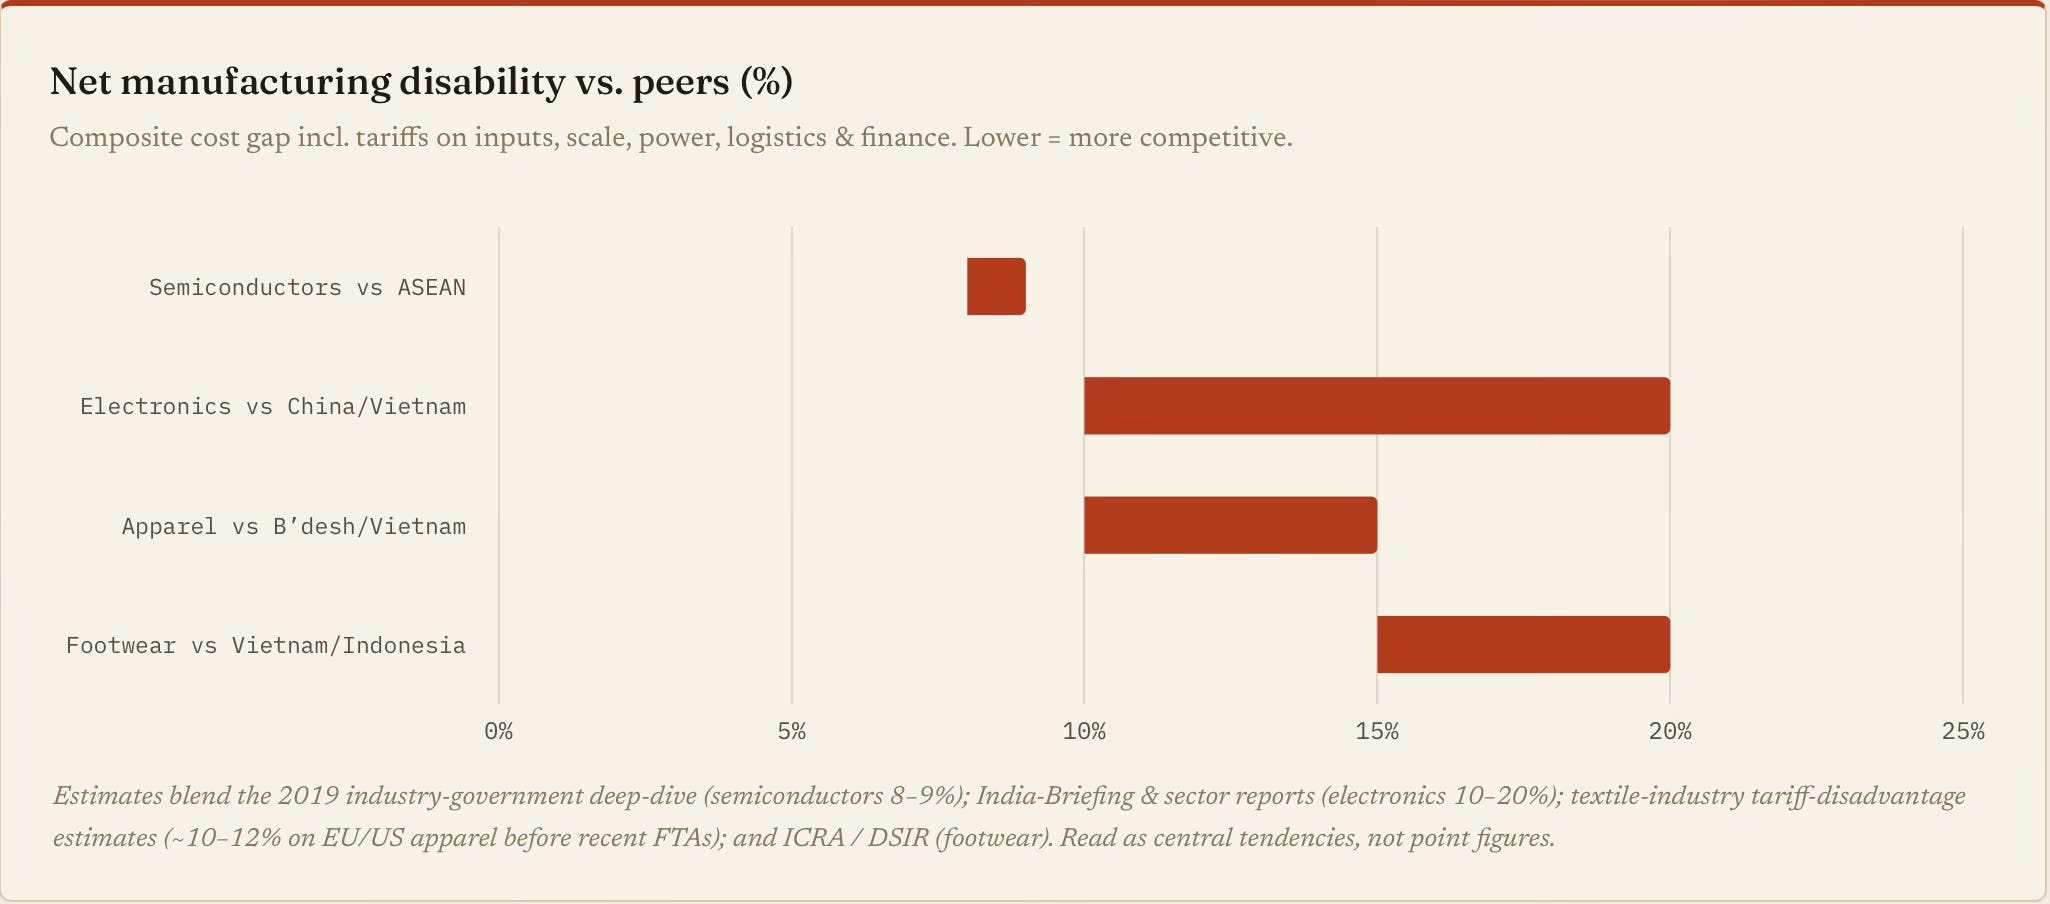
This cost structure reflects in the global competitiveness of the country’s manufacturers. India suffers from a persistent and high price disability compared to peers across manufacturing sectors. 

What are the contributors to this competitiveness wedge?

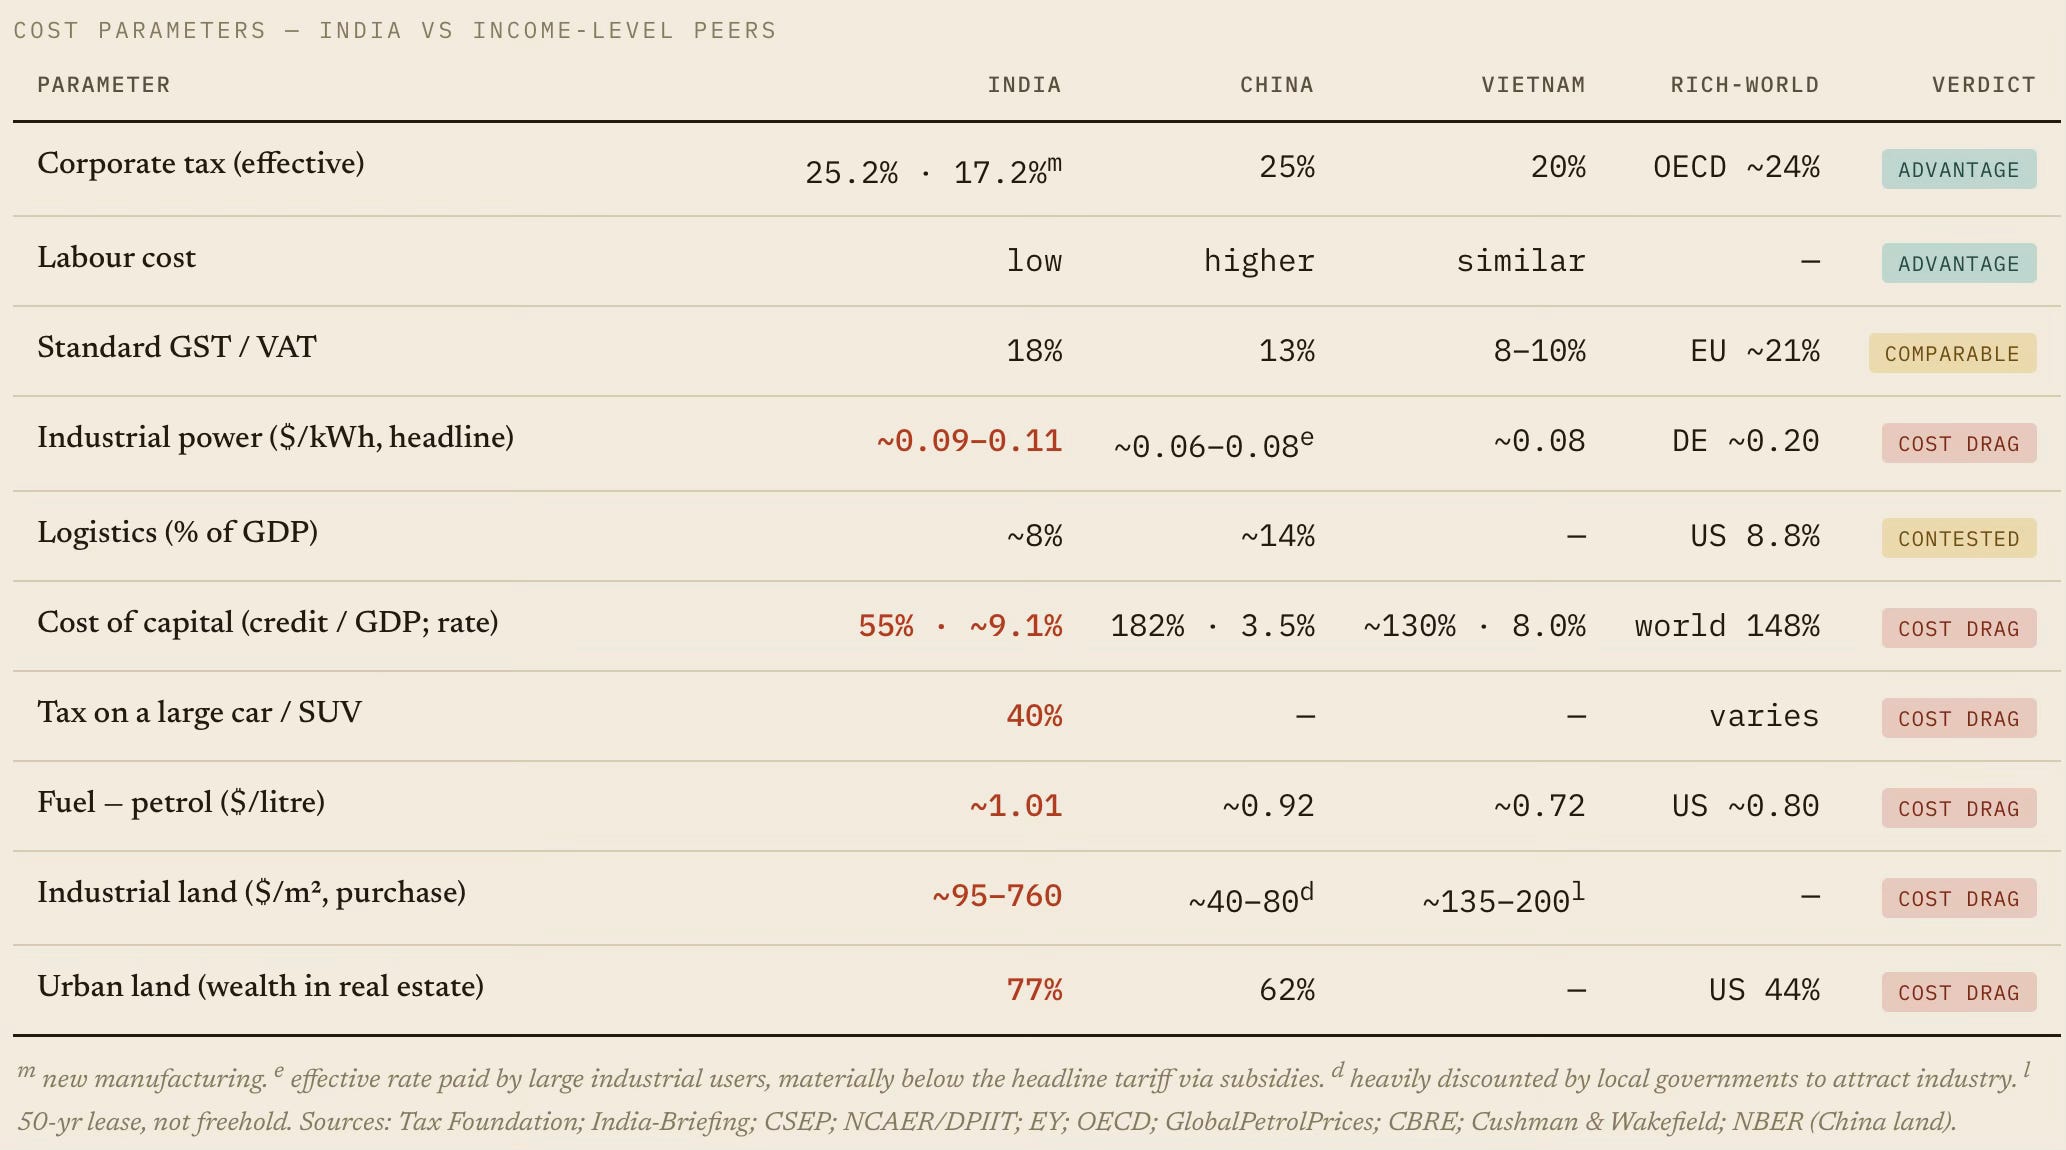
Indian factory wages (~$2.1/hour) are the lowest in Asia, about two-thirds of Vietnam's and a third of China's. Its effective corporate tax rate at 17.2% is among the lowest, its GST rates are comparable, and its logistics costs (while contested) are at least not much higher. 

So if India loses on net cost, the disability is entirely in non-wage factors: land, capital, power, fuel, scale, tariffs on inputs, and labour productivity.

Start with land, the largest cost wedge. Urban land is priced like that of a rich country, and, most problematically, hoards the nation's savings. Mumbai ranks among the world's 20 most expensive prime markets, and Indians park ~77% of household wealth in real estate. The high land valuations result in capital misallocation and squeeze out the capital that would otherwise have resulted in investment. 

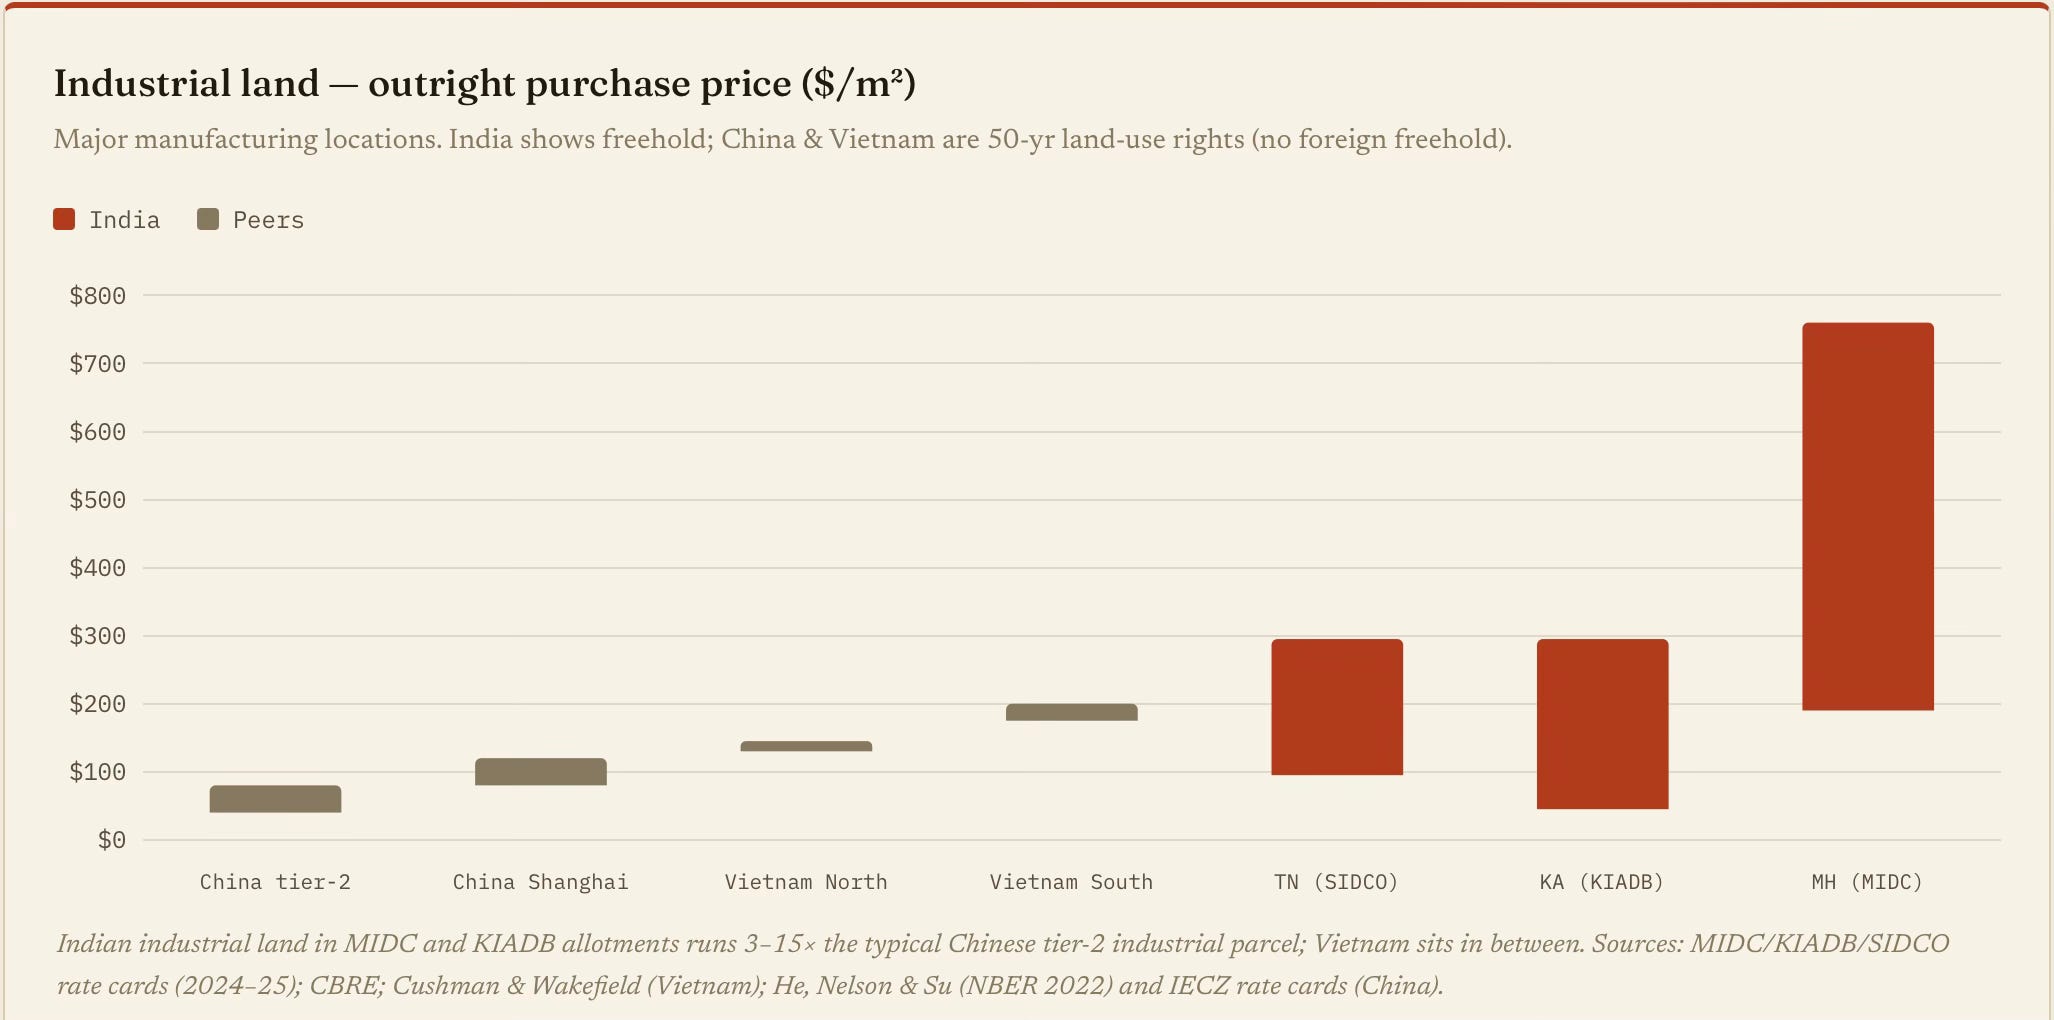
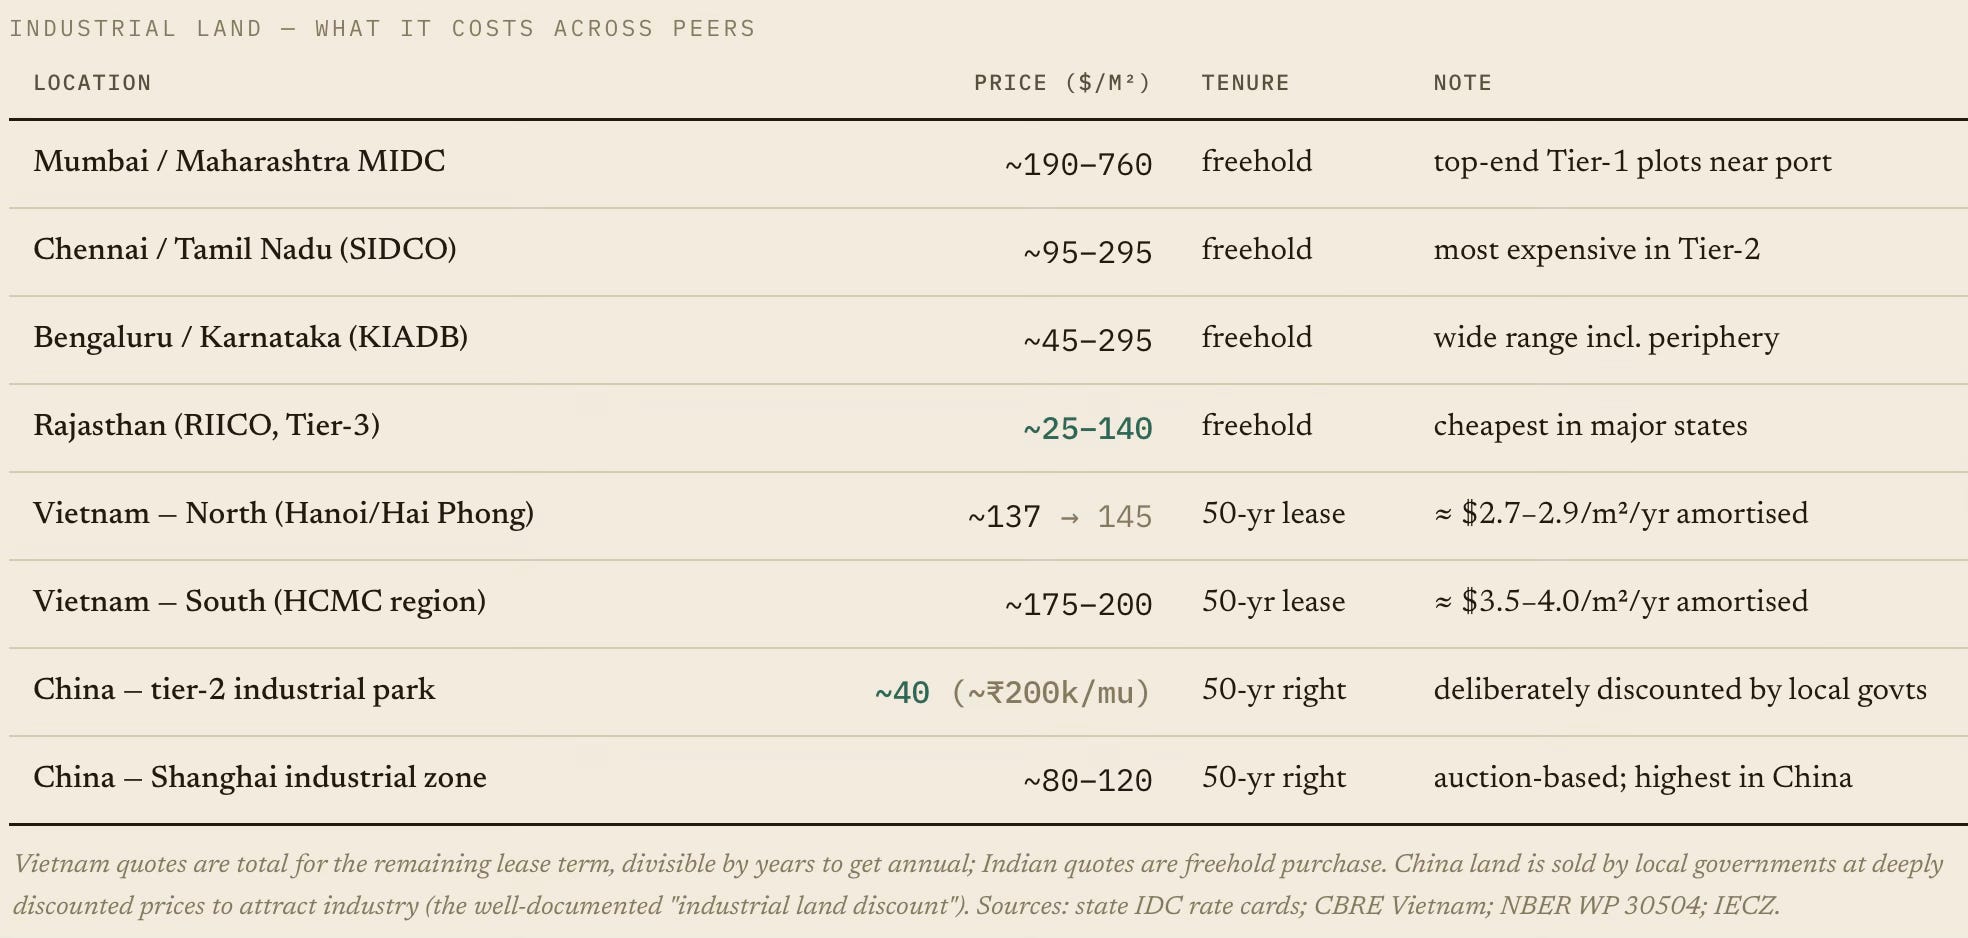
In fact, high land valuations, even in the smaller cities, appear to be a big entry barrier for businesses. An Indian manufacturer pays roughly 5–15 times more for industrial land than a Chinese counterpart in a comparable tier-2 city, and 1–4 times a Vietnamese peer. That gap is policy-made. China's local governments subsidise industrial land to attract production, whereas India's restrict supply (FSI, fragmented titles, slow acquisition) and treat land as a fiscal asset to maximise revenues.

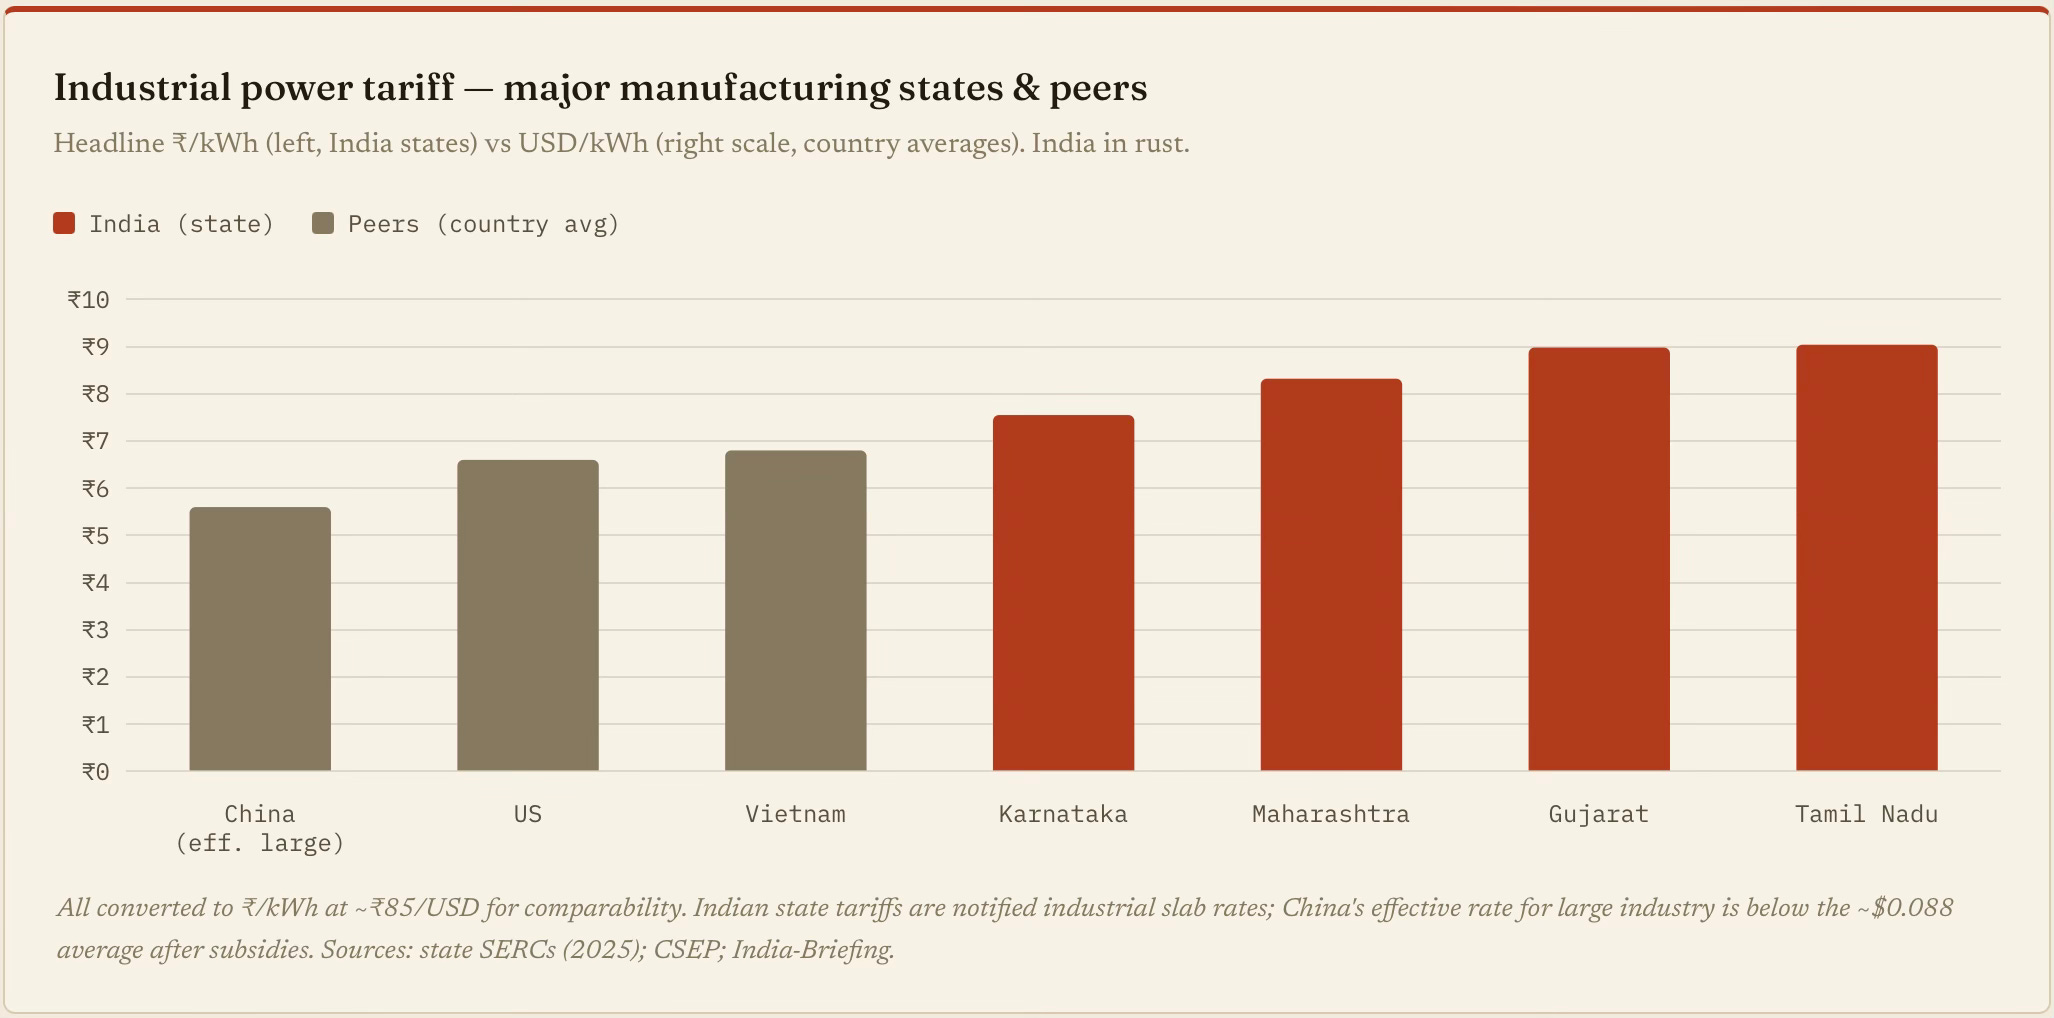
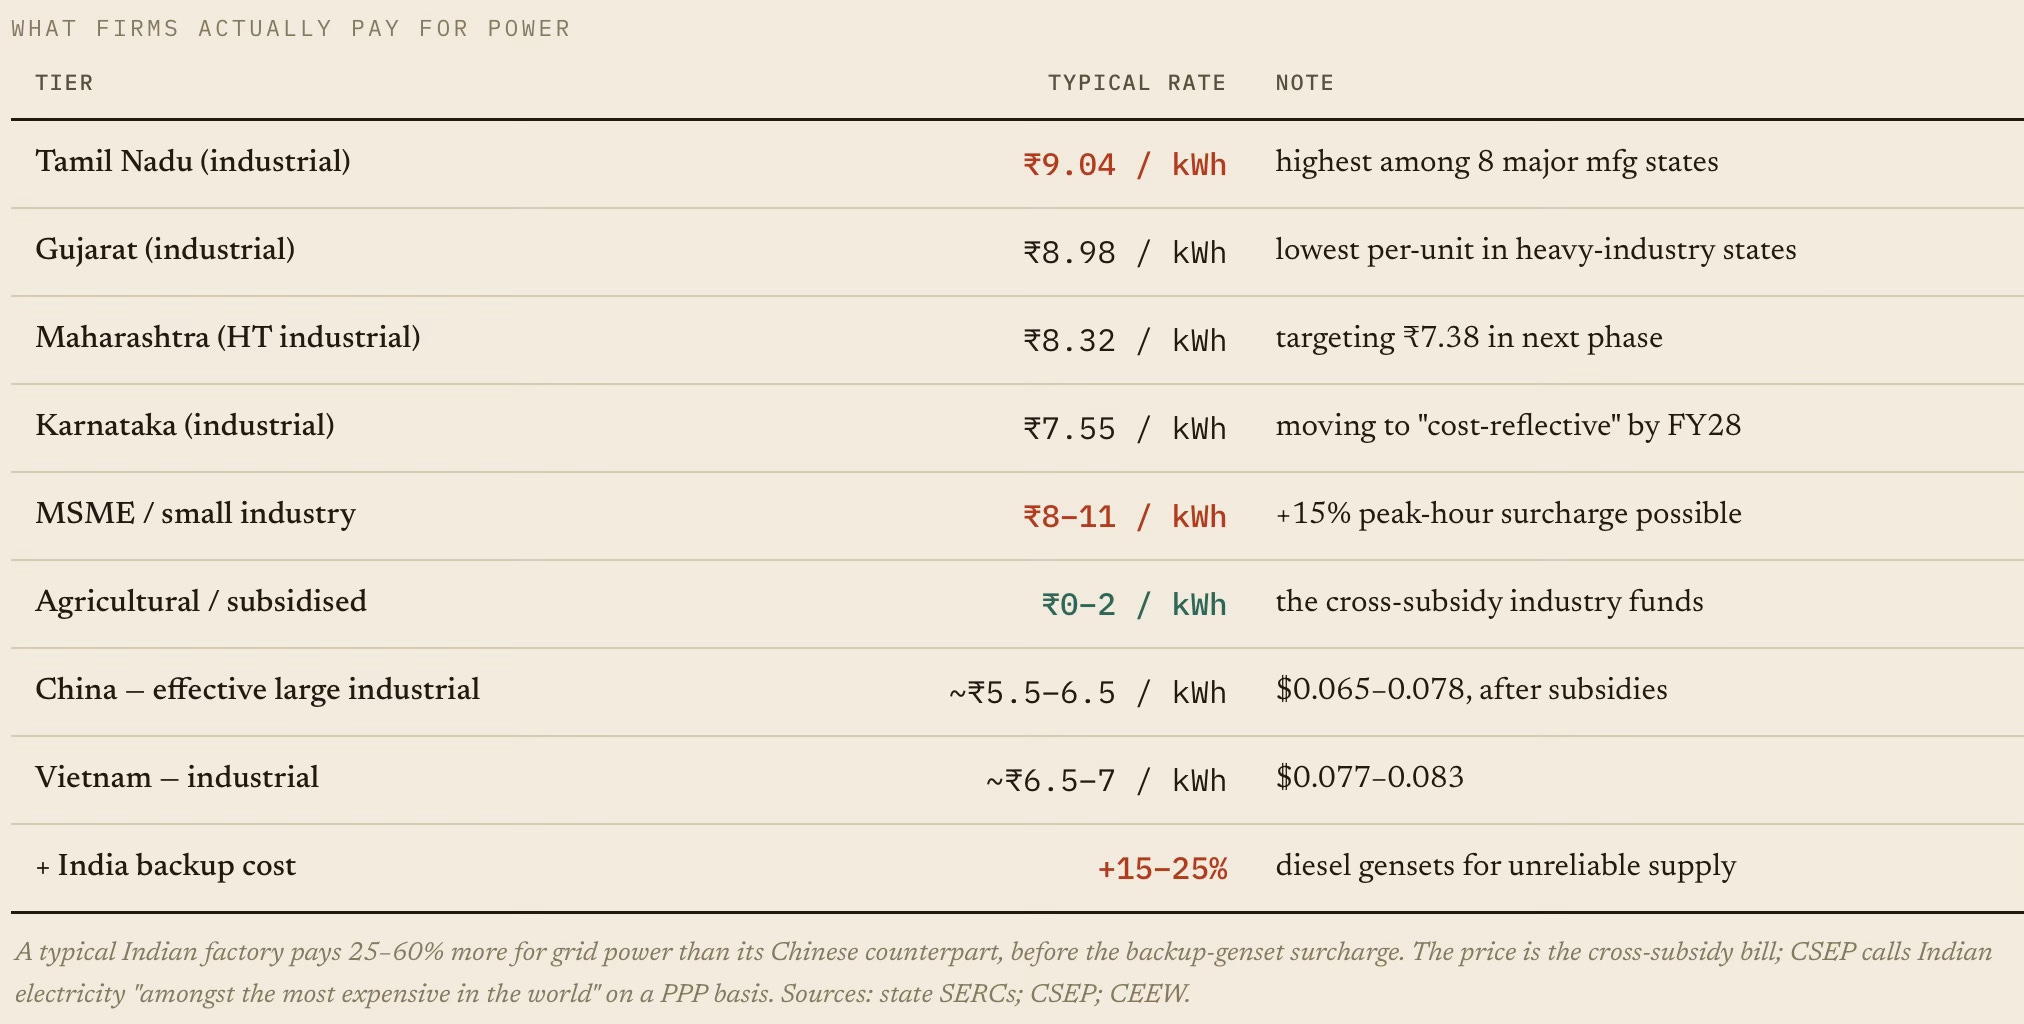
Now, come to power tariffs. Indian industrial users pay ~₹7.5–9/kWh ($0.09–0.11), materially above what comparable Asian peers' large industrial users effectively pay. Indian electricity is among the world's most expensive on a PPP basis, with one of the world's widest spreads across consumer types. 

The comparisons of electricity prices based on averages are misleading. For example, India and China have similar average electricity tariffs at $0.08/kWh. It conceals that India has one of the world's widest cross-subsidy spreads (farms near zero, industry penalised). The rate that matters for competitiveness is the industrial slab, which is materially higher. Industry overpays to cross-subsidise farms and households, again, another policy choice. To this, we must add another 15–25% for diesel backup against unreliable supply.

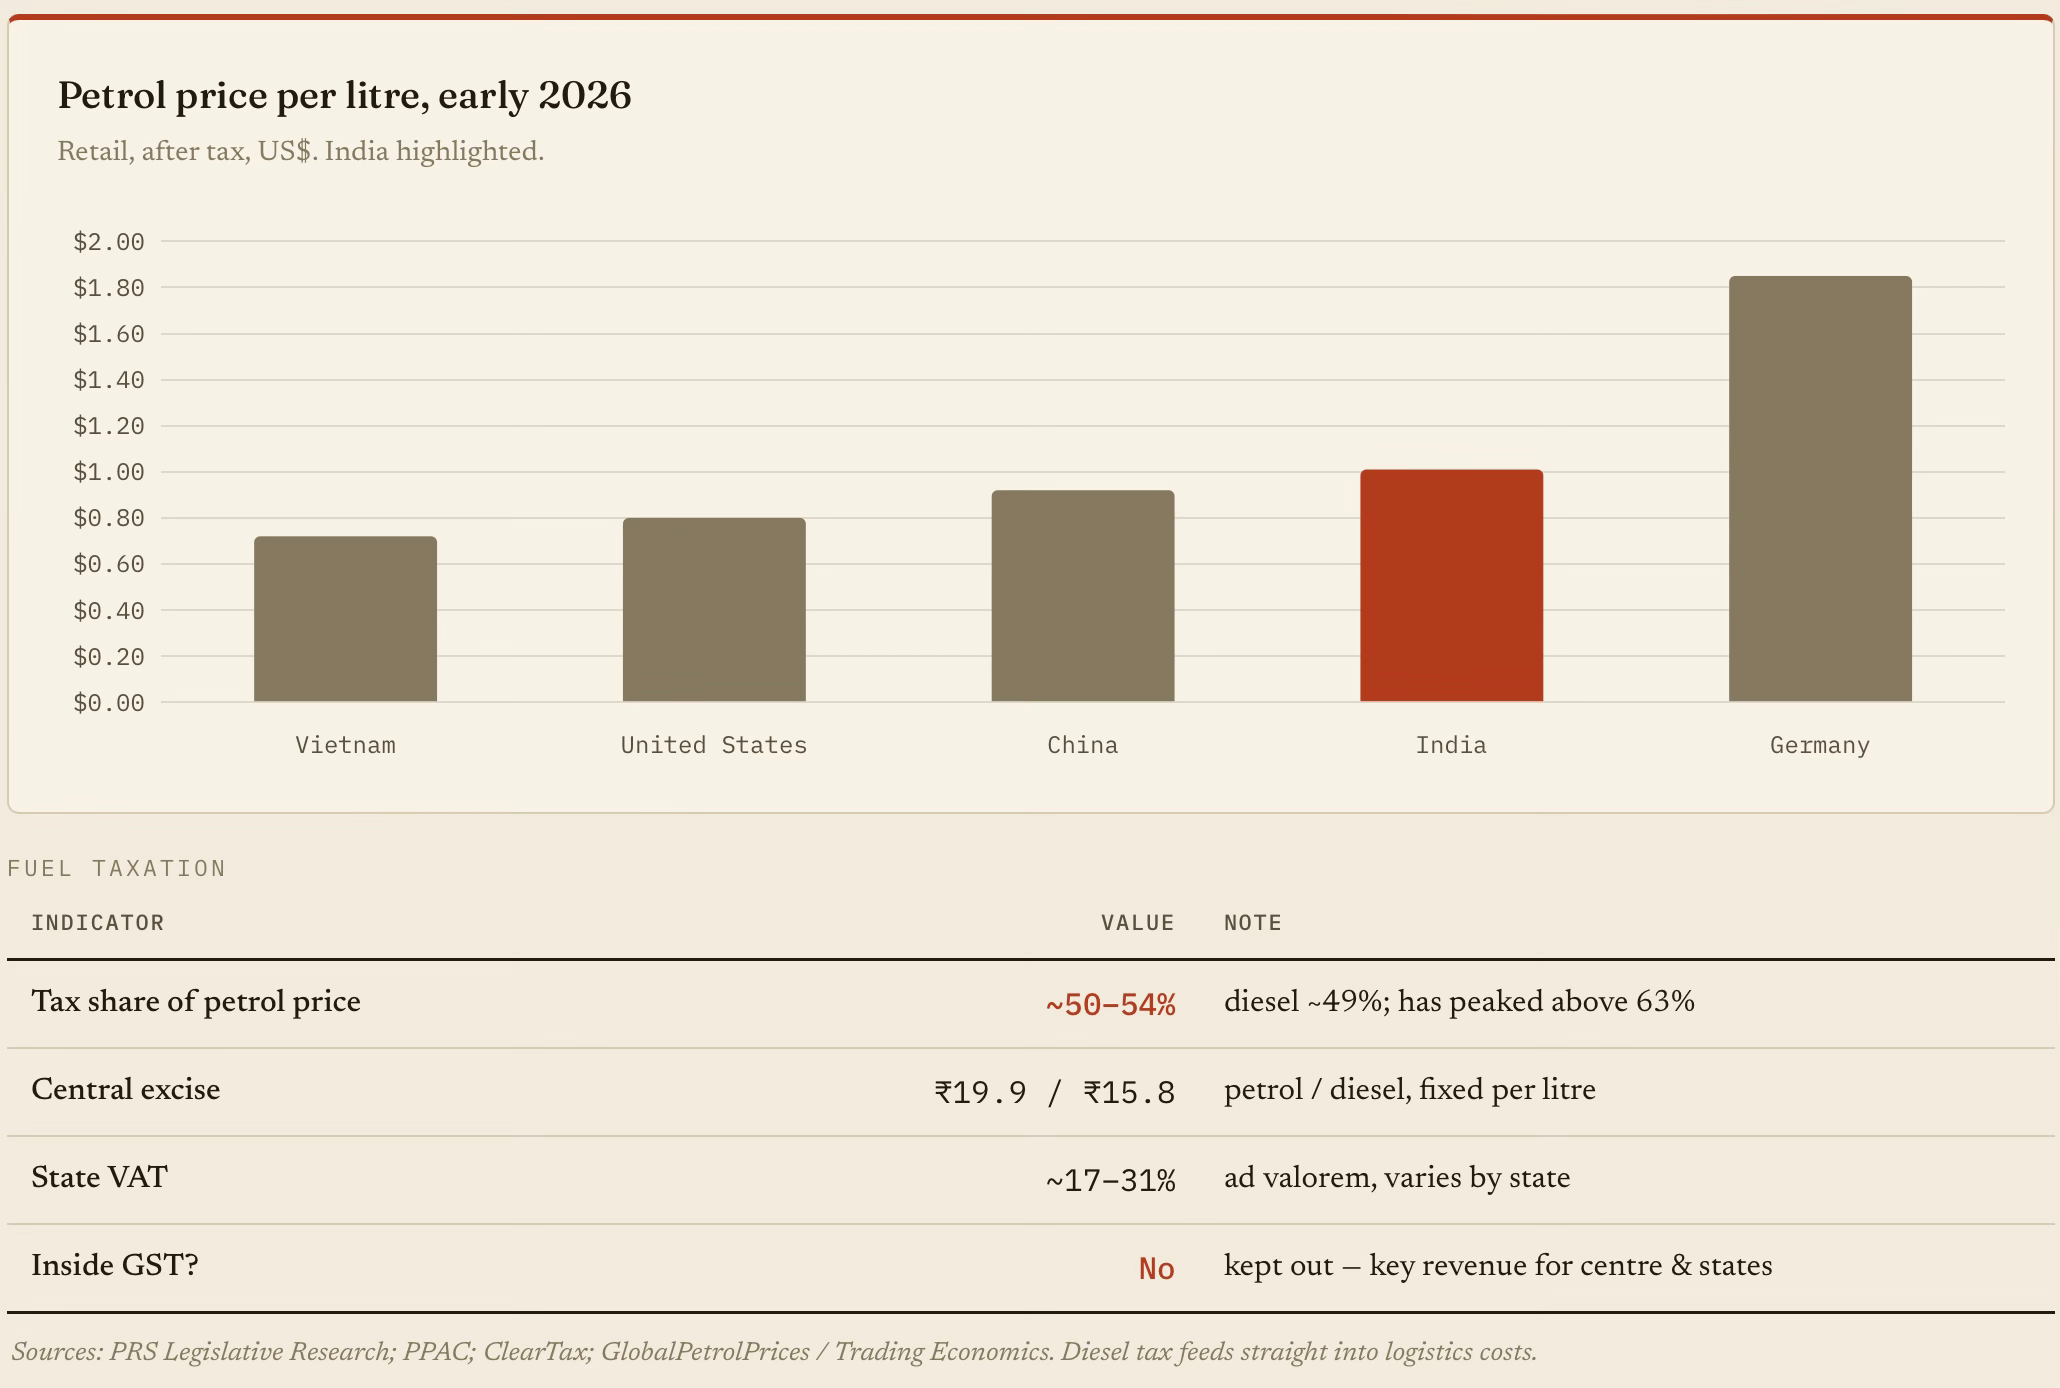
The same applies to gasoline prices. Kept outside GST as a revenue mainstay for state governments, petrol and diesel carry stacked central excise plus state VAT. Roughly half the pump price is tax. In raw dollars, India's fuel is dearer than China's, Vietnam's or America's, despite far lower incomes.

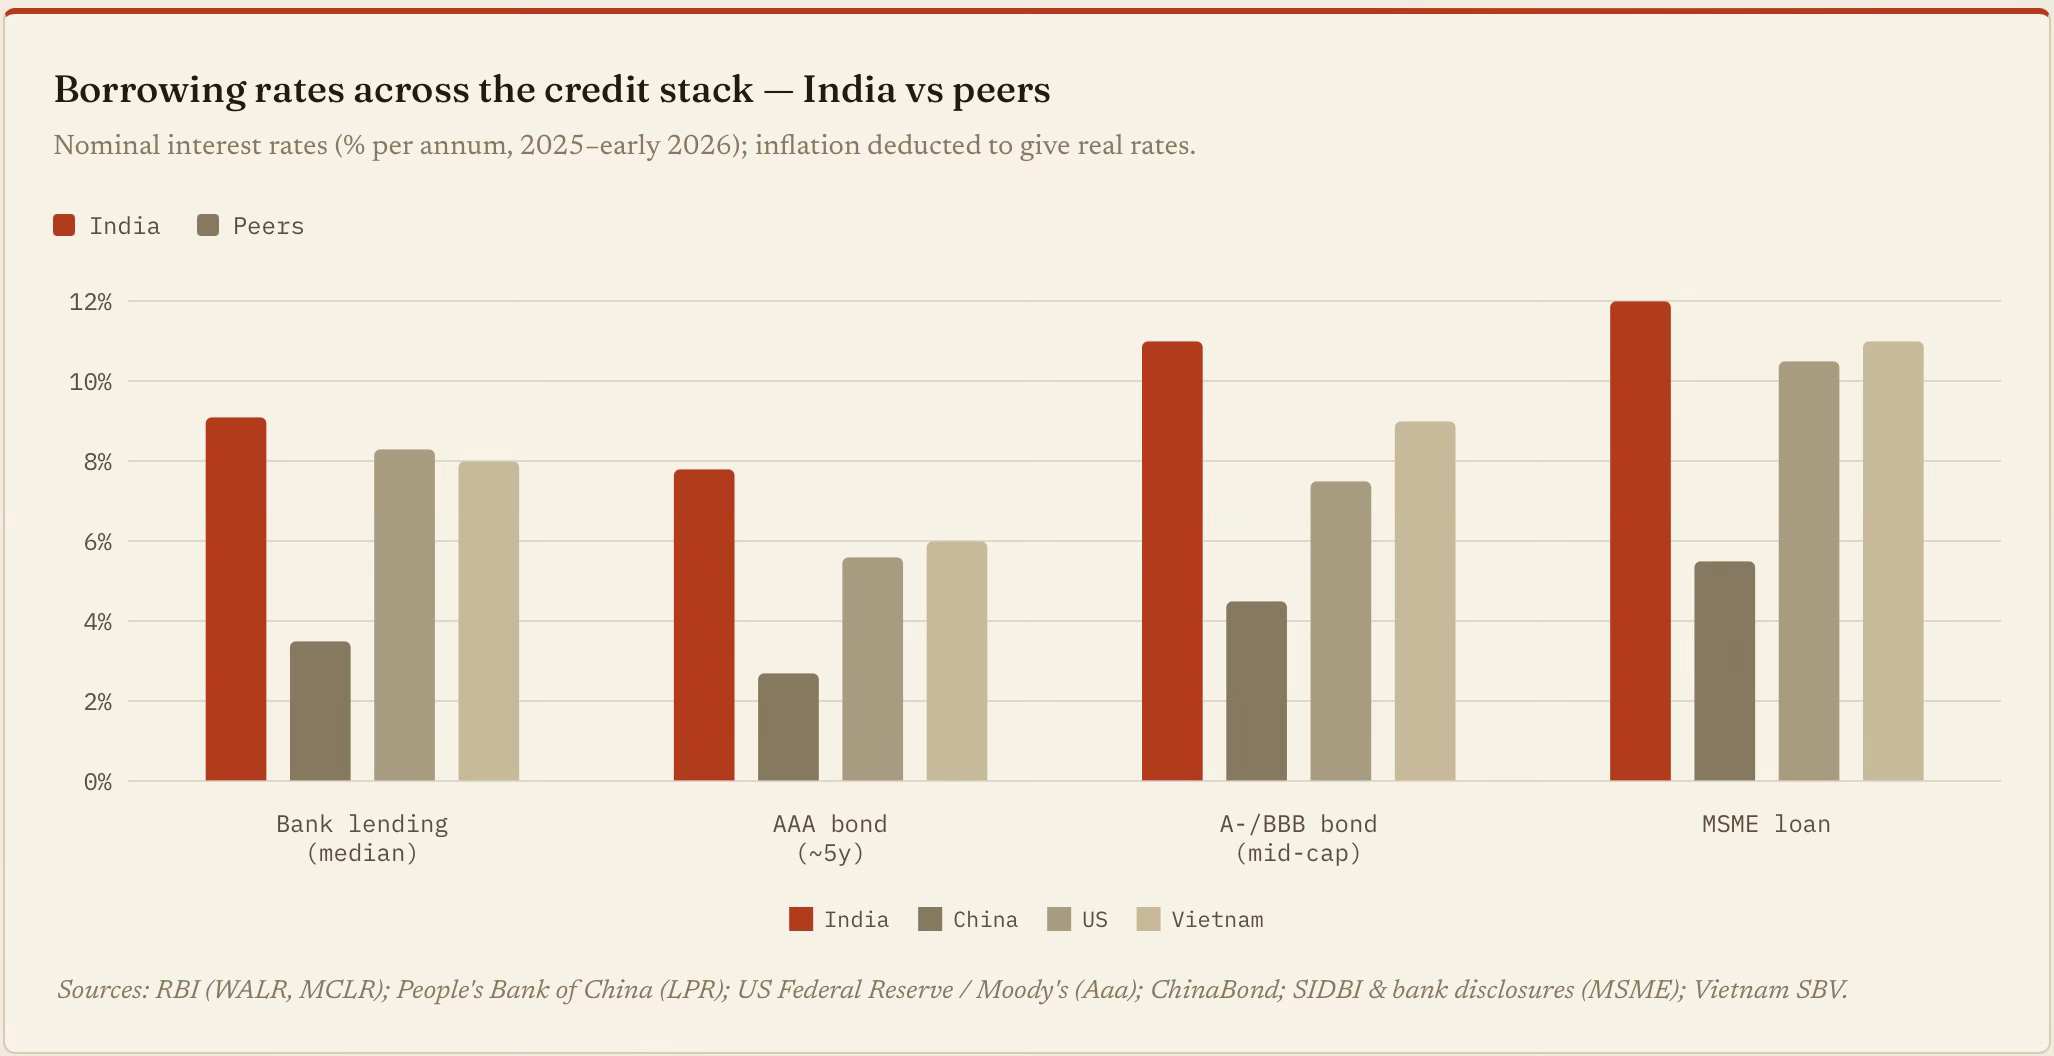
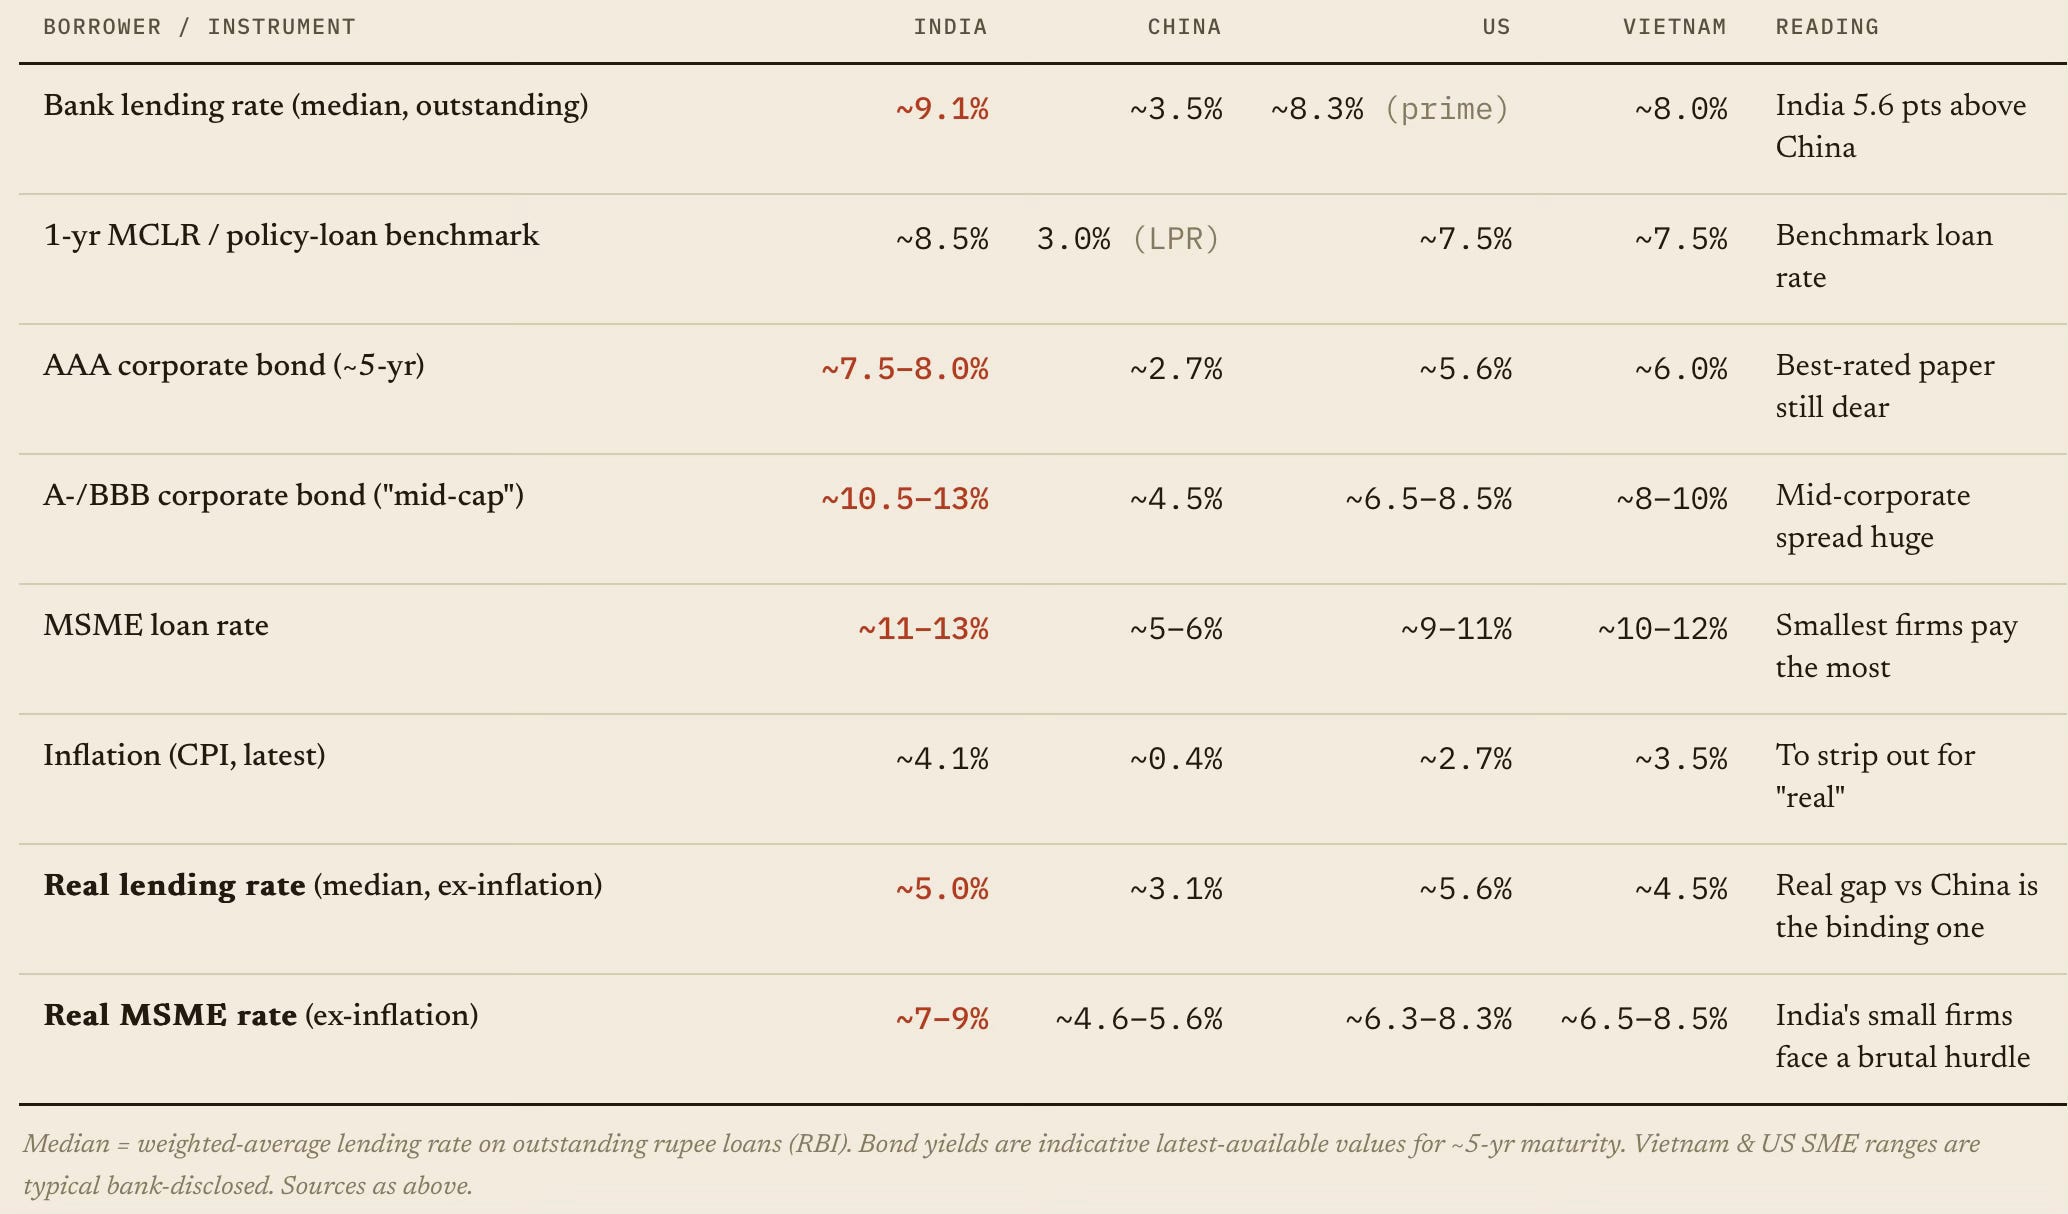
The cost of capital adds to the wedge. The credit-to-GDP ratio measures the availability of capital. The other half of the problem is the price. Indian firms pay materially more than peers - across banks, bonds and the SME segment. In fact, after stripping out inflation, the gap stays large, which is the more realistic measure of whether real investment can clear its hurdle rate.

The capital markets are no different. An Indian mid-cap pays roughly 2–3 times the bond yield a Chinese mid-cap pays and ~50% more than a US one, in nominal terms. After inflation, the gap narrows but doesn't vanish. India's real lending rate (~5%) is ~2 percentage points above China's, and the real MSME rate is among the world's highest. Combined with credit availability stuck at 55% of GDP, this means Indian firms, and especially the missing middle, face the worst combination of dear and scarce capital among large economies.

Let’s dig a bit deeper into the capital cost wedge. 

Econ 101 informed that the high cost of capital is a reflection of the demand-supply mismatch. On the demand side, as we have seen, the high land valuations are encouraging resource misallocation. What about the supply side?

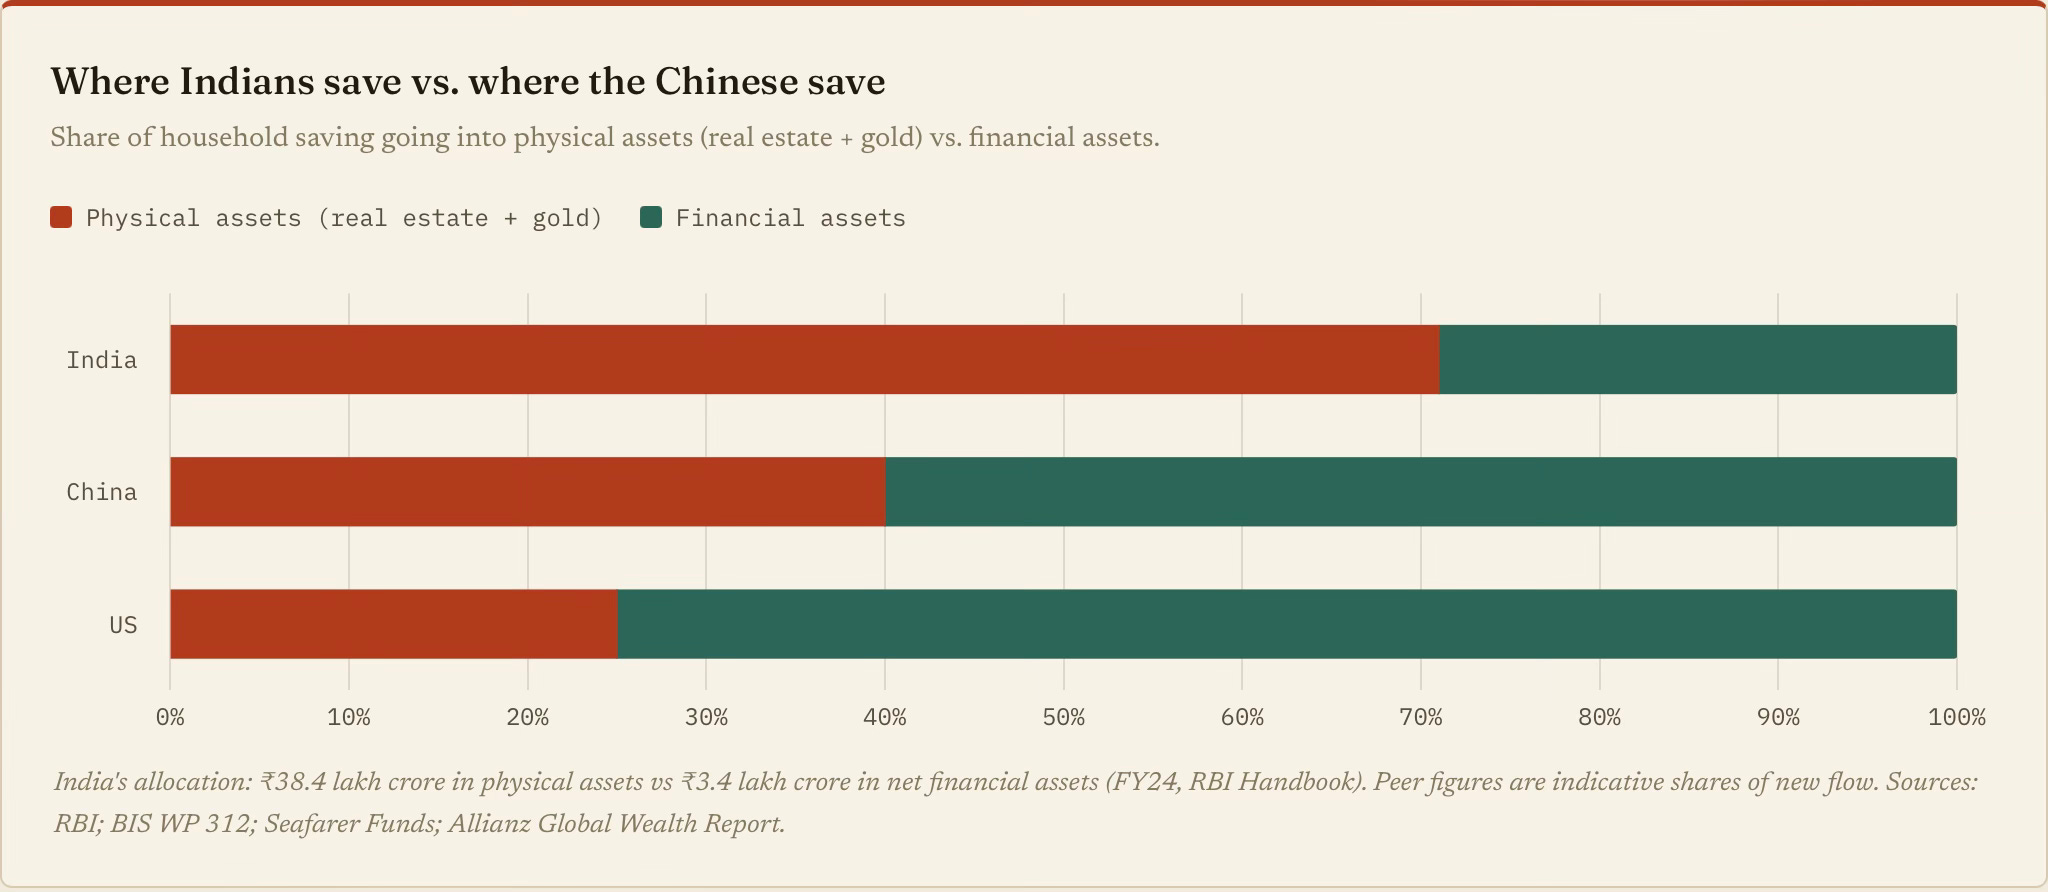
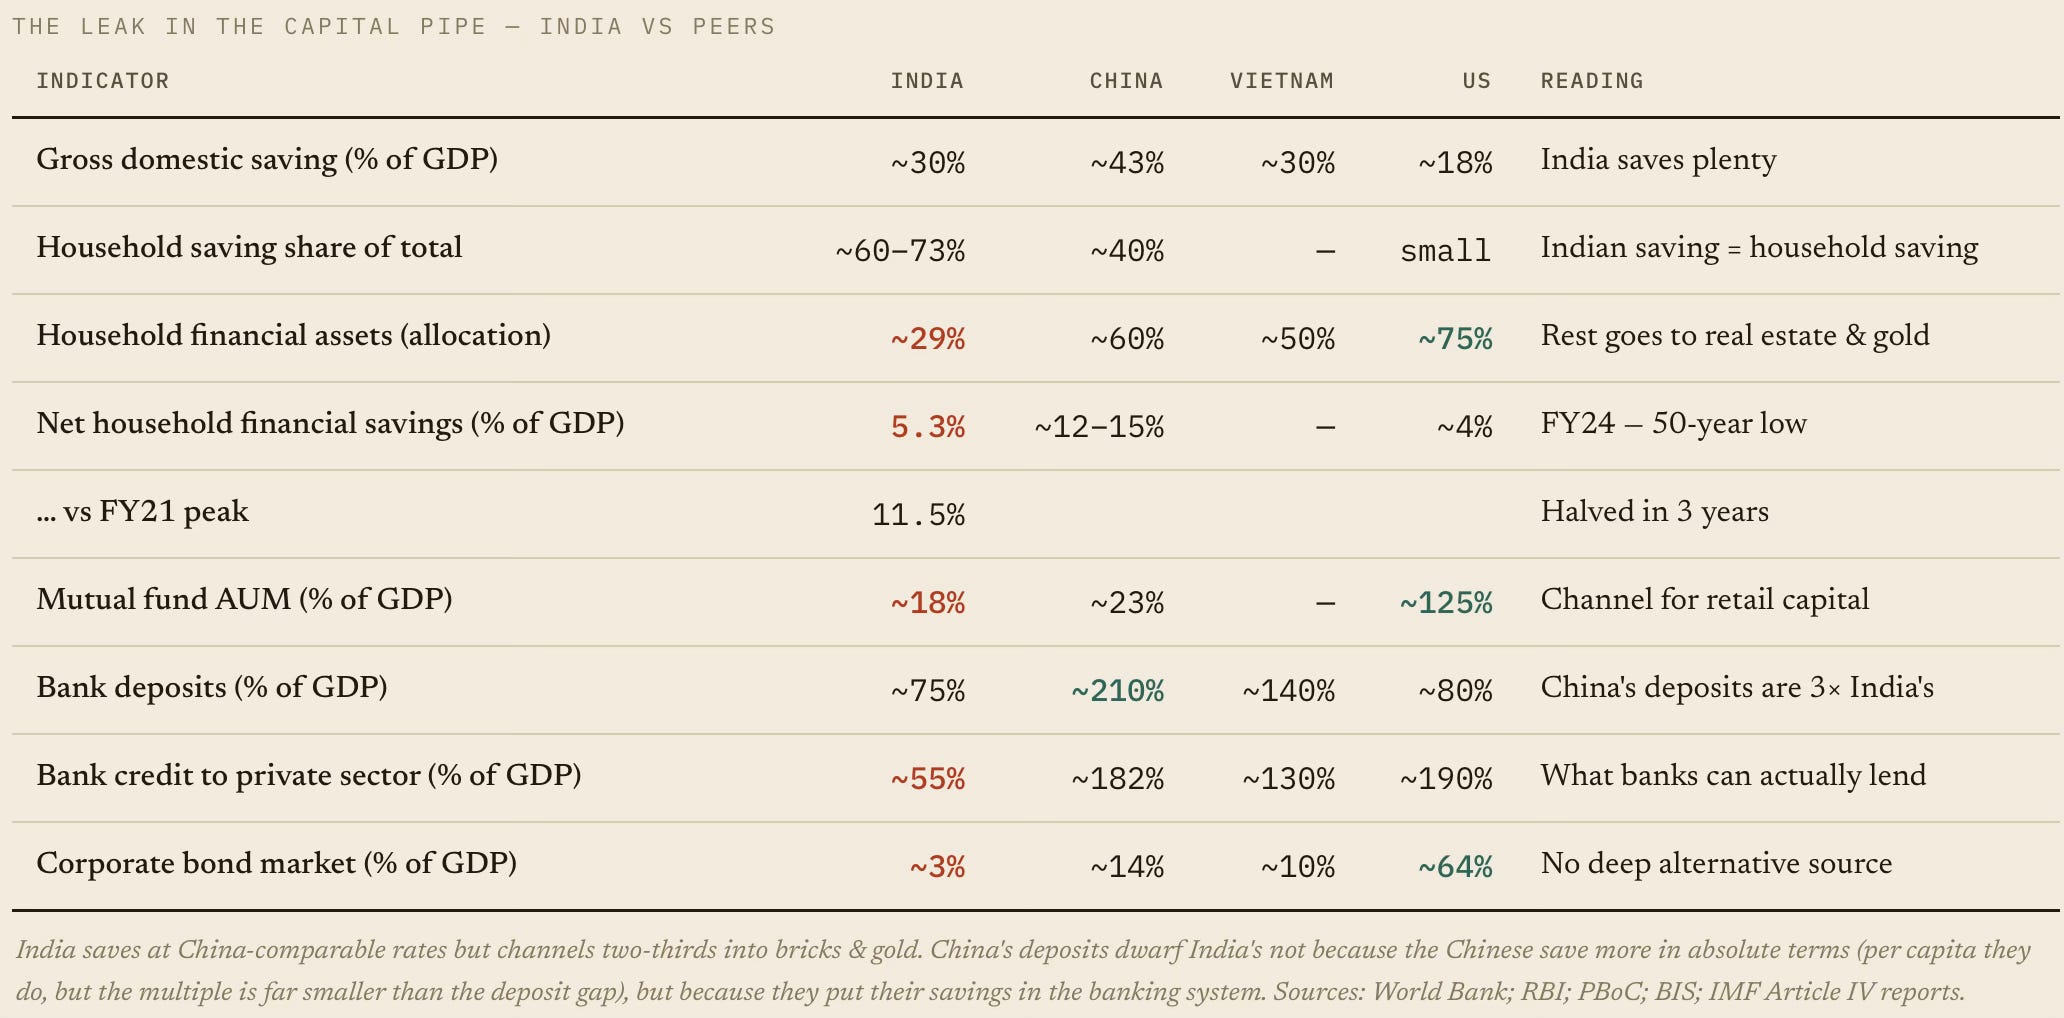
The country’s reasonable gross domestic savings rate (~30%) conceals a disproportionately high share of illiquid assets. When 77% of wealth sits in physical assets (land and gold), and only ₹40 for every ₹100 of household financial savings reaches the financial system, the banks have less to lend, the bond market stays thin, and the price of credit rises. 

In other words, there’s a link between the land and capital problems facing the economy. The causal chain goes something like this - physical-asset preference (land + gold) → low household financial savings (5.3% of GDP) → shallow bank deposits & bond market → low credit-to-GDP (55%) → dear capital (~9% vs ~3.5% in China). The same wealth-allocation pattern that raises land prices also raises the cost of capital. It is one mechanism, not two.

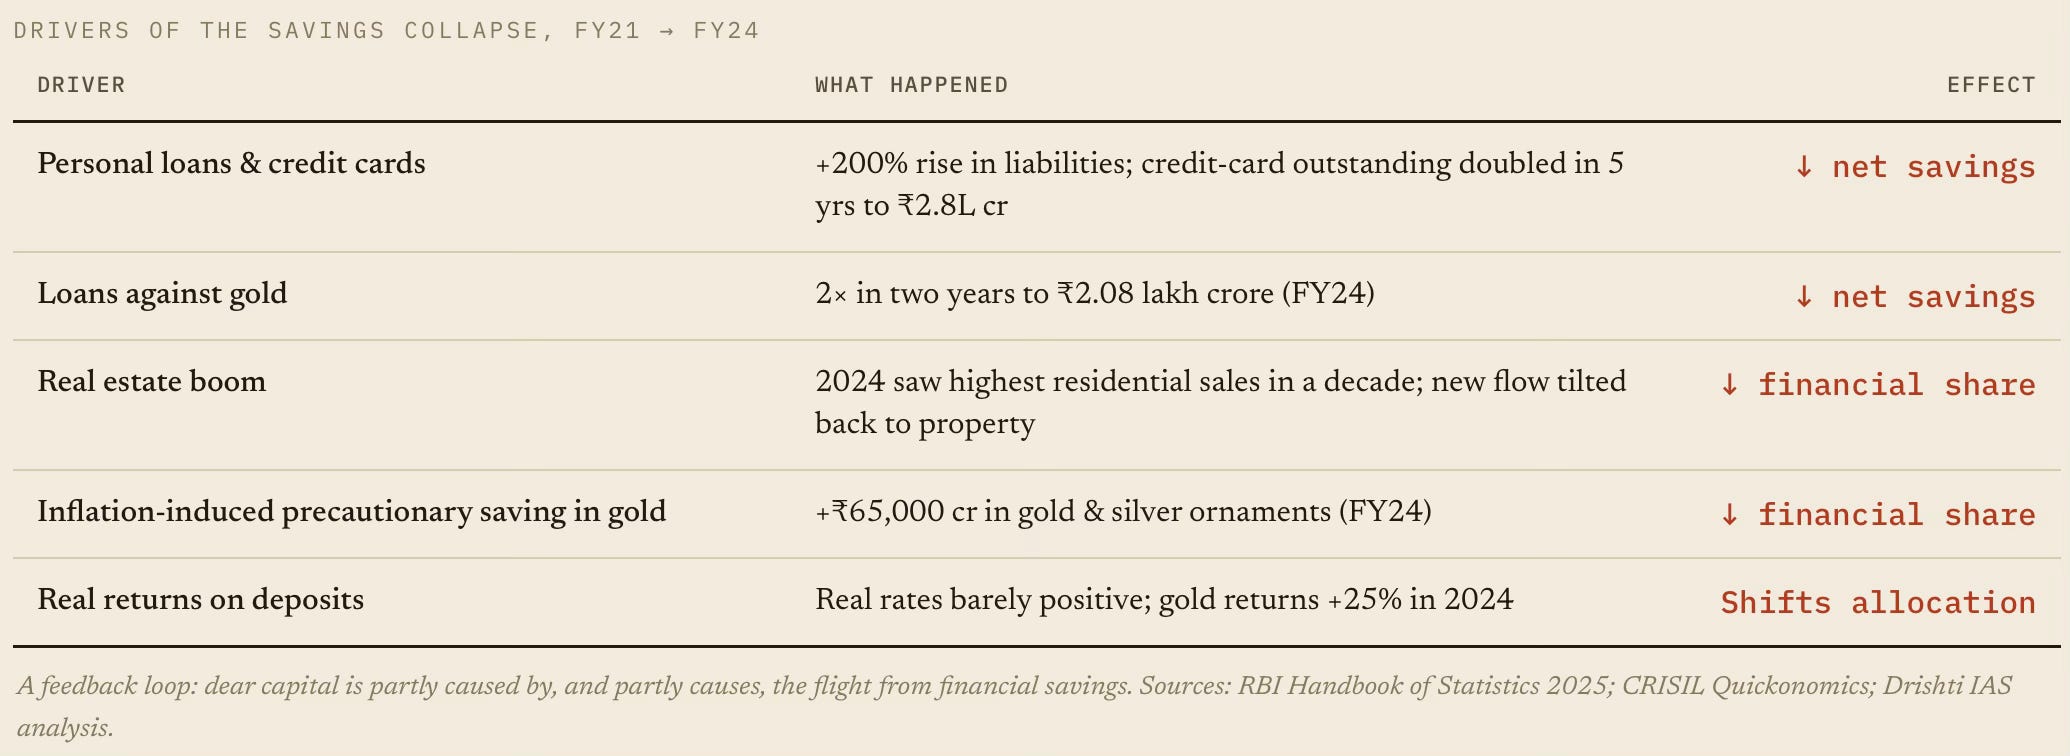
Worsening matters, the net household financial savings fell from ~11.5% of GDP in FY21 to 5.3% in FY24, a 50-year low. The table below breaks down how the cost wedge feeds itself. Households are borrowing more (against assets), and routing more new savings back into physical assets

The cost constraints impact the economy in two ways. One, it restrains private investment. Second, it weakens global competitiveness and hurts exports. 

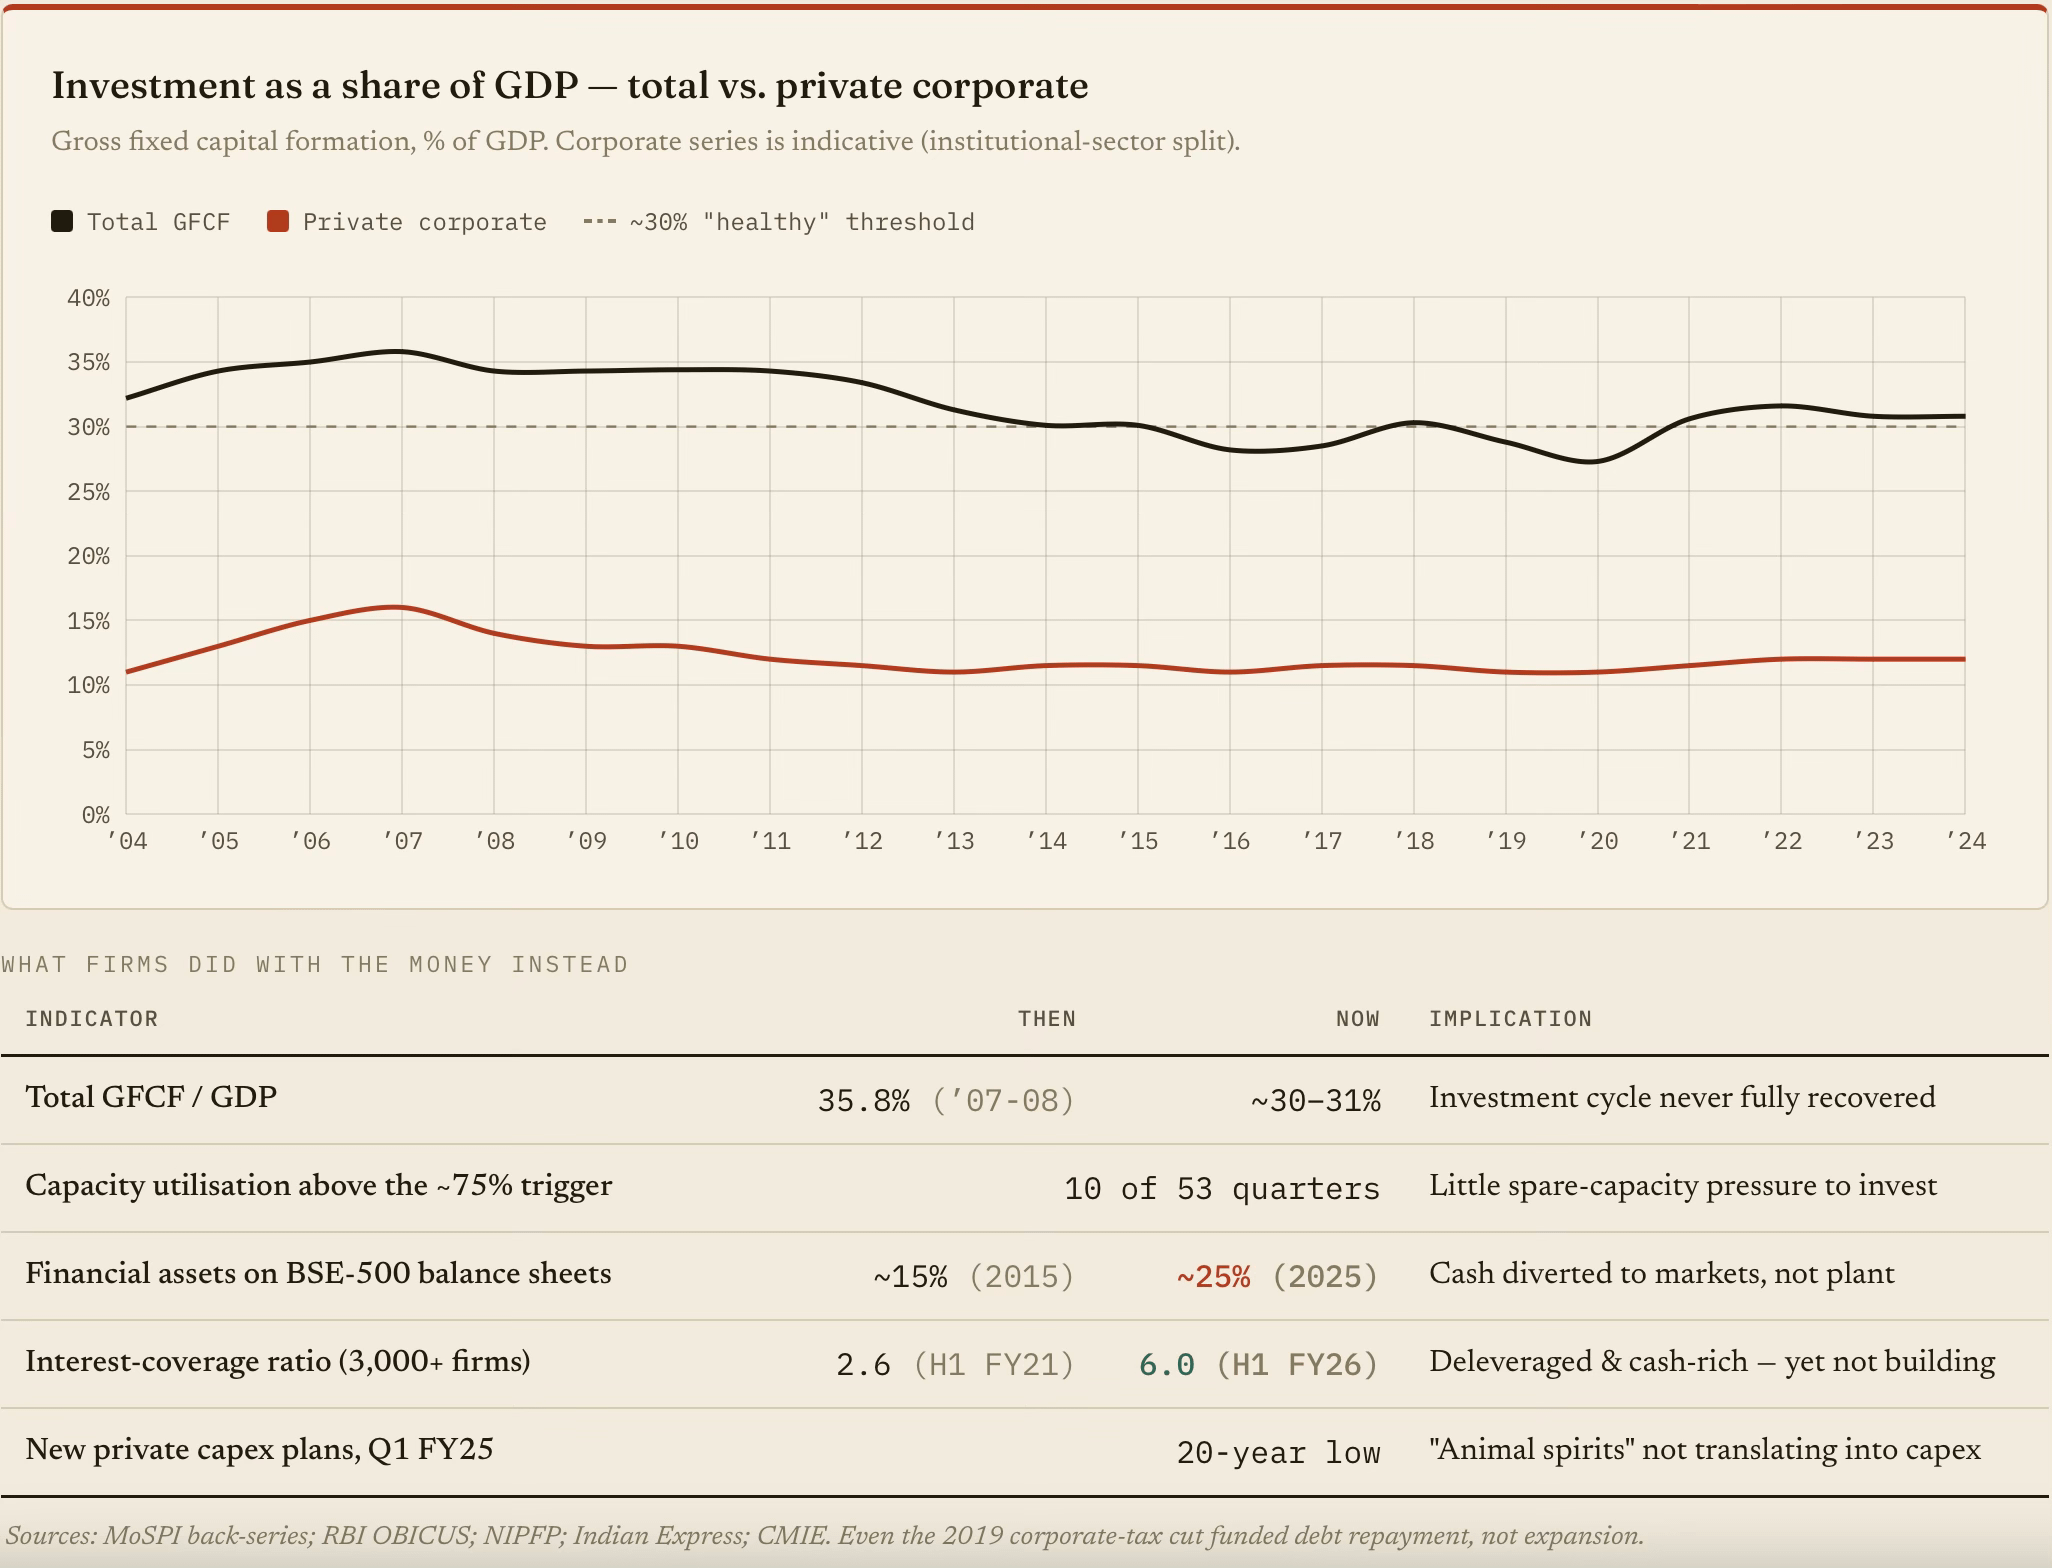
Take the first. Overall investment slid from a 35.8% peak in 2007-08. Public capex has since surged, but private corporate investment never recovered, flat near 11-12% of GDP. Flush with cash, firms deleveraged and bought financial assets instead of building capacity. I blogged here on this. 

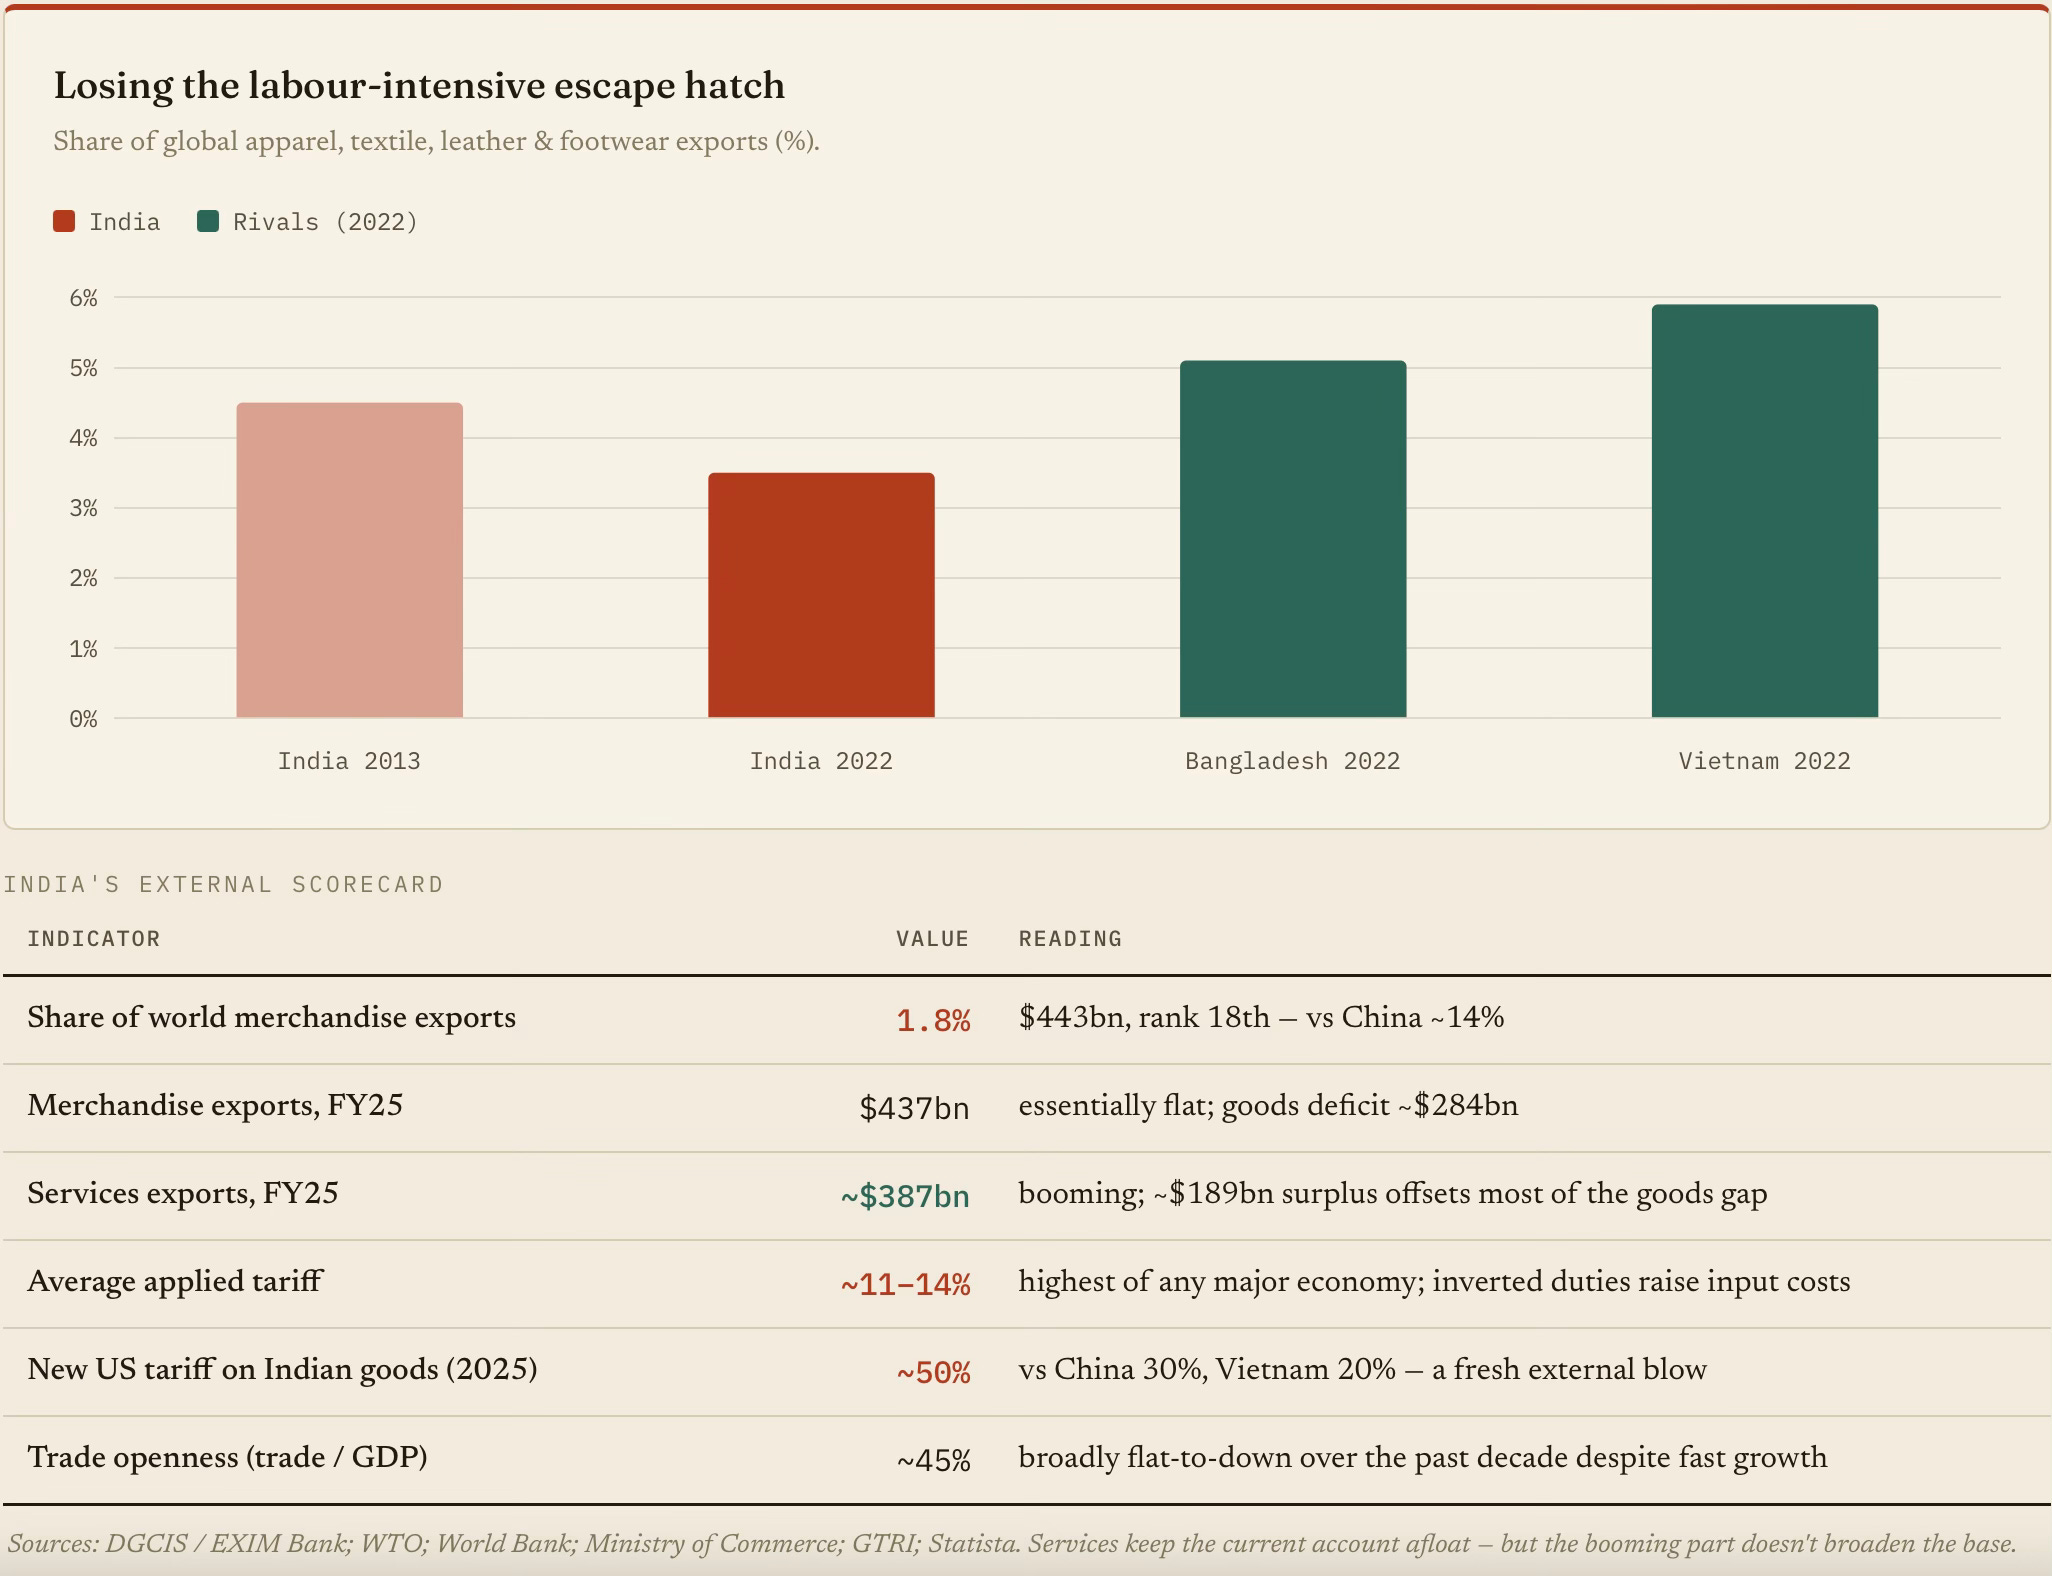
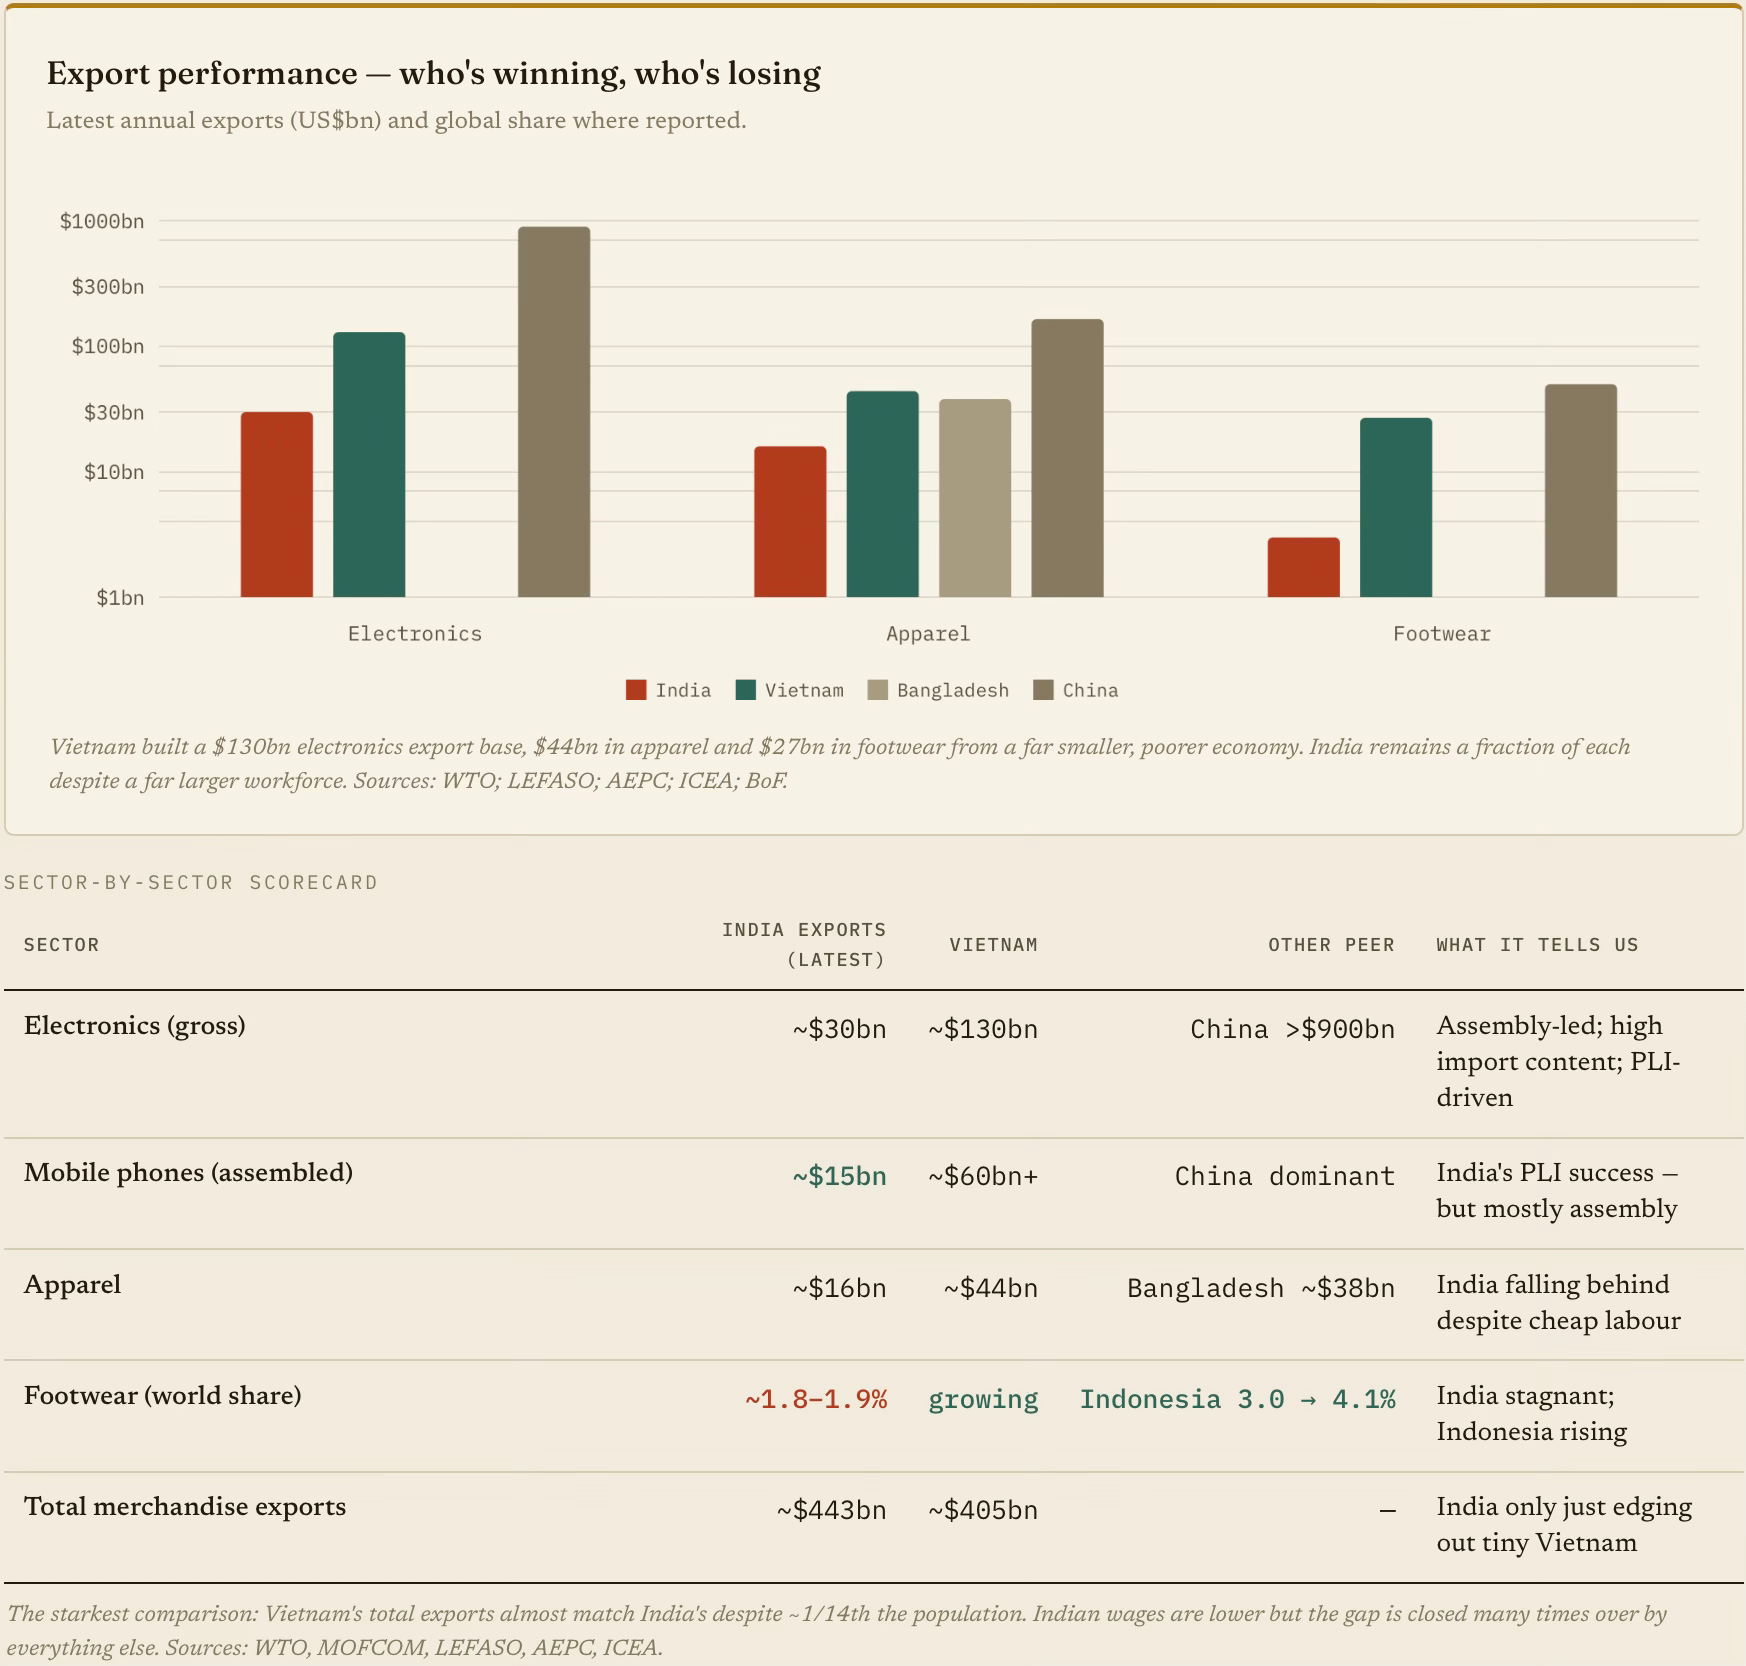
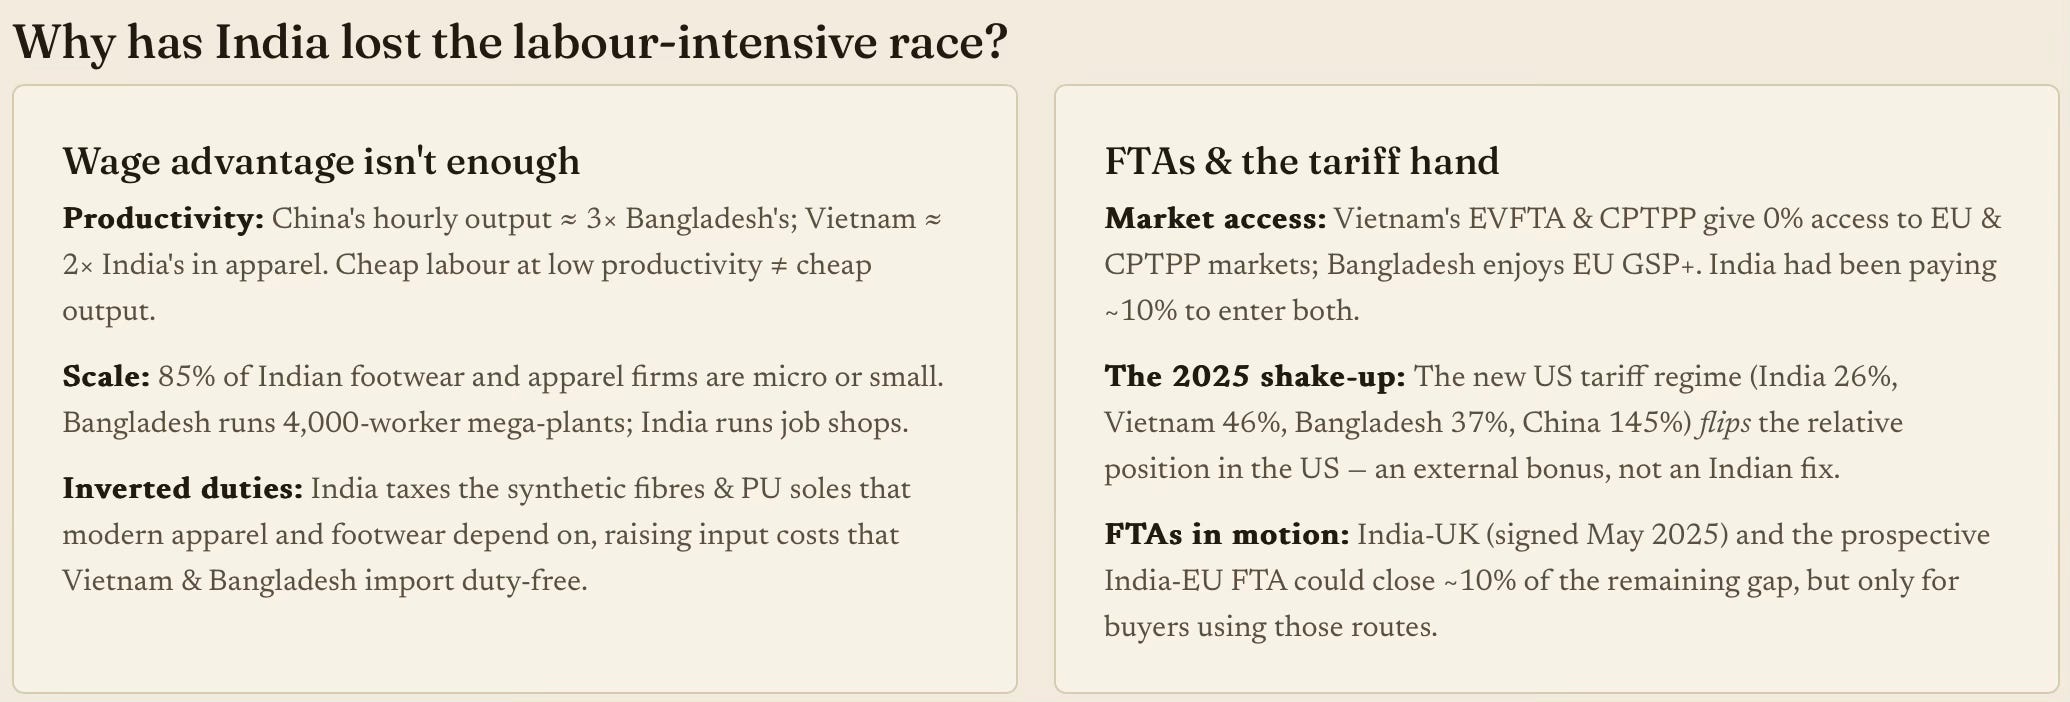
The East Asian economies found exports to rich countries as the outlet to overcome thin domestic demand and drive economic growth. Unfortunately, in India’s case, this is exactly the outlet that the cost wedge closes: dear capital, costly logistics, unreliable power and the world's highest tariff walls all erode competitiveness. The result is that India is losing its share of labour-intensive exports to Vietnam and Bangladesh , even as its overall merchandise share stalls near 1.8%.

In fact, the Economic Survey 2016-17 chapter Clothes & Shoes: Can India Reclaim Low-Skill Manufacturing? warned that the space China vacated was being taken by Bangladesh and Vietnam in apparel, and Vietnam and Indonesia in leather and footwear. A decade later, the warning could not have been more prophetic. 

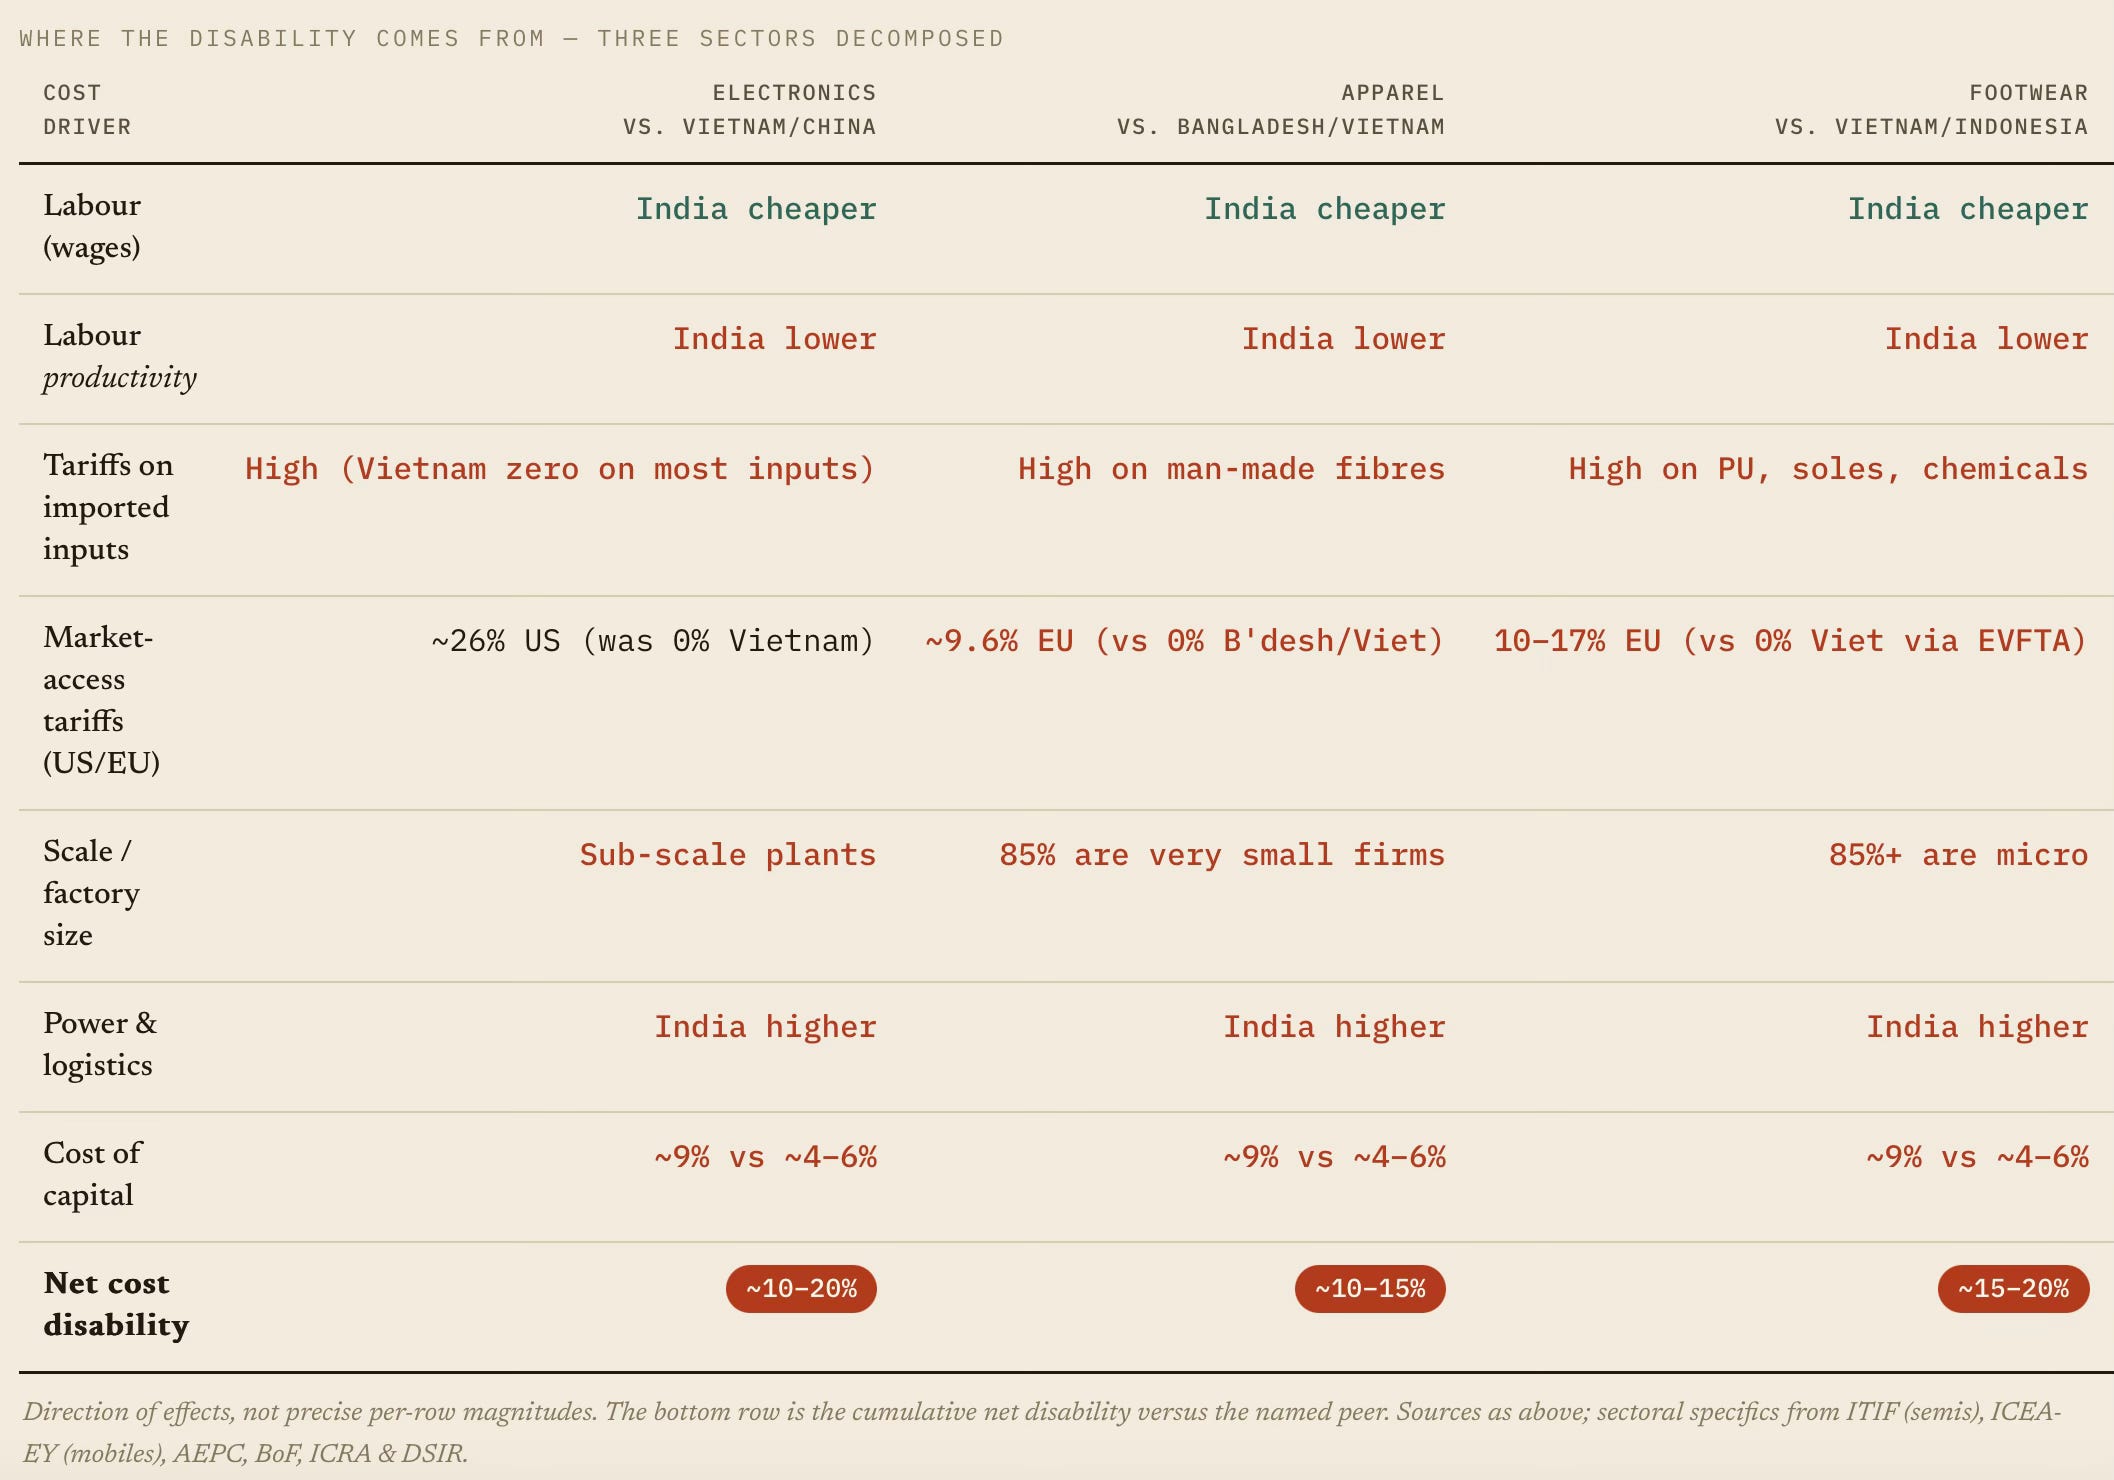
In the net, India wins on wages (~$2.1/hour) but loses on net cost. So the disability is entirely from non-wage factors: capital, power, logistics, scale, tariffs on inputs, and productivity. India has a cost structure that is comparable to that of a developed country. That's the central analytical point.

India enters every labour-intensive sector with the world's cheapest workers and exits with a 10–20% cost disability. This is proof that wages aren't the binding constraint. The wedge comes from the rest - scale, input tariffs, capital, power, logistics and productivity, in a market structure that punishes the firms that should be growing. This is why India hasn't replaced China, where Vietnam and Bangladesh have, despite the structural opportunity being identical for all three.

Indian businesses (and especially manufacturers) face a structural cost constraint. It does not have to do with taxation or wages, but with factors like land, power, fuel, cost of capital, input tariffs, labour productivity, and business size/scale. A disproportionate attention and effort go into taxation reforms instead of these more important structural limiting factors.