Substack

Showing posts with label private sector. Show all posts

Wednesday, June 24, 2026

Comparing the R&D expenditures by Indian firms and their global peers

This blog has been a consistent critic of corporate India’s reluctance to invest in R&D. With the emergence of AI applications that are disrupting software development, the big Indian IT companies have been criticised for their low R&D expenditures. There has been a slew of commentary in recent days bemoaning India’s deficient private sector R&D spending and urging corporate India to embrace innovation. See thisthisthis, and this

This blog has argued that the nature of India’s market, with its price-sensitive customers and small premium market segments, may not allow Indian firms the cash flow cushion required to invest in R&D. Others have pointed to cultural and other factors as being responsible. There are problems with each of these lines of reasoning. 

I used Claude and analysed the annual accounts and statements for the last five years of the 3-4 top Indian companies and their like-to-like peers in Europe, Northeast Asia, and the US on revenues, profits, margins, and R&D expenditures across eight industries. Specifically, how do the sizes (by turnover) of the median Indian companies and their peers compare? How do they compare on PAT margins and R&D as a share of revenues?

The headline takeaway is that Indian companies tend to be more profitable than mature Western peers (services, autos, pharma, telecom) but smaller in scale and far less R&D-intensive than the global leaders in product/innovation-driven sectors (consumer electronics, software products, EMS modules, speciality chemicals). 

While it confirms the low R&D spending of Indian companies, it also points to a more nuanced narrative. While Indian companies are much smaller than their global peers, they are either the leaders or are at the top in profitability.

Let’s examine the headline findings.

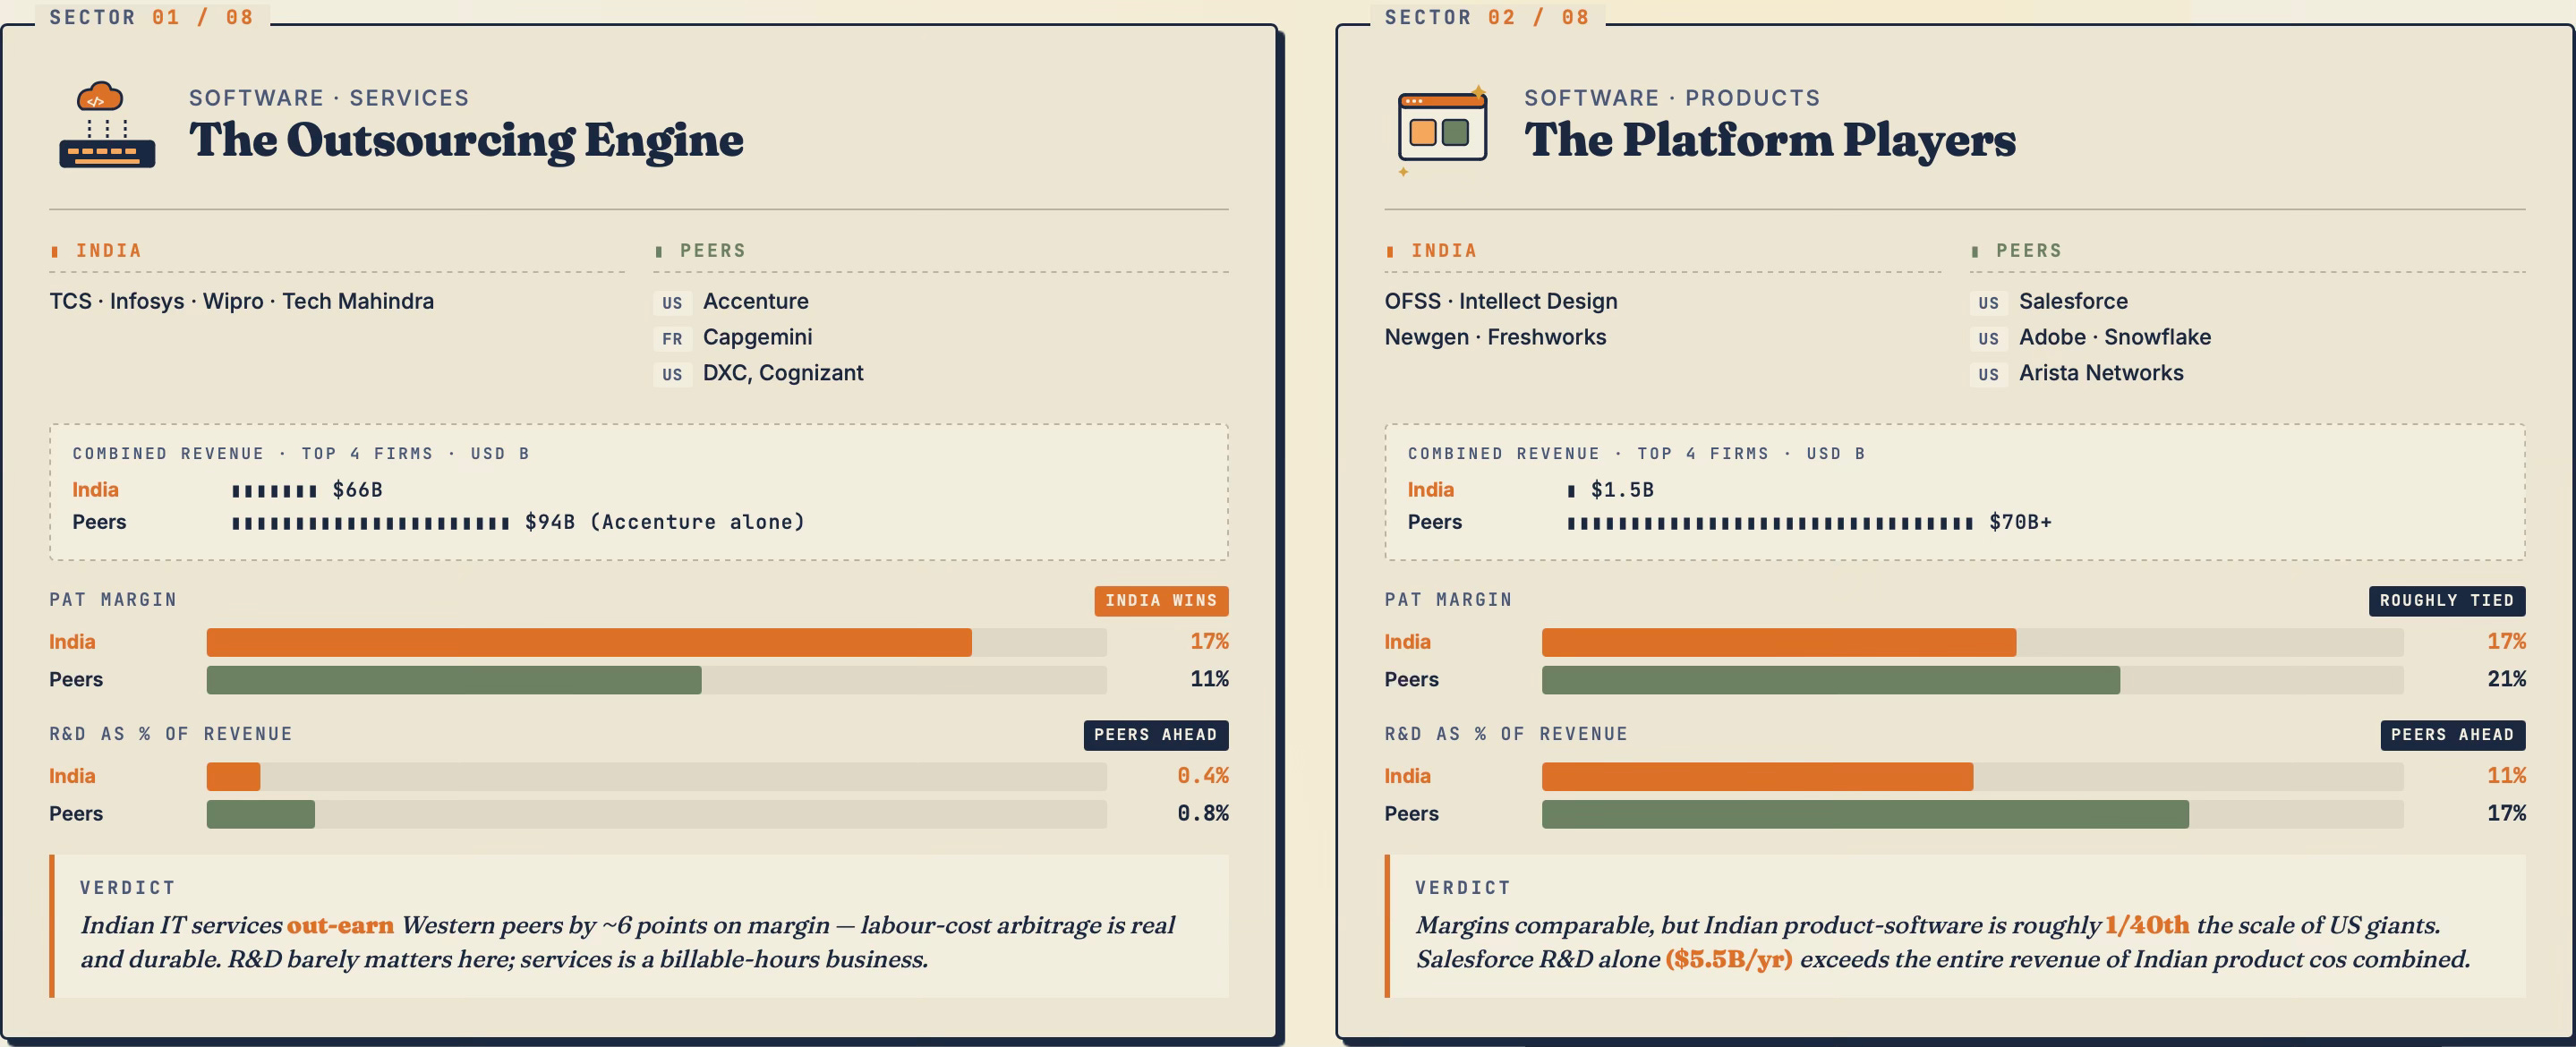
The big IT consulting/services firms are the main targets of the growing chorus of criticism in the mainstream media on the lack of dynamism and low R&D spending. It is worth noting that while Indian software service firms have margins that are significantly higher than their peers (arising not from any innovation or efficiencies but from the labour-cost arbitrage), their R&D spending lags. The R&D as a percentage of revenue runs 0.3-0.5% at Indian firms vs 0.8-1.0% at say, Accenture, a 2-3 multiple gap. Further, while the R&D spending shares of the likes of Accenture have been rising, those of the Indian firms have been stagnant or even declining (Infosys) in recent years. 

Also, the R&D expenditures of the big software service firms in the US do not include the significant amounts spent on acquisitions each year. For example, Accenture deploys $2-5bn annually in 30-40 acquisitions per year, many in AI specialities (data engineering, vertical-domain AI, ML platforms), whereas the largest Indian firms do 2-5 acquisitions per year, usually smaller and more conservatively-priced. Accenture treats acquisition as a substitute for internal R&D, while Indian firms treat it as a supplement to organic build-out. The cumulative effect is that Accenture has accumulated dozens of niche AI consulting practices acquired pre-2024, whereas Indian firms have built mostly organically and more slowly.

However, it must also be said that some of the criticism also reflects a tendency to conflate what is an inherently low R&D industry with the R&D-intensive product-focused Big Tech and AI firms. IT services have never been an innovation-focused industry. Further, compared to several other industries (as we shall see), the R&D spending of Indian IT services firms is not that far behind their Western peers. 

While Indian software product firms hold up on margins, they too lag on R&D. The 5-6 percentage-point gap between US and Indian product company R&D spending is the closest real number to “the innovation gap” people often talk about. On size, if you take out OFSS, which is a subsidiary of Oracle, there is no Indian company with even $300 million in revenues. The four Indian product companies combined generate ~$1.5 bn in revenue. Salesforce alone does $38 bn. Adobe does $21 bn. They are dwarfs to their global peers. This is the real software industry gap. 
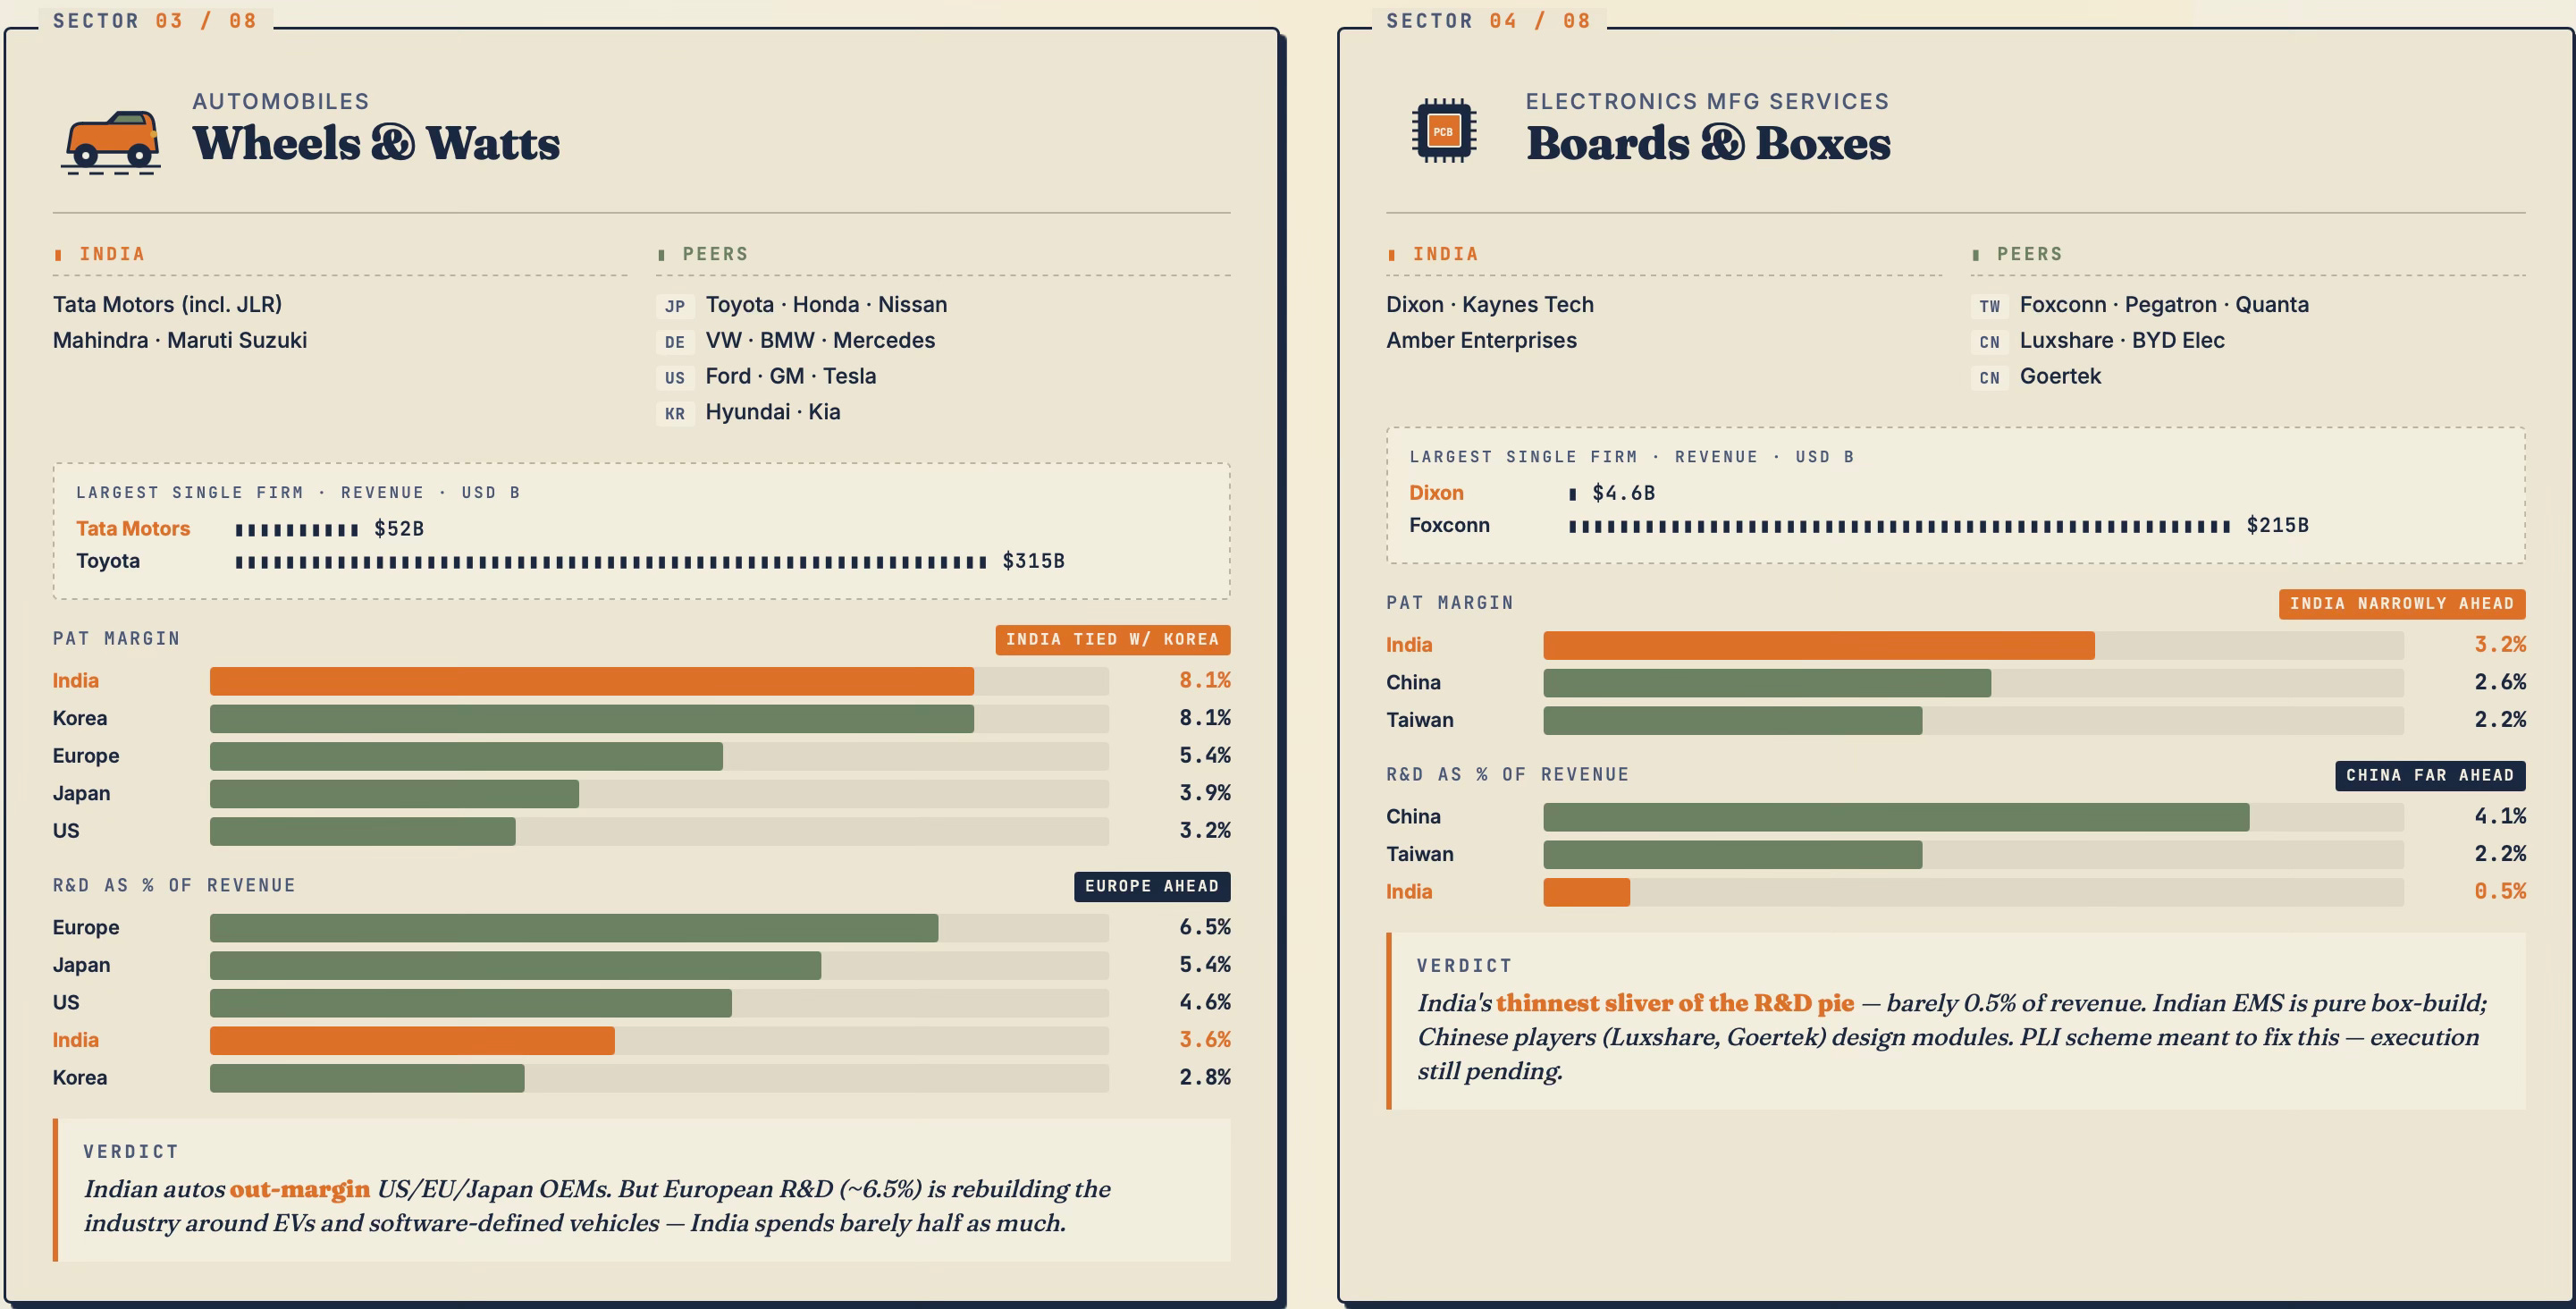
In the automobile industry, Indian OEMs outperform their global peers on profitability. The R&D intensity at 3.6% is half of Europe's but comparable to Japan and the US. This conceals the fact that, despite being in the business for decades, the big Indian OEMs continue to depend on foreign designers and engines. They have been comfortable doing business by licensing technology and importing engines. Further, where India really lags is in the frontier technologies like batteries and electric vehicles. All these point to an ambition or aspiration gap. 

Indian EMS profitability is again slightly better than that of Chinese and Taiwanese, but the R&D gap is the starkest in the entire analysis. Indian EMS spends 0.5% of revenue on R&D vs Chinese 4.1% vs Taiwanese 2.2%. Indian players are doing pure box-build assembly, whereas the Chinese players are designing modules. This is the value-capture gap. This is an area where the market is at the cusp of a massive expansion, and it is disappointing that Indian EMS’s have not sought to move up the value chain despite the promising opportunities that they face. 
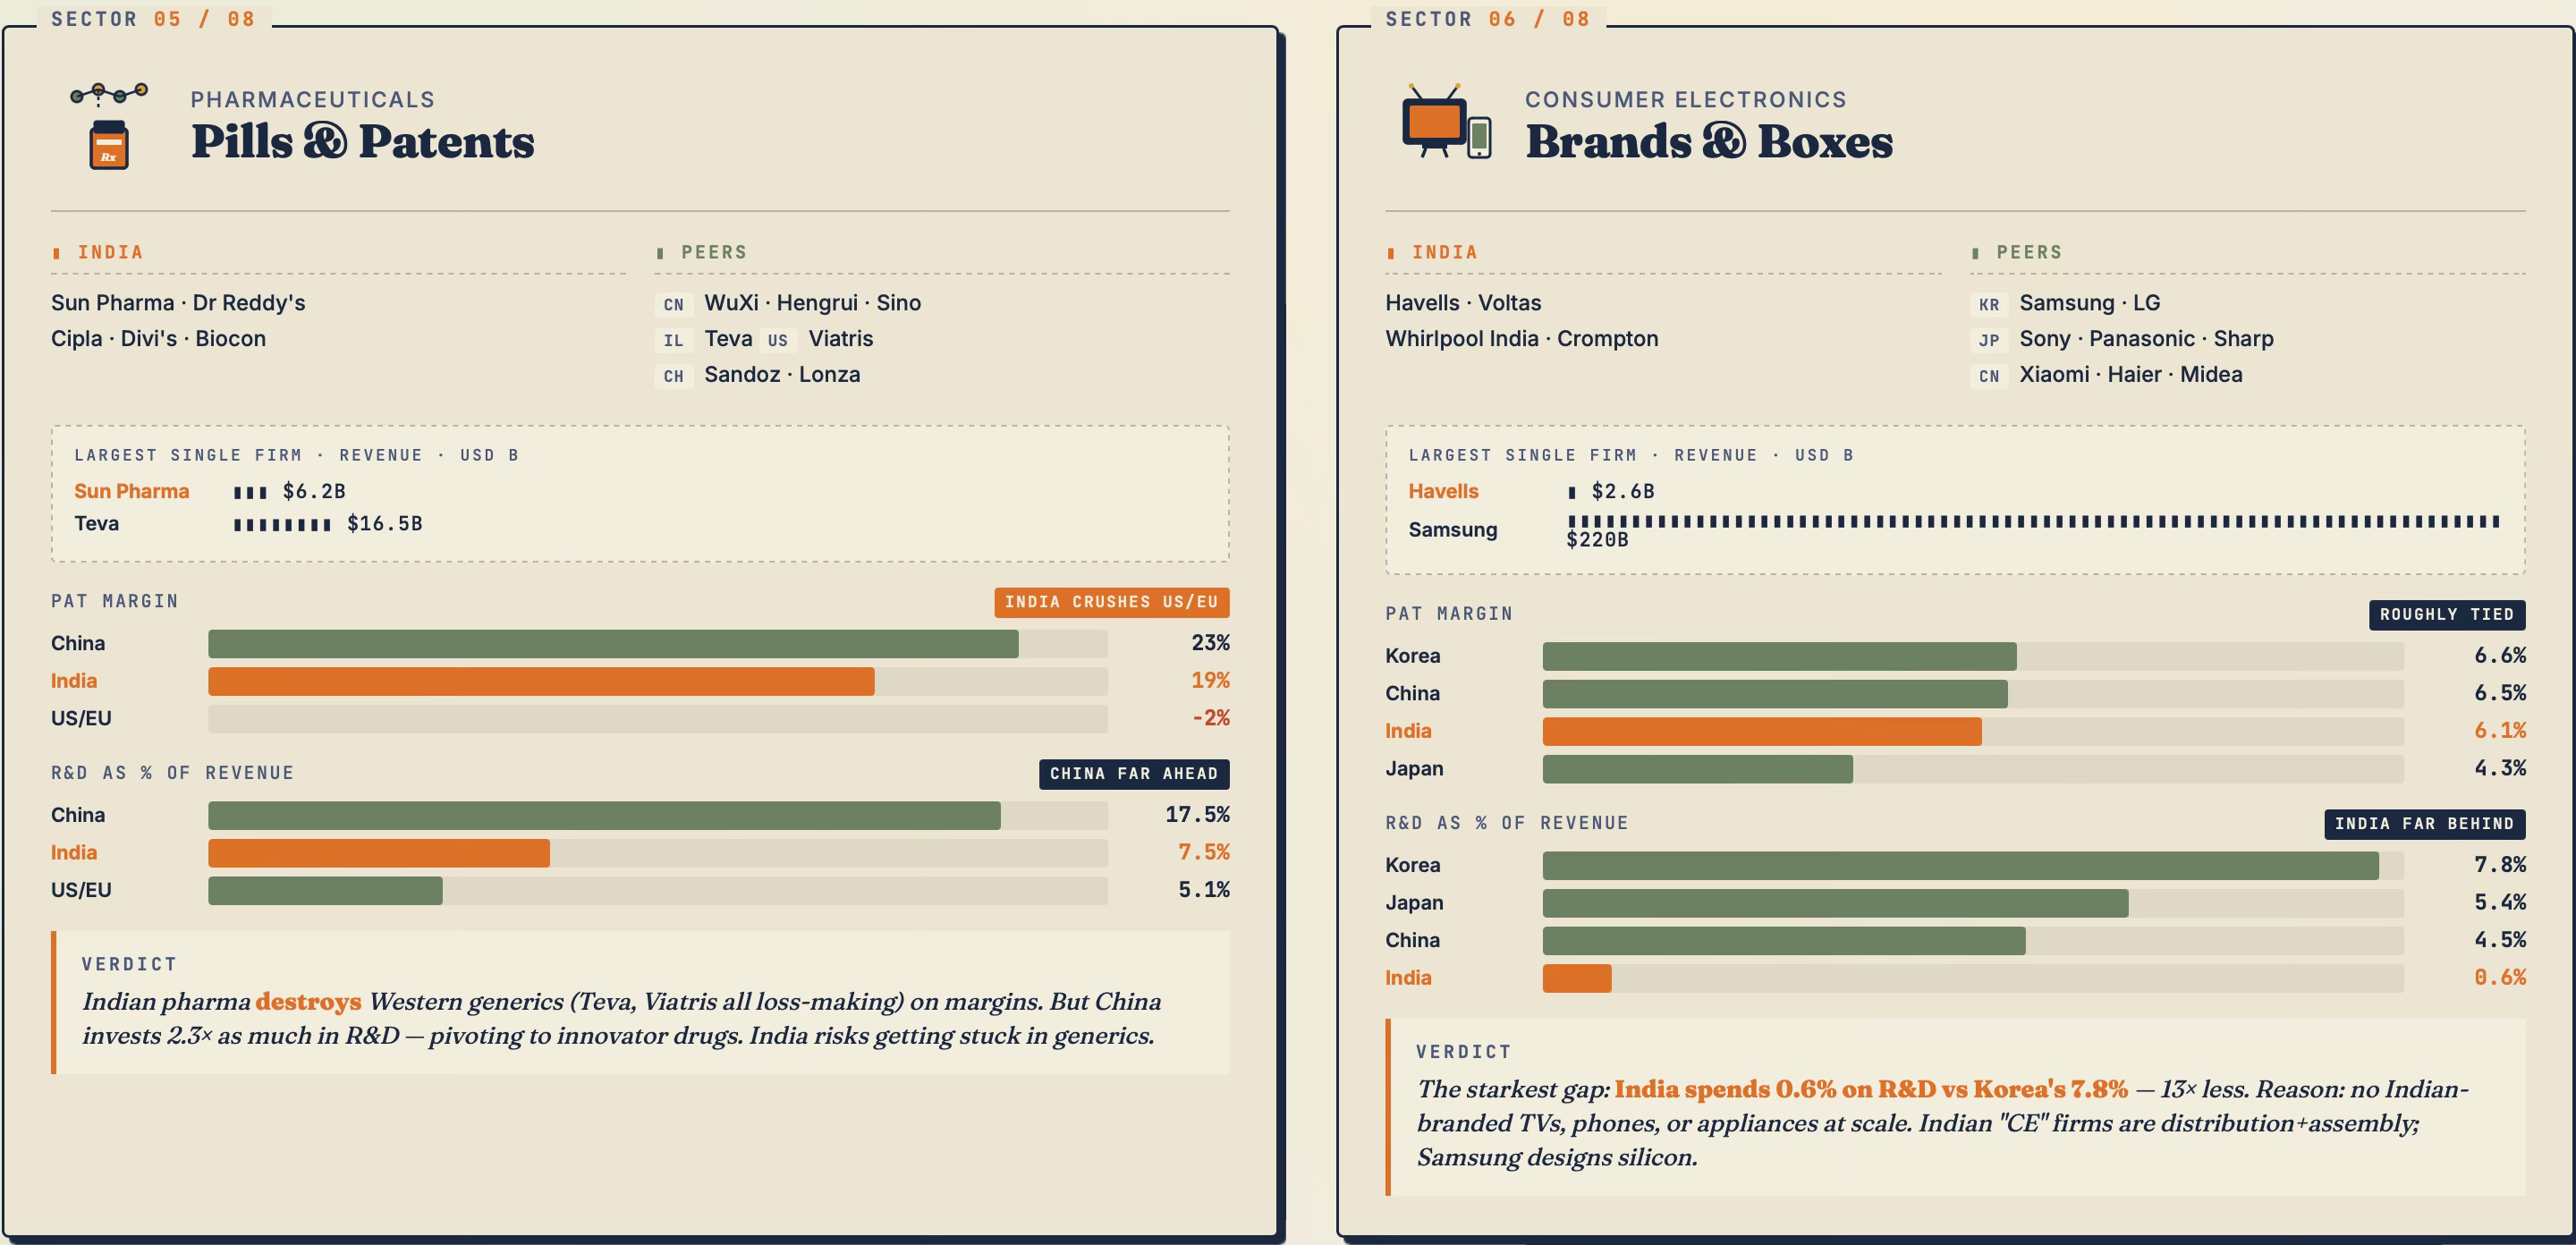
Indian pharma companies fare better than their software counterparts in both margins and R&D spending compared to their Western peers. Here, however, the Chinese are far ahead. Chinese pharma R&D intensity (17.5%) is more than double Indian (7.5%), with Hengrui, Sino Biopharm aggressively pivoting to innovator drugs. India's generics-and-biosimilars model is very profitable today but less R&D-intensive, raising the question of where margins go in 5 years.

The consumer electronics industry must count as one of the biggest disappointments. There is essentially no Indian consumer electronics industry comparable to its global peers. Even the biggest Indian firms are tiny when compared to their global peers. Indian companies (Havells, Voltas, Whirlpool India, Crompton) are appliance brands relying on outsourced electronics, explaining the 0.6% R&D figure compared to Korea's 7.8% or Japan's 5.4%. No Indian brand has any comparable R&D capability. Most of what's made in India is for foreign brands (Apple via Foxconn, Samsung via Dixon).
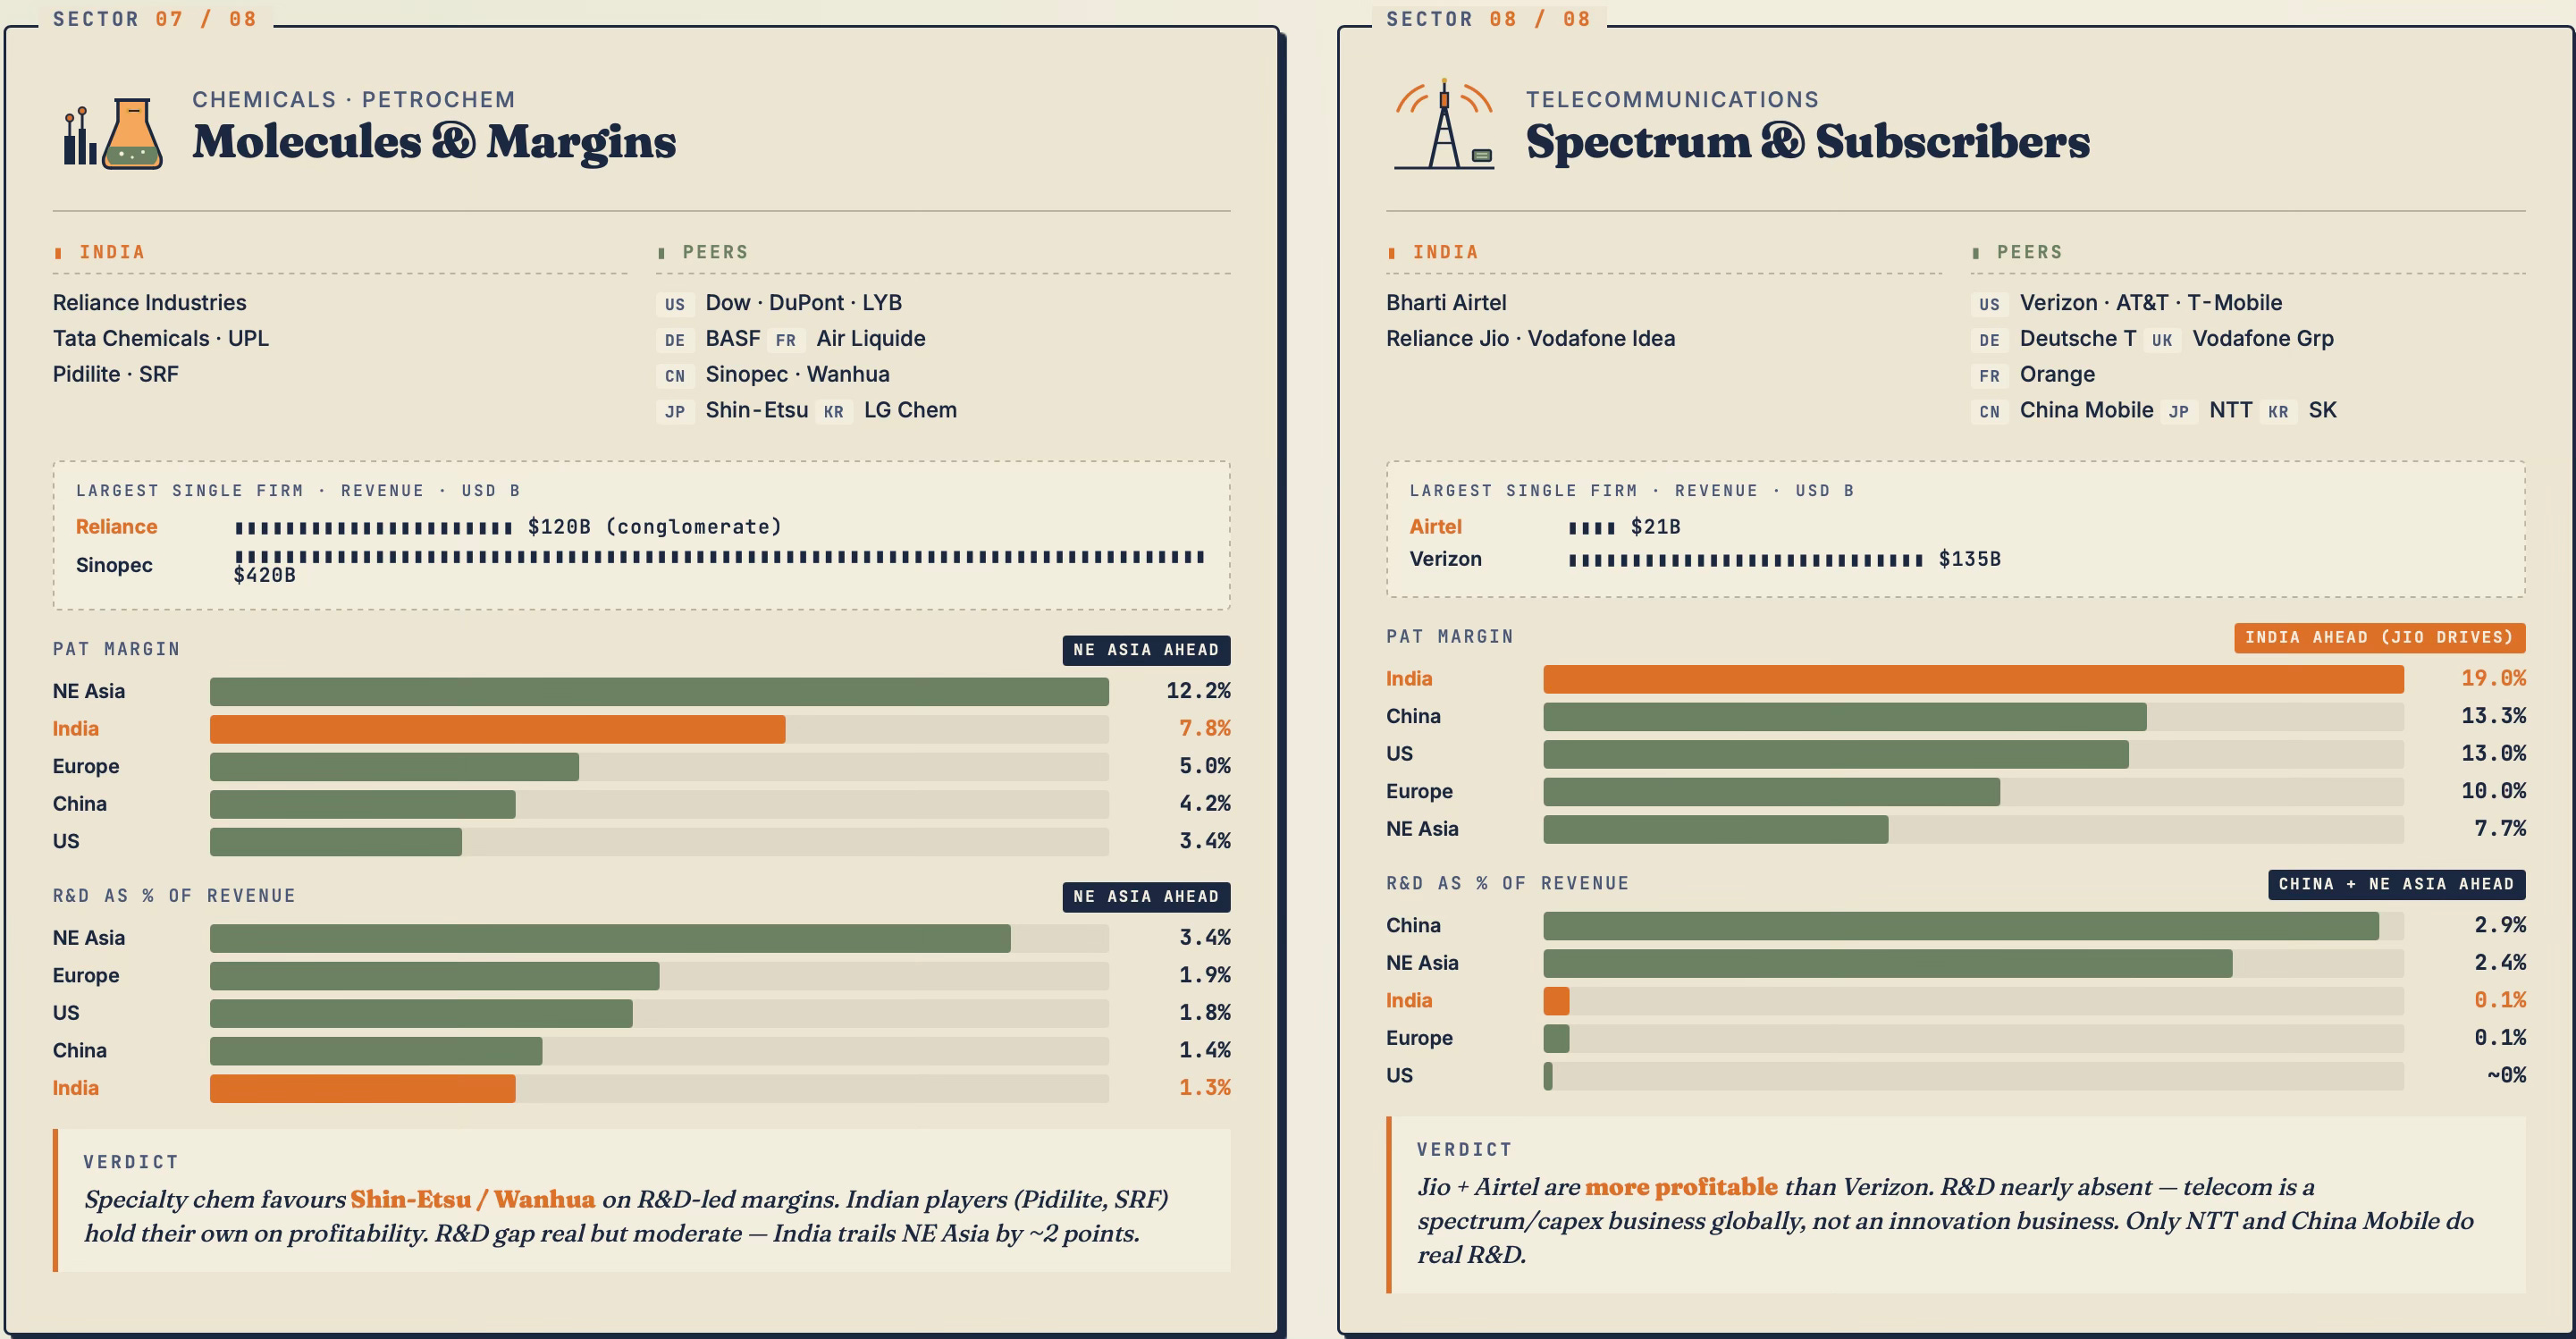
Chemicals is one of India's better stories. While the top Indian firms are large and their margins are second only to Chinese firms, their R&D expenditures again lag. 

On the telecom side, Indian service providers are now the most profitable in the world, driven entirely by Jio and Airtel post-Indus-Towers consolidation. Verizon and AT&T look mediocre by comparison. The R&D number for telecoms is essentially zero everywhere except China Mobile and NTT since telecom is considered a capex/spectrum business, not an R&D business.
So what do all these mean?

The failure to produce even a mid-sized IT product firm, even after five decades of being a leader in the software services industry, is more an indictment of India’s entrepreneurship than of the IT services firms themselves. The IT product industry has had several favourable factors confluencing - the IT services industry produced enough talent and experienced professionals to supply both entrepreneurs and team leaders, there is an abundant low-wage workforce, it does not suffer regulatory failures like an inverted duty structure, high input costs or taxes, and there’s a large global market to serve. But even this combination was not enough to make even a one-billion-dollar IT product firm. 

More than the IT services industry, it is perhaps the Indian pharma industry that is emblematic of the lack of business dynamism and entrepreneurship. The country has had a serious pharma industry, with several large generics manufacturers, for over six decades. Many of the leading firms of today were established by entrepreneurs who worked in the public sector entities. They had the opportunity to move up the value chain by building massive integrated industrial facilities. Even in contract manufacturing, they have remained stuck at the small-molecule synthesis and have struggled to move up the value chain to complex therapeutics and contract research. 

Alongside the software product industry, consumer electronics should perhaps count as corporate India’s biggest failure. India has had a consumer electronics industry for several decades. With a very large market, Indian firms had the opportunity to ride the economic liberalisation, expansion of the middle class, and the global export market. 

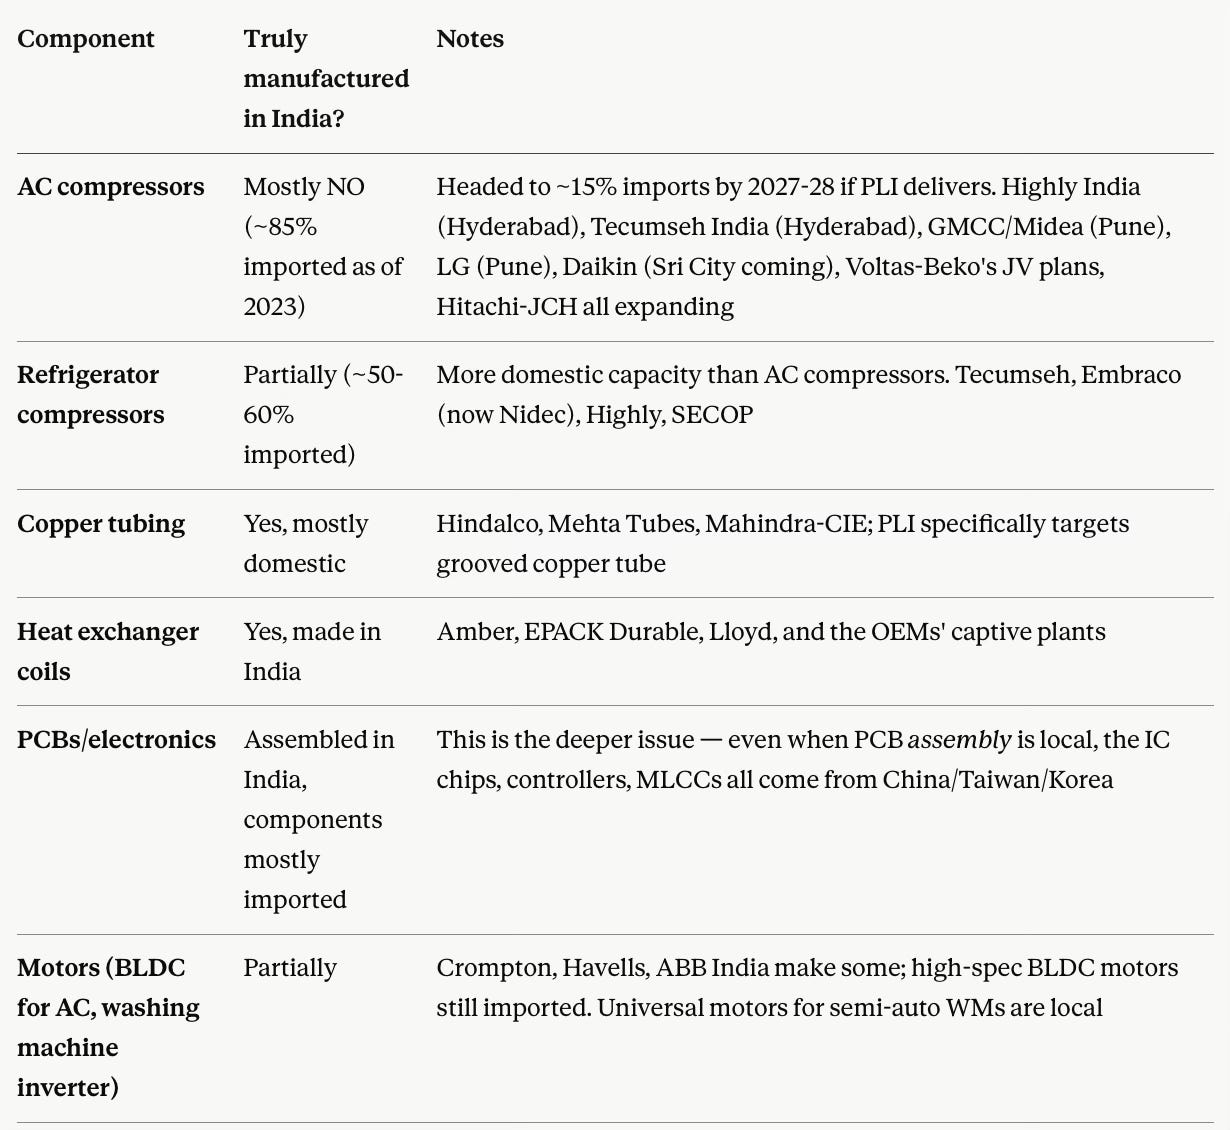
Interestingly, the Korean and Japanese OEMs (LG, Samsung, Daikin, Hitachi) have deeper Indian manufacturing (in terms of value addition in products like refrigerators, air conditioners, and washing machines) than most Indian brands because they invested in component plants in the 2000s-2010s when Indian brands were happy to rebrand imports. 

One structural reason for this difference also points to the lack of ambition and reluctance to pursue the export markets. The Korean and Japanese OEMs treat India as a manufacturing base for both the domestic market and exports (LG exports refrigerators to the Middle East from India; Daikin to Southeast Asia). That export-anchored manufacturing economics justifies deeper component investment. Indian brands have historically been domestic-market-only and saw little case for backward integration when components were cheap to import from China.

It is therefore an unfortunate reality that the vast majority of AC and refrigerator compressors, and higher-end motors (for front-load washing machines) are imported. 
The above analysis points to a corporate world that is stuck in a comfort zone, reluctant to assume risks by trying to move up the value chain or push aggressively into the next generation of products or technologies. There is a strong preference to stay on the sidelines and wait for technologies and products to emerge elsewhere. I’m not sure whether there is even one industry where Indian firms have been pioneers in showing the way with the next generation of products. Across industries, they always follow the trends in developed markets by copying and imitating. 

The large captive market (domestic and foreign) is considered a safe enough moat (thanks to a combination of price-sensitive customers and import protections) that would allow these firms to grow for a long time to come. There is little incentive (apart from inclination) to explore and expand beyond this comfort zone. 

In a globalised market, across industries, competitiveness is critically dependent on continuously moving up the value chain. It is a treadmill where, like the Red Queen, firms must run hard to retain their global competitiveness. And Indian firms, across industries, have shown consistent reluctance on this. It points to a problem of what I have described earlier as an entrepreneurship deficit.

With this entrepreneurship deficit comes a low risk appetite. This reflects in the reluctance to deploy capital. Moving up the value chain and expanding to foreign markets, essential requirements to becoming globally competitive, demand assuming significant risks by making large capital investments with long-term bets. These investments would also include cultivating supplier ecosystems, funding and nurturing startups, and long-term partnerships in general. Indian firms, especially the largest ones, have shown great reluctance to assume the risks and make these investments.

The reluctance to invest despite the consistently high margins across industries may be a symptom of the entrepreneurship deficit. As we have observed, firms are satisfied with their domestic markets and have limited or no appetite to expand into export markets. Further, the tepid growth of the domestic market (a reflection of the low aggregate demand growth, in turn a reflection of the narrow base of the consumption class) also discourages significant investments. All this manifests in a preference for short-term gains and avoidance of long-term competitiveness. 

This is a nice summary of the motivations driving Indian firms.

India has a large domestic market, and the economy is growing at 6–7%. So, you can bring what has worked elsewhere, deploy it in the market, and make a lot of money. It’s less risky. That’s what corporates have been doing. It’s the cycle of development. But when you want to compete internationally, you need to think about your own ideas.

Another reason to invest more and pursue export markets is to increase size. As the analysis shows, even the largest Indian firms across the eight sectors are small compared to their global peers. Despite being more profitable than their global peers, their much smaller size is an important obstacle to global competitiveness. 

The argument that government policies have been a binding constraint is not convincing. For one, the software industry, despite largely serving the global market and not being significantly constrained by public policy, did not produce any product firm or product of note despite several technological trends sweeping the industry in the last three decades. Second, even among the leaders in different industries, there has been little appetite to move up the value chain, expand into global markets or pursue new generation technologies and products. Third, even in localising manufacturing by nurturing local supply chains and partners, storied Indian OEMs have been behind foreign OEMs who have entered the market much later. 

Fourth, the argument that import restrictions have prevented Indian firms from becoming competitive flies against the reality that the Northeast Asian economies built their manufacturing successes in highly restricted markets. Instead, as Joe Studwell has written, they gained competitiveness by competing in the export markets. 

Now the government has thrown caution to the wind and, through the Rs 1 lakh Cr Research Development and Innovation Fund (RDIF), is funding even large corporates on their R&D endeavours. This may be the most that governments can do to push their industries towards innovating. It remains to be seen whether even this is sufficient. 

In conclusion, it appears that Indian firms suffer from an entrepreneurship deficit, risk aversion, and a lack of intrinsic desire to think big (by moving up the value chain, pursuing next-generation technologies, and expanding into export markets). They seem satisfied with serving their captive local markets, continuing their existing product lines and business models, and following global leaders in technology and product trends. This is a reality, borne out strikingly by evidence. Whether it is culture or something else can be a matter of debate. 

PS: On the issue of entrepreneurship, Claude had this comment on the prospects for India’s software services industry. 

Accenture sells outcomes and prices its services on the value of the transformation. Indian firms sell capacity and price on the cost of the underlying labor. Generative AI threatens the capacity-pricing model directly because it compresses the labor hours needed. It enhances the outcome-pricing model because AI-enabled transformations are higher-stakes and command premium fees.

This is why the next 2-3 years will be the real test: not whether Indian firms have AI capabilities (they clearly do), but whether they can shift their pricing and packaging model fast enough before Generative AI deflation hits their core managed-services contracts. Accenture has already crossed that bridge; TCS, Infosys and Wipro are mid-bridge with the macro tailwind weakening.

This is a test of entrepreneurship and reinvention of business models for the Indian IT services firms.

Thursday, May 15, 2025

Trump policies and Corporate America

The excessive focus on merchandise trade deficits and tariffs, while important, overlooks several important imbalances facing the world economy. In simple terms, excesses in production and savings, centred around China, interact with excesses in consumption and borrowing, centred around the US. This bad equilibrium has been amplified (or may have been co-created) by efficiency and profit-maximising American capitalism. 

I’ll do a longer post on these excesses separately. This post tries to unpack this issue from the perspective of Corporate America. 

The US stocks have easily outperformed others at least since the turn of the millennium. American firms have benefited from the fortuitous confluence of several factors that have contributed to their superior competitiveness. 

I can think of at least a dozen contributors. 

1. Widespread adoption of technology to improve efficiencies, enhance service delivery, and expand business opportunities. American firms, especially in the technology industries, have been leaders in R&D investments and in operating at the technology frontiers. 

2. Access to cheap and long-term sources of credit, on the back of the long period of ultra-low interest rates (it was below 2.5% from March 2008 to August 2022), especially since the Global Financial Crisis. 

3. Innovative financing models like private equity and venture capital, themselves riding on the low interest rates, have allowed firms plentiful access to growth-focused risk capital. 

4. The US marginal corporate tax rate dropped sharply to 21% in 2018 (Trump 1.0), even as effective corporate tax rates have declined steadily since 2000. 

5. Liberalised markets, mostly deregulated in the emerging technology industry, have allowed socialisation of costs, private appropriation of benefits, and the maximisation of returns from size and scale. 

6. The general rules of the game in the technology services industry (covering intellectual property, data ownership, taxation, labour contracting, regulation, etc.) have been laid down by Big Tech in the US. Their global adoption has been critical to the flourishing of the technology industry, dominated by US firms. 

For example, as Cory Doctorow explains here, US technology firms have benefited enormously from the intellectual property law called "anticircumvention", which prohibits tampering with or bypassing software locks that control access to copyrighted works.

7. Access to cheap goods and inputs, particularly from China, have been big boosters to US businesses in sectors like trading, construction, manufacturing etc. 

8. The relentless pursuit of cost-minimising strategies like outsourcing, offshoring, contract labour, and automation. 

9. The generalised adoption of a business model aimed at retaining high-value tasks while hiving off low-value ones. 

10. The generalised trend of business concentration across sectors has increased margins and profitability, especially among the largest firms. 

11. They have fed off its unmatchable innovation ecosystem, built around its great universities, large public research funding, and public and private research labs. 

12. Finally, the perceived stability and dynamism of the US economy have been a strong tailwind for its firms in attracting talent and capital. This stability itself owed significantly to the macroeconomic benefits of globalisation in moderating inflation while also ensuring low unemployment. 

However, there are signs that things may be changing now. Thanks to the confluence of another set of factors, some of the important contributors described above may now have weakened considerably or are weakening. So much so that the possibility of a regime shift now looms large. 

These emerging factors include the normalisation of interest rates, the reversal of several markers of globalisation, a new normal of higher tariffs and protectionist tendencies globally, backlash against immigration, and the instability and uncertainty engendered by the policies of the Trump administration. All of them, especially the last, have diminished the general attractiveness of US assets, its firms, and the economy itself. 

In this context, even as the Trump flip-flops induce ever more uncertainty, it’s useful to step back and look at how Chinese firms came to dominate manufacturing. One less discussed perspective is that it is the culmination of the relentless pursuit of efficiency and profit maximisation by large Western (mostly American) corporations.

As the world globalised on the back of sharp declines in logistics and communication costs and the emergence of the WTO, large Western companies realised the benefits of outsourcing and offshoring many of their activities to countries with cheap labour and weak regulations. China, with its abundant cheap and skilled labour, dynamic local governments competing fiercely to attract foreign companies, and its entry into the WTO in 2001, emerged as the natural destination for these contracts. 

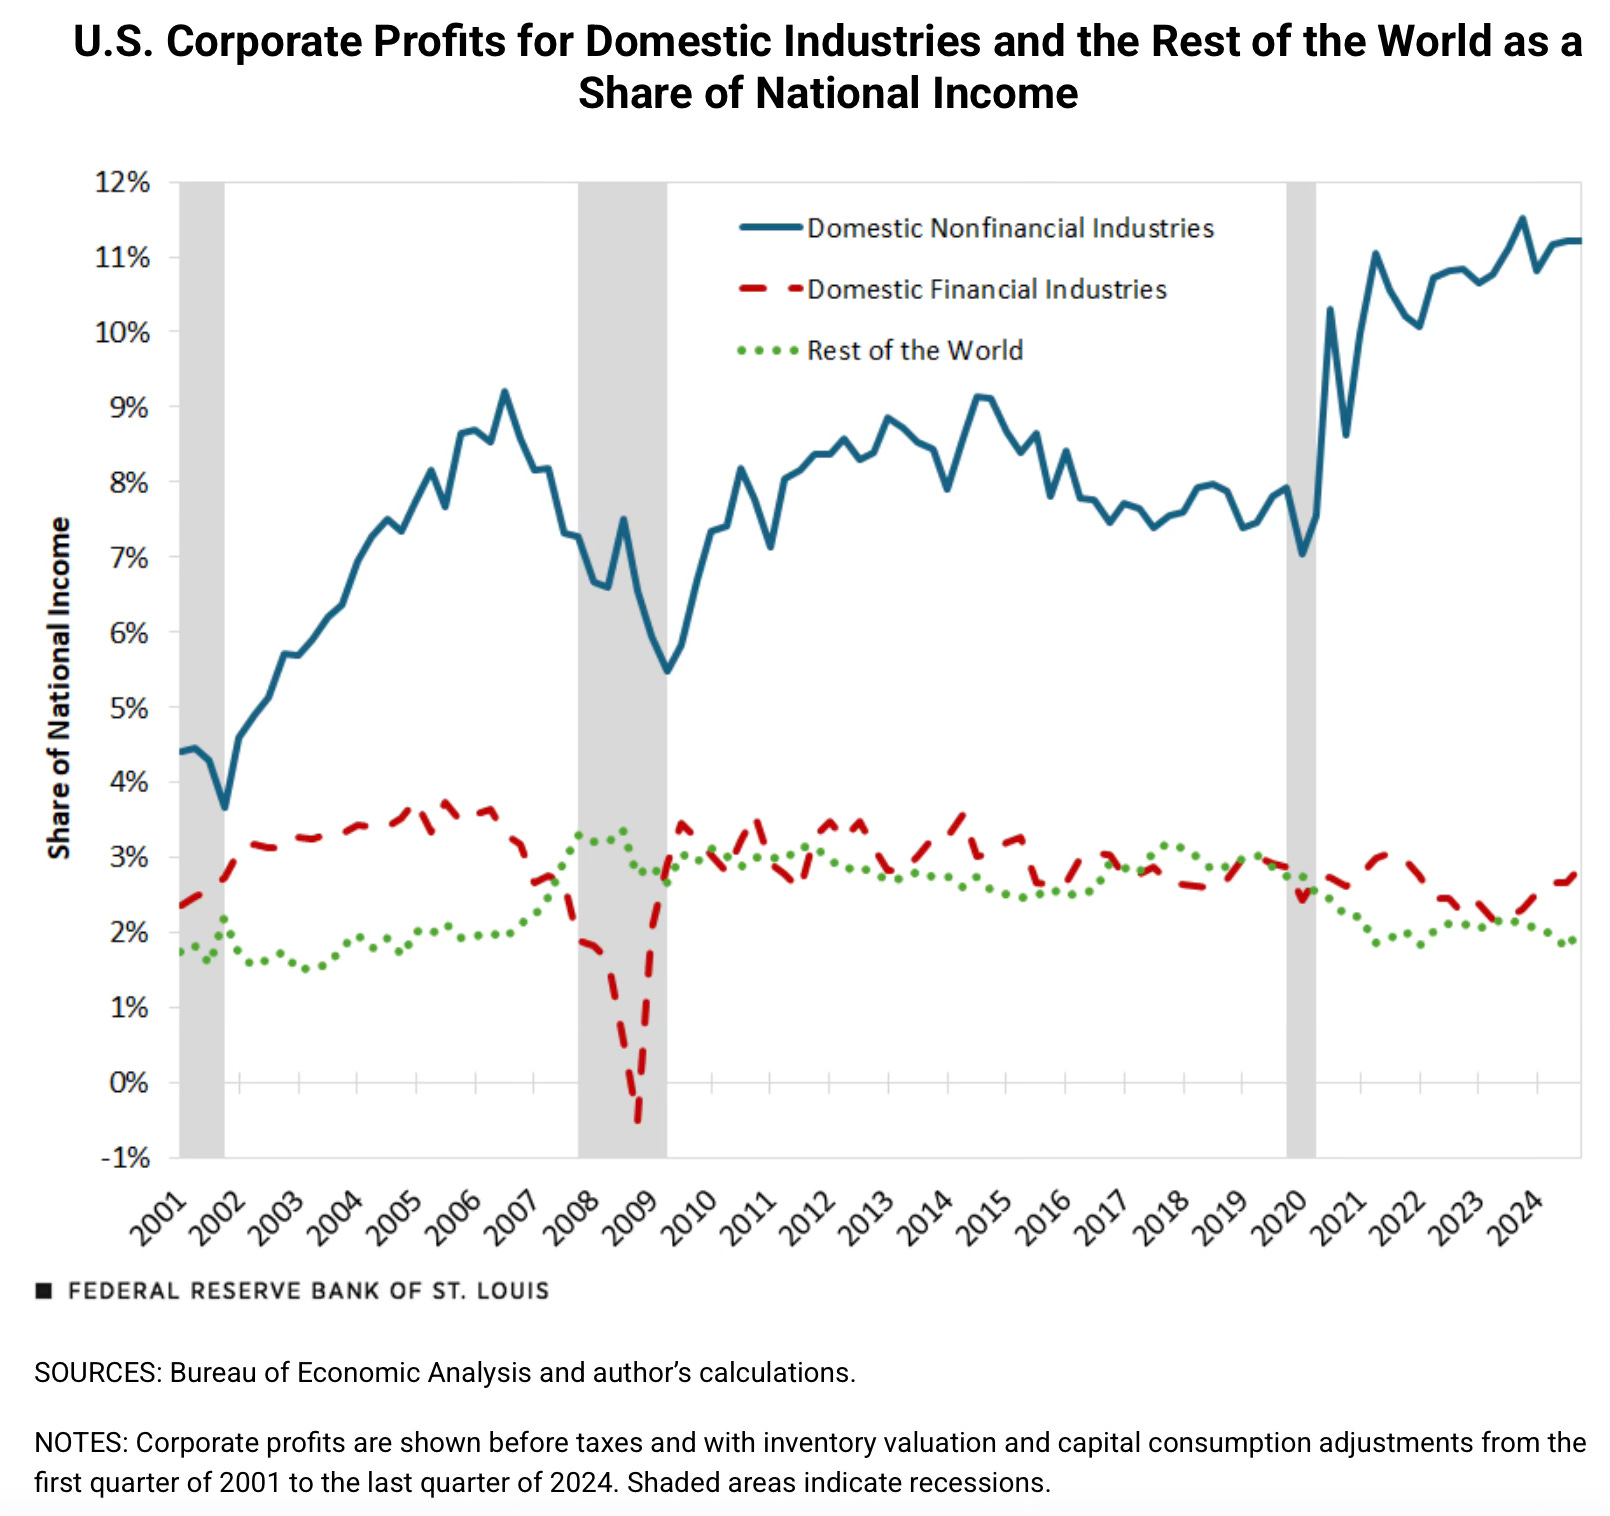
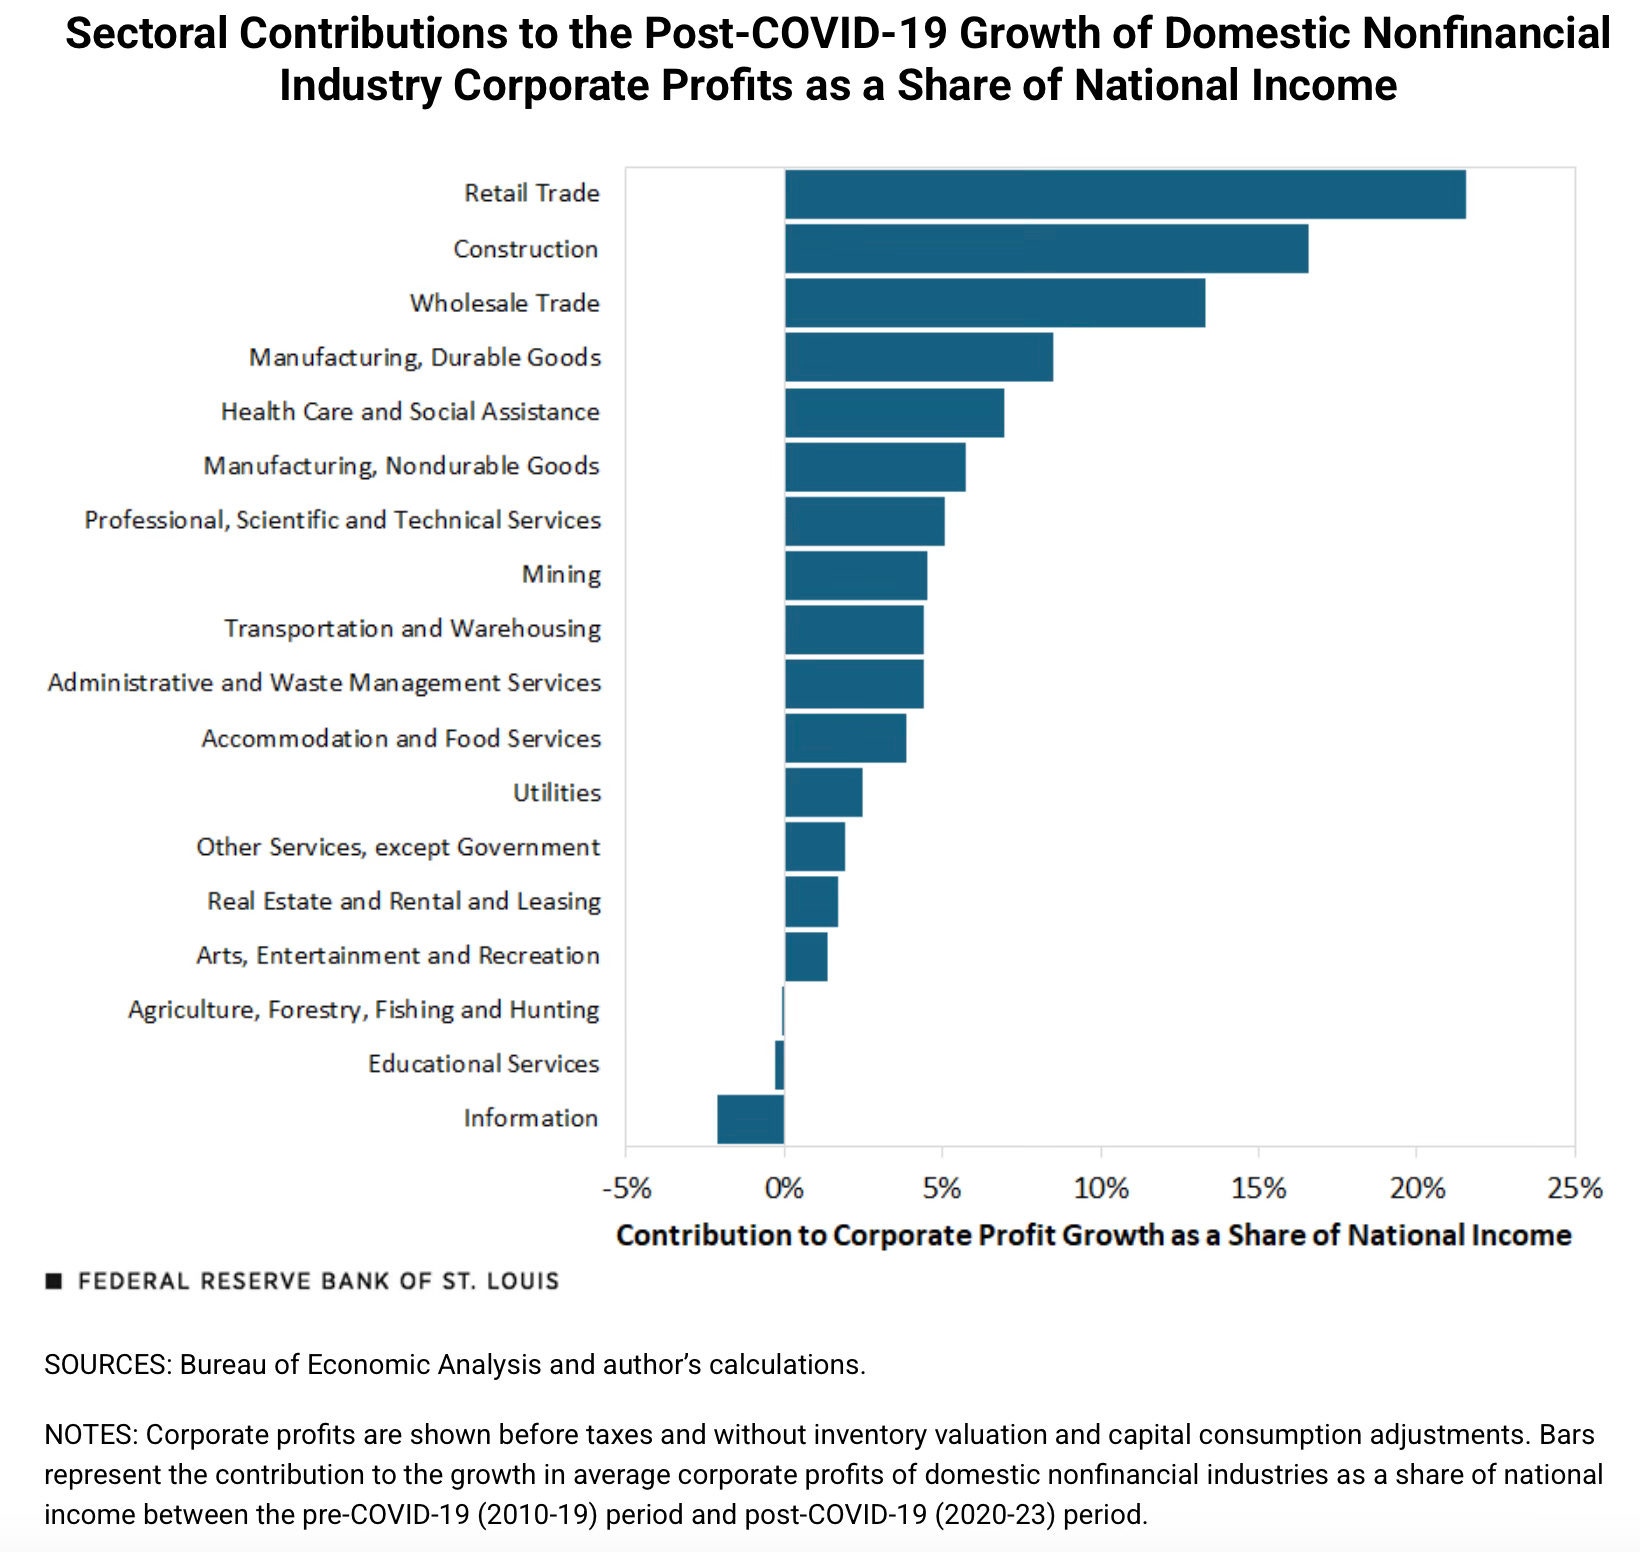
It was the perfect incentive-compatible arrangement. It created tens of millions of jobs and turbocharged Chinese economic growth. It lowered costs, boosted margins, and drove corporate profitability in the US. As Ricardo Marto of St Louis Fed shows, US corporate profitability surged in two episodes - 2001-2007, and then after the COVID-19 pandemic. 

Unsurprisingly, the biggest beneficiary sectors were those most exposed to China - trade and manufacturing. 

Any decoupling of the tightly wound and mutually beneficial relationship between China and US corporations will hurt both sides. While there will be factory closures and job losses galore in China, US firms will lose access to cheap inputs and a large market, and must abandon their outsourcing and offshoring-centred business models. Further, the major share of the tariffs may be borne neither by Chinese manufacturers nor American consumers but by the US corporations. All this will hurt their margins and lower their profitability substantially. American consumers, who benefited from cheap Chinese consumption goods, will face higher prices and a resultant negative income effect. 

The critics of globalisation and the supporters of the Trump tariffs harp on the undeniable costs of globalisation, especially in the form of erosion of the American manufacturing base, while overlooking the real benefits it brought to American corporations and consumers. These were conscious choices made by corporate America, aided by its consumers, and enabled by successive governments. 

And all this had an ideological basis in the economic orthodoxy of comparative advantage and free trade, as well as efficiency-maximising capitalism. 

On this issue, Joe Nocera has an essay where he misleadingly points to Dani Rodrik as one of “the intellectual godfathers of protectionism”. Rodrik is hardly a supporter of protectionism. Instead, he’s a critic of globalisation gone too far to the detriment of US manufacturing and workers. He also questions the central assumption behind the application of comparative advantage to the globalisation era, that of labour market adjustment (people who lose their jobs will move on and find jobs elsewhere, and would require at most some reskilling training). The centrality of comparative advantage in the canon of economic orthodoxy has meant that economists were willing to overlook anything problematic about its application. 

Another of Nocera’s “godfathers of protectionism”, Michael Pettis, directly refutes this description here. Pettis has written extensively, blaming the current situation on structural imbalances in the world economy. Even as America outsourced and offshored manufacturing to China, its consumers, corporations, and government gorged on cheap debt from the flood of capital that flowed into the US due to its exorbitant privilege and the massive surpluses enjoyed by exporters like China. In Pettis’ telling, the Chinese and East Asians manufactured, generated surpluses and lent them to America to consume. 

This argument appears too simple and circular. It raises the question of whether it is Chinese manufacturing and surpluses or American debt-fuelled consumption that has brought us to this situation. This argument about causation may never be resolved satisfactorily. But in any case, it points to the unavoidable need for rebalancing of excesses on both sides. 

As I have blogged on multiple occasions, as China weaponises its manufacturing dominance, decoupling from China is today a critical and urgent national security imperative for not just the US but for all major economies. 

But as we discussed earlier, this rebalancing must also reconcile to lower margins and profits by US corporations, higher prices for US consumers, lower borrowings by US governments, and higher cost of capital for all sides in the US. More fundamentally, it would require a recalibration of the vaunted efficiency and profits maximising model of American capitalism. It’ll require greater sharing of profits by capital with labour. Also, American consumers must adjust to an era of higher-priced goods and significantly reduce their propensity to assume excessive debts. 

Fortunately, given the distortions engendered by these excesses, all these would be much-desirable adjustments. 

These outcomes will have profound implications for American capitalism and require a fundamental unsettling of deeply entrenched interests. But the political economy of these adjustments for rebalancing is daunting. 

Only a maverick like Donald Trump could have pushed the agenda so far and so quickly in the direction of decoupling from China. But as the repeated U-turns by President Trump when faced with market pressures - pausing the reciprocal tariffs and now lowering and pausing the high tariffs on China - show, the political economy is starting to bind. 

Given the corporate interests that are closely intertwined with, and even funding, the Trump administration, there will be enormous pressure to back away from measures that will hurt corporate profits and cause equity market turbulence. This will be complemented by inflationary pressures on mass consumption goods, forcing popular discontent. 

The signs so far appear to indicate that Trump will blink when push comes to shove on issues that deeply hurt corporate interests. As the ongoing rally indicates, the markets also think that corporate interests will finally win out. This does not bode well for necessary structural rebalancing within the US (and therefore the world economy itself). 

However, amidst these disturbing prospects, there are some signs that Corporate America will not have everything its way. One of the most encouraging signs emerging from the Trump administration is its apparent resolve to continue the antitrust agenda against Big Tech launched by the Biden administration. It’s pushing ahead with suits to break up or significantly constrain Google, Meta, and Amazon. The course of these trials over the next two years will be critical. 

The Executive Order to control Big Pharma by drastically reducing drug prices and cutting out intermediaries is a massive decision, given the political influence held by pharmaceutical companies. I don’t think any other President could have pushed it through. But it remains to be seen how it’ll be implemented. Amidst these, Wall Street continues to hold sway. 

When all is said and done in the next four years, one of the most important contributors to what the world will look like will depend on how this political economy plays out. 

Saturday, December 28, 2024

Weekend reading links

1. Agriculture terms of trade facing Indian farmers

Such export controls and anti-market policies inflict a large “implicit tax” on farmers, despite significant budgetary support through fertiliser and other subsidies, including loan waivers. In this context, it is useful to look at the OECD’s producer support estimates (PSEs) that it generates for more than 50 major countries in the world. They adopt a common methodological framework to estimate the impact of various agricultural policies, mainly budgetary support and market price support. The comparative results may shock some policymakers in India. For the triennium ending 2023, OECD countries supported their agriculture to the tune of about 14 per cent of gross farm receipts (PSE 13.8 per cent). Interestingly, China also supports its agriculture to the tune of 14 per cent (PSE 14 per cent), while India’s PSE is negative (-) 15.5 per cent. That happens due to the negative market price support that results from export controls, dumping in the domestic market to push prices down, putting stocking limits on private trade, banning futures markets, and so on.

2. India's banking sector in 2024 

The gross non-performing assets (NPAs) of the banking system, which stood at 3.2 per cent in September 2023, dropped further to 2.8 per cent in March 2024. After provisioning, the net NPAs dropped from 0.8 per cent to 0.6 per cent during this period. The capital adequacy ratio, meanwhile, remained unchanged at 16.8 per cent. Meanwhile, the gross NPAs of the non-banking financial companies (NBFCs) dropped from 4.6 per cent to 4 per cent, and return on assets rose from 2.9 per cent to 3.3 per cent. There was a marginal drop in their capital adequacy ratio, from 27.6 per cent to 26.6 per cent.

3. Lego facts of the day

Over the past 20 years the company’s revenue has grown ten-fold, reaching DKr66bn ($9.7bn) in 2023. A decade ago it became the world’s largest toymaker by revenue. Today its sales are greater than those of its two biggest rivals—Mattel, creator of Barbie, and Hasbro, maker of Nerf guns—combined. In 2023 it opened 147 shops around the world, taking its total to 1,031, and built factories in America and Vietnam. Sales in the first half of 2024 were up by 13%, year on year, even as the global toy market shrank. In 2004 the company was loss-making; in 2023 its net profit was DKr13bn, implying an enviable margin of nearly 20%... A foundation owns a quarter of the firm; the Kristiansen family owns the rest.

4. PE investors who flocked into China faces their reckoning.

Among the 10 largest global private equity groups with operations in China, there is no record of any having listed a Chinese company this year or fully sold their stake through an M&A deal, figures from Dealogic show. It is the first year for at least a decade where this has been the case, though the pace of exits has been slow since Beijing introduced restrictions on Chinese companies’ ability to list in 2021. Buyout groups rely on being able to sell or list companies, typically within three to five years of buying them, in order to generate returns for the pension funds, insurance companies and others whose money they manage. The difficulties in doing so have in effect left those investors’ funds locked away, with future returns uncertain... Many private equity groups expanded their presence in the world’s second-biggest economy as it grew rapidly over the past two decades. Global pension funds and others ploughed capital into the country, hoping to gain exposure to its economic boom. The 10 firms invested $137bn over the past decade, but total exits amount to just $38bn, Dealogic data shows. New investment by those groups has collapsed to just $5bn since the start of 2022...
The data covers Blackstone, KKR, CVC, TPG, Warburg Pincus, Carlyle Group, Bain Capital, EQT, Advent International and Apollo, the 10 largest buyout groups by funds raised for private equity over the past decade... Foreign buyout groups used to rely on taking Chinese companies public in the US or other countries in order to exit their investments after a few years. But Beijing has introduced new restrictions on offshore listings since cracking down on the ride-hailing app DiDi, in the wake of its New York IPO in 2021. Listings have slowed significantly since. In total this year, there have been just $7bn of domestic IPOs in China as of late November, compared with $46bn last year, which was already the lowest total since 2019.

China's troubles come even as India emerged as the top market for IPO listing in the world in 2024 by numbers and the second highest (after the US) by value.

The NSE of India has emerged as the number one venue for primary listings by value, ahead of Nasdaq and HK SE. 

5. 2025 is expected to be an inflexion point for EVs in China, as it's estimated to overtake ICE cars in sales.
China is set to smash international forecasts and Beijing’s official targets with domestic EV sales — including pure battery and plug-in hybrids — growing about 20 per cent year on year to more than 12mn cars in 2025, according to the latest estimates supplied to the Financial Times by four investment banks and research groups. The figure would be more than double the 5.9mn sold in 2022. At the same time, sales of traditionally powered cars are expected to fall by more than 10 per cent next year to less than 11mn, reflecting a near 30 per cent plunge from 14.8mn in 2022. Meanwhile, EV sales growth has slowed in Europe and the US, reflecting the legacy car industry’s slow embrace of new technology, uncertainty over government subsidies and rising protectionism against imports from China... China's adoption of battery electric vehicles (BEVs) is projected to grow to 80% by 2035... HSBC estimated about 90 new car models had been planned for release by manufacturers in China in the fourth quarter of 2024 — about one a day — and nearly 90 per cent were EVs. 
This has important implications.
The forecasts suggest Beijing’s official target, set in 2020, for EVs to account for 50 per cent of car sales by 2035, will be achieved 10 years ahead of schedule. Norway leads the world in EV sales as a share of the market, with more than 90 per cent of new cars battery-powered... They imply that over the coming decade, factories set up in China to produce tens of millions of cars with traditional engines will have almost no domestic market to serve. They also highlight how the rapid rise of the Chinese EV industry now threatens the national manufacturing champions of Germany, Japan and the US. As China’s EV market tracked towards year-on-year growth of near 40 per cent in 2024, the market share of foreign-branded cars fell to a record low of 37 per cent — a sharp decline from 64 per cent in 2020, according to data from Automobility, a Shanghai-based consultancy. In this month alone, GM wrote down more than $5bn of its business value in China; the holding company behind Porsche warned of a writedown in its Volkswagen stake of up to €20bn; and arch rivals Nissan and Honda said they were responding to a “drastically changing business environment” with a merger.

6. The long-term performance of a UK local government pension fund that invests over half its portfolio in index funds raises more questions on the value created by the asset management industry. 

Quentin Marshall, chair of Kensington and Chelsea’s £1.9bn pension scheme, has delivered the best performance of any UK local authority fund over the past decade by parking half of its assets in a global equity index tracker. Marshall, who has chaired the fund since 2014, said individual stock or fund selection hinders rather than helps drive returns and he avoids tactical decision-making when his team meets to review its investments... “The whole asset management industry is built on the premise that they have value,” Marshall said. 

He is withering in particular about consultants who advise pension funds on investment decisions and “rely on backward looking data which is definitely shown to be completely and utterly useless as a source of prediction”. Over the past decade, the 51-year-old Conservative party councillor and banker has delivered average annual returns of 10.8 per cent for the pensions of workers at Kensington and Chelsea’s council, which provides services to both the wealthiest parts of the UK and neighbourhoods with significant deprivation. The performance, driven by a heavy equity exposure, outstrips other local authorities, according to shareholder advisory group PIRC. Marshall’s fund was the only local authority to achieve double digit annual returns over the past decade. The second best was Bromley council, which trailed him with 9.3 per cent... Marshall attributes his performance in part to making few decisions. His team meets formally to review its strategic asset allocation once a year but it has been “broadly unchanged for many years”. Half of the fund follows the BlackRock MSCI world index tracker...

His rejection of fund and stock selection makes him sceptical that the UK government’s decision to pool all of the assets of England and Wales’s £391bn local government pension scheme will help boost pension returns, although he supports the government’s attempts to professionalise the investment process. Last month Labour chancellor Rachel Reeves set out plans for a series of “megafunds” to run local council pension assets, a move the government hopes will drive billions of pounds of investment into British infrastructure and fast-growing companies. The reform programme was supported by her Tory predecessor Jeremy Hunt. But Marshall does not buy their argument that the reforms will lead to better pension returns for cash-strapped councils.
7. Good oped on the implications of the events in the Middle East over the year.

8. Junk food and children health in UK

While the price of healthy, whole foods — such as fish or staple vegetables such as carrots — has soared, unhealthy processed foods are more likely to be placed on enticing promotions and cost significantly less than fresh alternatives. Per calorie, healthy food is almost three times as expensive as unhealthy options, says the Food Foundation. The most deprived fifth of the population would need to spend half of their disposable income on food if they stuck to the government-recommended healthy diet, the charity found. This compares to just 11 per cent for the highest earners. To put together a children’s packed lunch that meets healthy eating guidelines, typically involving fresh fruit and vegetables, unsweetened yoghurt and brown bread, costs up to 45 per cent more than a lunchbox filled with chocolate, flavoured yoghurt and processed snacks marketed at children, according to the charity. The imbalance in grocery baskets between whole foods and junk foods has contributed to higher levels of obesity in lower-income groups, with poorer families becoming more reliant on less-healthy diets, data shows.
The trend has also been exacerbated by food inflation. Between 2021 and 2023, healthier foods increased in price by £1.76 per 1,000 calories compared with £0.76 for less healthy foods, according to the Food Foundation. Fruit and vegetables are the most expensive grocery category, costing an average of £11.79 per 1,000 calories, while food and drink high in fat and sugar costs £5.82... Children are constantly tempted by brightly coloured packaged food placed strategically in shops and advertised on TV and social media platforms. Young people are also influenced by what their friends are eating. Soft drinks, confectionery, snacks and desserts account for about a third of food and soft drink advertising spend, compared with just 1 per cent on fruits and vegetables, says the Food Foundation. Brand advertising, which accounts for about 40 per cent, also contributes to unhealthy eating as consumers tend to associate companies with their products, such as snacks, even if they are not directly promoted... Researchers have also found that some companies deliberately market junk food to deprived communities... According to research by Impact on Urban Health, which mapped food availability in London boroughs, unhealthy food outlets were significantly more concentrated in deprived neighbourhoods.

The same story is repeated across the world. 

9. About corporate churn rate

Just over 1 per cent of the 1,513 UK-listed companies in 1948 still existed 70 years later, according to an analysis by two Cambridge professors. Roughly half of US public companies traded for 10 years or fewer over the past century, says Morgan Stanley.

10. On industry concentration in banking in the US

JPMorgan Chase, Bank of America, Citigroup and Wells Fargo, the four largest US banks by deposits and assets, collectively reported about $88bn in profits in the first nine months of 2024, according to Financial Times calculations based on figures from industry tracker BankRegData. Together they account for 44 per cent of the US banking industry’s profits — the highest share for the first nine months of the year since 2015 — despite the pool taking in more than 4,000 of the country’s other banks. Including US Bank, PNC and Truist, the seven largest banks by deposits generated almost 56 per cent of all banking profits in the first nine months of the year, up from 48 per cent for the same period in 2023.

11. Finally, a snippet on structural transformation in the US, from an excellent oped by Martin Wolf.

In 1810, 81 per cent of the US labour force worked in agriculture, 3 per cent worked in manufacturing and 16 per cent worked in services. By 1950, the share of agriculture had fallen to 12 per cent, the share of manufacturing had peaked, at 24 per cent, and the share of services had reached 64 per cent. By 2020, the employment shares of these three sectors reached under 2 per cent, 8 per cent and 91 per cent, respectively. The evolution of these shares describes the employment pattern of modern economic growth.
He points to an important challenge in manufacturing
Initially, two positive forces — cheaper food and higher incomes — shift spending towards manufactures and drive up the share of manufacturing in employment. But two negative forces — the decline in prices of manufactures relative to services and the higher income elasticity of demand for the latter — do the reverse. Initially, the positive effects on manufacturing dominate, because the agricultural revolution is so huge. Yet there comes a time when agriculture is too small to provide a positive impulse to manufacturing. Then forces operating within manufacturing and the service sector dominate. Employment shares in manufacturing start to fall. In the US, these have been falling for seven decades. The idea that this process is reversible is ridiculous. Water flows downhill for a good reason.

Saturday, June 22, 2024

Weekend reading links

In the 1990s, Italy initiated the largest privatisation programme in continental Europe, dismantling much of its industrial backbone instead of fostering innovation. For example, while the telecommunications conglomerate STET allocated 2 per cent of its revenues to research and development (R&D) between 1994 and 1996, our calculations show that its privatised successor, Telecom Italia, spent roughly 0.4 per cent on R&D between 2000 and 2002.

2. Interesting stats on the US equity market exceptionalism

The question may provoke laughter, given that since 2011 US stocks (the S&P 500) have outperformed EM stocks (the MSCI EM index) by more than 400 percentage points. But it was not always so: between 1999 and 2007, emerging markets outperformed the US by almost 200 percentage points.

3. Startling graphic of caste-based wealth concentration in India.

More than 85 per cent of total billionaire wealth in the country belongs to those of upper caste communities. People of the scheduled castes (SC) comprised 2.6 per cent of such wealth in 2022 compared to 88.4 per cent by the upper castes, according to additional data shared with Business Standard by researchers of the World Inequality Lab following the publication of their May 2024 study, ‘Towards Tax Justice and Wealth Redistribution in India: Proposals based on latest inequality estimates’, by authors Nitin Kumar Bharti of New York University; Lucas Chancel of Harvard Kennedy School; and Thomas Piketty and Anmol Somanchi of the Paris School of Economics. The other backward class (OBC) share was 9 per cent and there were no billionaires of the scheduled tribes (ST). The researchers used publicly available billionaire lists and applied manual coding and an algorithm ‘Outkast’ to determine caste.

4. The accounting industry is already struggling with conflicts of interest and poor quality of accounting. In this context comes a story in FT of a creeping takeover of accounting firms by PE firms. 

Ten of the 30 largest US accounting firms could soon be in private equity hands, according to people familiar with negotiations, as at least four groups hold deal talks following this year’s sales of Grant Thornton and Baker Tilly. The acquisitions by financial buyers of those two top-10 firms by revenue opened the floodgates to other deals, the people said, positioning private equity to increase its influence over the US accounting profession dramatically. One top-30 firm, Atlanta-based Aprio, was planning a deal to sell a majority stake to the private equity firm Charlesbank Capital, according to people familiar with the situation. Two more — New York’s PKF O’Connor Davies and Carr, Riggs & Ingram of Alabama — had engaged bankers to run sale processes, they said. California-based Armanino, the country’s 19th largest accounting firm, according to Accounting Today, was in talks with a private capital provider about selling a minority stake, the people said. Armanino hit the headlines as the auditor of the US operations of crypto exchange FTX, which collapsed in 2022. The deal wave sweeping the profession means that one in three of the top 30 firms has taken, or is close to taking, private equity investment.

It's hard to think how beneficial this trend could be on the accounting industry.

5. The EU has announced tariffs of upto 50% on Chinese car imports. 

Brussels will impose tariffs of up to almost 50 per cent on Chinese electric vehicles... The European Commission notified carmakers on Wednesday that it would provisionally apply additional duties of between 17 and 38 per cent on imported Chinese EVs from next month. The duties will be applied on top of existing 10 per cent tariffs on all Chinese EVs, depending on the extent to which they complied with an EU anti-subsidy investigation into electric carmakers that was announced last September. Major exporters including BYD, the world’s largest electric-vehicle manufacturer, and Geely will be hit with additional individual tariffs of between 17 and 20 per cent. European brands such as Mercedes and Renault exporting EVs made in China will pay 21 per cent while Tesla “may receive an individually calculated duty rate”, the commission said. Companies considered not to have co-operated with the probe, including Shanghai’s state-owned group SAIC, will be subject to the 38 per cent rate. SAIC has dominated the lower end of the European EV market through its MG brand.
The Kiel Institute, an economic think-tank, has estimated an extra 20 per cent tariff on Chinese electric cars would reduce imports by a quarter. It calculated that this corresponded to an estimated 125,000 units worth almost $4bn... the market share of EVs imported from China increased from 4 per cent in 2020 to 25 per cent in September 2023.
The tariff measures are championed by France, but opposed by Germany, Hungary and Sweden who fear retaliation by the Chinese. 

More details of the tariffs here.

6. From the RBI's 2017-18 annual report, the findings of a model that evaluated the impact of MSP on prices.

They show that MSP has a positive and statistically significant effect on retail prices of all crops, although it varies significantly across crops. In general, it has a stronger effect for those crops where procurement is substantial, such as paddy and wheat.
There's a very strong correlation (see table 2). A 1% increase in MSP of wheat is associated with a 0.91% increase in retail price; a 1% increase in MSP of rice is associated with a 1.27% increase in retail price of rice. The correlation is far lower for other crops. Further, other variables like international prices, production etc have negligible impacts.

7. Fascinating story of how the Chinese fell in love with the Durian fruit and have created a large and rapidly growing export market from out of nothing for East Asian countries!
The fruit, durian, has long been a cherished part of local cultures in Southeast Asia, where it is grown in abundance. A single durian is typically the size of a rugby ball and can emit an odor so powerful that it is banned from most hotels. When Mr. Chan began his start-up in his native Malaysia, durians were cheap and often sold from the back of trucks. Then, China acquired a taste for durian in a very big way. Last year, the value of durian exports from Southeast Asia to China was $6.7 billion, a twelvefold increase from $550 million in 2017. China buys virtually all of the world’s exported durians, according to United Nations data. The biggest exporting country by far is Thailand; Malaysia and Vietnam are the other top sellers. Today, businesses are expanding rapidly — one Thai company is planning an initial public offering this year — and some durian farmers have become millionaires...

Farmers in Southeast Asian durian orchards say they can’t recall anything like the China craze. The surge in durian exports is a measure of the power of Chinese consumers in the global economy, even though, by other measures, the mainland economy is struggling. When an increasingly wealthy country of 1.4 billion people gets a taste for something, entire regions of Asia are reshaped to meet the demand. In Vietnam, state news media reported last month that farmers were cutting down coffee plants to make room for durian. The acreage of durian orchards in Thailand has doubled over the past decade. In Malaysia, jungles in the hills outside Raub are being razed and terraced to make way for plantations that will cater to China’s lust for the fruit... China is not only a buyer. Chinese investment has flowed into Thailand’s durian packing and logistics business. Already, Chinese interests control around 70 percent of the durian wholesale and logistics business...

Durian is to fruit what truffles are to mushrooms: Pound for pound, the fruit has become one of the most expensive on the planet. Depending on the variety, a single durian can sell for anywhere between $10 to hundreds of dollars. But Chinese demand, which has pushed up prices fifteenfold over the past decade, has frustrated Southeast Asian consumers, who see durians morphing from a plentiful fruit growing in the wild and in village orchards to a luxury commodity earmarked for export. Countries are exporting a fruit that is an integral part of their identities and cultures, especially in Malaysia, where it is a unifying national icon among its many ethnic groups.

8. India is emerging as a top destination for data centre construction by the US Big Tech firms.

Wonder how much of this is being driven by India's mandatory policy on data localisation by technology firms? If that's the case, it's one more win for industrial policy.

9. Interesting line of reasoning about inflation in India

Despite weak rural demand, inflation in villages is 5.3%, whereas in cities it’s close to the central bank’s 4% target. Even inflation expectations are higher in villages. The puzzle may be partly explained by the missing train journeys — 100 million fewer every month than before the pandemic. Something is broken with the regular rural-to-urban migration pattern.

10.  TSMC facts of the day

Its share of the global contract chip manufacturing market surpassed 60 per cent in the first quarter... advanced chips that use 7 nanometre and below technology accounting for two-thirds of TSMC’s total sales. Its high-performance computing business in particular, which includes chips for AI applications, makes up nearly half its total... Despite building out more plants overseas, 80-90 per cent of TSMC’s production capacity remains concentrated in Taiwan... Gross margins have long surpassed 50 per cent. Free cash flow more than quadrupled in the past year to $7.9bn, which means ample cash to invest in building capacity for the next generation 2nm chips which would widen the gap with rivals yet further.

11. It's surprising that many western media and commentators wail that being large net importers, they have little leverage over China. Consider this.

China has hit the EU’s soft underbelly in its fight over electric vehicle imports: pork. Poultry and beef could be next — especially chicken feet and other bits that Europeans do not tend to eat, but depend on selling... Food and drink are these days among the few products that China buys more of than it sells to the bloc, and they have been the first in the line of fire as Beijing retaliates over antisubsidy tariffs of up to 38 per cent on electric cars... Its trade surplus with Europe has ballooned in advanced equipment such as batteries, solar panels and cell phones. The EU, meanwhile, still sells lots of cars and aircraft. But increasingly its strength is serving China’s 1.4bn consumers with more traditional consumer fare: cheese, wine and handbags...

“When a European leader goes to Beijing to get the market reopened for steak they have to give a gift in return,” Clarke said. “We sell them the port of Piraeus [in Greece], they buy feta cheese and yoghurt.” The problem for Brussels is that there is not much the EU could block in return. It is almost totally reliant on Chinese solar panels and does not want to increase the cost of going green. It also needs Chinese-made batteries for its own electric vehicles. Under US pressure, the Netherlands has ended exports of advanced chipmaking machines, but cutting supplies of Hermès scarves is unlikely to bring the Chinese economy to its knees.

The report overlooks that an importer too can have leverage on the exporter.  

12. FT has an article on Chinese millionaires fleeing their country in record numbers. It highlights the "mirror transfer" system through which they take out their wealth

So many would-be migrants are left with little choice but to turn to “underground banks” to help spirit their wealth abroad. These shadowy institutions deploy numerous sleights of hand to transfer money across borders without law enforcement agencies noticing. One method is known as the “mirror transfer”, under which a sum of money is deposited in one underground bank in China. The same amount is then withdrawn from a reciprocal underground bank in another country. The money never actually moves, leaving little trail for detectives to follow.

13. The number of industrial policy interventions worldwide have ballooned from 228 in 2027 to 1568 in 2022, with most concentrated in the developed countries.


14. Some questions on Nvidia's stratospheric rise, evoking comparisons with Cisco (instead of Microsoft and Apple), from a very good article on the company.
The Nvidia economy looks very different to the one surrounding Apple. In many ways, the popularity of a single app — ChatGPT — is responsible for much of the investment that has driven Nvidia’s stock price upwards in the past few months. The chipmaker says it has 40,000 companies in its software ecosystem and 3,700 “GPU-accelerated applications”. Instead of selling hundreds of millions of affordable electronic devices to the masses every year, Nvidia has become the world’s most valuable company by selling a relatively small number of expensive AI chips for data centres, primarily to just a handful of companies. Large cloud computing providers such as Microsoft, Amazon and Google accounted for almost half of Nvidia’s data centre revenues, the company said last month. According to chip analyst group TechInsights, Nvidia sold 3.76mn of its graphics processing unit chips for data centres last year. That was still enough to give it a 72 per cent share of that specialist market, leaving rivals such as Intel and AMD far behind...

Demand for Nvidia’s products has been fuelled by tech companies that are seeking to overcome questions about AI’s capabilities by throwing chips at the problem. In pursuit of the next leap forward in machine intelligence, companies such as OpenAI, Microsoft, Meta and Elon Musk’s new start-up xAI are racing to construct data centres connecting as many as 100,000 AI chips together into supercomputers — three times as large as today’s biggest clusters. Each of these server farms costs $4bn in hardware alone, according to chip consultancy SemiAnalysis.
The biggest risk for Nvidia lies on factors beyond its control - whether the AI investments made by Big Tech will translate into proportionate benefits. 
That scale of investment will only continue if Nvidia’s customers figure out how to make money from AI themselves. And at just the moment the company reached the top of the stock market, more people in Silicon Valley are starting to question whether AI can live up to the hype... Big Tech companies will collectively need to generate hundreds of billions of dollars more a year in new revenues to recoup their investment in AI infrastructure at its current accelerating pace. For the likes of Microsoft, Amazon Web Services and OpenAI, incremental sales from generative AI are generally projected to run in the single-digit billions this year... The period when tech executives could make grand promises about AI’s capabilities is “coming to an end”, says Euro Beinat, global head of AI and data science at Prosus Group, one of the world’s largest tech investors.

But Nvidia is not staying still. 

Analysts say if it is to continue to thrive it must emulate the iPhone maker and build out a software platform that will bind its corporate customers to its hardware... It provides all the ingredients to build “an entire supercomputer”, Jenson Huang has said. That includes chips, networking equipment and its Cuda software, which lets AI applications “talk” to its chips and is seen by many as Nvidia’s secret weapon. In March, Huang unveiled Nvidia Inference Microservices, or NIM: a set of ready-made software tools for businesses to more easily apply AI to specific industries or domains. Huang said these tools could be understood as the “operating system” for running large language models like the ones that underpin ChatGPT... The problem for Nvidia is that many of its biggest customers also want to “own” that relationship with developers and build their own AI platform... Nvidia is cultivating potential future rivals to its Big Tech customers, in a bid to diversify its ecosystem. It has funnelled its chips to the likes of Lambda Labs and CoreWeave, cloud computing start-ups that are focused on AI services and rent out access to Nvidia GPUs, as well as directing its chips to local players such as France-based Scaleway, over the multinational giants. Those moves form part of a broader acceleration of Nvidia’s investment activities across the booming AI tech ecosystem. In the past two months alone it has participated in funding rounds for Scale AI, a data labelling company that raised $1bn, and Mistral, a Paris-based OpenAI rival that raised €600mn. PitchBook data shows Nvidia has struck 116 such deals over the past five years. As well as potential financial returns, taking stakes in start-ups gives Nvidia an early look at what the next generation of AI might look like, helping to inform its own product road map.