Substack

Showing posts with label Savings. Show all posts

Friday, September 18, 2026

Disaggregating India’s savings and its risk capital challenge

Does India have a problem of risk capital deficiency? More specifically, is there a disproportionately greater bias towards public markets among India’s savers, especially among high-net-worth individuals (HNIs)? 

I blogged here, arguing that India suffers from a deficiency of risk capital to finance the formation and growth of small and medium enterprises (SMEs). After that, I received some pushback, pointing to the spate of SME IPOs in recent times. 

I had been thinking of digging up the numbers and seeing how they stack up. In this context, I came across this review of a book by Ameer Shahul that argues that private equity is damaging India’s health care. While I’m sympathetic to this argument, the point that is relevant to this post is the dominance of foreign investors in these PE deals. I had blogged hereabout PE in India’s hospitals. 

I used Claude to look deeper into India’s numbers on risk capital, how they compare with global peers, and what their trends have been. 

The headline story is that India does not lack risk capital, but it channels it into liquid public markets, leaving the control of market segments like essential-service assets, and the value created in the private phase, largely to foreign capital. 

The decomposition goes something like this. The Gross Domestic Savings (GDS), contributed by households, the private sector, and governments, gets distributed between physical (primarily land and gold) and financial (deposits, risk capital, and pension/insurance). Risk capital, in turn, gets further distributed between public (stocks and mutual funds) and private (alternative investments) markets. Business formation requires a deep pool of the risk capital flowing into private markets. 

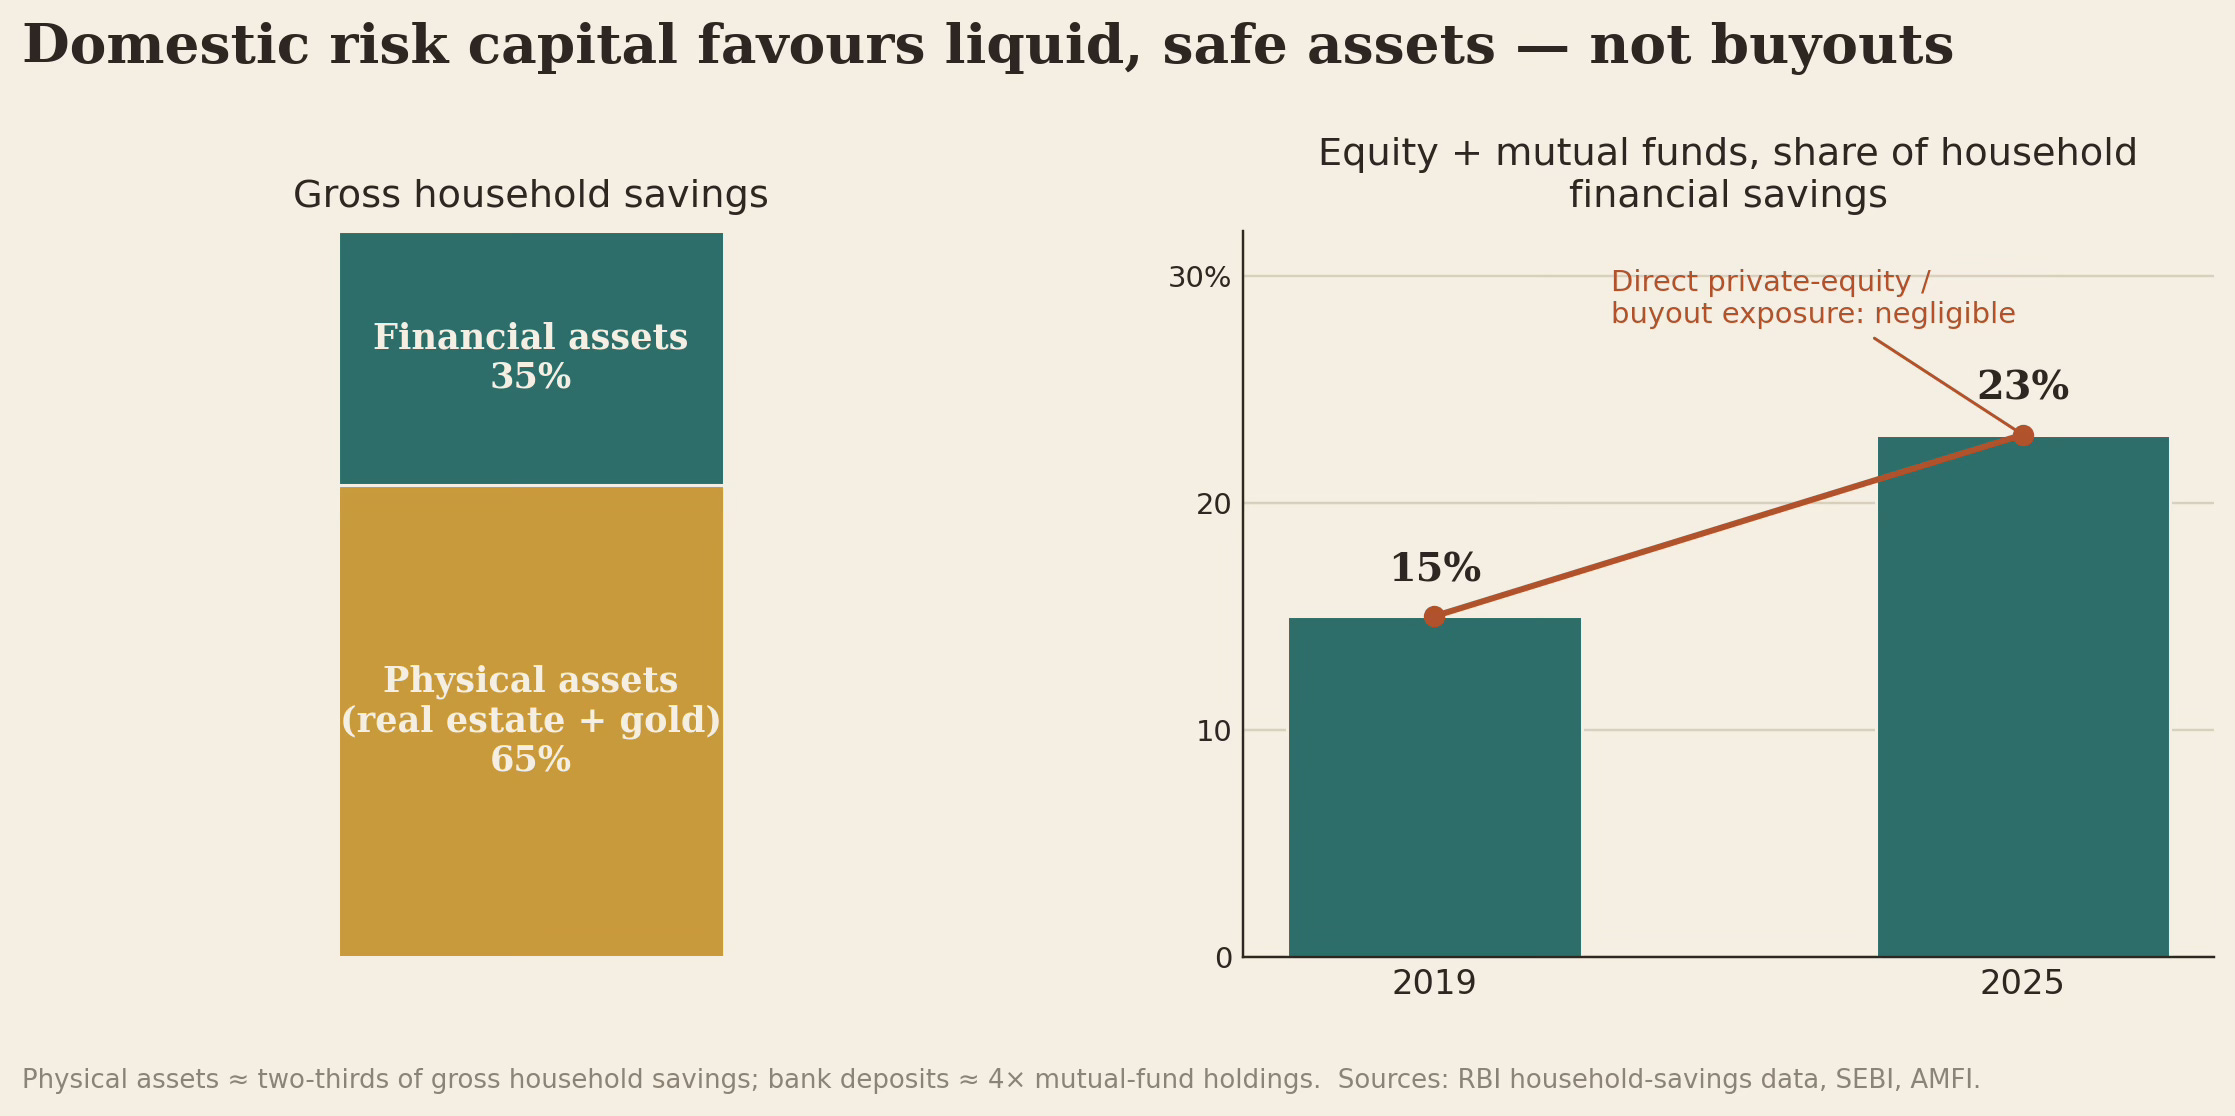
So, let’s start with the GDS. Clearly, India is second only to China in domestic savings as a share of GDP, though given its fast growth ambitions, it must increase this share. The problem is that over 40% of household savings are invested in illiquid assets. 
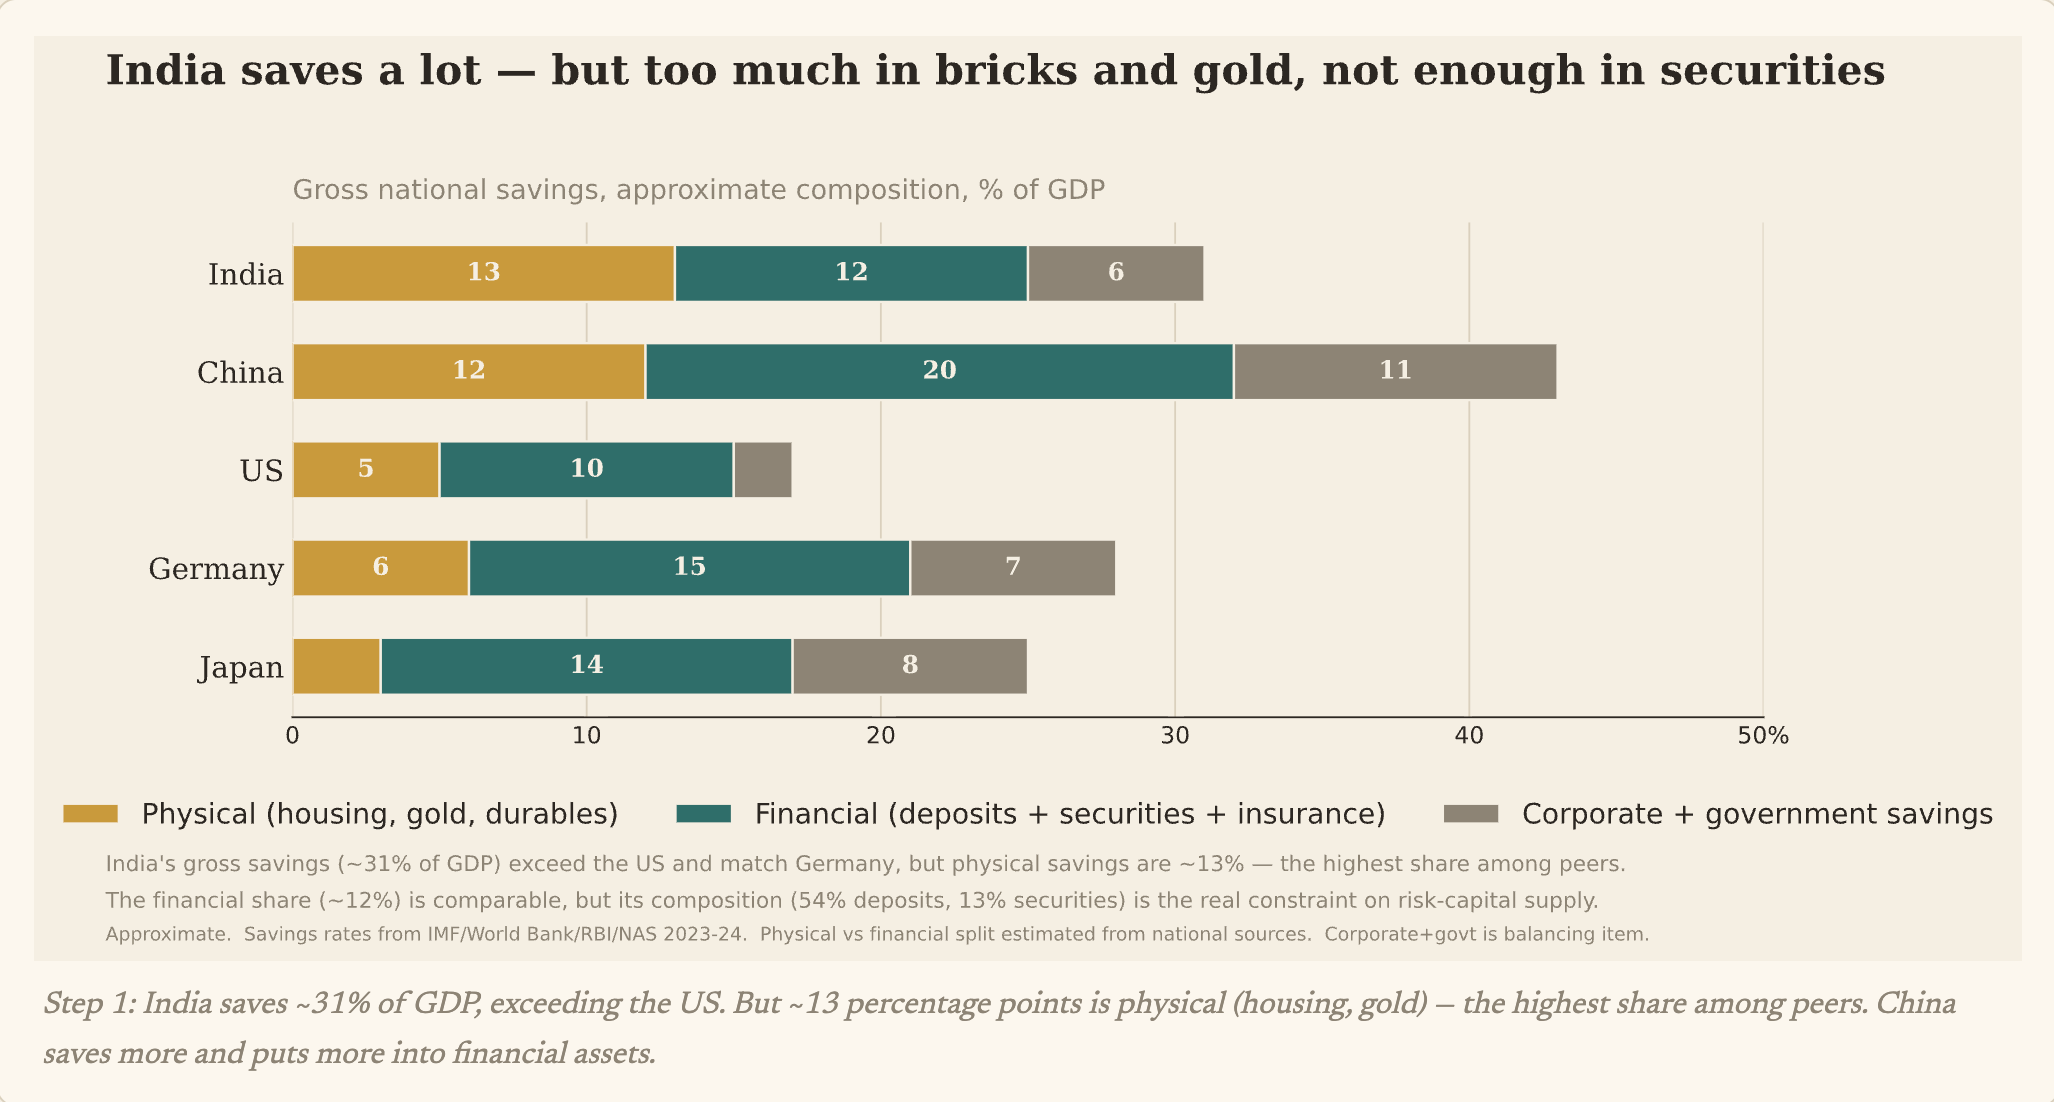
More disturbingly, 54% of the financial savings go into deposits, and just 13% goes into any kind of risk capital investments. On the positive side, 33% goes into long-term investments like insurance and pensions. 
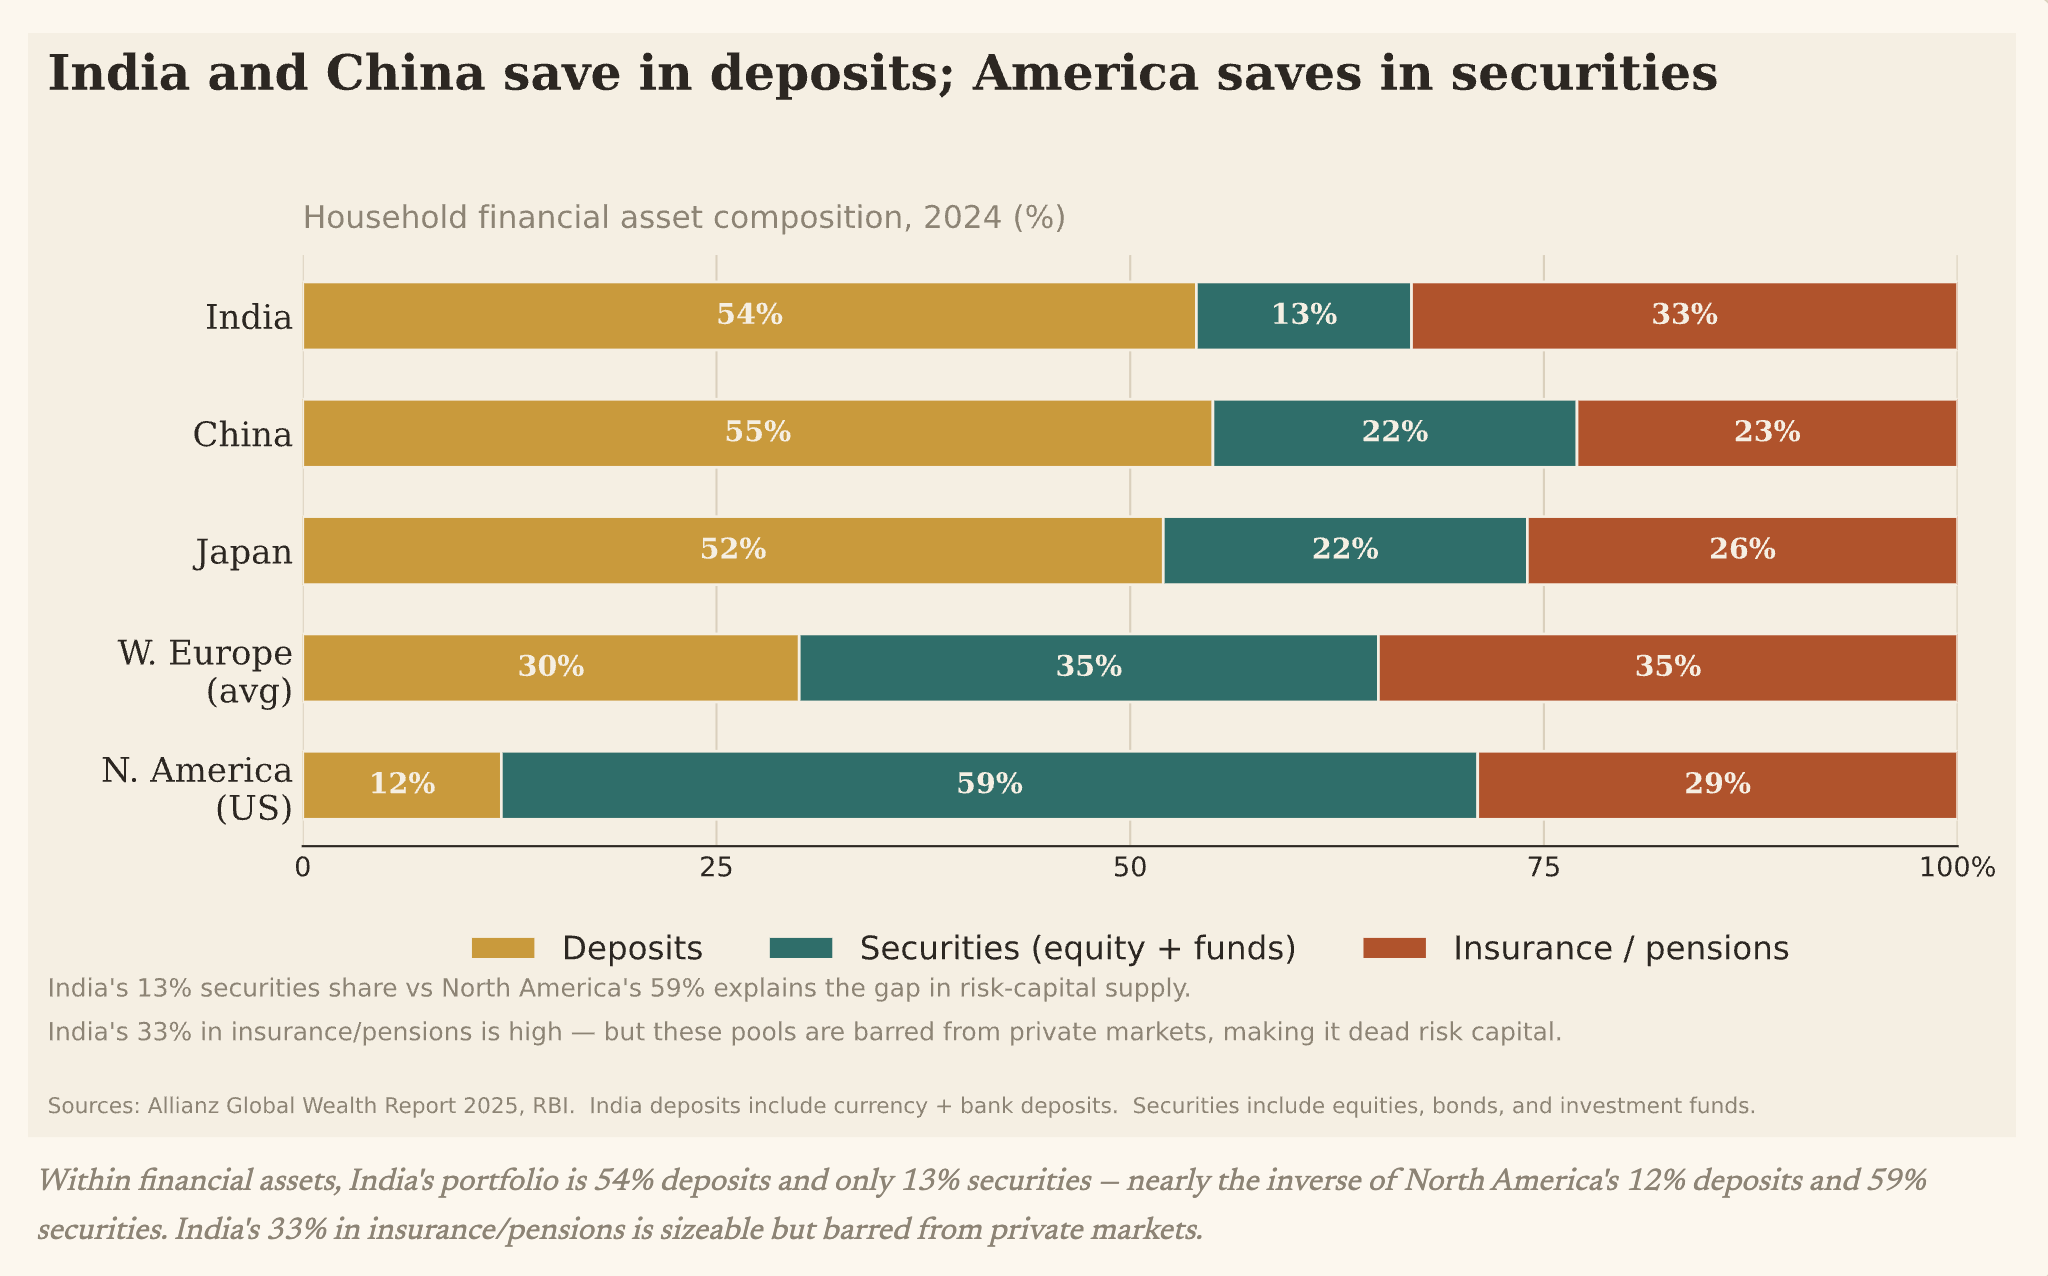
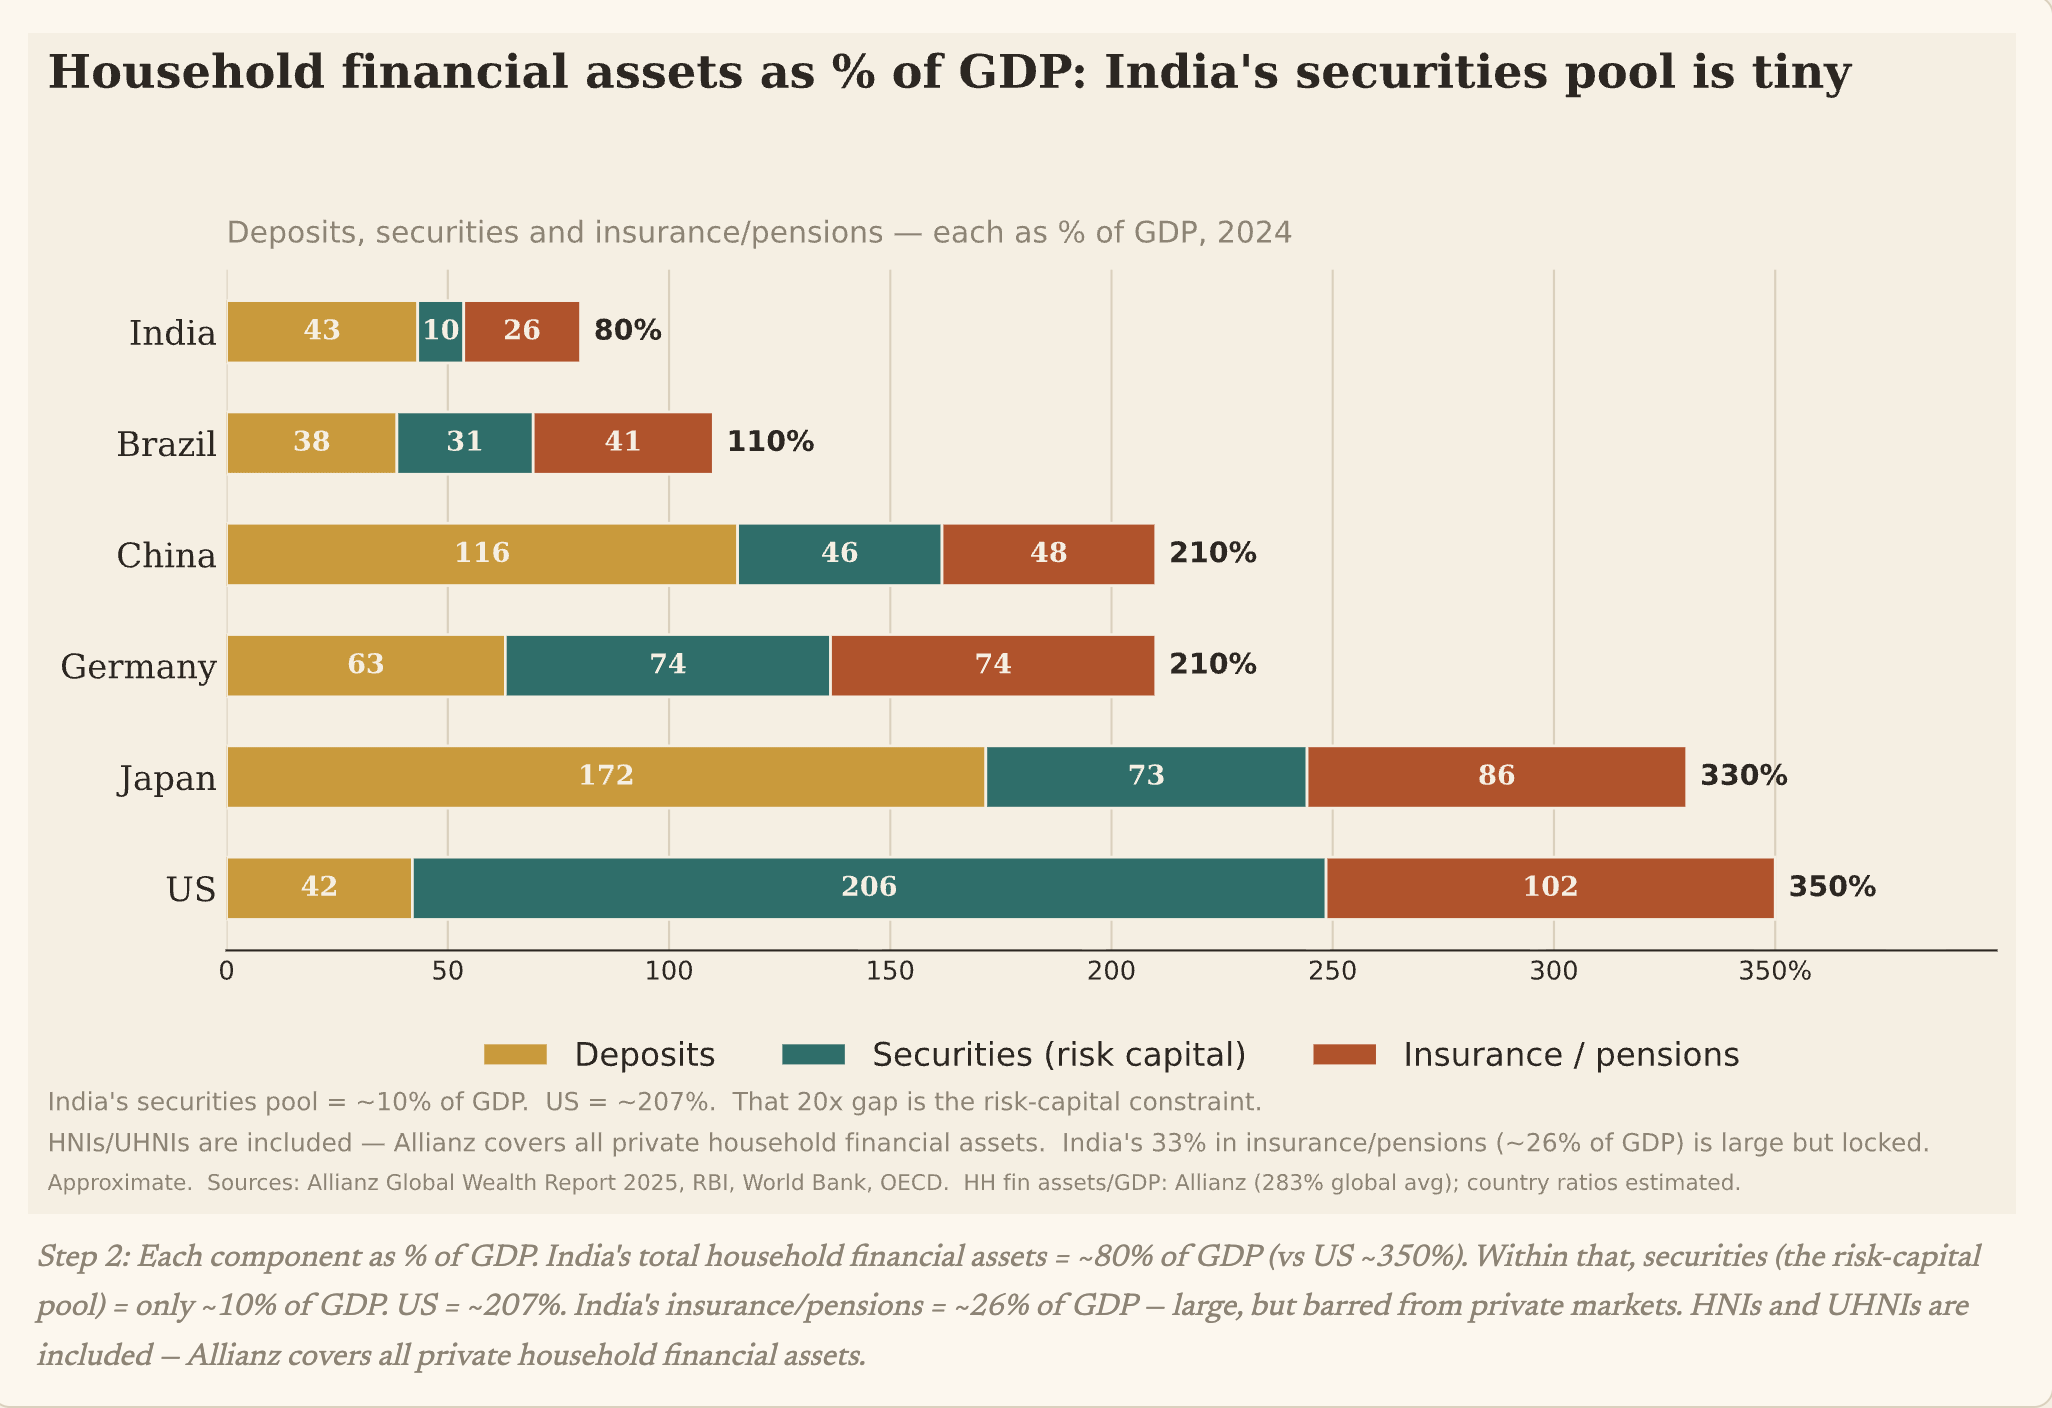
However, as a percentage of GDP, these numbers on financial savings pale in comparison to even its emerging market peers. Risk capital assets (public and private markets) make up just 10% of GDP. 
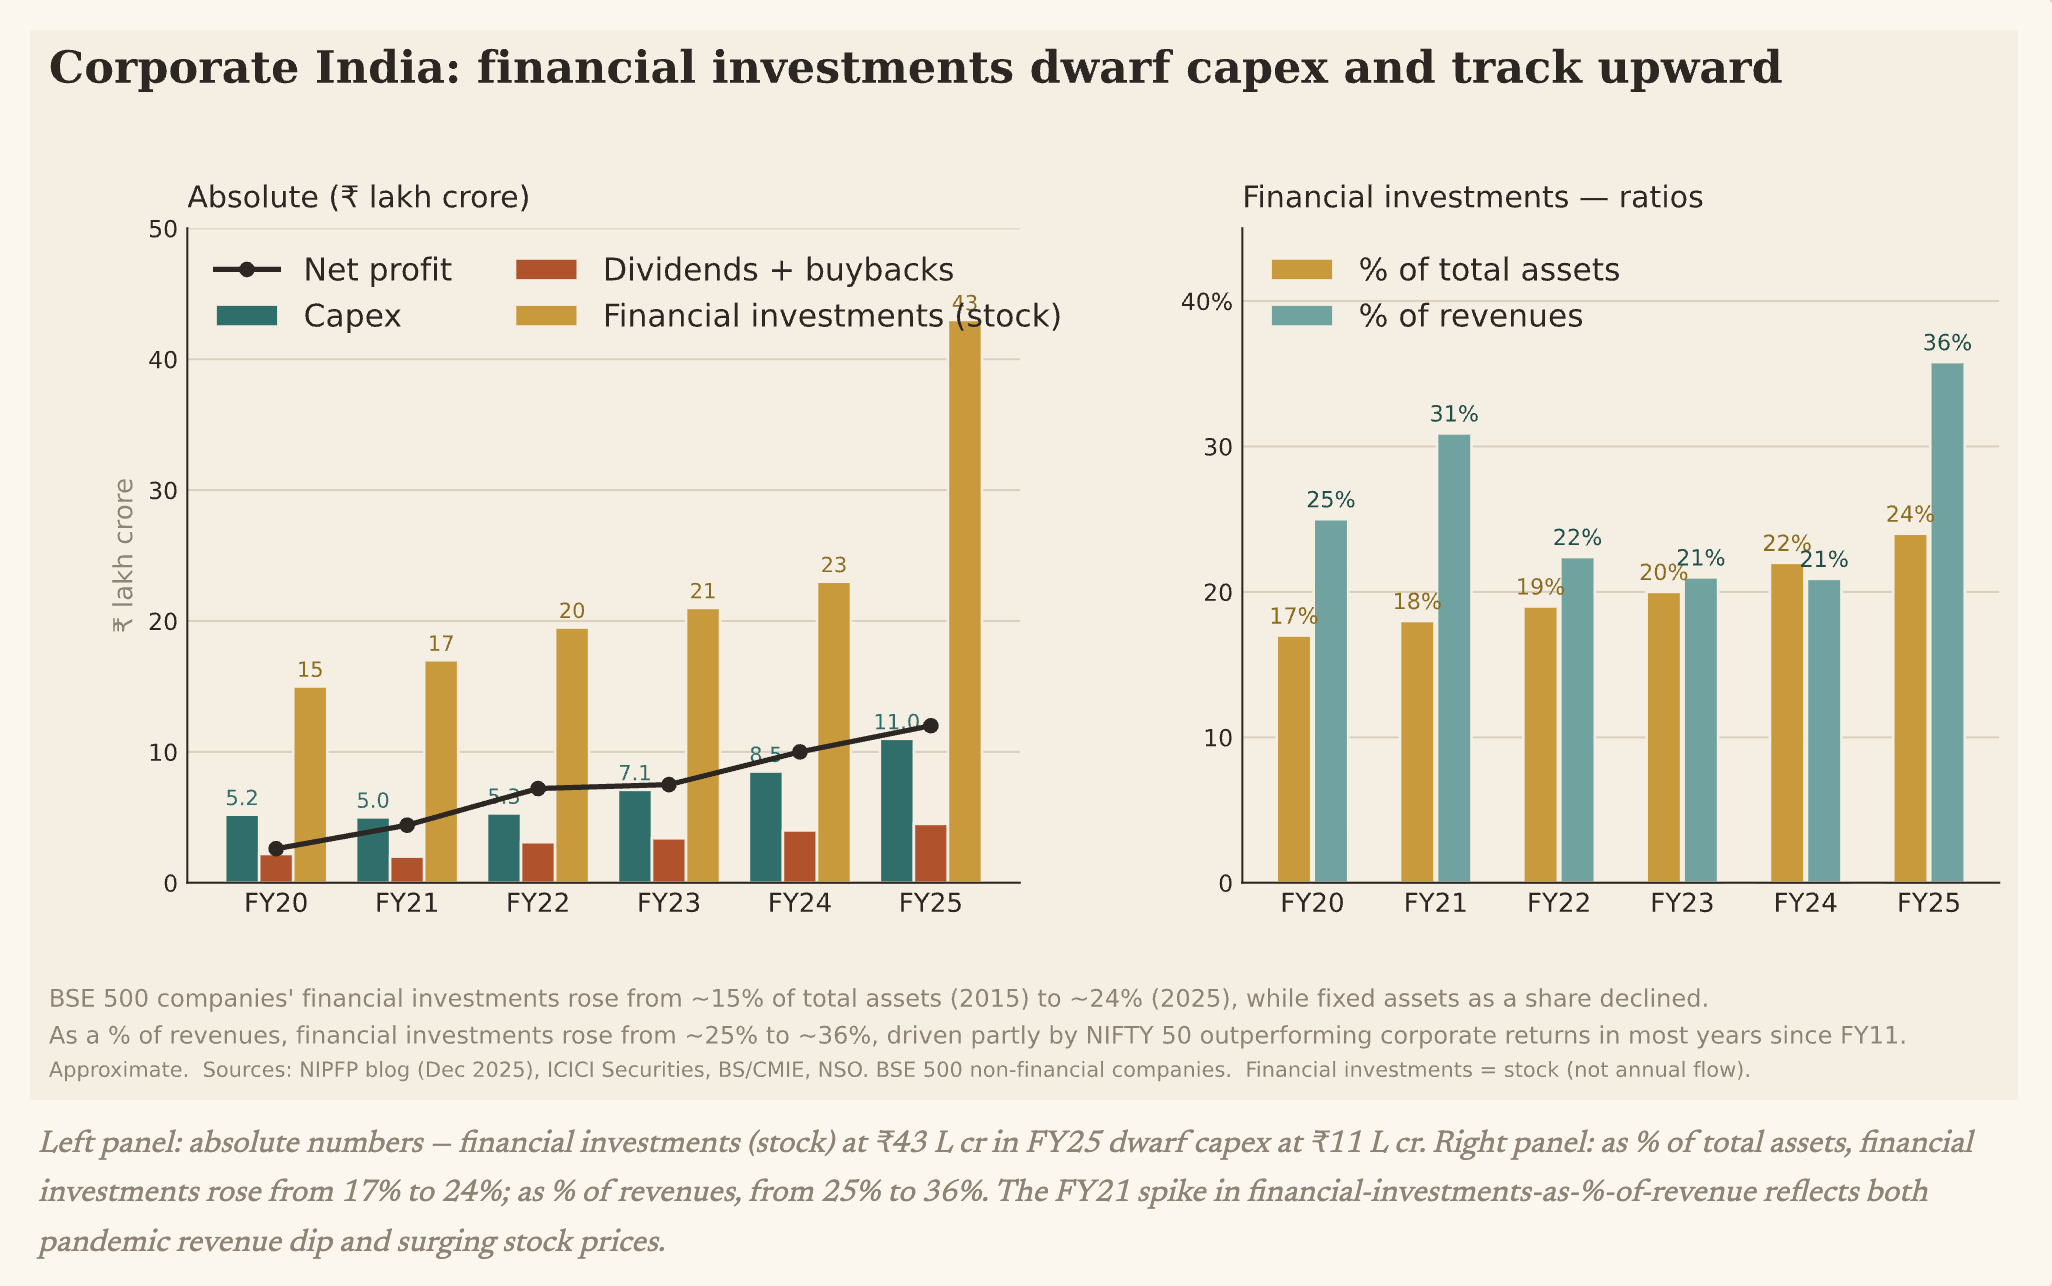
Interestingly, among corporates, financial investments and dividends and buybacks have been rising at the expense of capex, in both absolute and relative terms. 
Back to household savings. Within the basket going into securities, as the CRISIL/IVCA/360 ONE Unlocking Domestic Capital report informs, what goes into private markets, the genuine risk capital, is a tiny sliver. And this is a big problem. The envelope of capital available for business formation is truly small. 
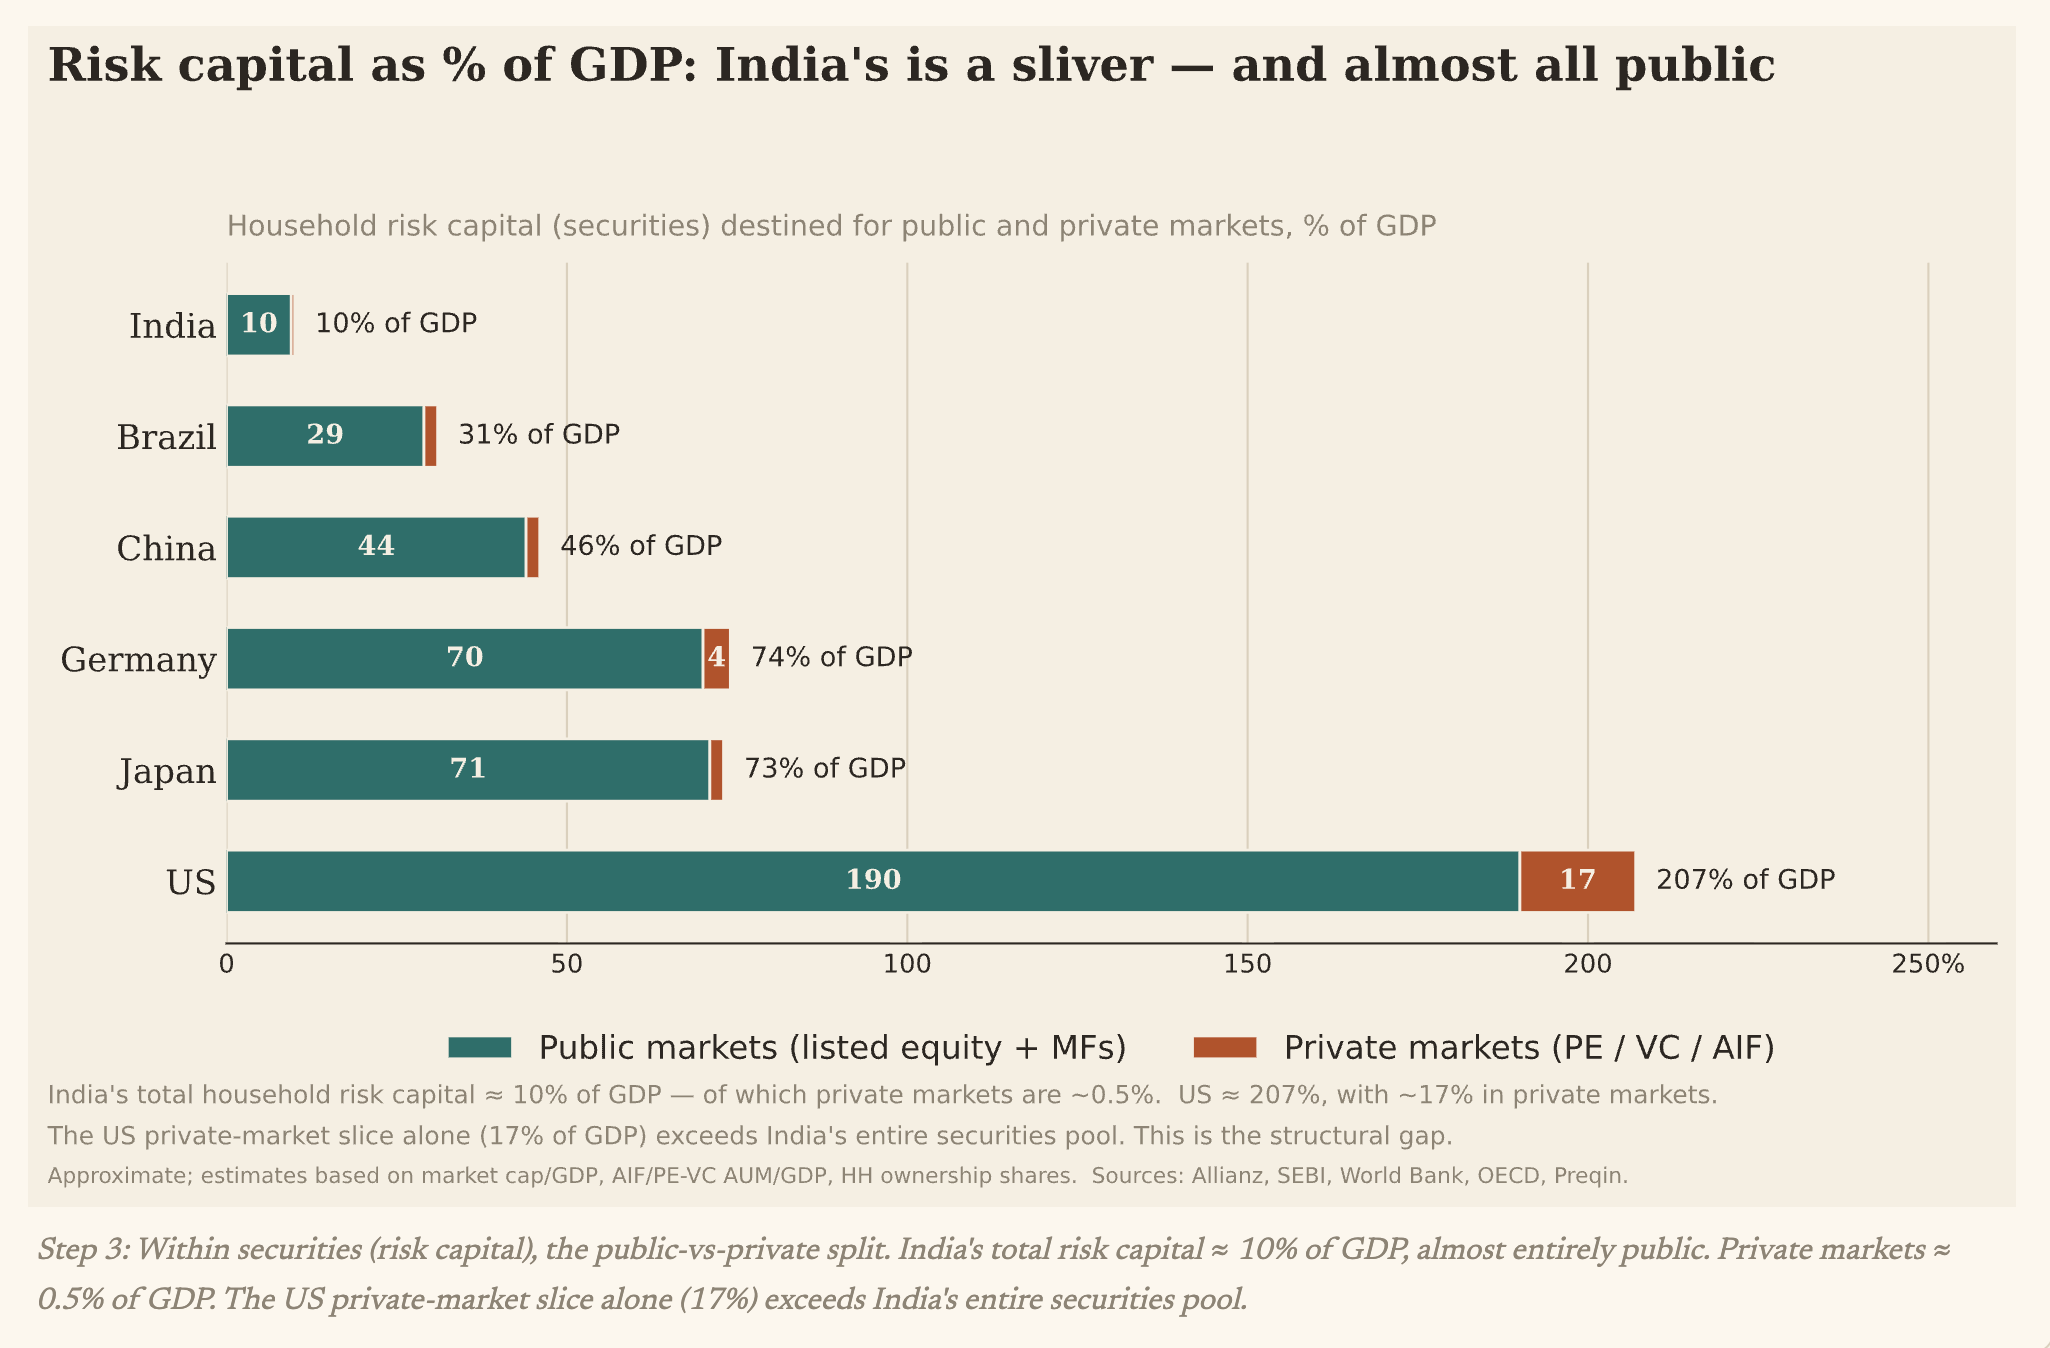
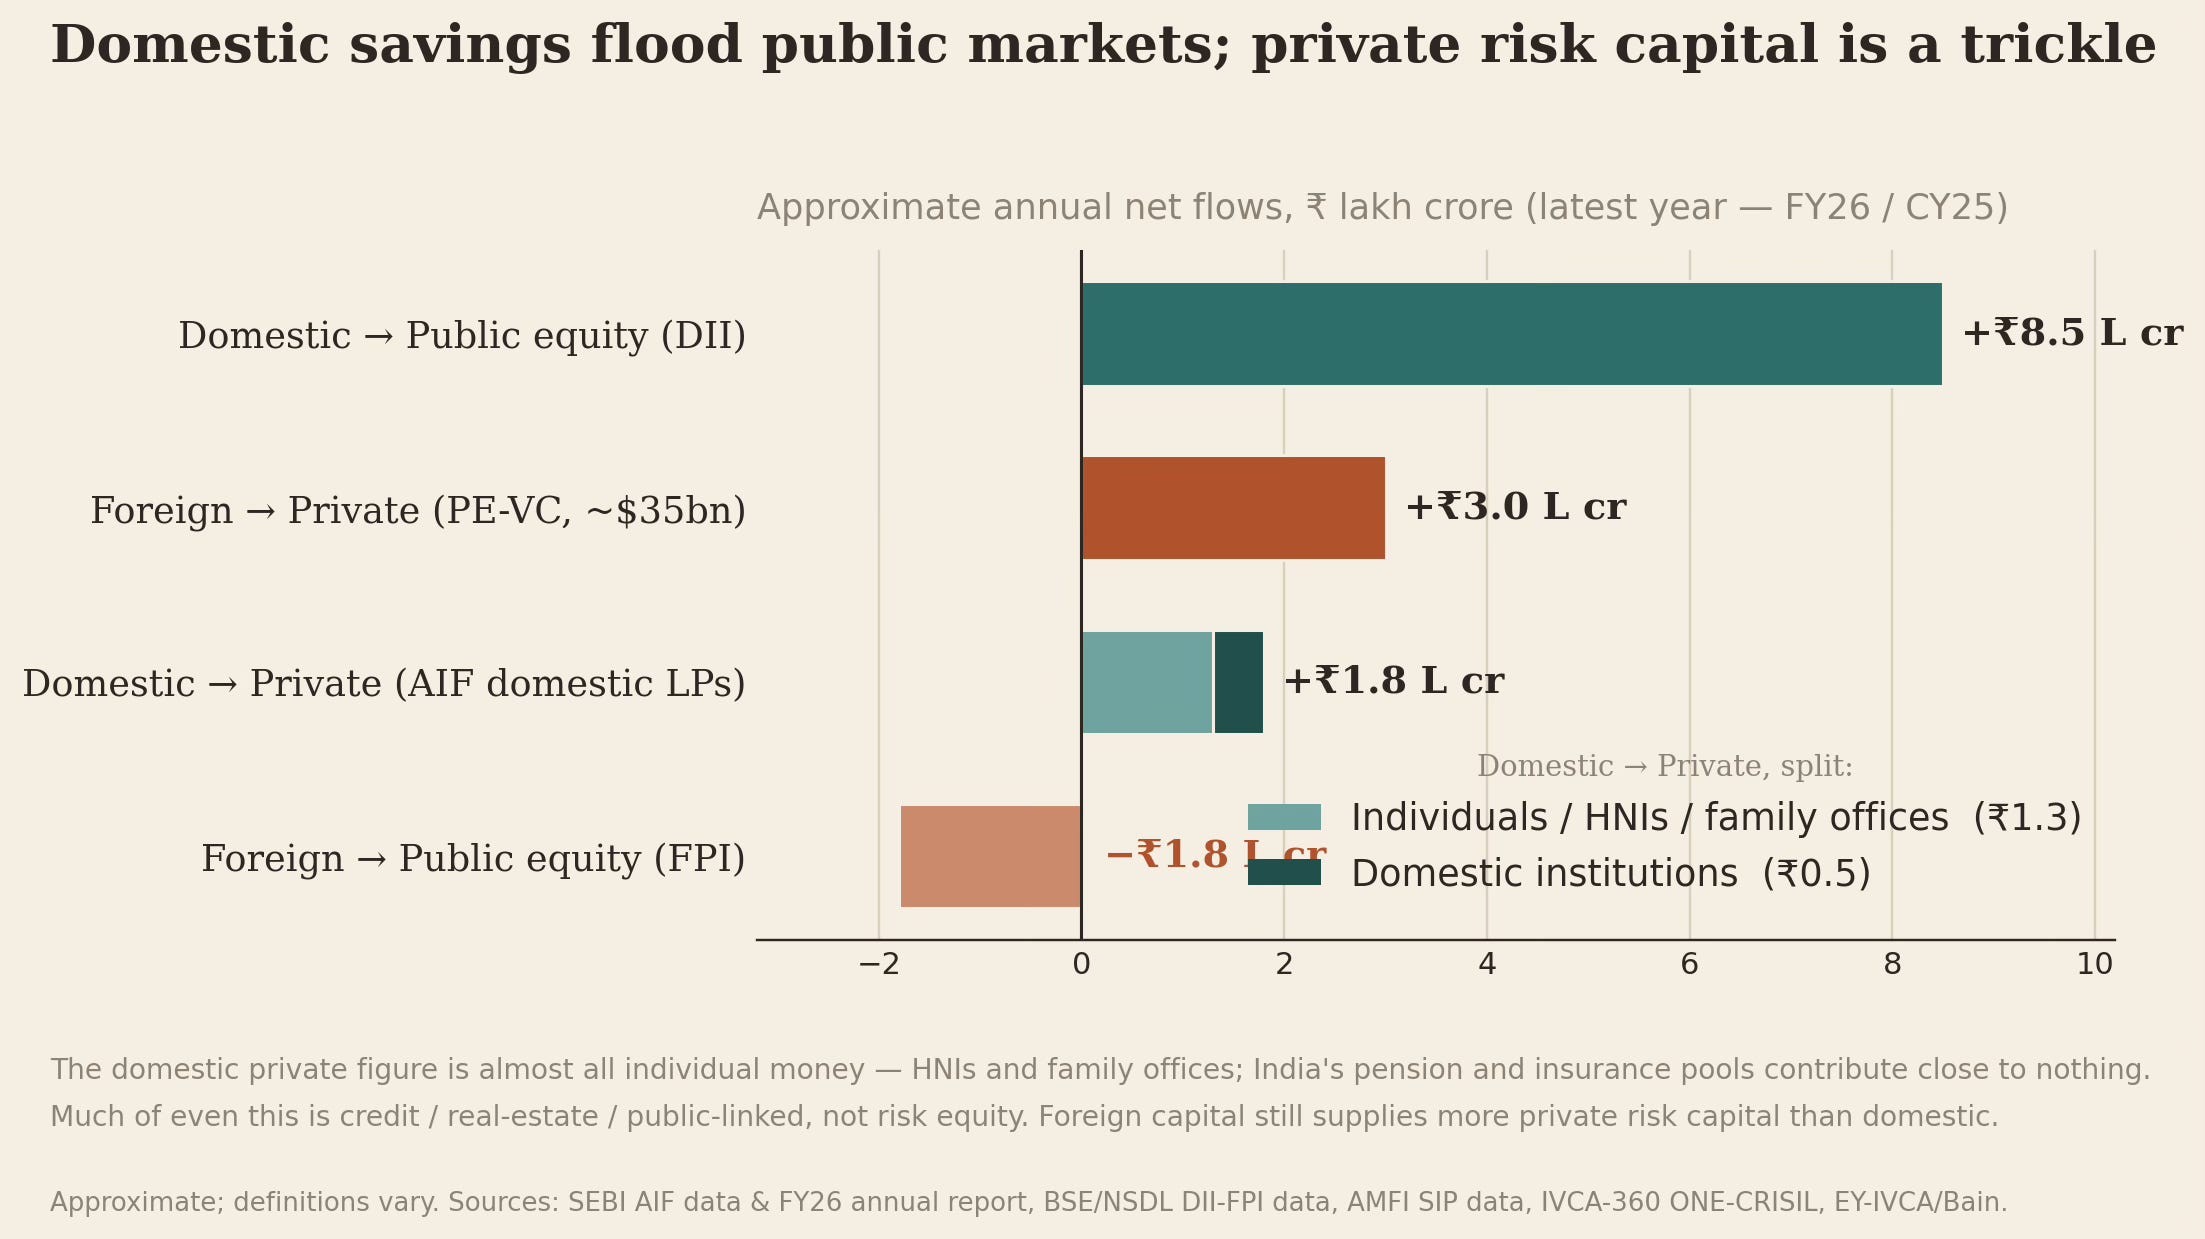
Let us disaggregate the risk capital basket further. Whereas roughly ₹1.5–2.0 lakh crore a year flows to private markets through domestic LPs in AIFs, much of that is private credit, real estate, and Category-III (hedge funds, private-public hybrids) rather than genuine growth equity. So domestic public-equity inflows run at four to five times domestic private risk capital, and foreign investors still supply much more private risk capital (₹3.0 lakh crore) than Indians do. 

All this means that we have a very interesting situation where, while foreigners are net sellers of listed equity, they remain the dominant suppliers of private capital. In stark contrast, domestic money flows the other way.
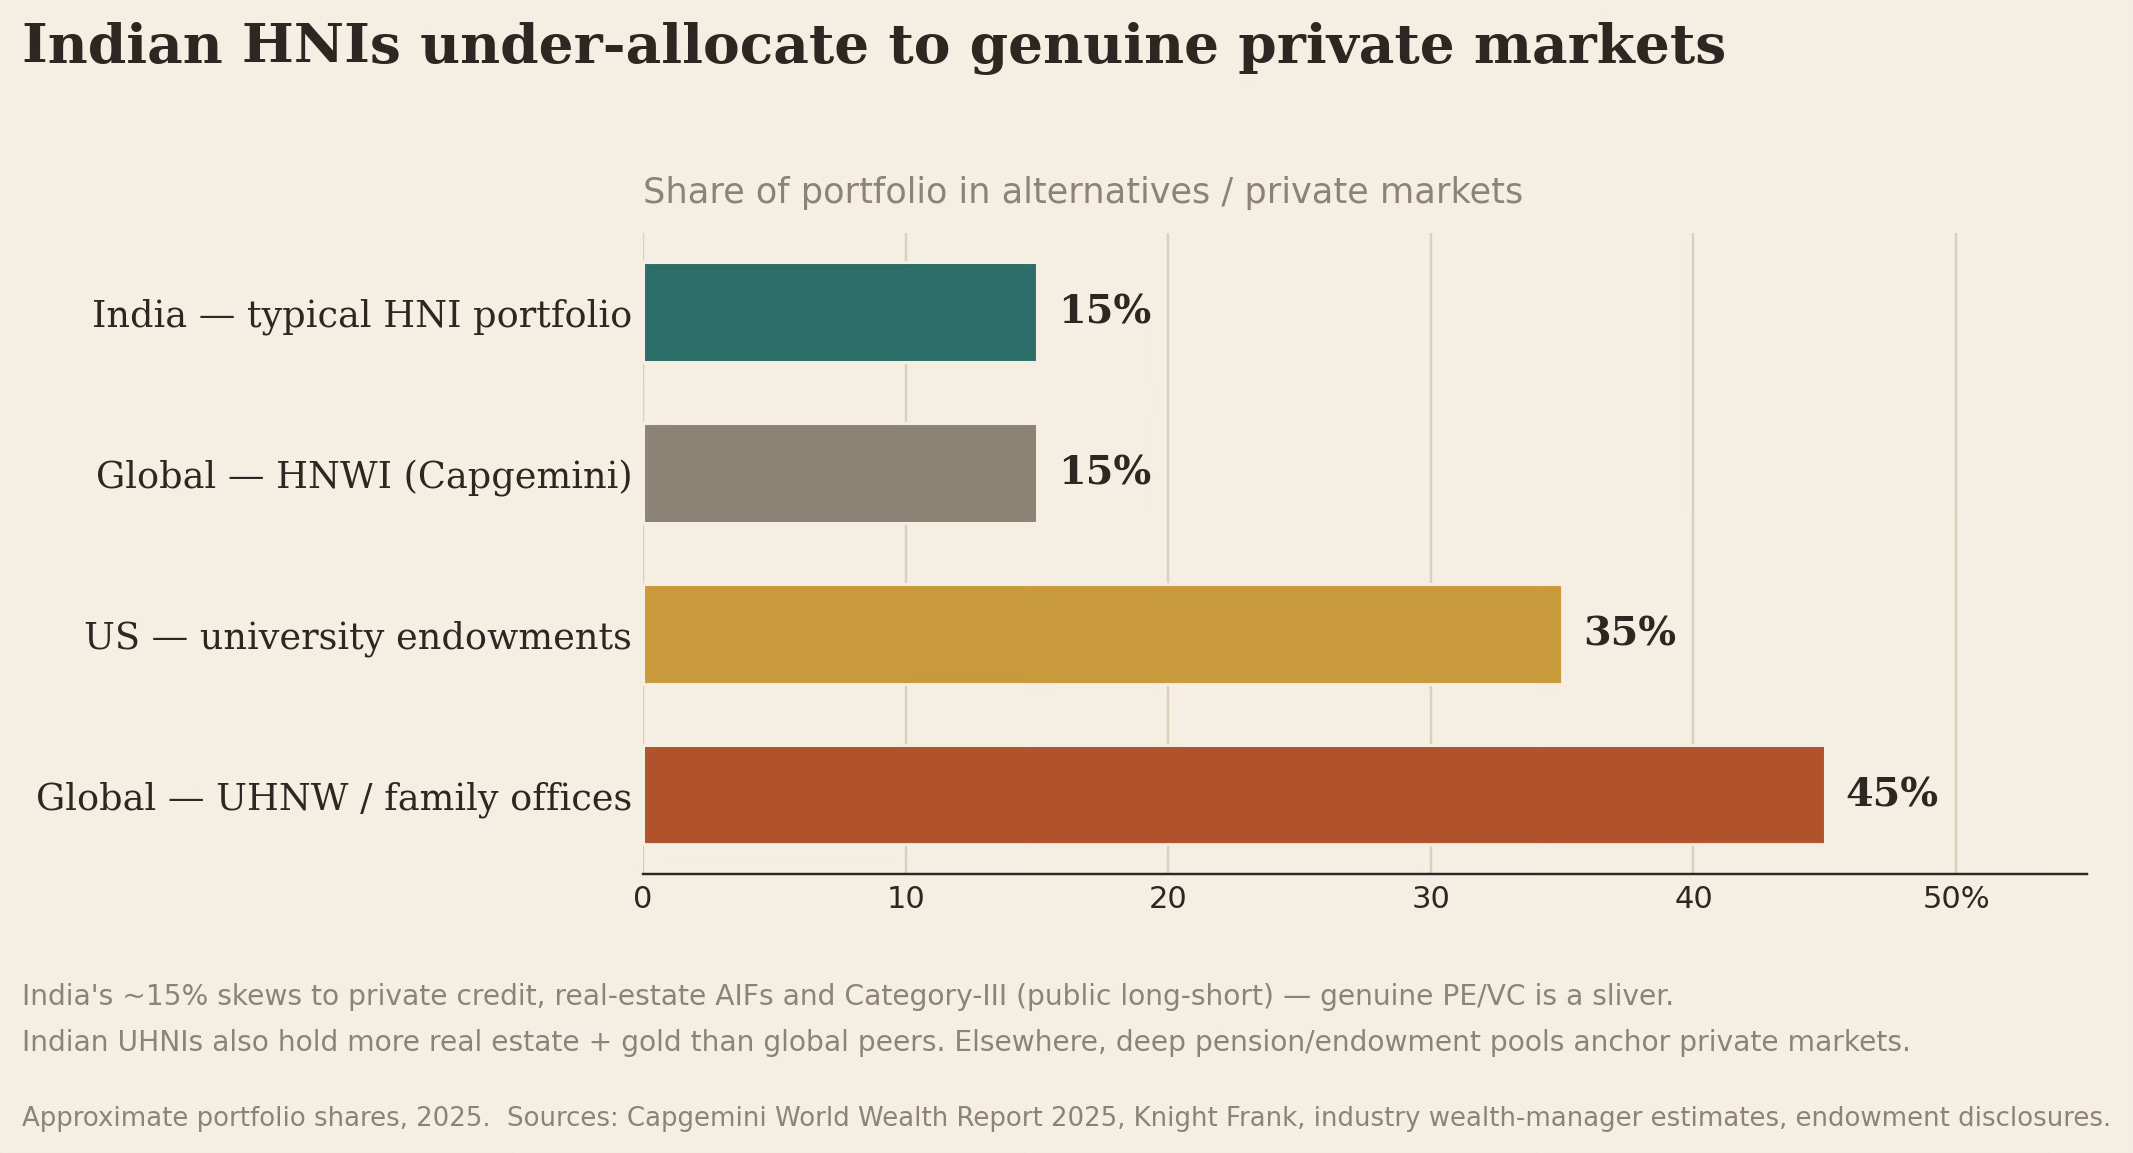
Indian HNIs park around 15% of portfolios in alternatives, the same as global HNIs. The gap opens for the segment that actually anchors private markets, the ultra-UHNW investors and family offices who allocate 40–50% to alternatives, with private equity typically the single largest bucket. In contrast, Indian UHNIs hold more real estate and gold than global peers and route their alternatives into yield and public-linked structures. In other words, Indian private wealth under-supplies illiquid equity risk, not alternatives in general.
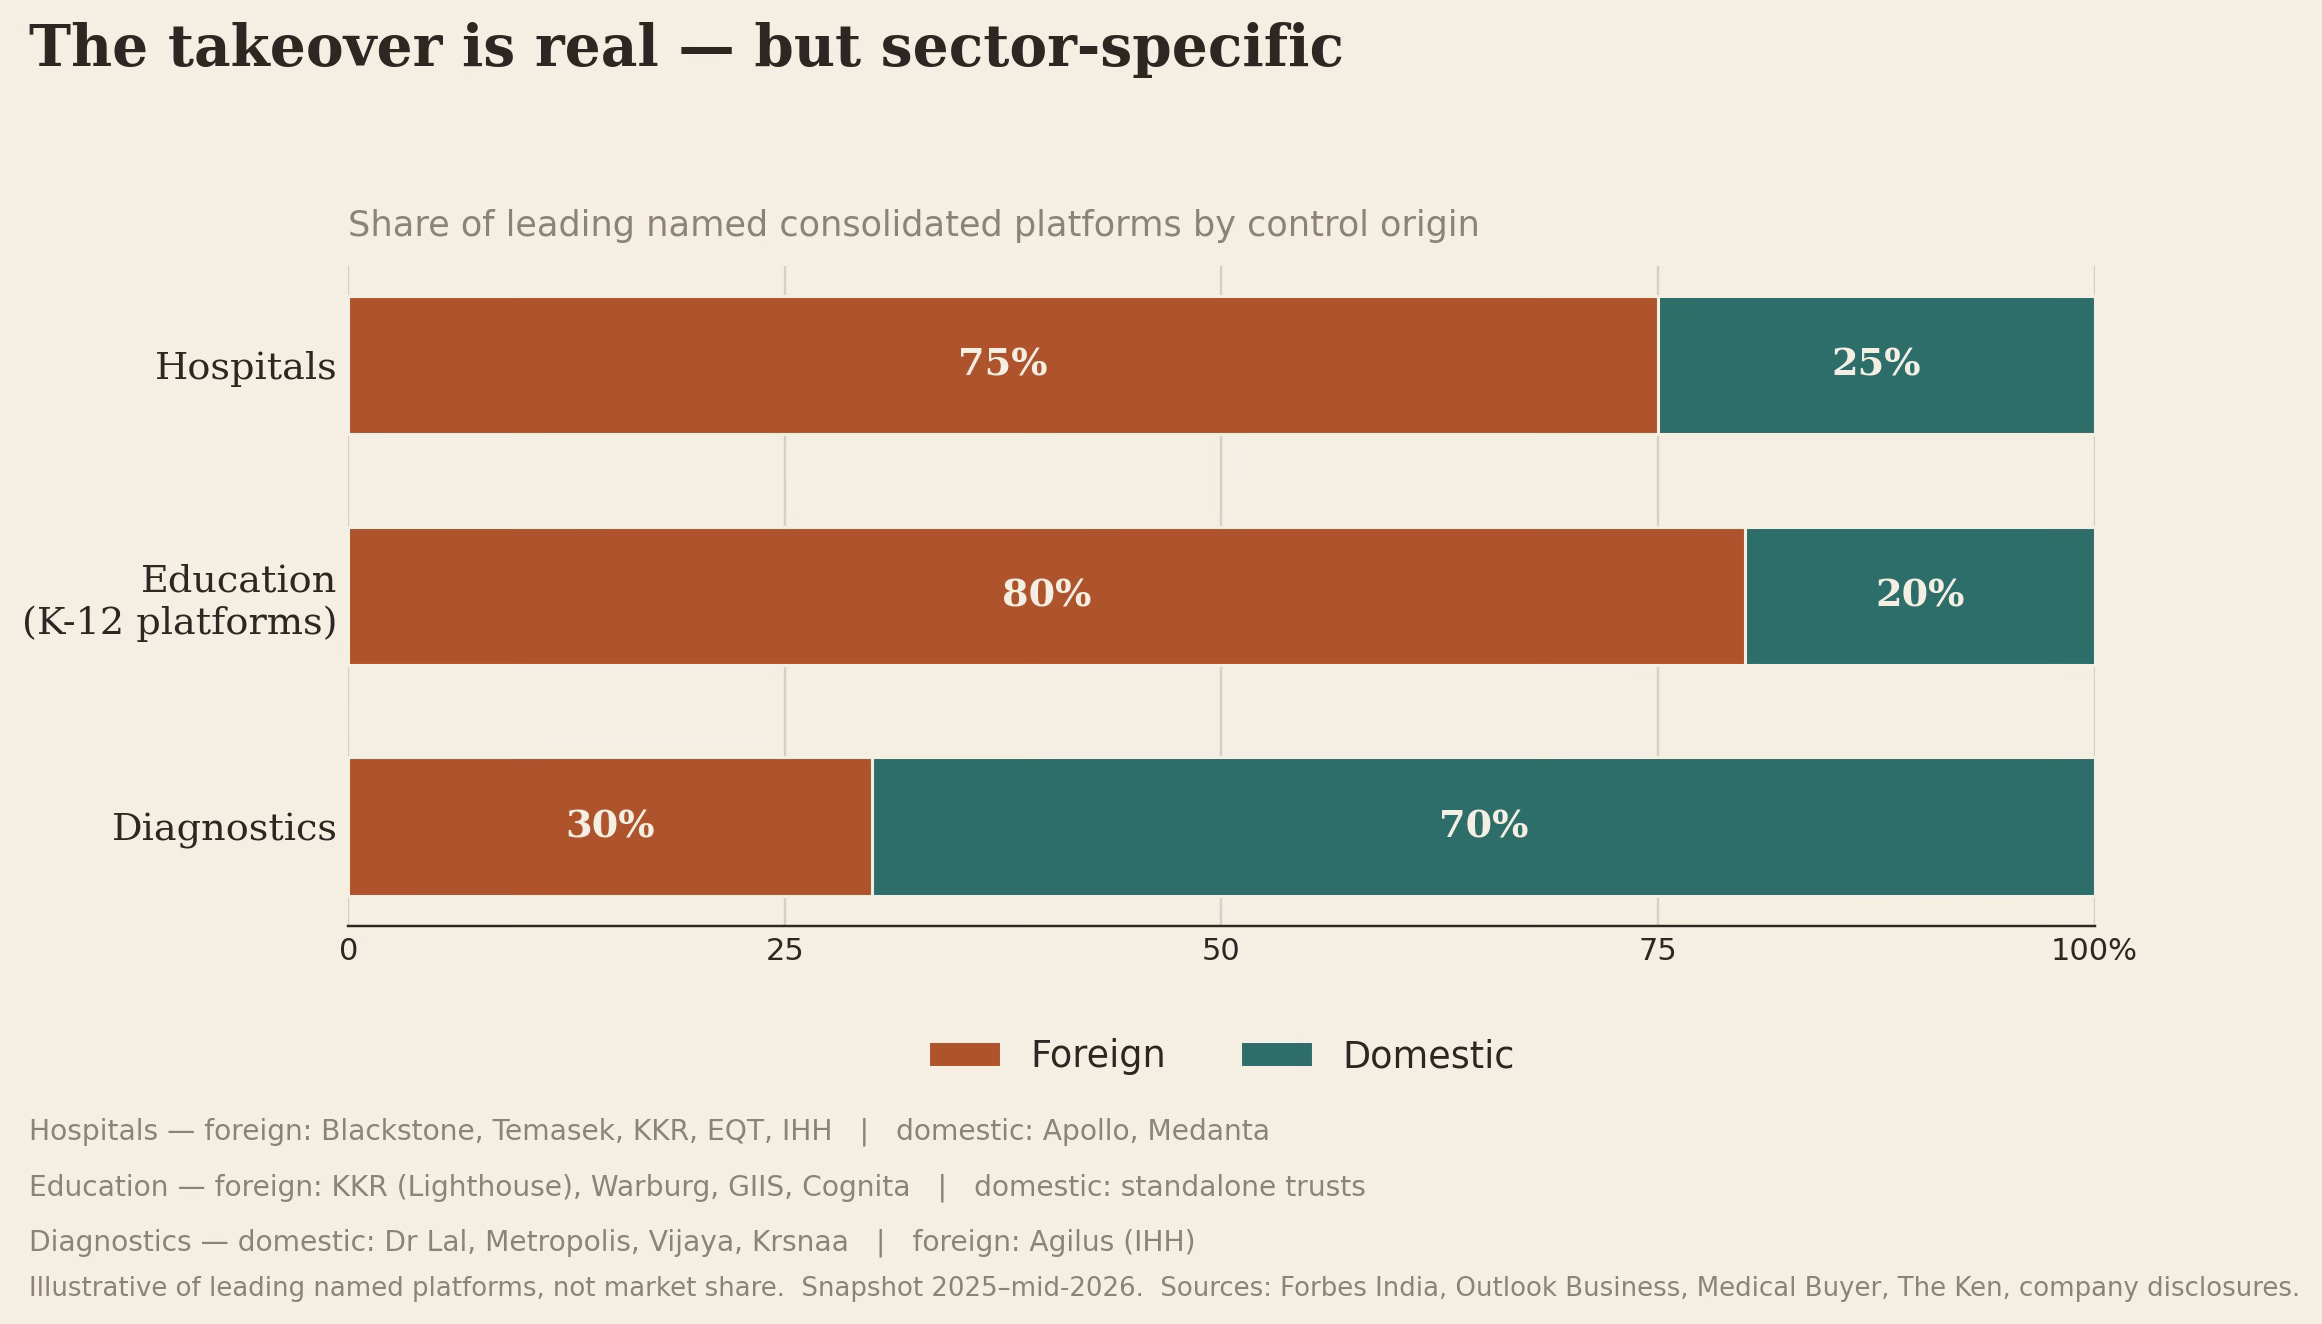
This scarcity of private risk capital makes India, with its very large foreign investor base, very attractive for foreign Global PE and sovereign funds put roughly $15.5bn into Indian healthcare over the past five years, with hospitals taking about 68% of it. For example, Blackstone holds around 80% of KIMS Kerala and 73% of Care Hospitals, and Temasek holds about 59% of Manipal. The domestic exceptions are the listed, promoter-anchored chains like Apollo and Medanta/Global Health. Much of the foreign PE inflows are actually SWF/pension capital. In education, it is the K-12 market that is attracting the attention of foreign PEs. 
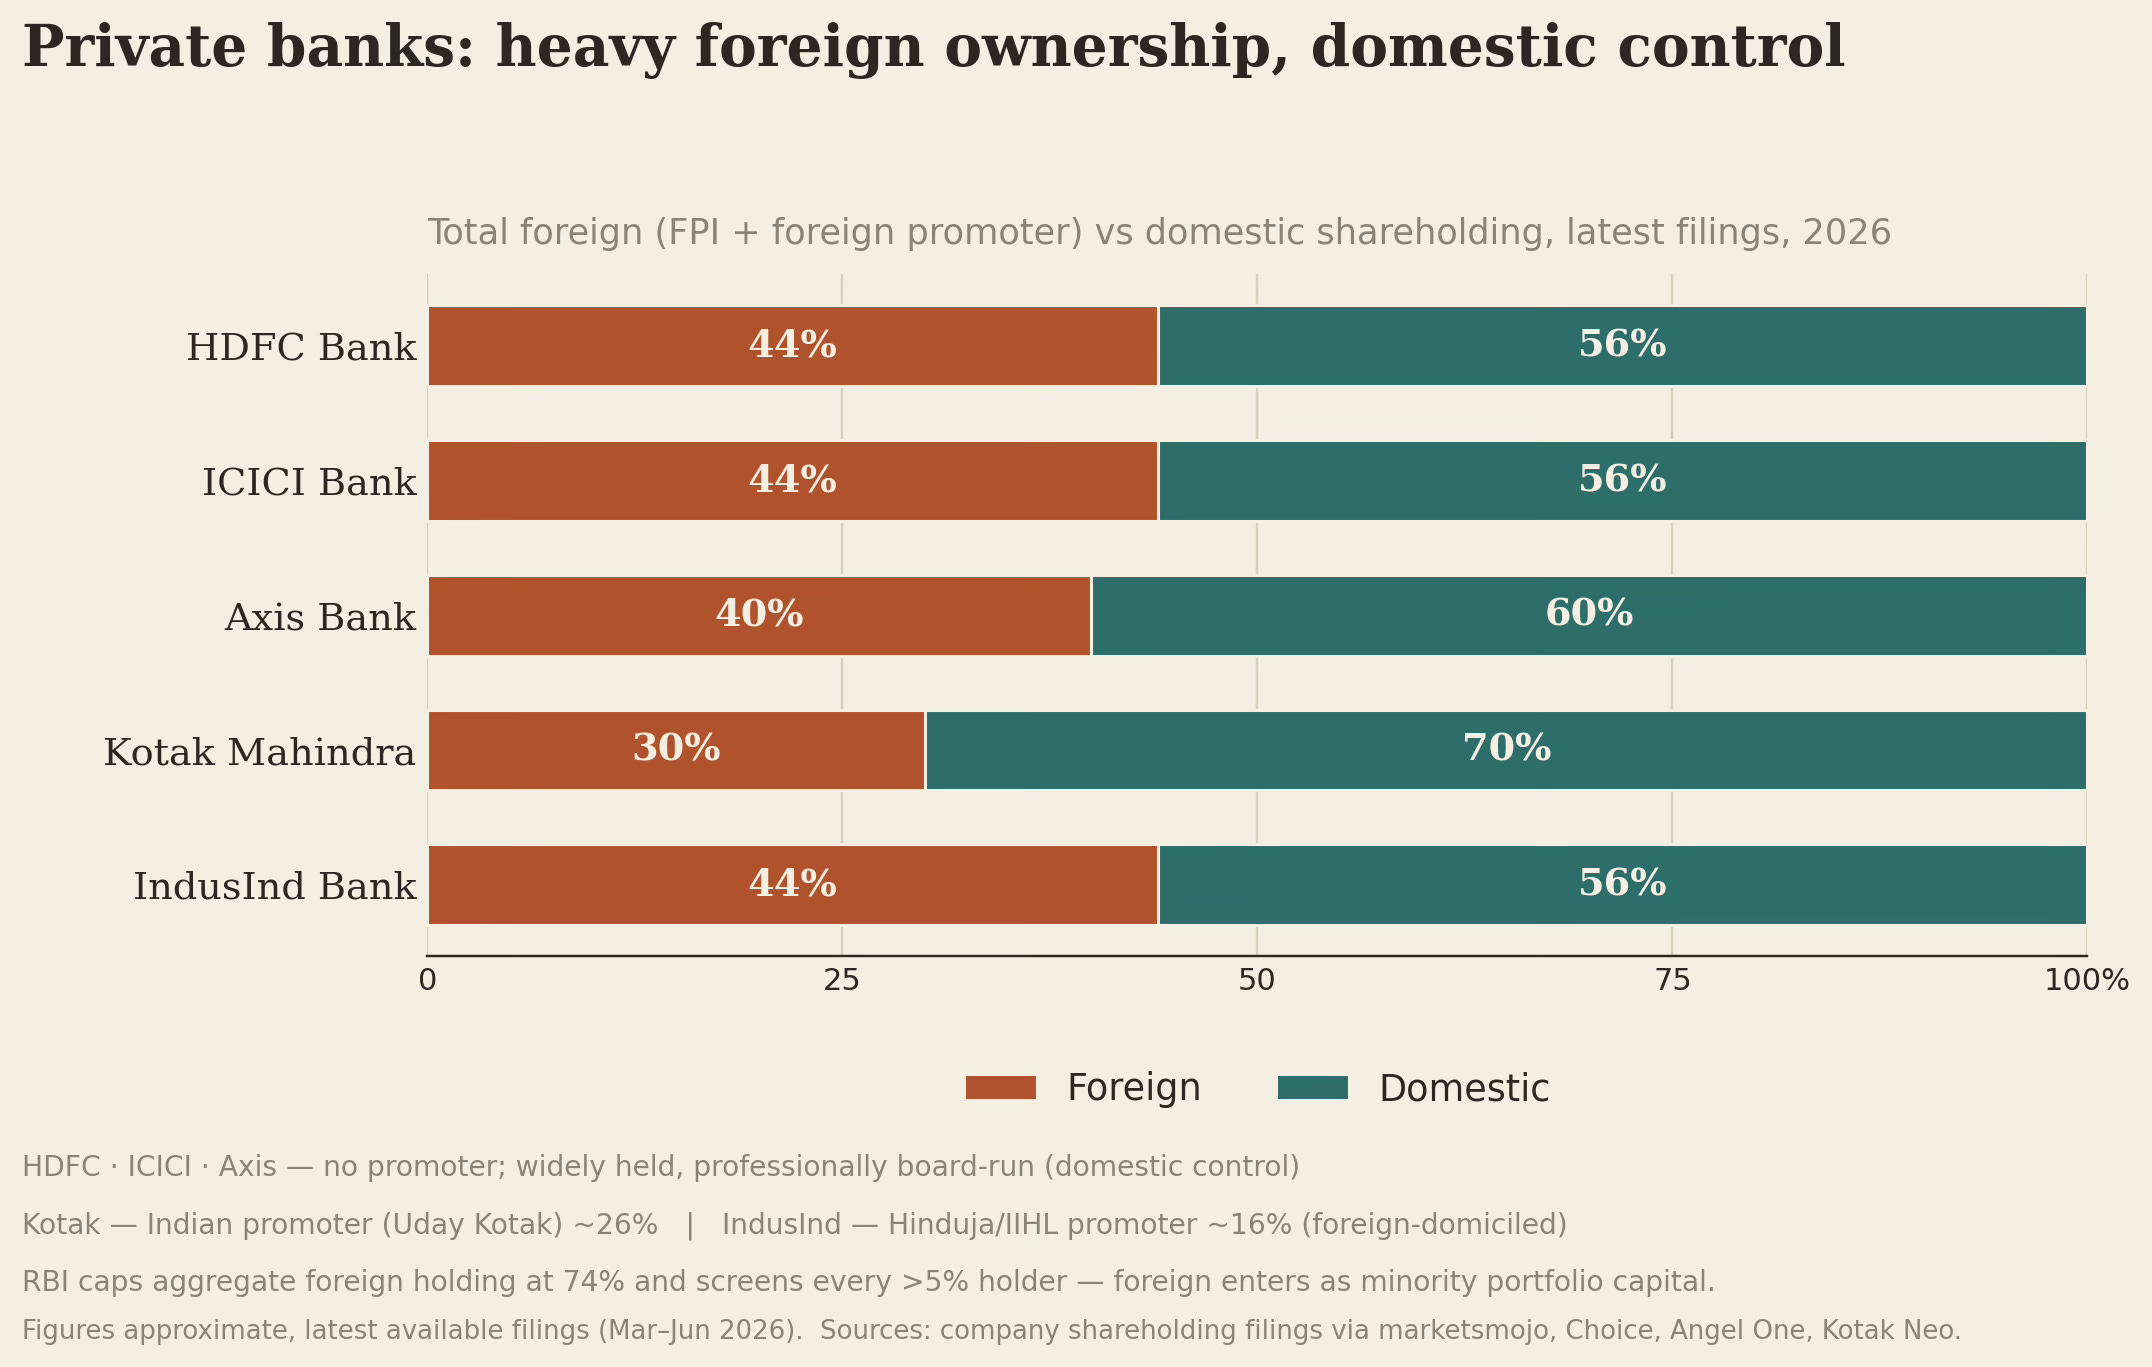
Banking is a counter-example where heavy foreign capital and domestic control coexist perfectly well. This is also because a sectoral regulator caps ownership, screens holders, and enforces diffusion. 
India’s risk capital challenge starts with unlocking the roughly two-thirds of household savings that sit in real estate and gold, and further increasing the share that goes into risky capital investments, specifically private risk capital markets. 

So how have been the trends over time?

Encouragingly, the share of household financial savings going into public equity and mutual funds has grown from 15% to 23% over the 2019-25 period. Thanks to mutual funds and SIPs, the number of individuals investing in capital markets has risen nearly fivefold since 2020 to around 135 million. This has been a truly transformational change, a genuine big-bang success. 
For context, domestic institutions poured a record ₹8.5 lakh crore into equities in FY26, of which mutual funds supplied ₹6.4 lakh crore, while foreign portfolio investors were net sellers of ₹1.8 lakh crore. That domestic flow is driven by SIPs, which came at around ₹28,464 crore a month (or about ₹3.4 lakh crore a year) across 9.7 crore accounts. Further, in a reflection of the trend of exodus of foreign capital from the equity market, the domestic institutional ownership of NSE-listed stocks crossed foreign ownership in 2025 (roughly 17–19% versus FPIs’ 17–18%) for the first time. 

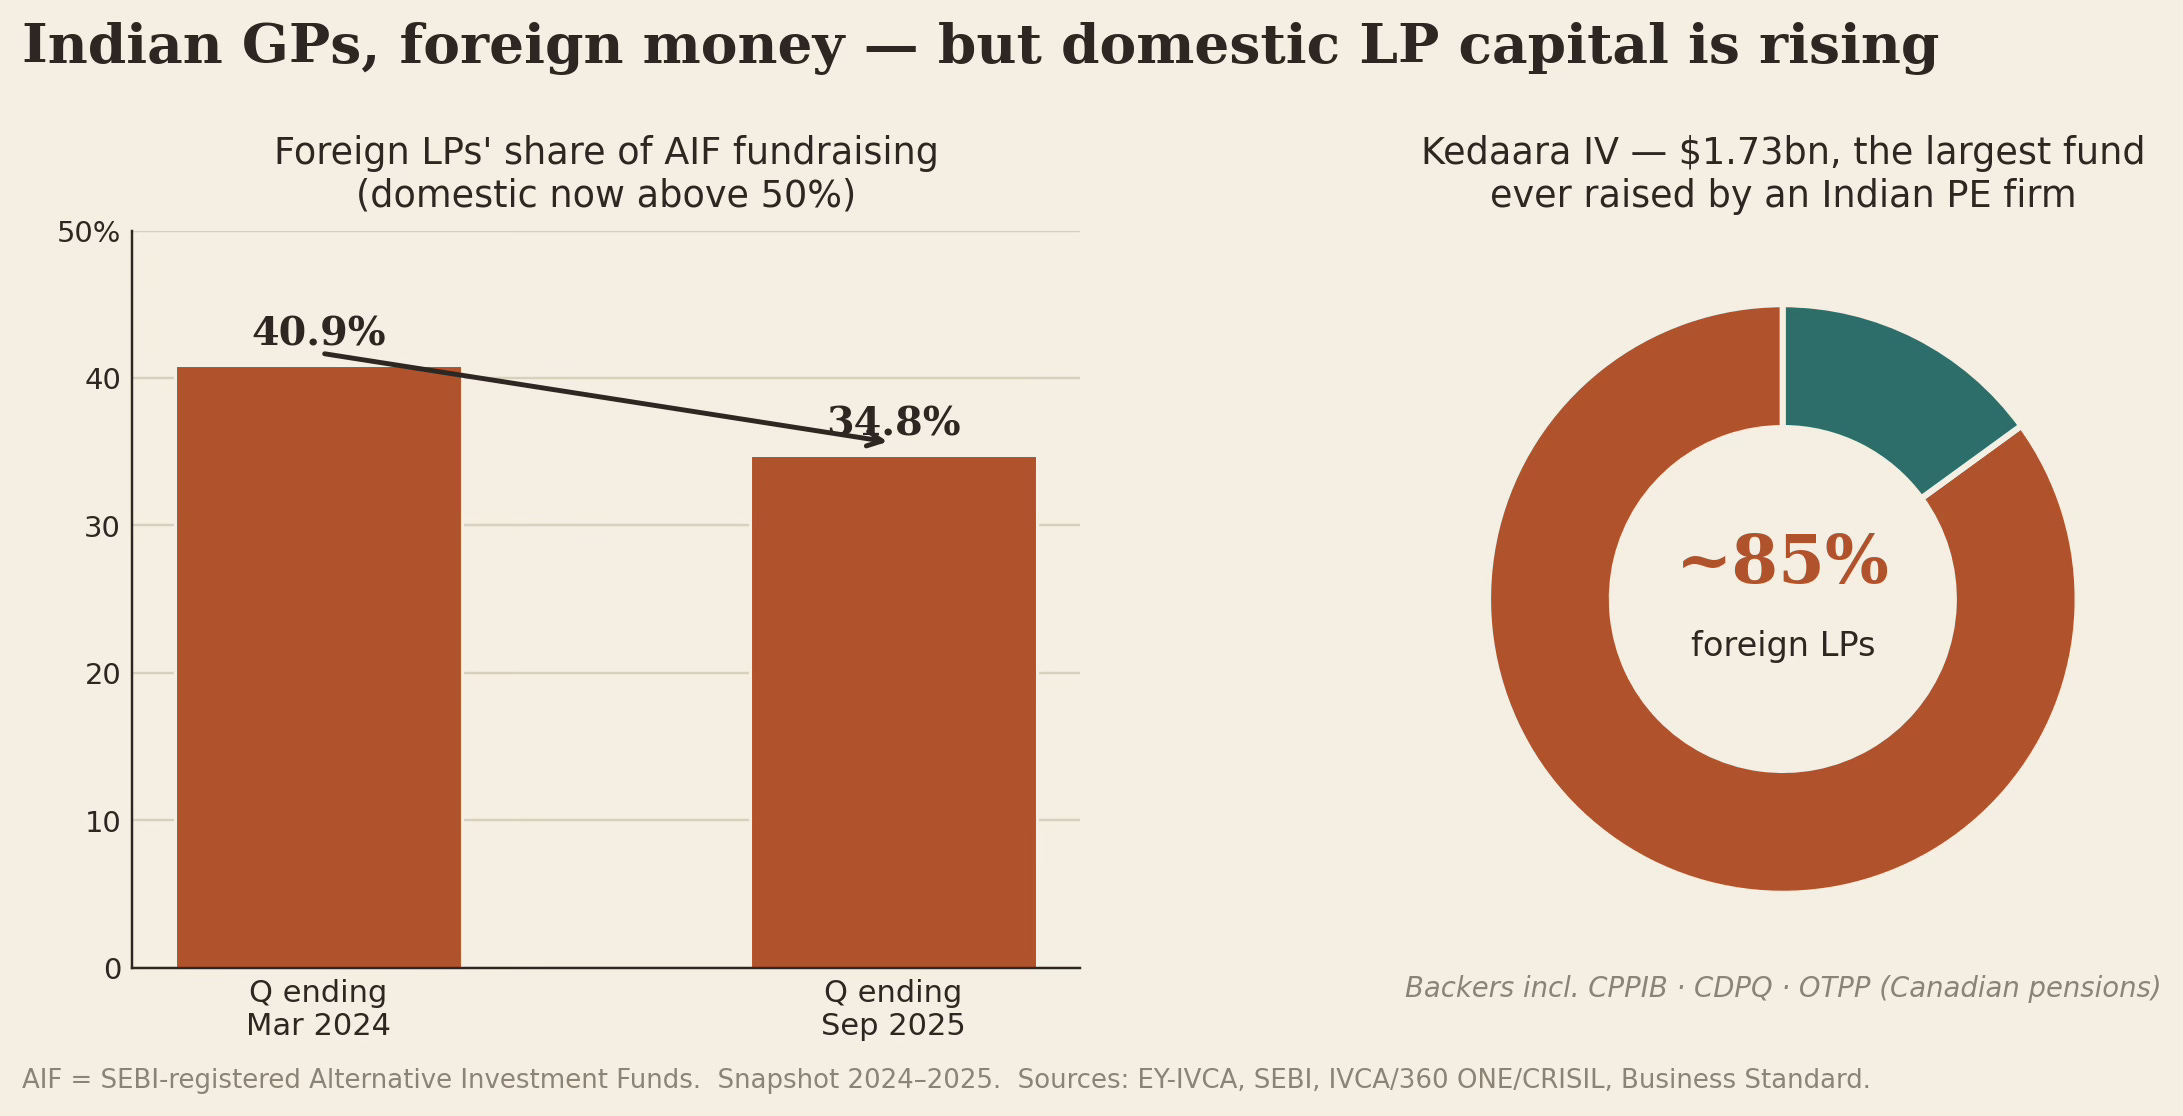
On the private capital side, for a long time, even for Indian GPs, the majority of capital raising came from foreign LPs. As an illustration, 85% of the funds raised in India’s largest PE fund came from foreign LPs. Large control buyouts remain predominantly foreign. However, encouragingly, Indian LPs have been stepping up. Foreign LPs’ share of AIF fundraising by Indian GPs has been declining, now contributing only about a third of the total capital raised. 
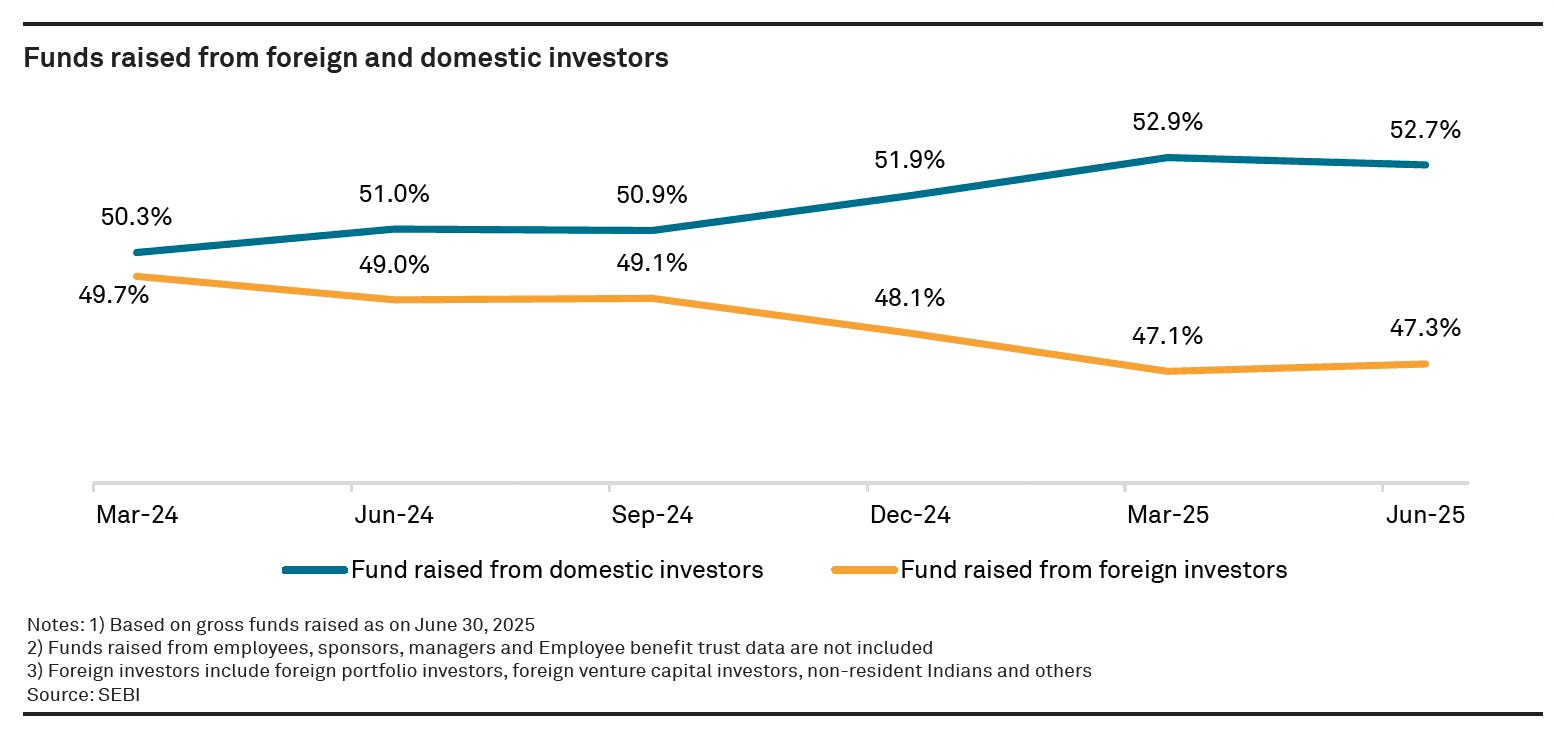
In the aggregate for all private capital raising too, Indian investors are stepping up. The CRISIL/IVCA/360 ONE Unlocking Domestic Capital report shows that domestic investors have now surpassed foreign investors in fundraising by Category I and II AIFs. The share of domestic investors as a percentage of gross funds raised across them has touched 52.7% by June 2025.
The good thing is that the domestic private pool, especially the AIF commitments, is growing fast. AIF commitments climbed from roughly ₹6.4 lakh crore (Mar 2022) to ₹8.3 (Mar 2023), ₹11.3 (Mar 2024), ₹13.5 (Mar 2025) and ₹16.94 lakh crore by March 2026, a near 30% CAGR, with Category II (PE/RE/credit) about three-quarters of it. 

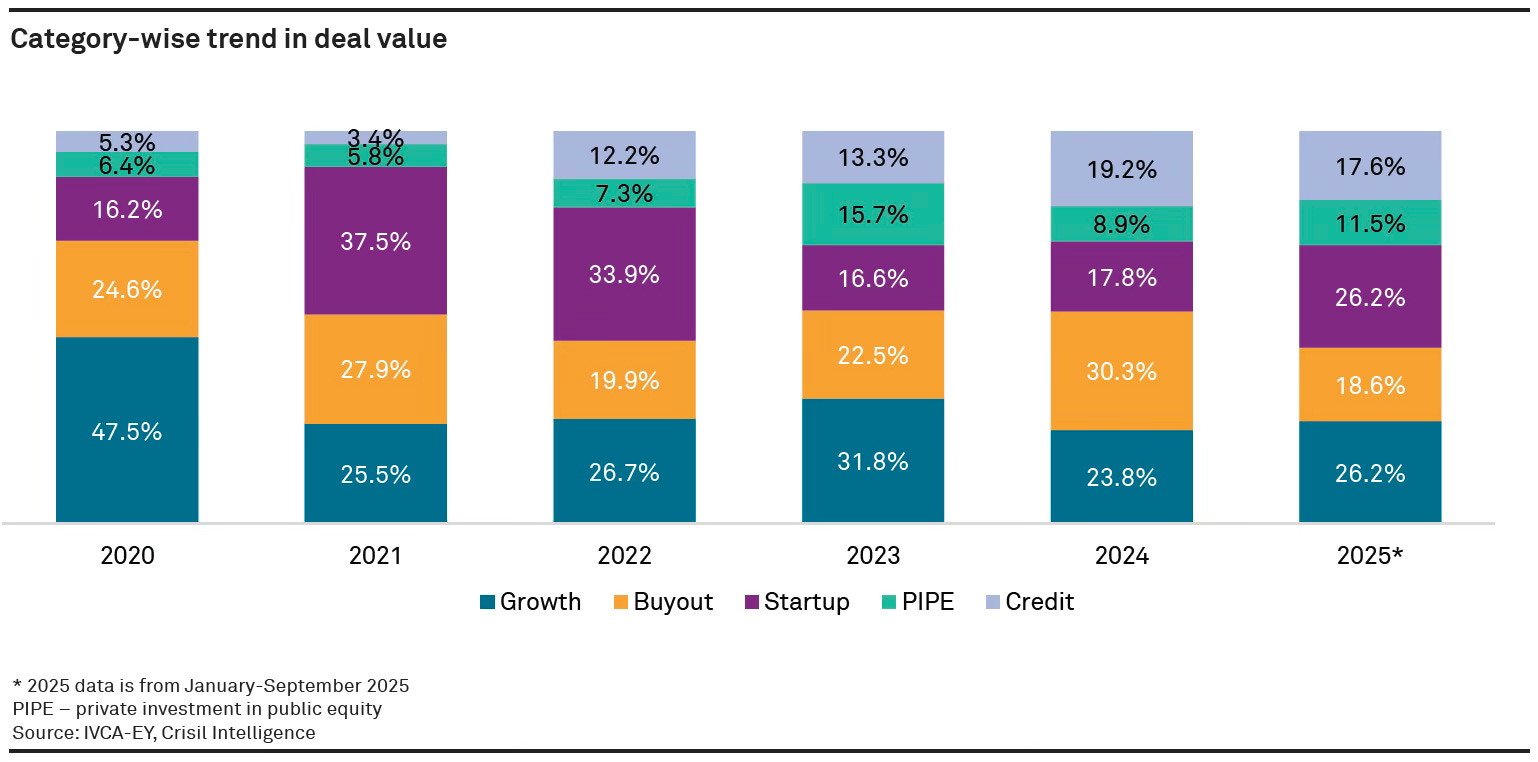
The report also disaggregates the changes in the destinations of private capital investments over the 2020-25 period. Startup and growth capital are useful for business creation and growth, whereas buyout capital reflects confidence in acquiring established businesses. They come mainly from the AIF I and II universe. The growing shares of private investments in public equity (PIPE) (mainly by the family foundations of HNIs) and private credit are matters of concern. 
The graphic below consolidates everything into one figure. It is clear that domestic capital, whether retail, institutional, or HNI, overwhelmingly favours public markets over private capital markets. HNIs too favour liquid public equity, credit, and real estate. Even the ultra-HNIs tend to avoid illiquid growth equity.
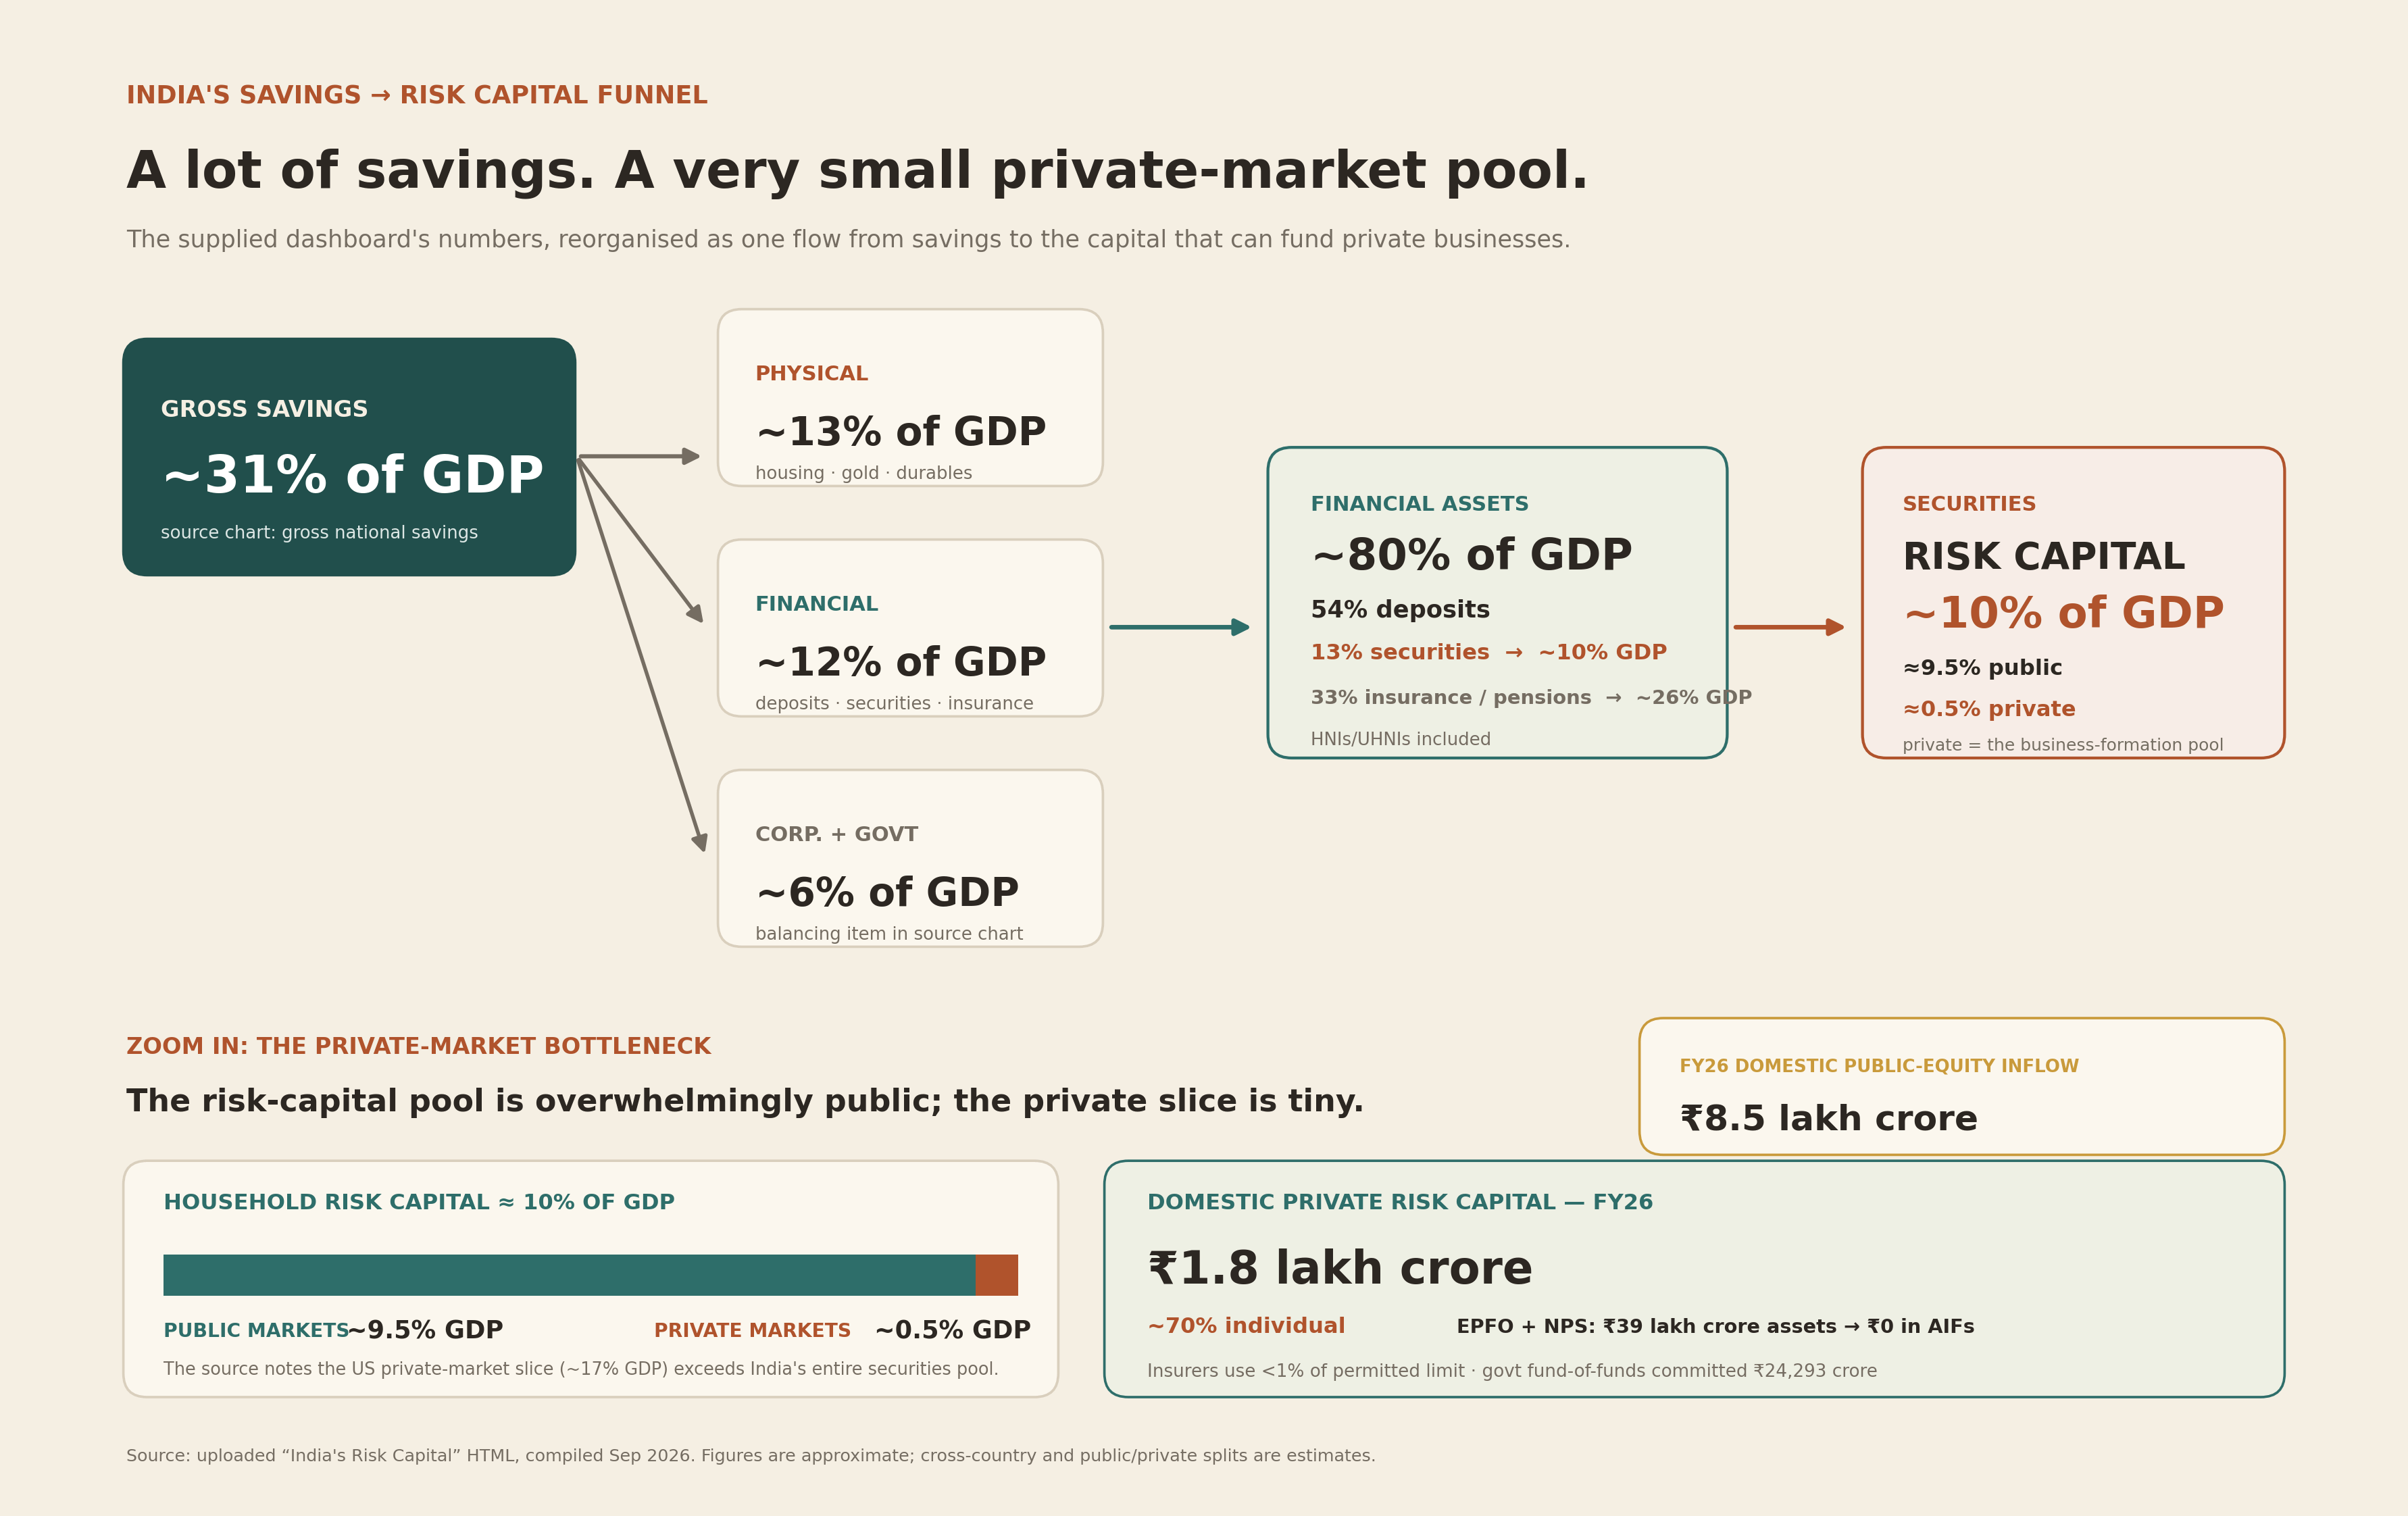
One important channel for private risk capital is institutional investors. As we saw, at 26% of GDP, the share of household financial savings going into pensions and insurance funds is 2.5 times that going into all kinds of risk capital. 

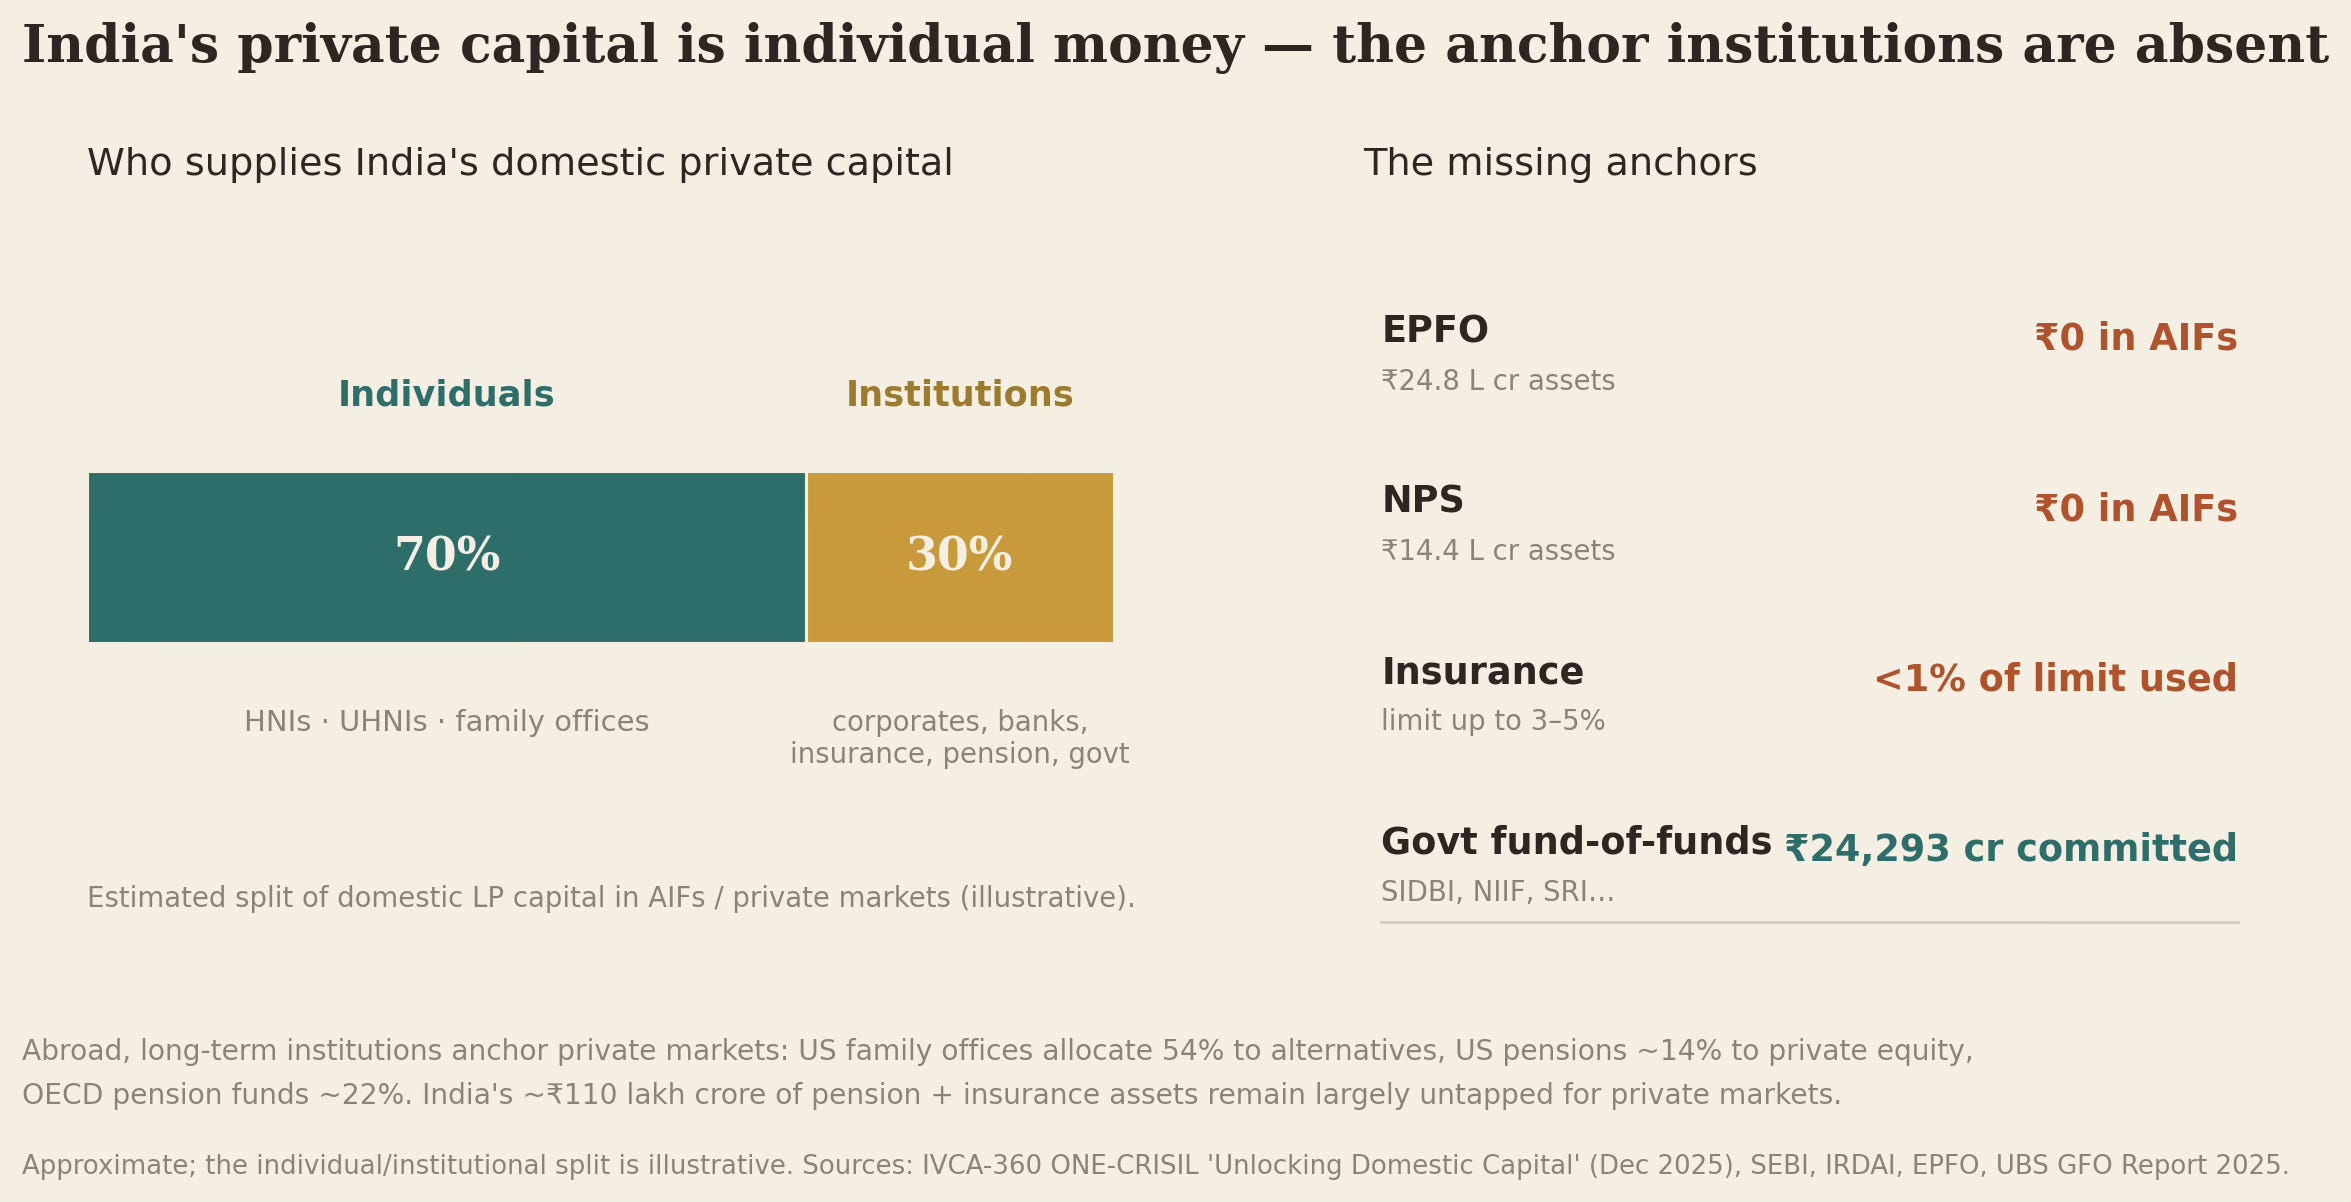
But if we look at domestic private market flows, while the actual flows into growth equity is itself small, the share coming from institutional investors is tiny. Of the domestic capital going into private markets (AIFs), roughly 70% is individual (HNIs, UHNIs and family offices) and only about 30% is institutional, and even that institutional slice is mostly corporate treasuries and government seed funds, not the long-horizon pools that anchor private markets abroad. In this too, India stands as the mirror image of every mature market. 

As an illustration, EPFO, the country’s largest retirement fund with about ₹24.8 lakh crore of assets, has nothing invested in AIFs, despite being permitted up to 5% of incremental flows. The same is the case with NPS, with about ₹14.4 lakh crore. Whereas life insurers are allowed up to 3% and general insurers up to 5%, less than 1% of their limit has been invested. It is estimated that LIC alone could put in ₹1.3 lakh crore if it used its full headroom. The institutional share comes mainly from government-backed funds-of-funds (SIDBI, SRI Fund, NIIF, NABARD, BIRAC and others), which have ₹24,293 crore committed. The pension–insurance–endowment complex that dominates private markets elsewhere is missing. 
Globally, institutional investors form the private-market LP base. In the US, university endowments like Yale invest roughly 30–40% in private equity and venture, and the US, Canadian, and Dutch pension funds and insurers are enormous private-market LPs. The CRISIL report says that US family offices allocate 54% to alternatives, US pension funds have gone from 9% to 14% in private equity over 2021-25, and OECD pension funds across 15 jurisdictions average about 22% in alternatives, up from 12% in 2001. In stark contrast, India’s own pension and insurance systems hold more than ₹110 lakh crore of assets, almost none of it in private markets. 
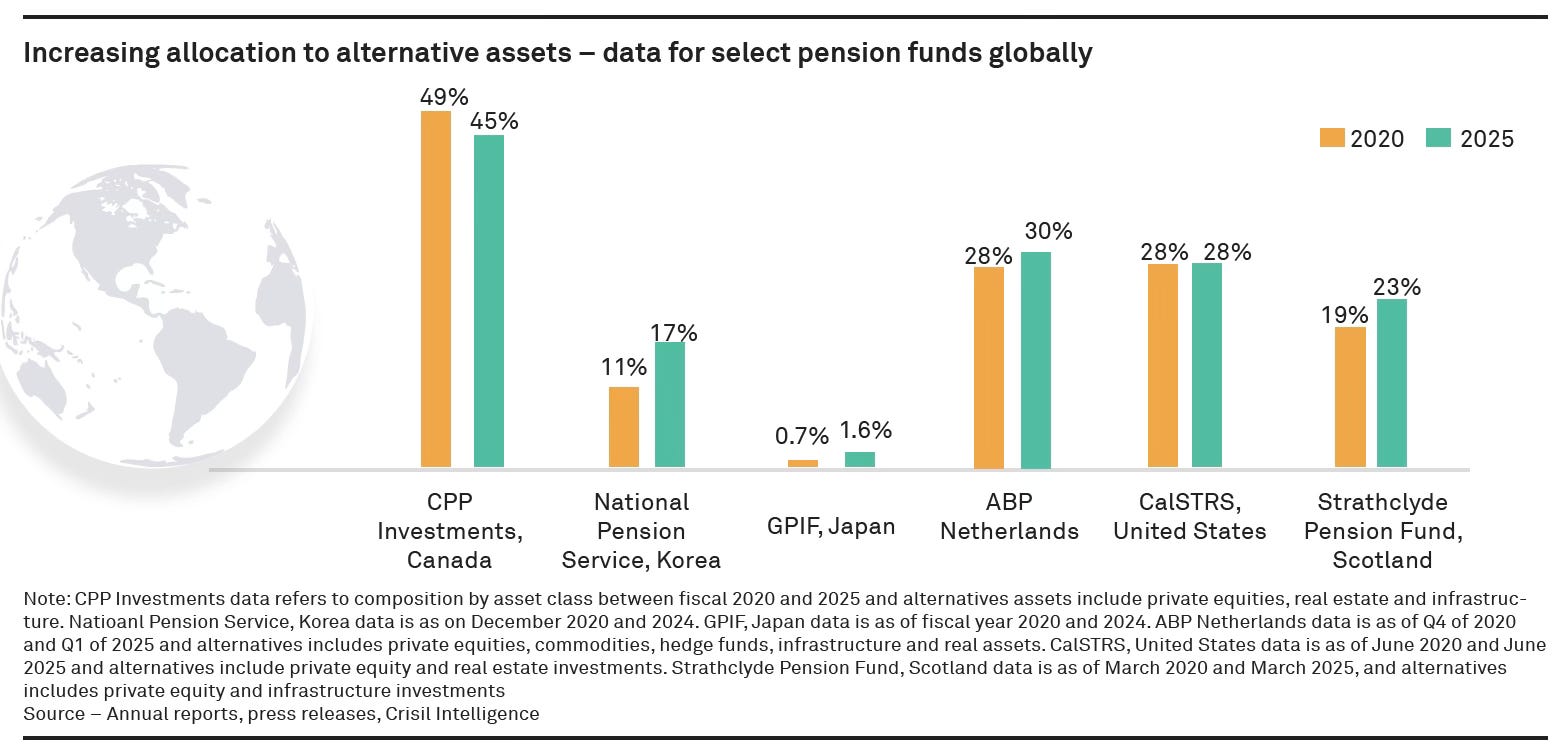
The likes of China and Israel closed exactly this gap by mobilising domestic pension and insurance capital to anchor their private ecosystems. 

Because the anchor institutions are absent, the domestic private pool is thin and individual-funded, which is exactly why even the largest Indian GPs still raise ~85% of their capital abroad. Building the institutional LP base and deepening the private capital pool requires institutional investors to shed their risk aversion and start utilising their permissible limit for alternatives. This should be followed up with gradual reforms to SEBI accredited-investor and co-investment regulations, and gradual loosening of PFRDA/IRDAI mandates.

Apart from the substantive requirement of such private risk capital to sustain the country’s high growth aspirations, the global geopolitical risks and the likelihood of capital wars make these aforesaid reforms imperative. 

Friday, June 19, 2026

The quartet of global imbalances

President Donald Trump’s single-minded pursuit of rebalancing the US economy using tariffs is unlikely to yield much without addressing fundamental distortions that have crept into the US economy and financial markets. Trade surpluses are a mere symptom of deeper malaises. I had blogged about the global twin structural imbalances, arguing that an American economy skewed towards consumption and a Chinese one skewed away from consumption are two sides of the same coin. 

Helene Rey (see also this report to G7) has a very nice summary of global imbalances, where she locates it within the dynamics of saving and investment, and questions the focus on tariffs.

A country that saves more than it invests lends abroad and runs a current account surplus; one that invests more than it saves borrows and runs a current account deficit. It is the collective saving and investment decisions of a country’s households, companies and government that drive imbalances. There is now some agreement — crystallising in the G7 discussions — that the sources of imbalances are linked to unbalanced growth models and mostly made at home: chronically weak consumption in China, feeble productive investment in Europe and outsized fiscal deficits in the US. Tariffs are not an effective mechanism to change any of those and issuing an international currency is no justification to run current account deficits. 

She also proposes the solutions in terms of complementary actions. 

China rebalancing towards consumption, Europe lifting productive investment and America repairing its public finances are not three grudging favours. They are parts of a single, mutually reinforcing policy. One country’s exports are another’s imports; one country’s capital outflow is another’s inflow. When all three move at once, each adjustment cushions the others: the deficit country that consolidates finds external demand waiting as surplus countries spend more at home, and the surplus country that stimulates demand finds a market at home rather than a protectionist wall… The IMF’s scenario of simultaneous rebalancing raises global output by around 0.8 per cent and narrows medium-term imbalances by half a percentage point of world GDP.

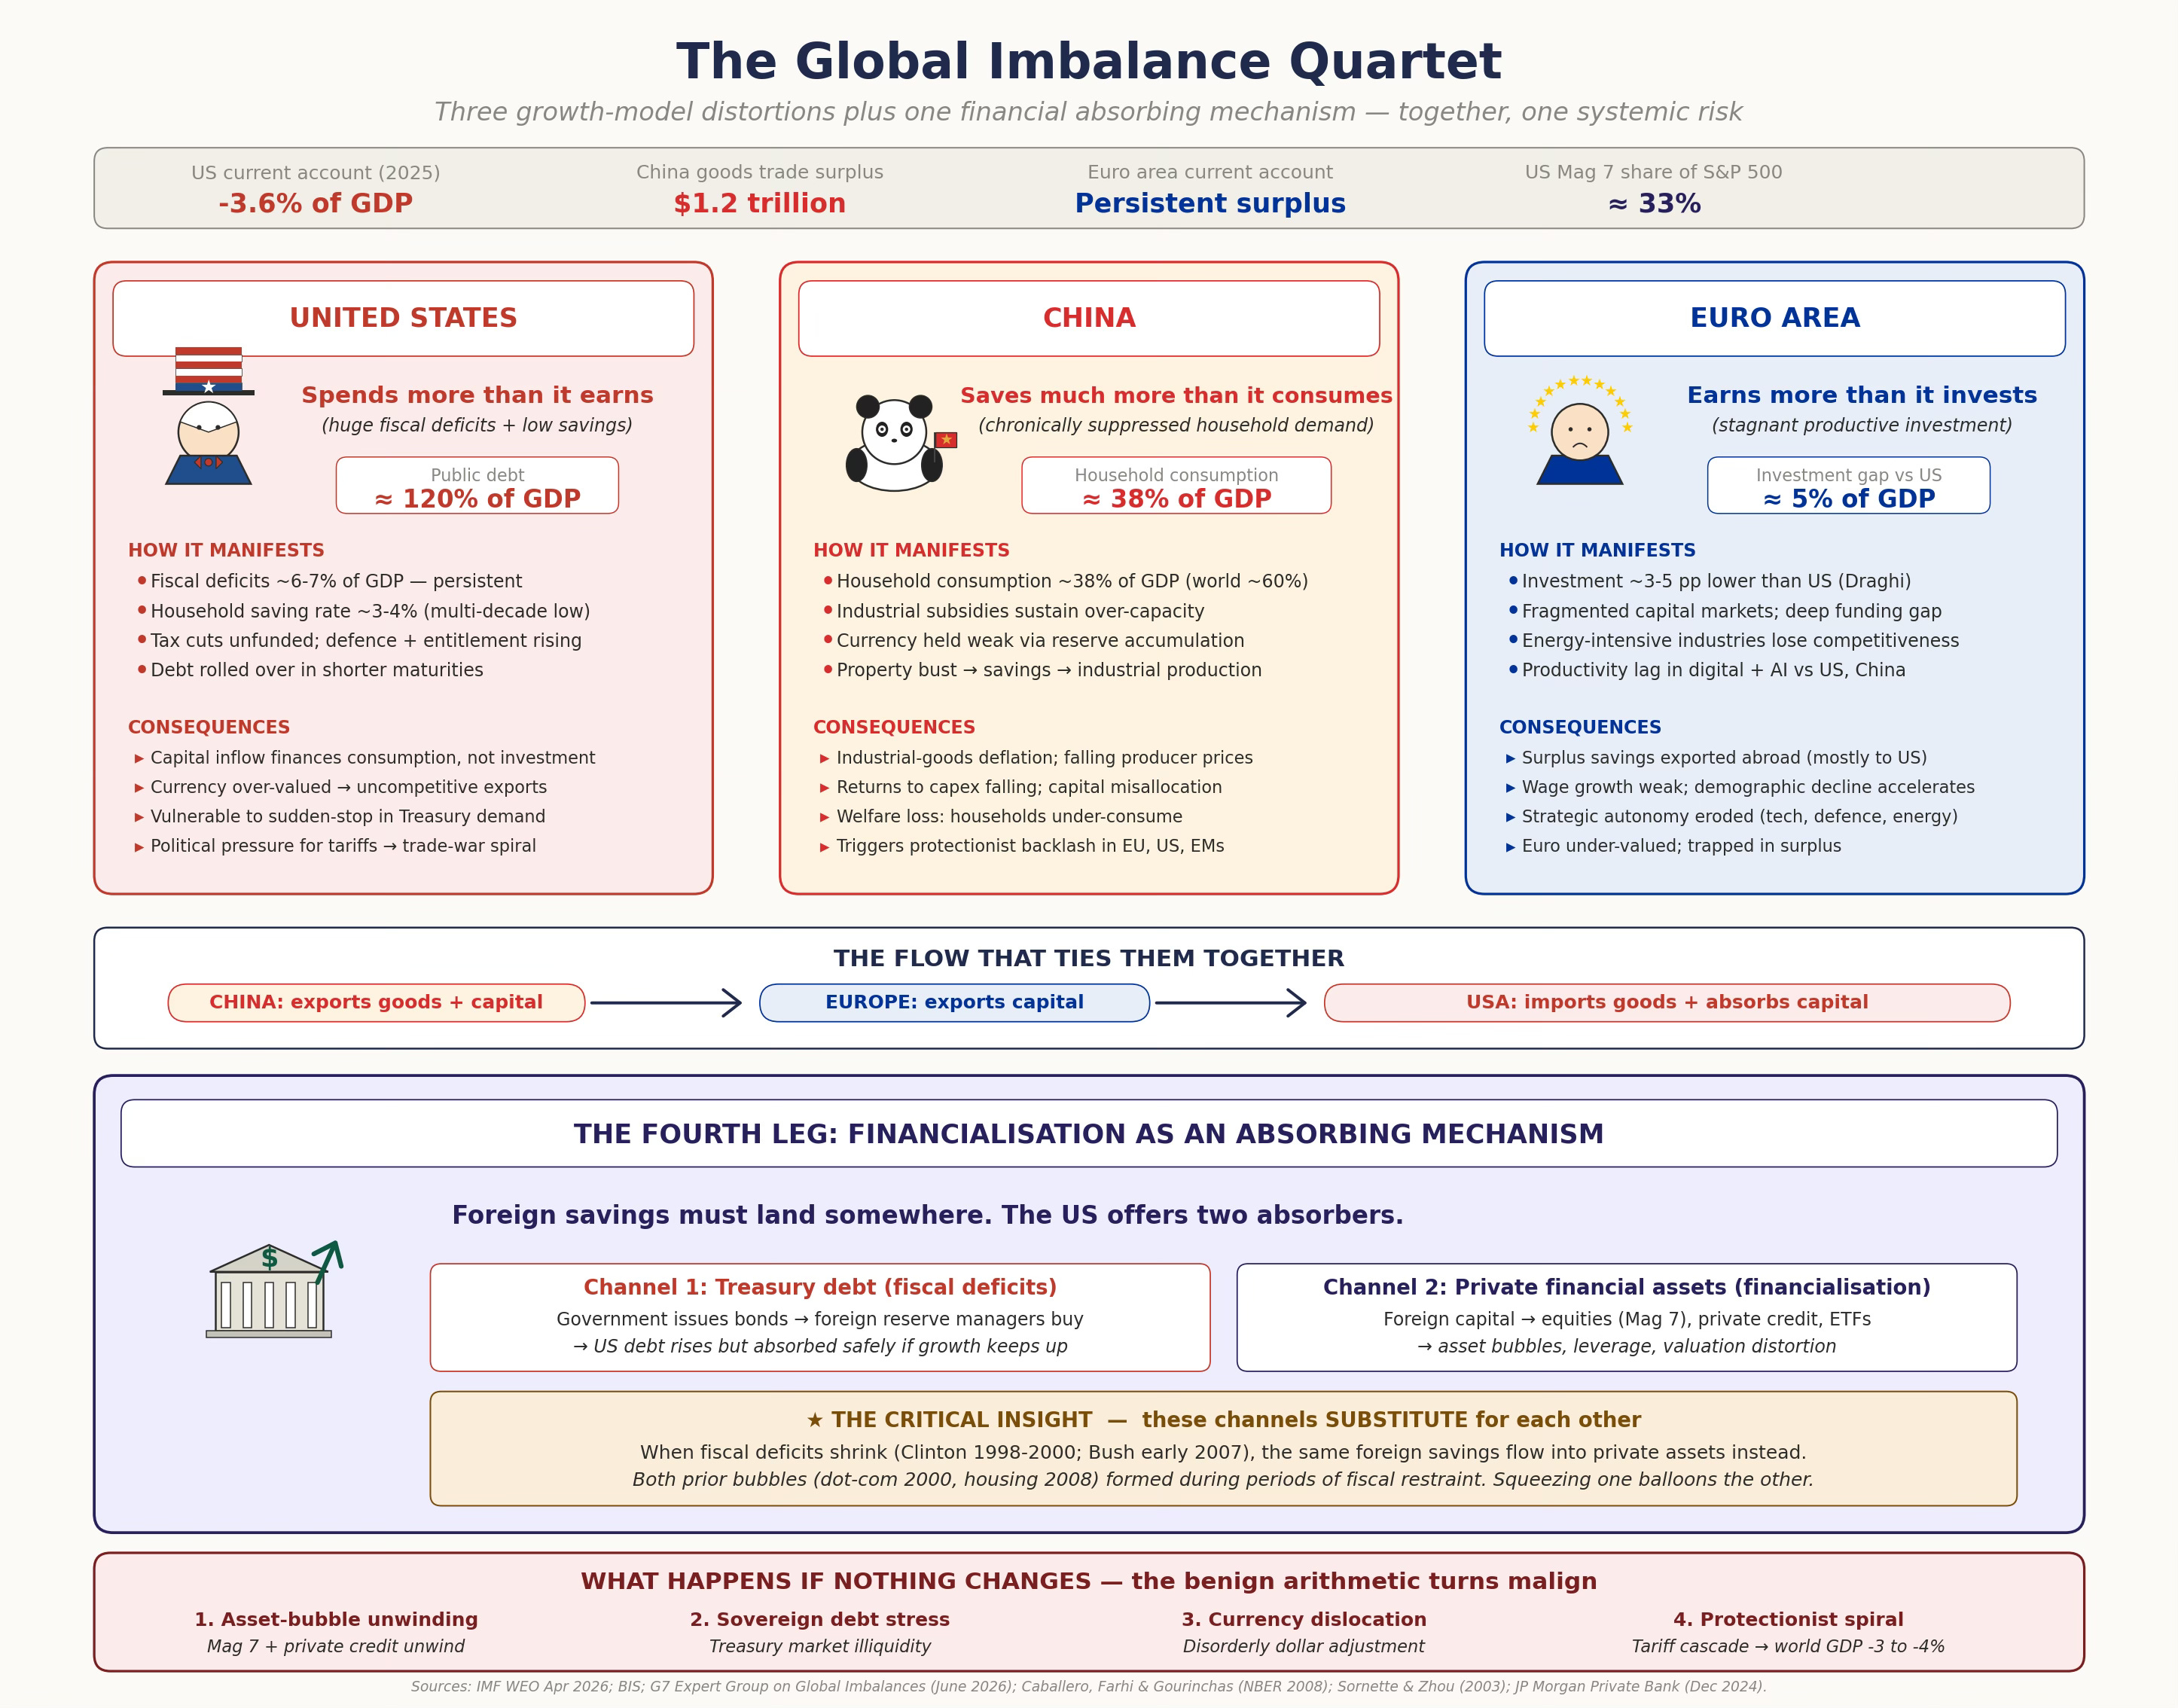
I think this analysis misses a critical fourth leg of the imbalance, financialisation. It cannot be seen as merely a symptom of US borrowing. As evidence, there are two natural experiments. The last two episodes of US fiscal deficit reduction (in the late nineties and mid-2000s) were accompanied by financial market bubbles (the dot-com bubble and housing and mortgage market bubble). 

Underlining this, Ricardo Caballero, Emmanuel Farhi, and Pierre Olivier Gourinchas have shown that if the financial markets do not work well, the economy might accommodate investments that deliver a rate of return that is below the growth rate of the economy. In this situation, both stock market bubbles and government debt can play the useful role of displacing inefficient investments. 

Foreign savings flowing into the US must find a US asset to absorb them - either Treasury debt (the fiscal deficit channel) or private financial assets (the financialisation channel). These two are substitutes, not complements. Squeezing fiscal deficits without restraining private credit pushes the same global savings glut into asset bubbles. So US fiscal consolidation alone is not sufficient, and must be paired with financial-sector reform that prevents the likes of private credit from filling the void.

I asked Claude to generate a graphic that describes the global imbalances quartet. 

So, how to address these imbalances?

The rebalancing would require global diplomacy and coordination to mobilise support from all key stakeholders. This looks onerous in a deeply polarised world, of rising tensions between the West and China and the unpredictable and whimsical nature of the Trump Presidency. 

In fact, among the four adjustments required, interventions pertaining to the much-derided Euro area appear to be the most promising and likely to materialise. In fact, on investments, the train has already started. 

It is possible that a deep crisis on the economic front, a very likely near to medium-term possibility in either case, may force both China and the US to rebalance towards consumption and consolidation, respectively. However, there are daunting political economy challenges to be overcome in both countries, especially the US. 

It is the fourth leg that might prove the most challenging. The financial markets are where the power of entrenched interests is so strong that it might require a counter-revolution to upend the order and regulate financial markets more tightly. This will also require global coordination and collective action, and not mere reforms at the US front. 

Wednesday, November 12, 2025

Hard limits to China's growth model

Much of what is written in the media, including in this blog, about China is about its spectacular economic growth to catch up with the US, and its manufacturing dominance. 

Rana Faroohar has a contrarian piece which makes the rare bearish case on China. She points to three facts about China in support. 

First, despite new pledges to raise consumption, the mathematics and politics of doing so are as tricky as ever. Second, while global diplomacy is now Beijing’s game to lose, it has made many fewer gains than it should have so far, given the low-hanging fruit. And third, autocracy remains a hard sell globally, which will make it difficult for China to ever replace the US (or even Europe) in terms of soft power.

I had blogged here about post-peak China. 

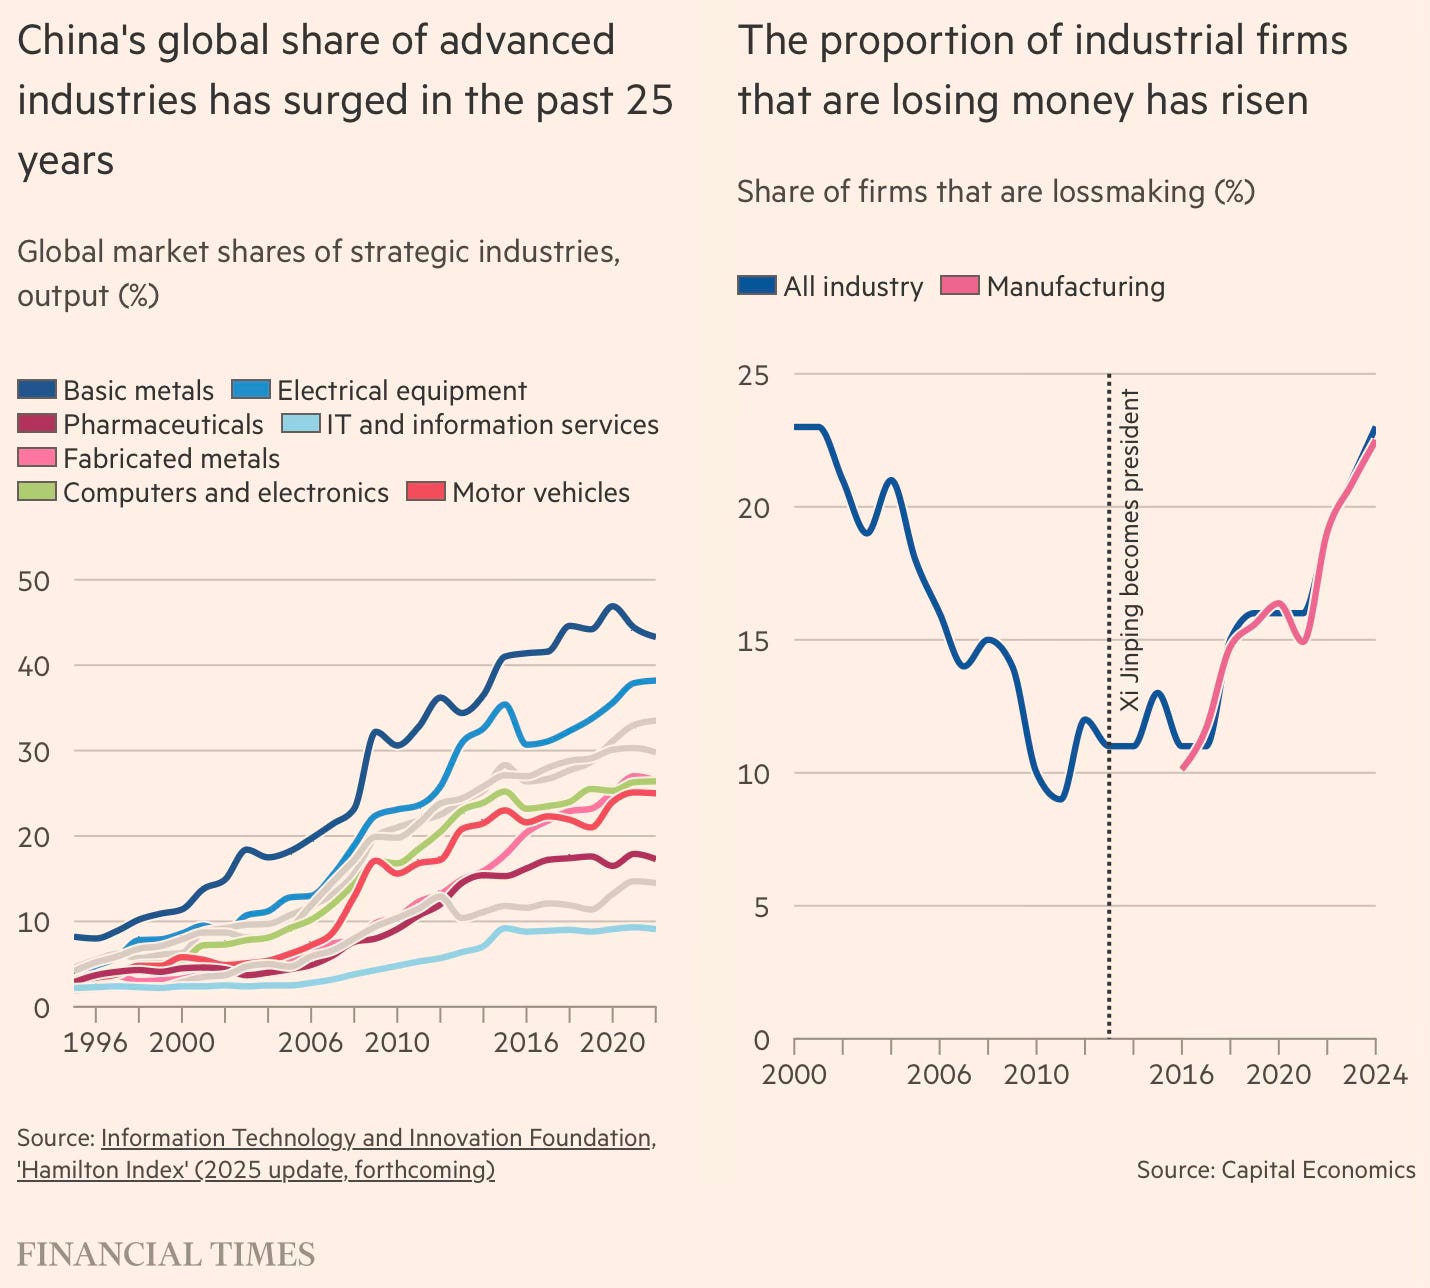
On this track, there’s an important paradox about China. Even as it has assumed leadership positions in innovations across sectors, its economic productivity growth has been slowing down. Tej Parikh has a set of excellent graphics that tell the story. This blog will explore this in greater detail and see how it could potentially constrain the country’s growth prospects. 

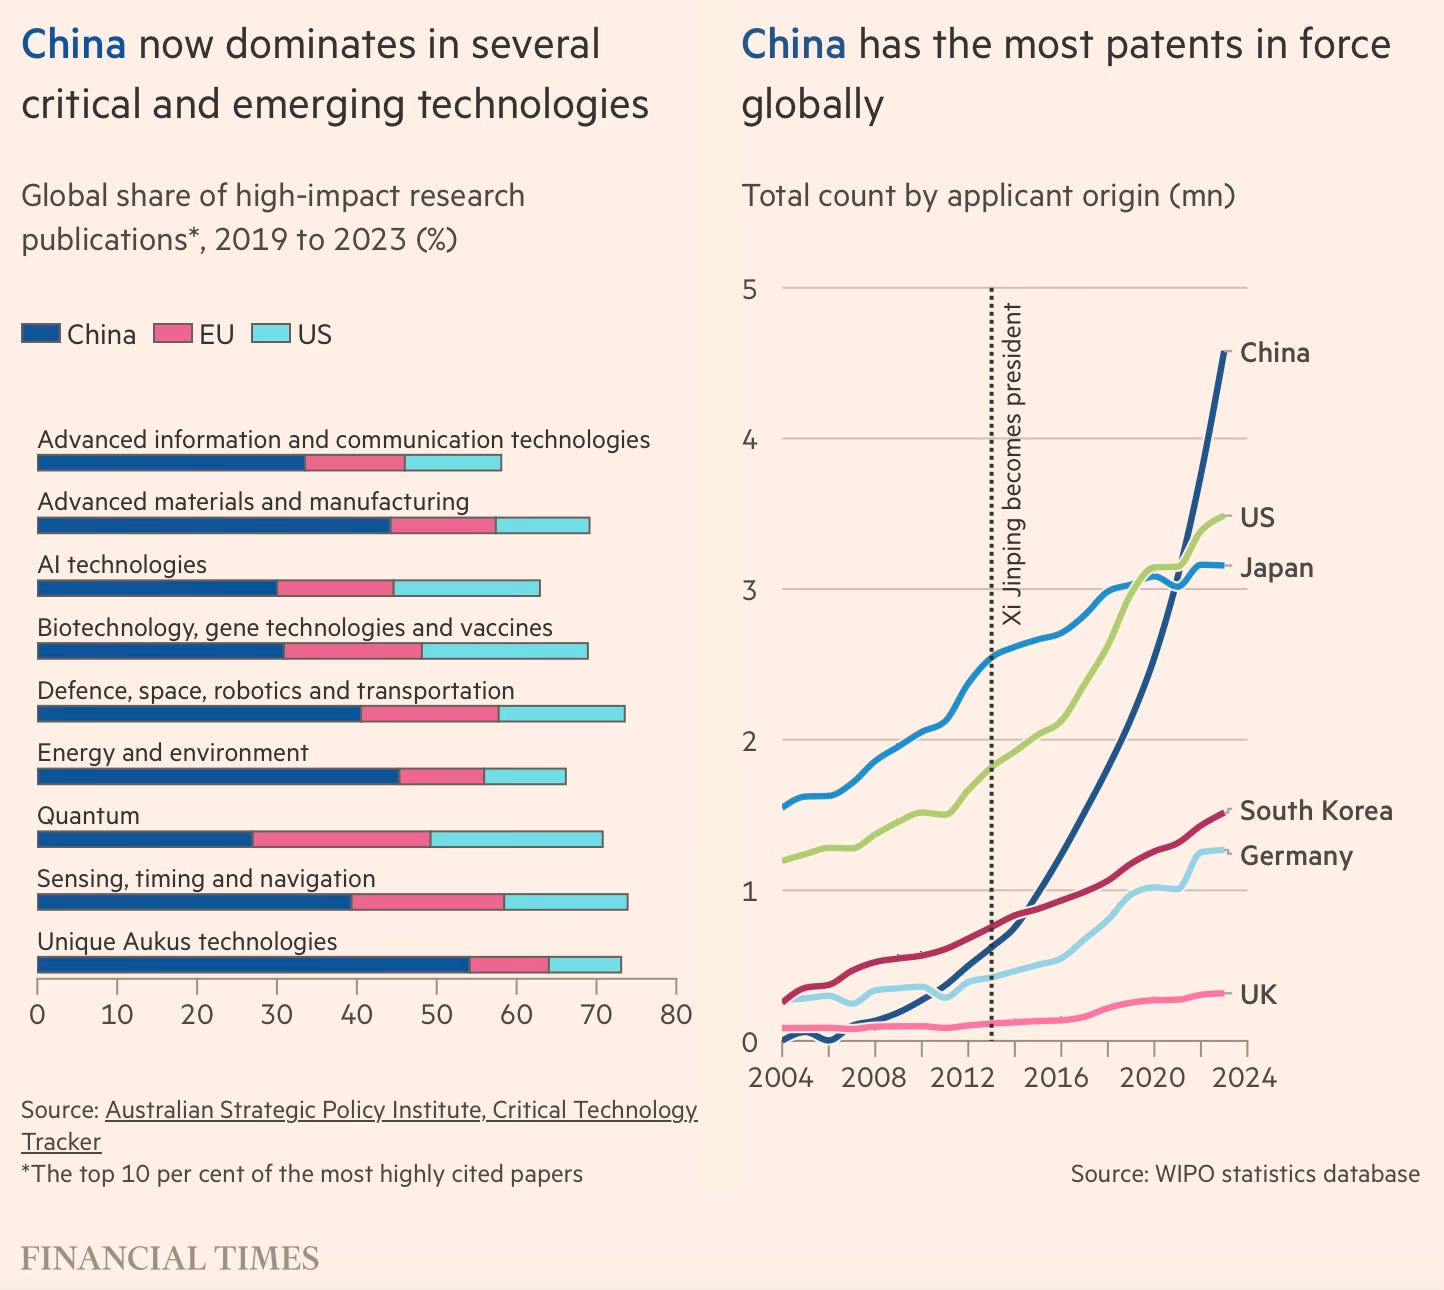
According to the Australian Strategic Policy Institute, China became the global leader in 57 out of 64 critical technologies between 2019-23, up from leadership in just 3 between 2003-07. It leads today not only in manufacturing EVs, batteries, renewables, etc., but has almost caught up with the West on AI, quantum technologies, and biotech. 

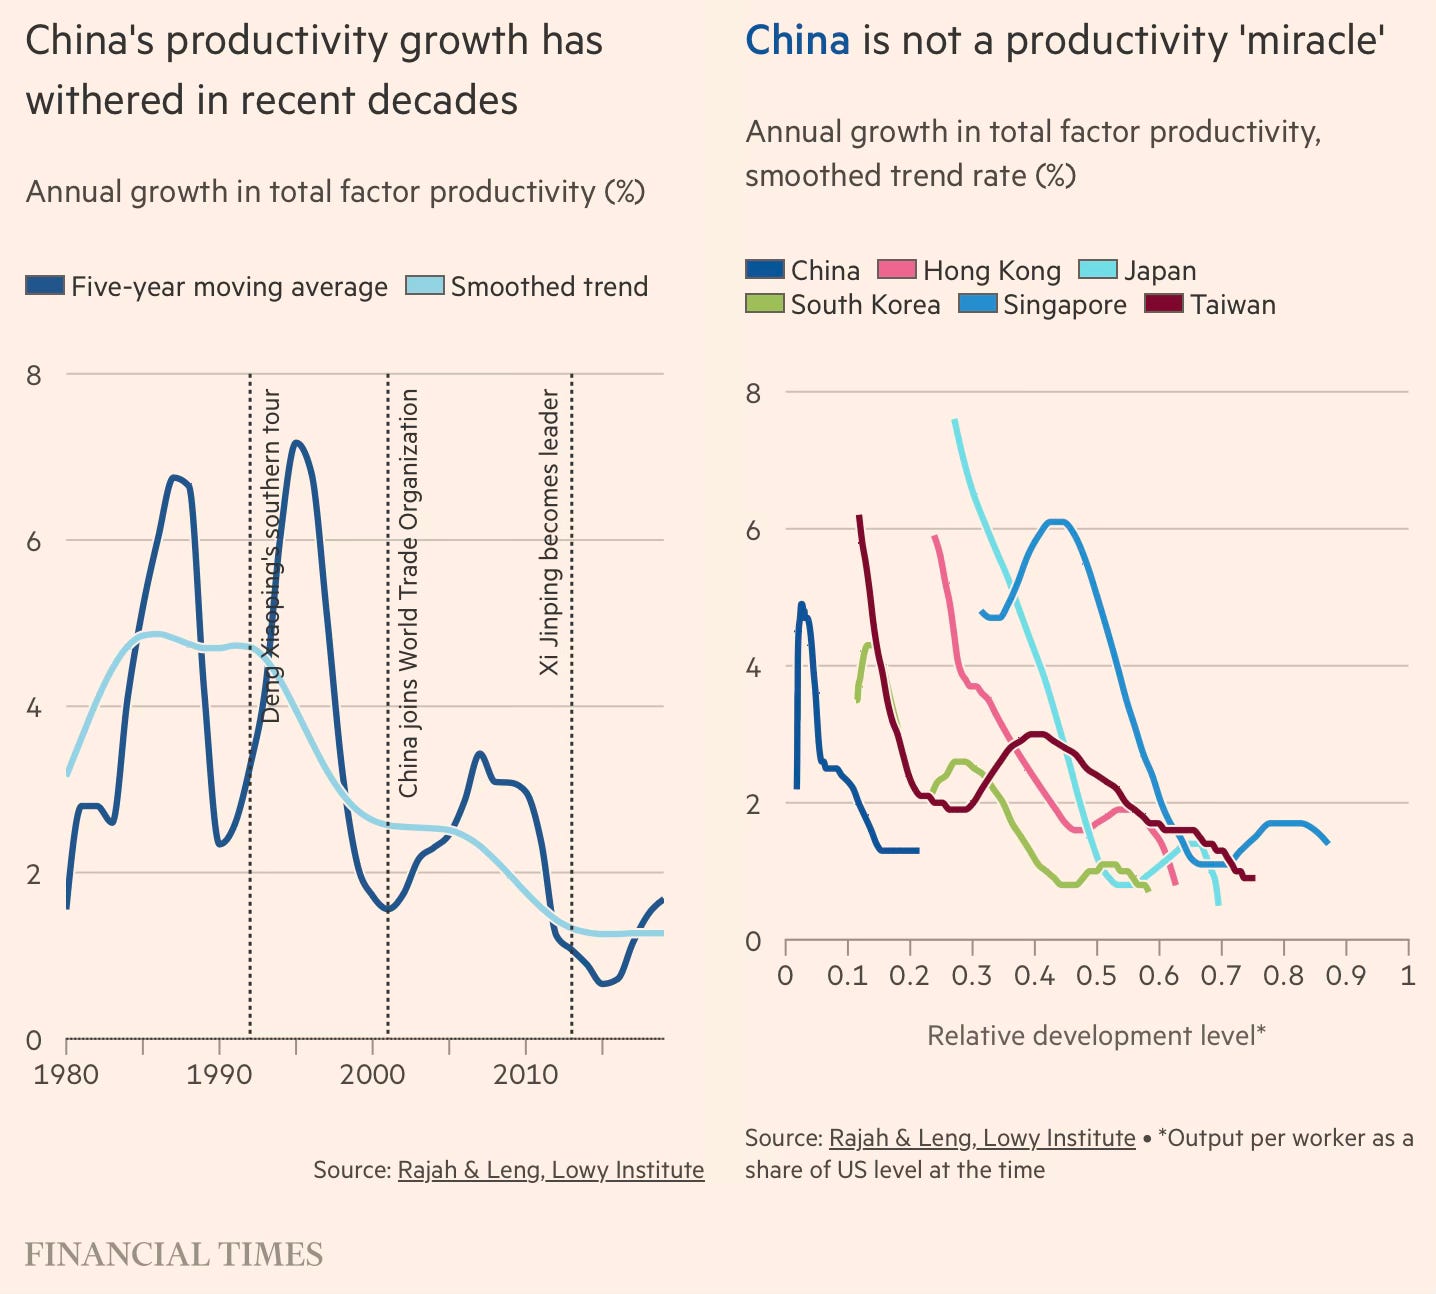
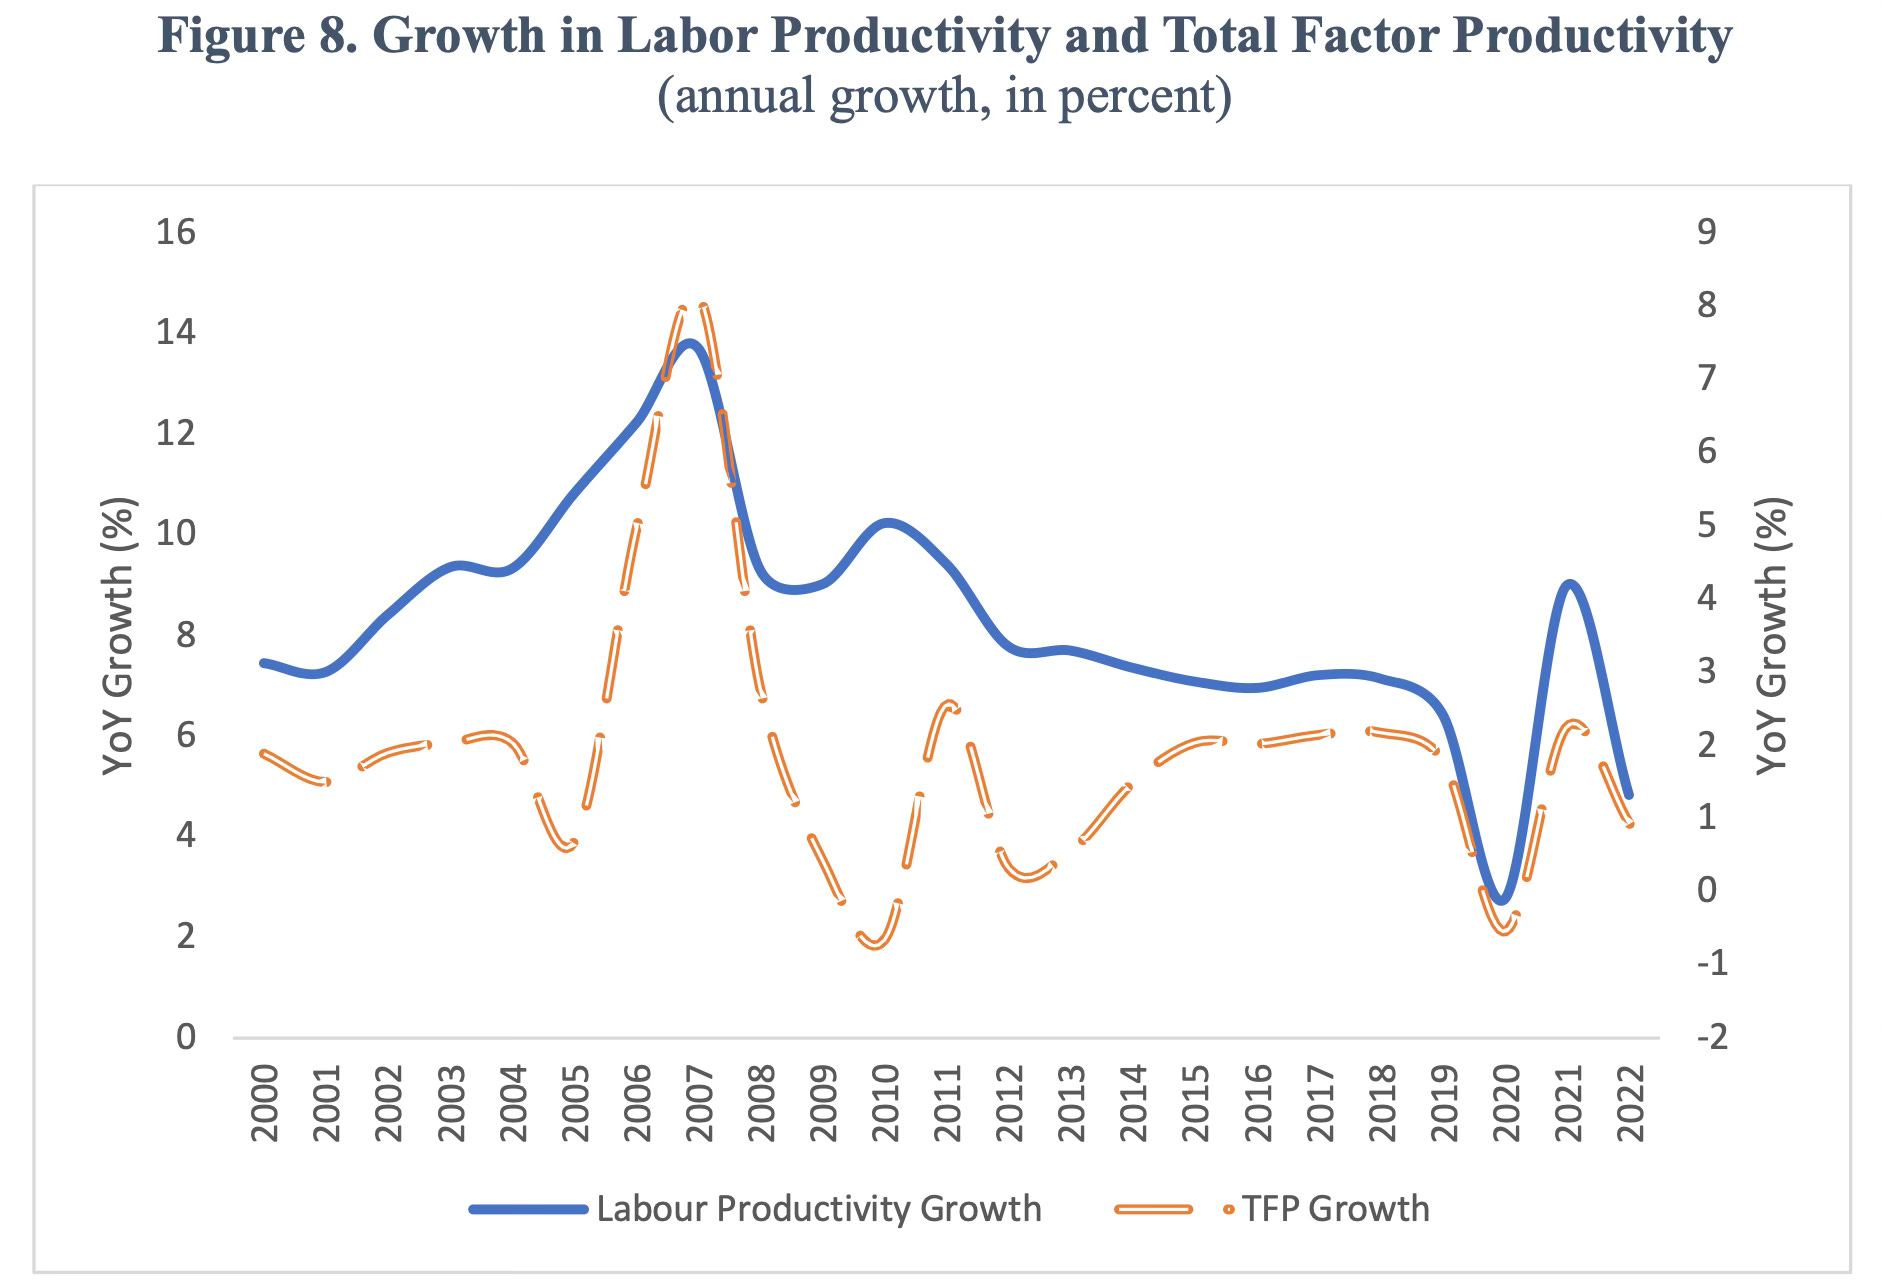
But this leadership in innovation and manufacturing has not translated into productivity growth, where its TFP has slowed down considerably and is now grossly underperforming the East Asian miracle economies. 

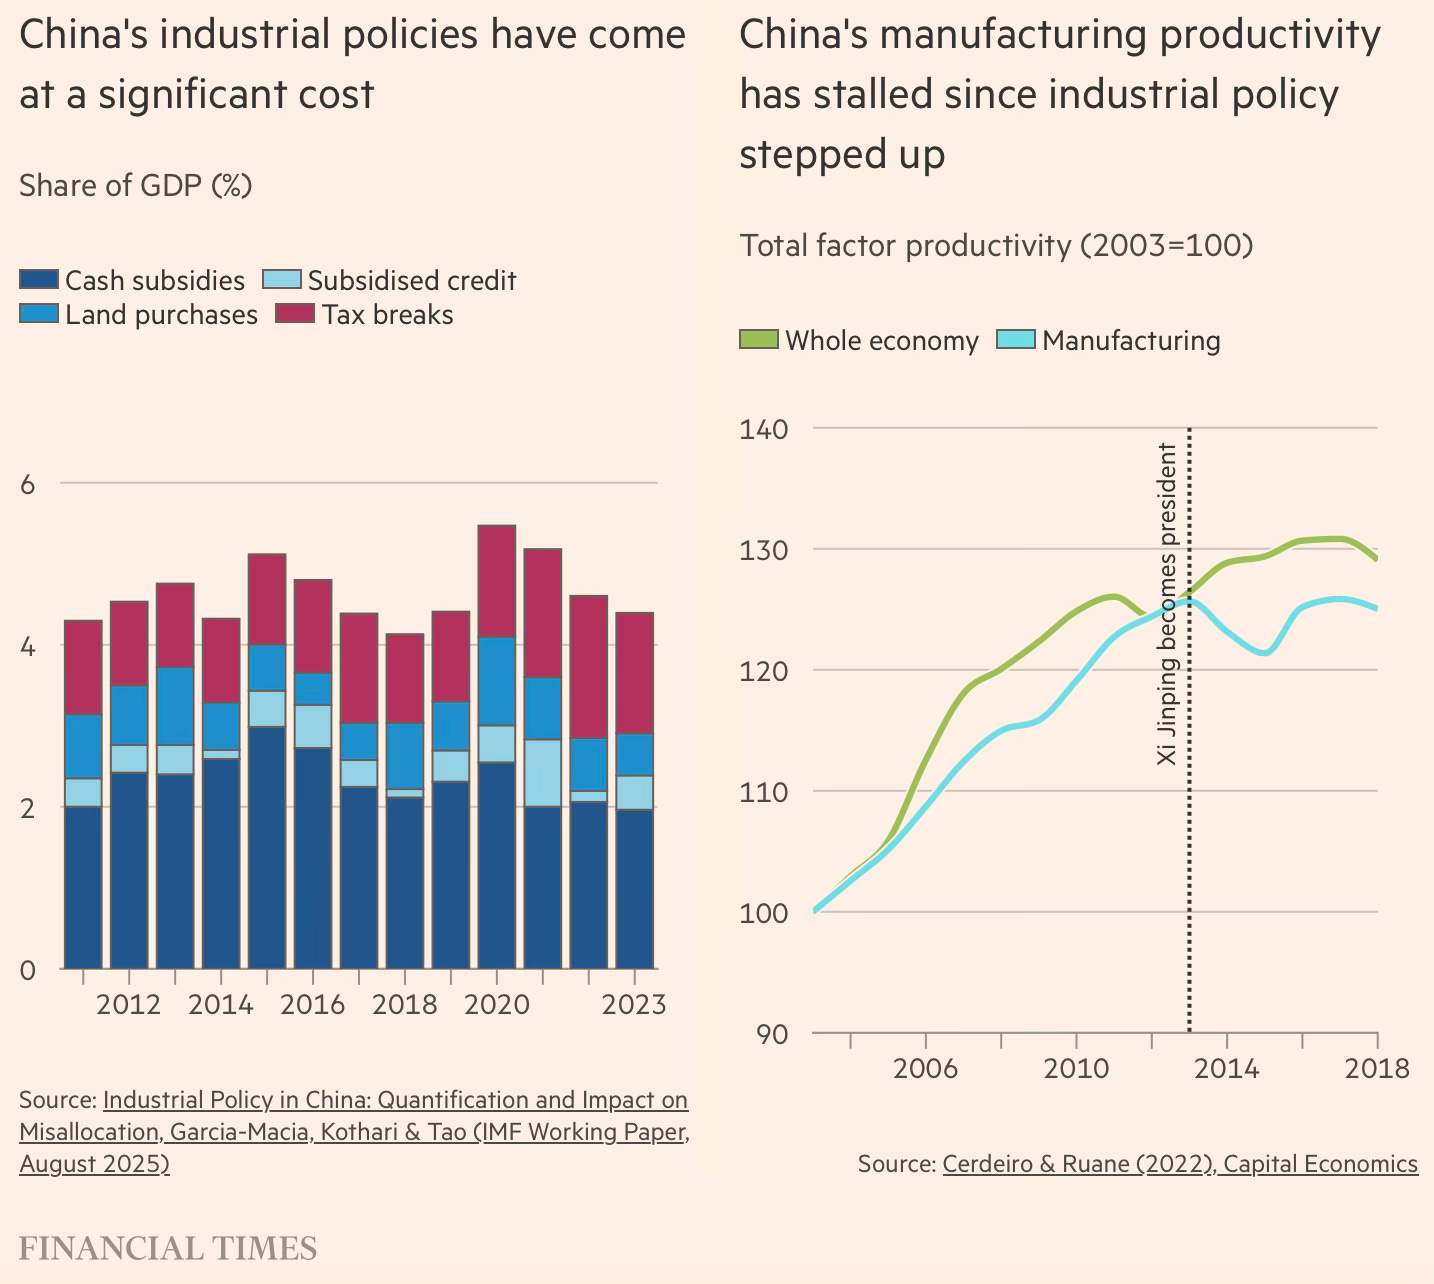
China’s industrial policies may have misallocated resources in a big way, thereby creating excess capacity, deflation, and keeping alive poor performers. IMF economists estimates that these subsidies, estimated at 4.4% of GDP in 2023, may have cut its TFP by 1.2% and GDP by 2%. They have tended to flow to better-connected firms, and raised entry barriers, thereby misallocating both talent and finance. 

For each success story like BYD or Huawei, there are countless others who are bleeding subsidies, making losses, and will collapse. Analysis by ASR finds that over 25% of listed non-financial firms had earnings before interest and tax-to-interest coverage ratio below 1 in 2024, up from around 10% in 2018. 

China’s paradox of the co-existence of excellence in manufacturing innovation with declining productivity growth is a reflection of the inefficiencies in its industrial policy. China’s much vaunted manufacturing dominance has come at a prohibitive cost in terms of misallocation of resources and talent. 

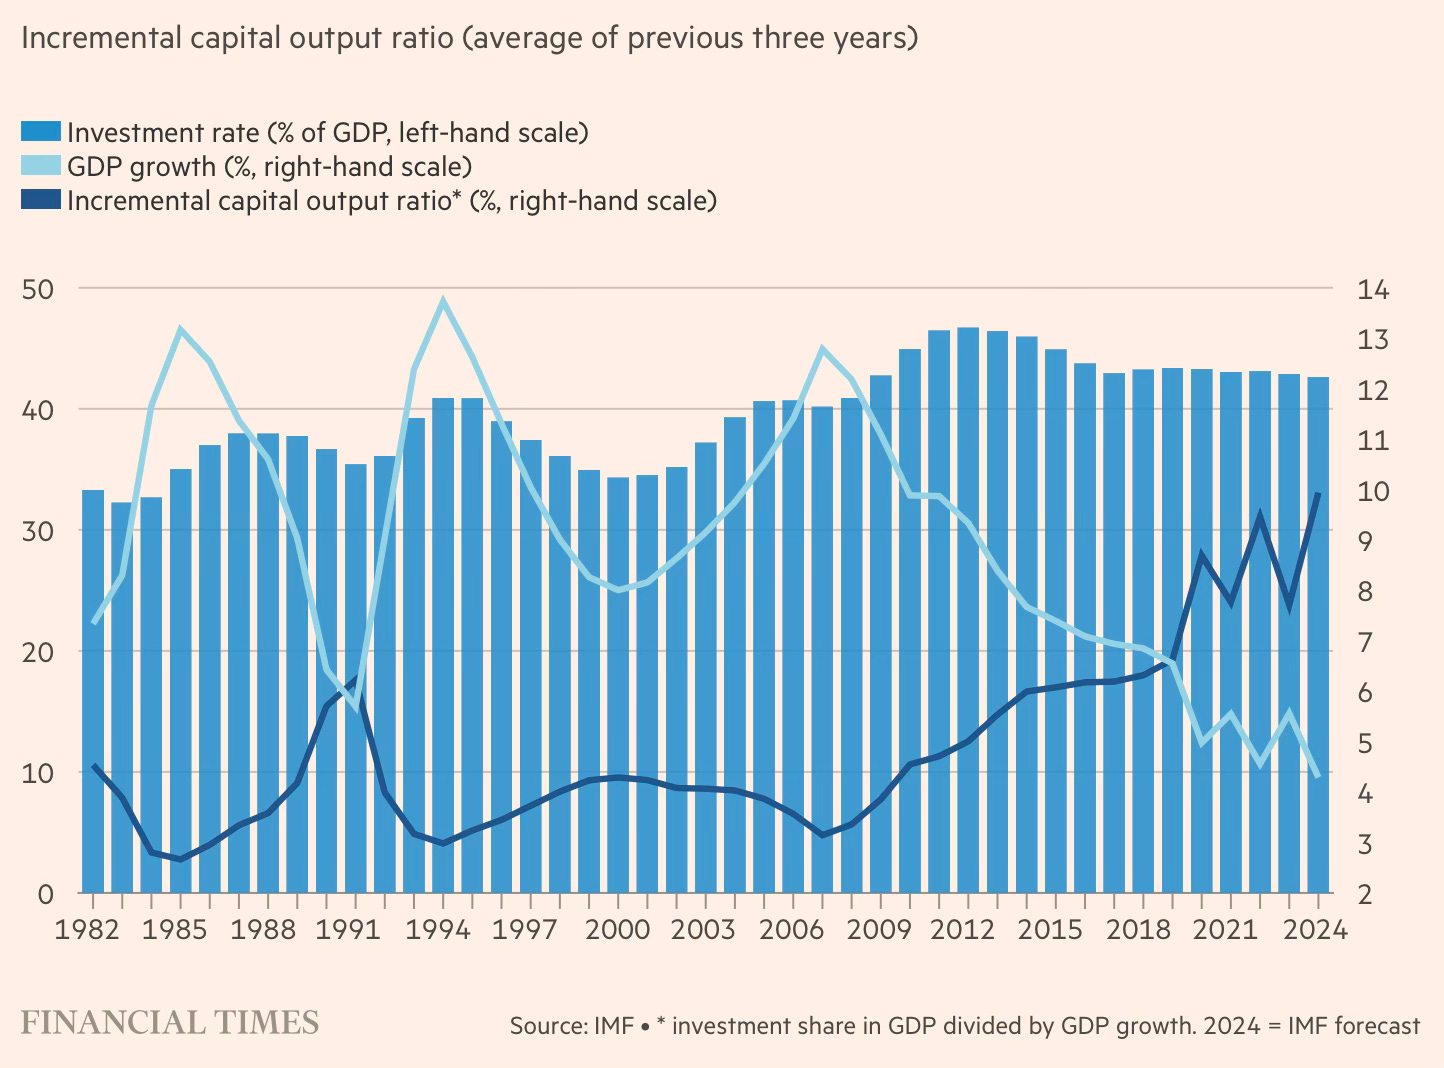
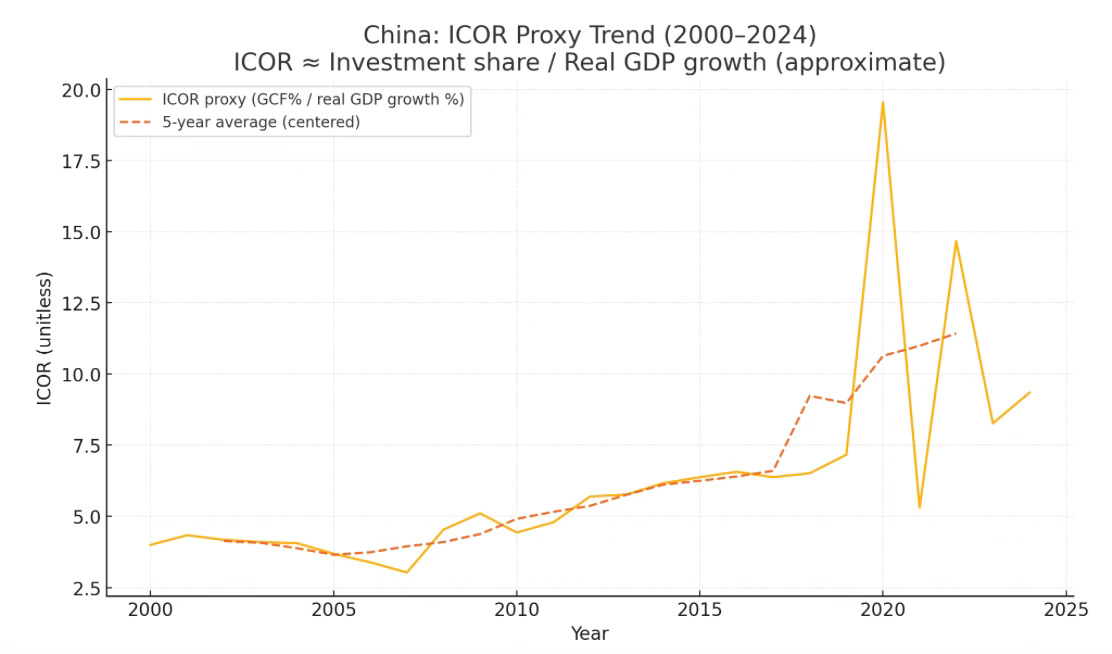
I have blogged here pointing to China’s sharply rising incremental capital output ratio (ICOR). Even as investment has been range-bound at 43-45% of GDP since before the global financial crisis, the ICOR has nearly tripled from below 3.5 to touch 10. This period has also coincided with economic growth declining precipitously from above 12% to just 4%. As the graphic shows, high investments rates brings ever less growth. 

Here is an updated version of the ICOR trends generated from the WB WDI series for investments and GDP growth. 

This misallocation has led to the perpetuation of inefficient firms, the accumulation of massive excess capacity, and the excessive leveraging of local governments and firms. In general, it has also created an economic system that is primed to maximise output with little regard for demand, continuously capture and expand export markets in a beggar-thy-neighbour dynamic, and is oblivious to policies required to boost domestic consumption. This trend is also encouraged by the country’s politico-bureaucratic system, where leadership at provinces, towns, and counties are evaluated on performance (and promotion up the party hierarchy) based on expanding economic output.

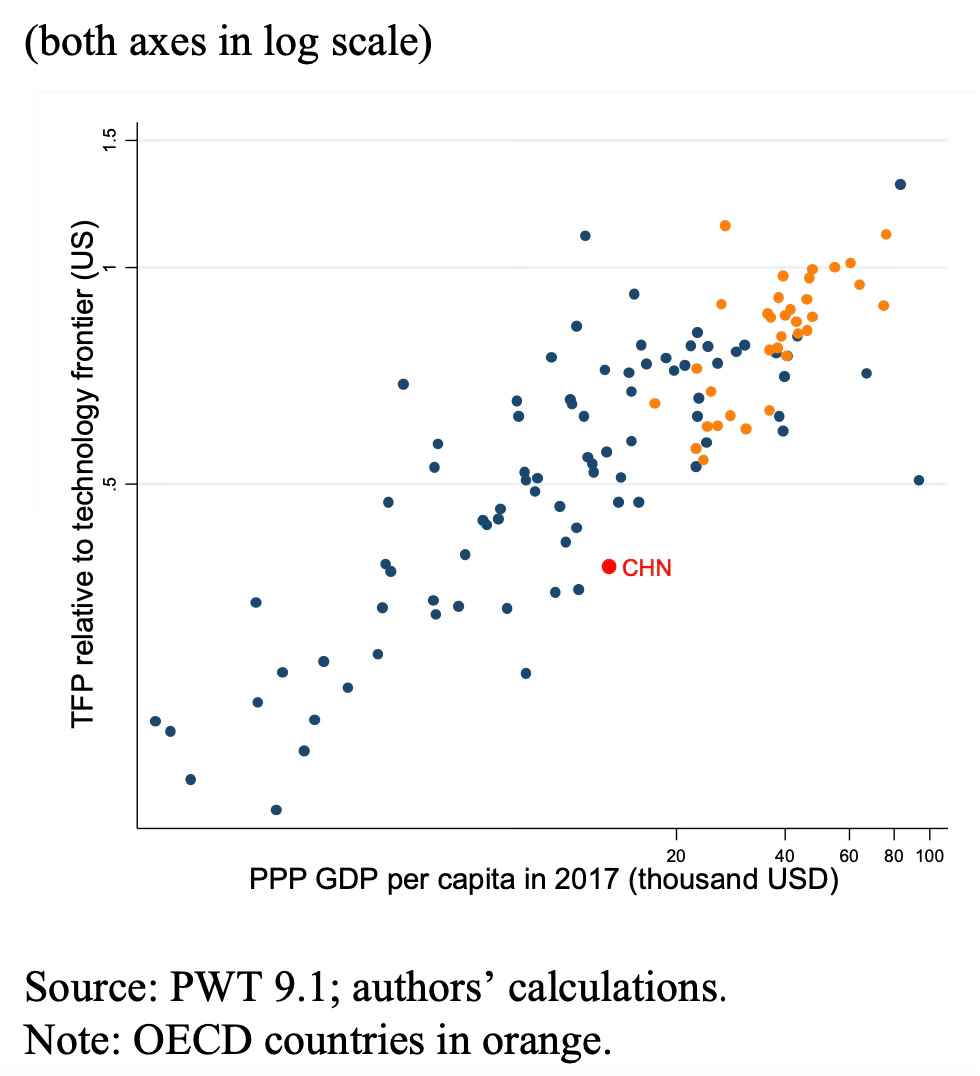
There are at least three hard stops to this model. One is the importance of productivity growth in maintaining reasonable GDP growth in an economy faced with a shrinking labour force, an increasing share of the services sector in the economy, and declining efficiency of investment. An IMF working paper shows that China TFP compared to the technology frontier (US=100) in 2017 lagged even middle-income countries. 

The paper points to a major problem of limited market entry and exit and lack of resource allocation to more productive firms in manufacturing. 

Over 1998–2013, most of the increase in productivity—two-thirds—came from the entry of new firms… The other primary source of growth was improving productivity of incumbents, which contributed 40 percent. Over the entire period, firm exit contributed negligibly to manufacturing productivity growth, reflecting one of several possibilities. Poorly performing firms either did not exit or exited but accounted for only a small percentage of aggregate output. Or the productivity of some firms that exited was average or better. Similarly, there were no gains from reallocating resources (labor, capital, and intermediate inputs) to more productive firms, which would have increased aggregate productivity, all else equal. In fact, the contribution was slightly negative. In advanced countries, this is the most important source of productivity growth, and thus stands out as a possible major source of future productivity growth in China. After 2007, average manufacturing productivity growth in China decreased almost by half. The most important reason for the decline was that the contribution of better entrants disappeared. In some sectors, the contribution of new entrants was actually negative, implying that these firms entered the productivity distribution lower than the sector average.

As I have blogged in China Updates, there are reasons to argue that these trends on exit have worsened in recent years, 

Eswar Prasad has highlighted China’s productivity problem. The country’s TFP growth (RHS) has been stagnant at about 1 per cent over the last decade.

He has explained why this is a big problem.

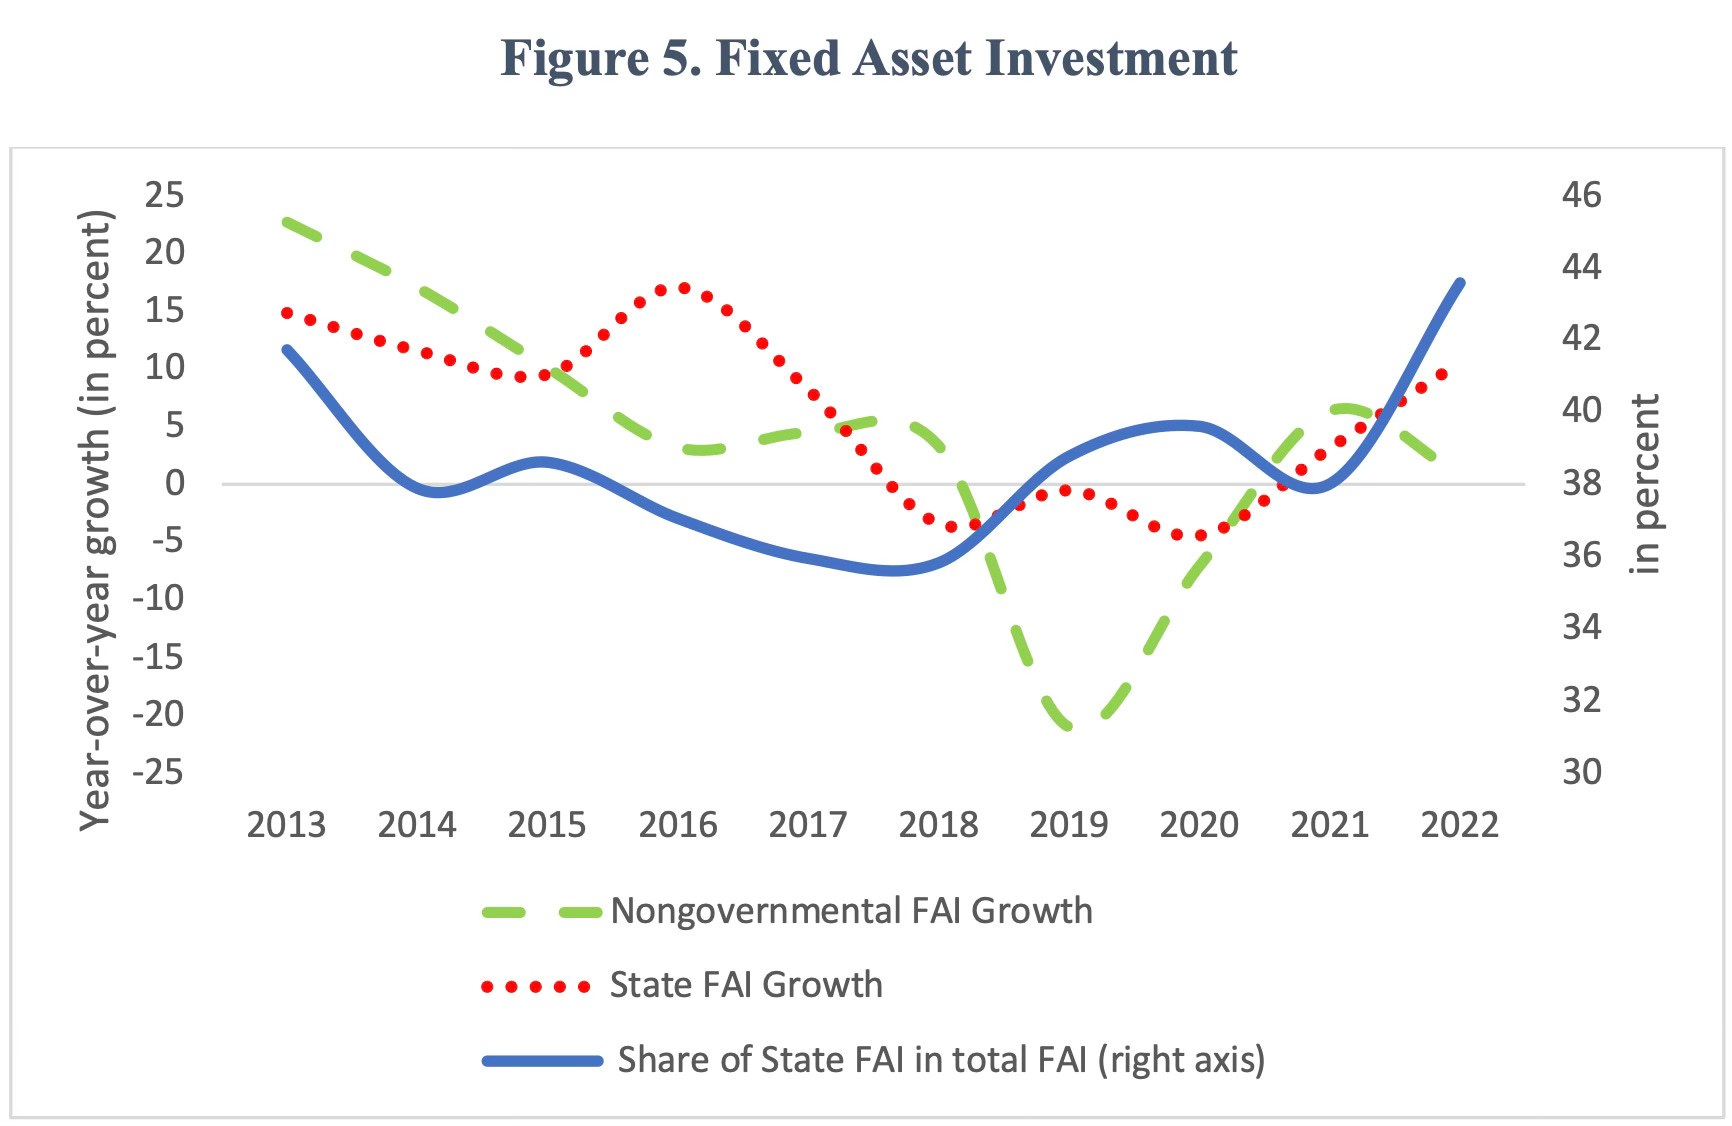
China’s capital to labor ratio is only about 28 percent that of the United States. However, recent investment has been driven by the public (state) sector rather than the nongovernmental sector. In 2022, for instance, state investment amounted to 44 percent of total fixed asset investment, a significant increase relative to the corresponding ratio of about 36 percent during 2017-2018… in China state-owned enterprises, which have collectively received a disproportionate share of bank credit, have typically not generated strong returns on those investments. The recent collapse in nongovernmental investment growth, with state investment accounting for nearly all of the growth in overall fixed asset investment in 2022, is a sign that private businesses might be wary of increasing investment when they see the economic and political environments as unfavourable. Moreover, China’s capital to output ratio is in fact about 50 per cent higher than that of the United States. This reflects lower levels of total factor productivity (TFP) and human capital in China relative to the United States. This implies that increasing investment might not be the optimal way to generate growth. 

This is another useful paper on China’s productivity paradox. 

Second is the ongoing backlash from export markets. Chinese exports to the US are already shrinking, and the same will be true for other advanced economies in the days ahead. As I have blogged on multiple occasions, and Arvind Subramanian and Shoumitro Chatterjee have written, China’s exports are now threatening to destroy the industrial bases of developing countries. 

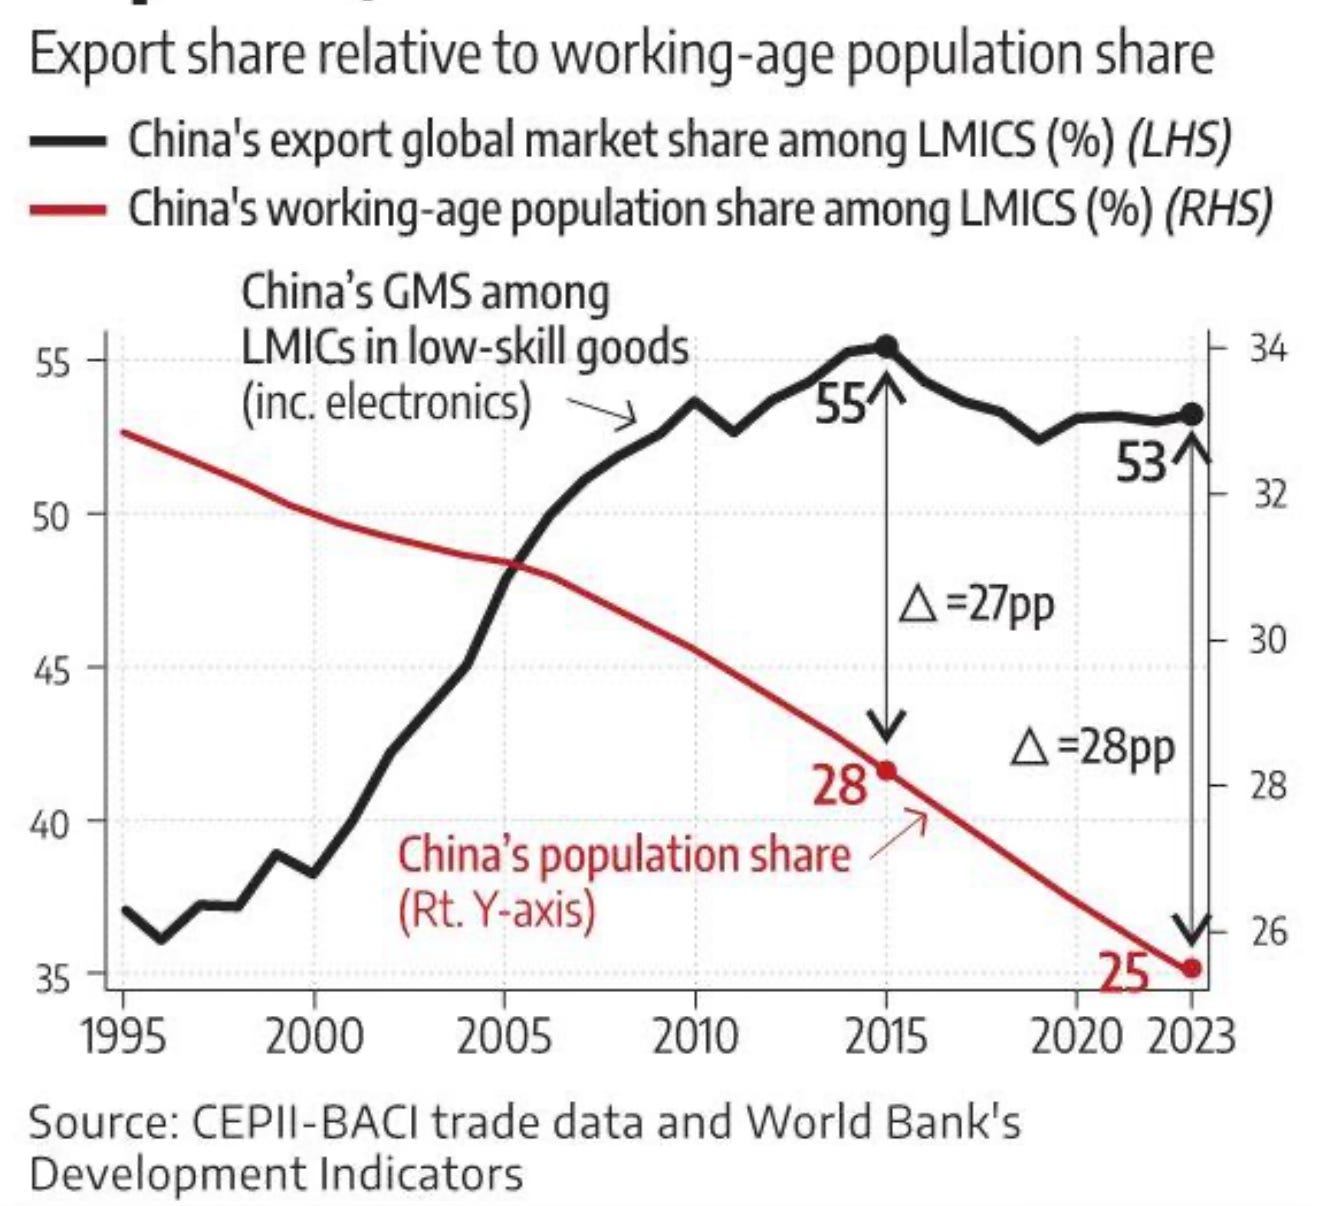
Today, China’s manufacturing trade surplus stands at roughly $2 trillion, about $1.4 trillion of which comes from low-skill goods… Chinese imports still account for about 1.5 per cent of the West’s gross domestic product (GDP)… Accounting for almost 4 per cent of LMICs’ combined GDP, the import shock from China represents a larger (and growing) share of their economies than imports of high-skill goods do in developed countries… compare China’s share of low-skill exports among LMICs to its share of the global workforce… The wedge between China’s export share and its labour-force share — roughly 28 percentage points — suggests that China continues to occupy “excess” export space that could otherwise support tens of millions of manufacturing jobs in poorer economies.

Finally, there is the investment model hitting the debt ceilings for corporates and local governments. Since 2010, government debt has risen from 34% of GDP to over 86% today, and this is most likely a gross underestimate given the large value of off-balance sheet debts of local governments in the form of local government financing vehicles (LGFVs). 

Household debt has risen from 18% in 2009 to 62.5% in 2024, and more than doubled over just the last decade. This is amplified by the fact that property accounts for nearly 60% of household wealth in 2019. These, coupled with restrictive regulations like the hukou system and deficient social safety nets, mean that household consumption, which is already low in China’s share of national output but whose growth is the only way for China to reach a sustainable growth path, is likely to remain subdued. 

The government somehow (perhaps more by luck and throwing the kitchen sink at the problem) managed to stave off a financial crisis from the popping of the real estate bubble in 2020-21. It has instead diverted the credit flows to manufacturing to build up capacity and capture foreign markets. 

The fact that most major banks are state-owned adds one more layer of distortion by allowing the government to keep infusing credit to failing firms to prevent systemic crises. This happened in the aftermath of the real estate bubble bursting, especially when the Evergrande crisis threatened spillovers and a meltdown. This is likely to recur with the manufacturing firms in green technologies and the like. 

It can be said with confidence that if we were talking about any other country, the macroeconomic indicators and their trends, and the dominant economic and political environments, would clearly point to an imminent economic slowdown or crash. The market would be full of shorts for the economy. As Eswar Prasad writes,

The underpinnings of China’s growth seem fragile from historical and analytical perspectives. Things that must end do often end suddenly and in unpredictable ways.

However, in the case of China, we need to take into account the government’s rich track record of adept handling of potential crises and vulnerabilities. But even expertise and luck have their limits.