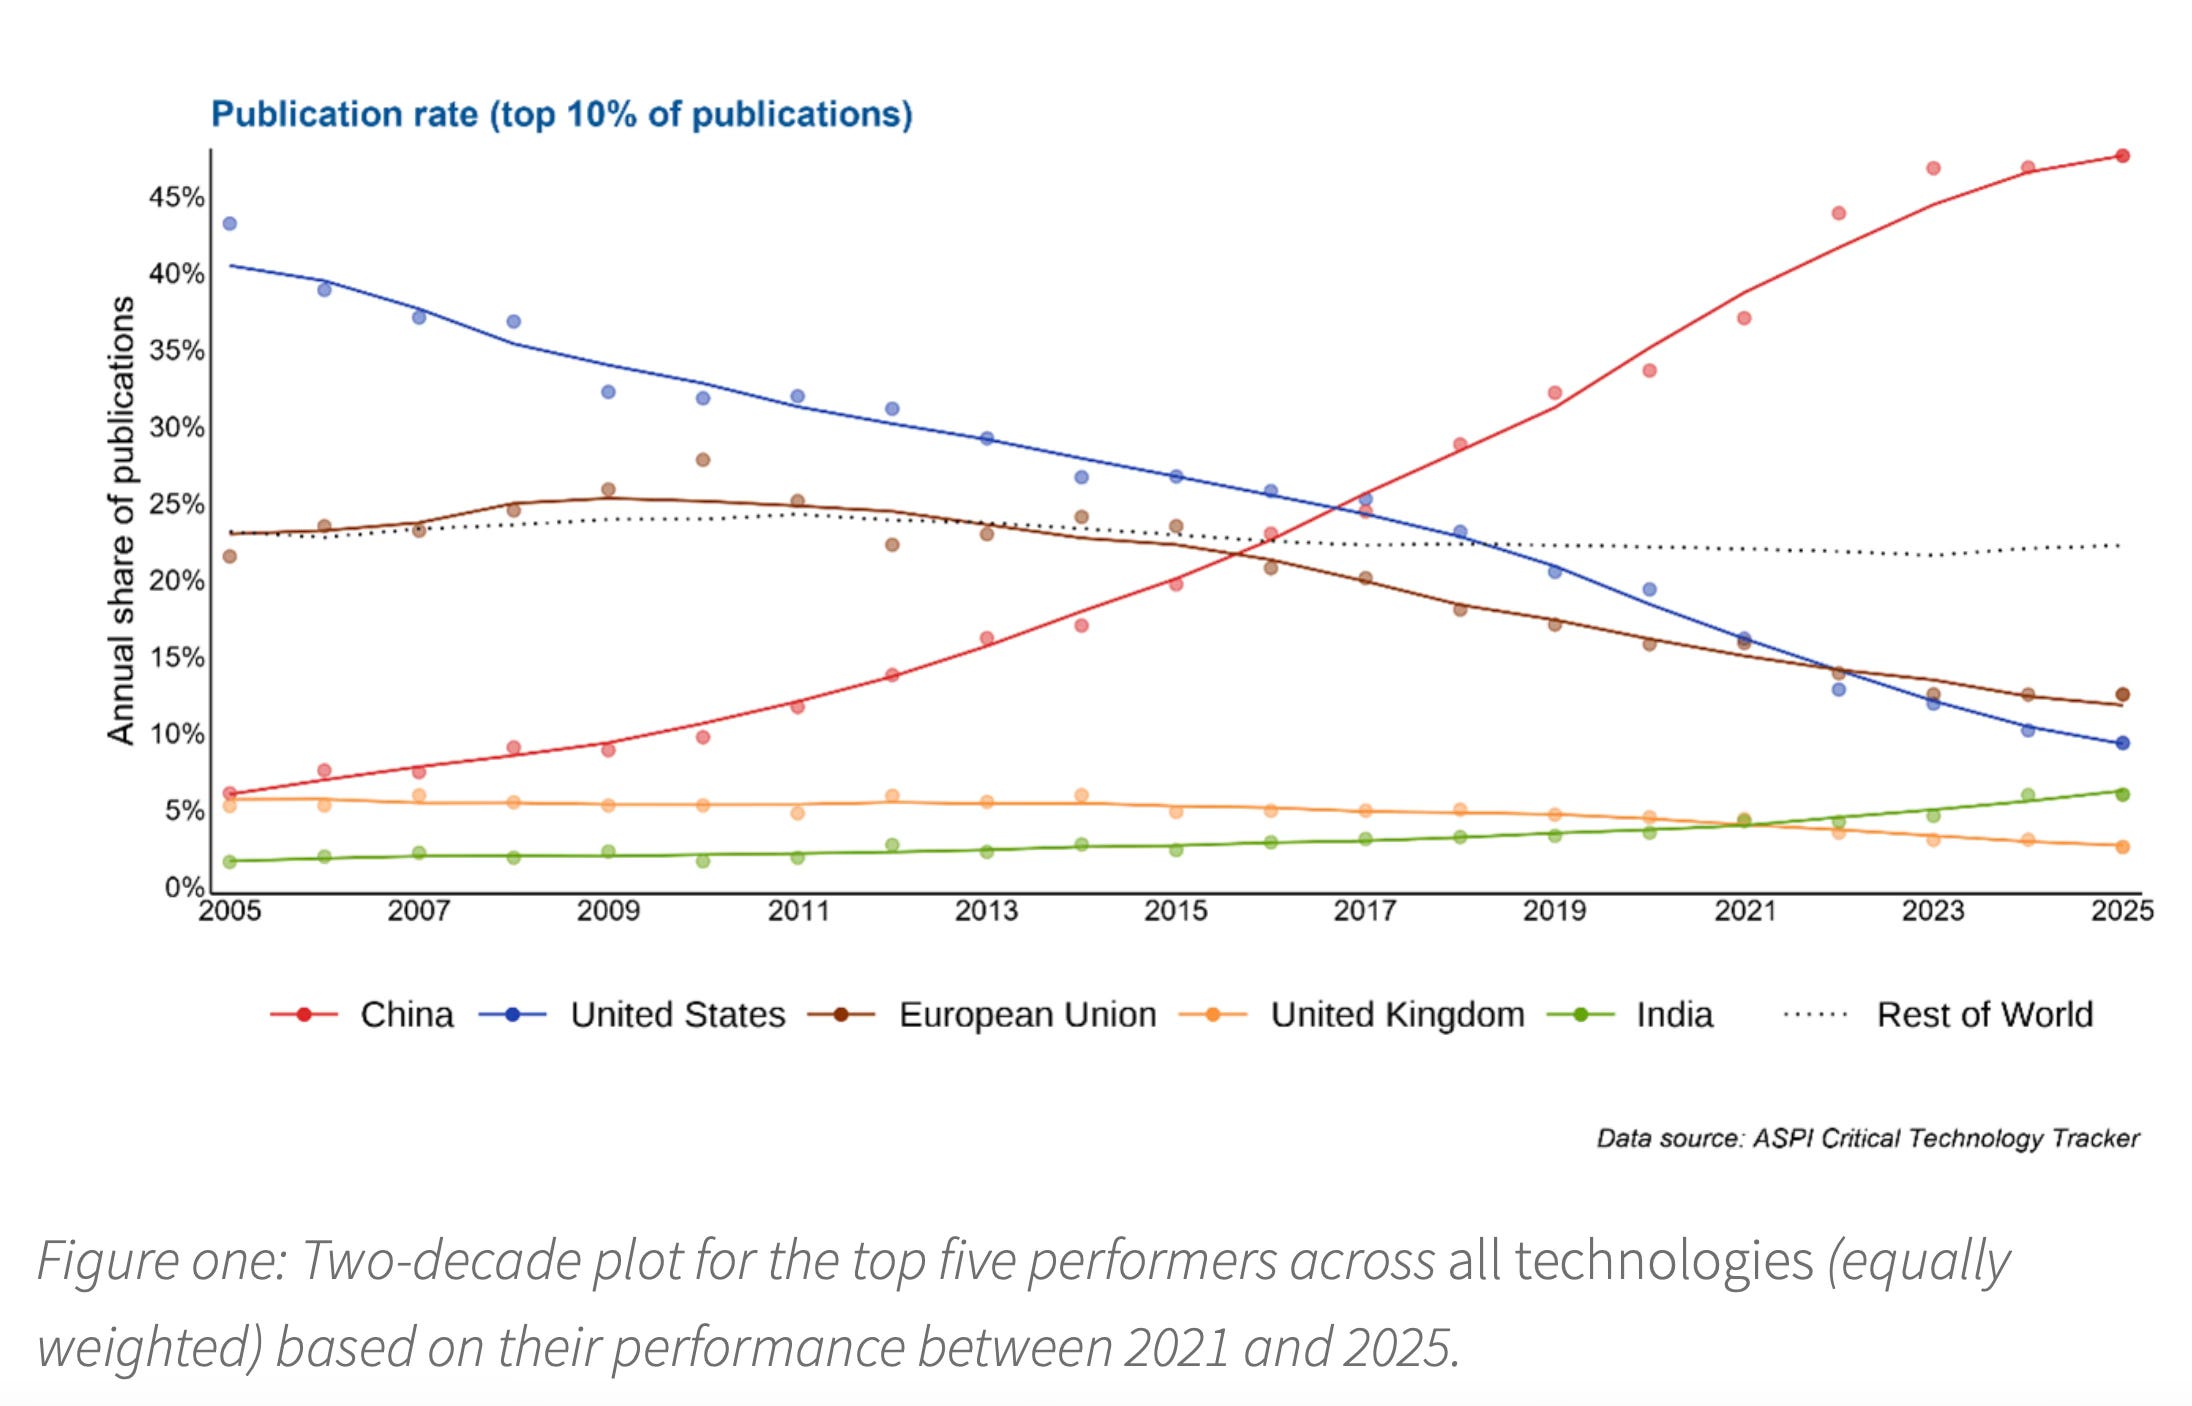
The latest annual report of the Australian Strategic Policy Institute (ASPI) covering high-impact global research in 74 technology areas found that China leads in 66 of them, with the US in the rest. The ASPI research, covering 7.7 million unique publications, shows how the US ceded its massive lead in research output in the first decade of the century.
It is encouraging that India has been gradually increasing its share of high-impact research. It ranks in the top five in research effort in 50 technologies, up from 43 last year. This is next only to the US and China and is higher than the UK in 48 technologies, South Korea in 32, Germany in 30, Italy in 14, Iran in 8, Saudi Arabia in 5, and Japan and France in just 4 each.
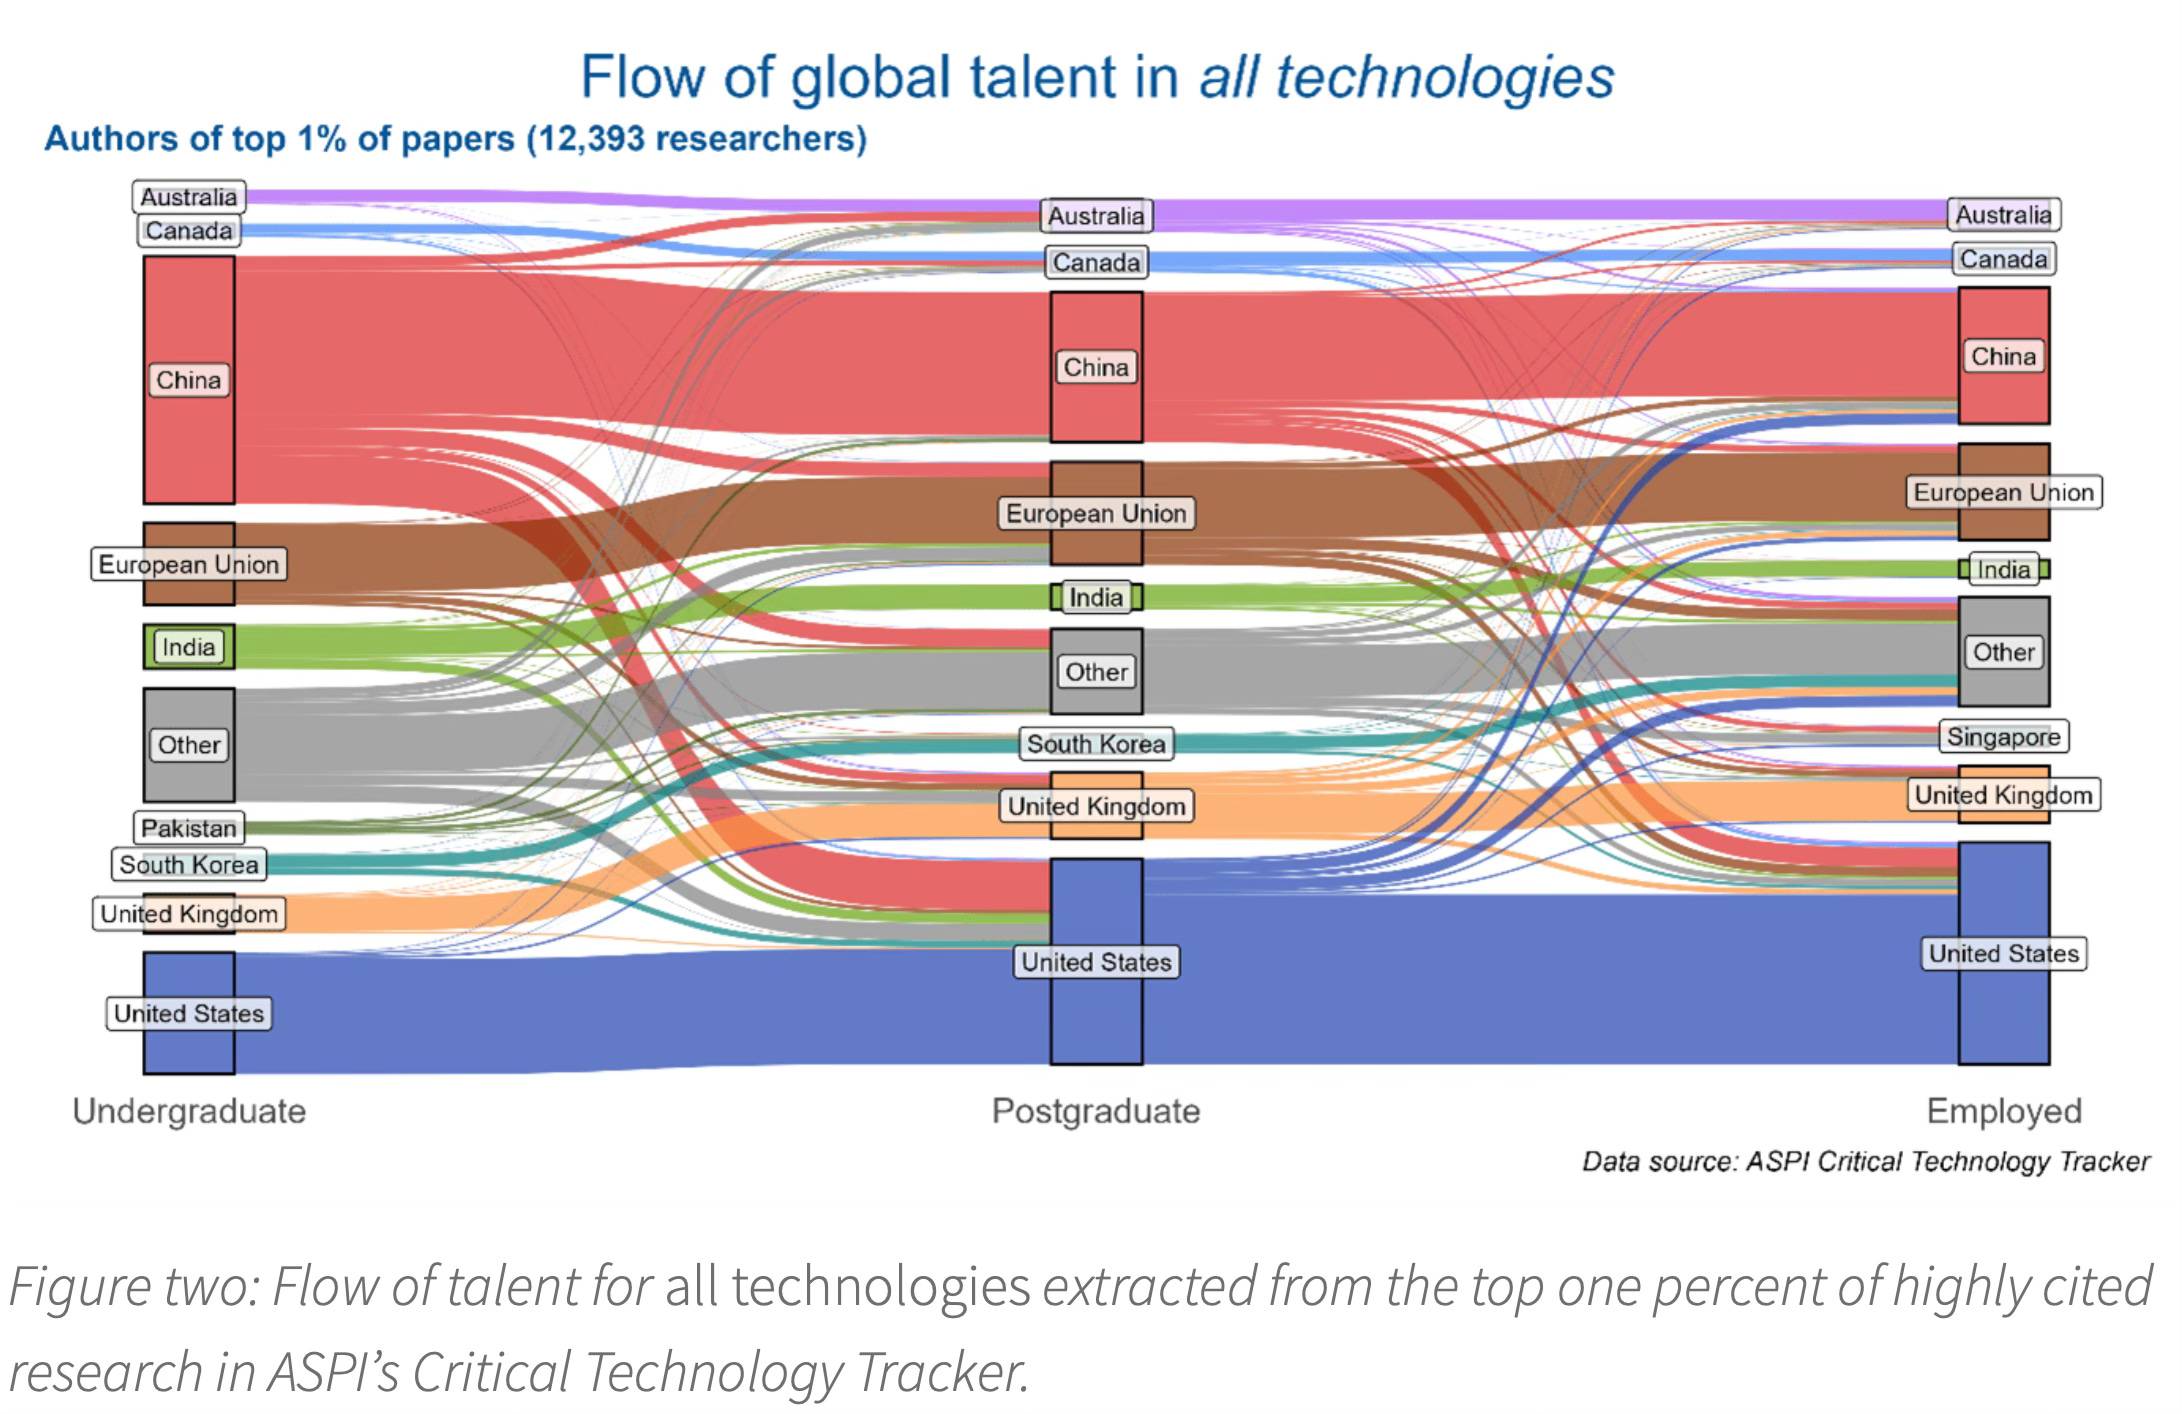
The report also has a Talent Tracker that tracks where authors (for research published between 2020 and 2024) of the top 1 per cent of most highly cited publications are currently working. This shows that the US employs the largest share of top-tier tech talent across both cohorts, with China and the EU following.
While Indians are only behind China and the US as the undergraduate education source for these authors, it falls far behind in being the postgraduate source and employment destination. In these, it competes with the likes of Singapore.
John Thornhill points to how China has come to dominate not just published research but also its application.
In 2005, China accounted for just 6 per cent of the world’s most highly cited research papers but that share had risen to 48 per cent this year. The comparable proportion of US publications fell from 43 per cent to 9 per cent… ASPI’s findings accord with Nature’s latest ranking of research institutions, tracking articles across 145 science journals. In terms of research output, nine of the world’s top 10 research institutions are Chinese with only Harvard University in the top tier. China is now mass manufacturing research; it truly has become a scientific superpower… A separate report from the Special Competitive Studies Project in the US earlier this year also highlighted the striking progress that China has made in adopting many frontier technologies. According to the SCSP’s staff assessment, the US is still leading in semiconductors, synthetic biology and quantum computing while China dominates in advanced batteries, 5G and commercial drones. But the most contested, and arguably most consequential, area is artificial intelligence.
A FT long read points to how China has come to eclipse the US even in R&D and innovation spending, and is rapidly pulling ahead.
For decades, China has been the world’s factory and companies have tapped into a low-cost labour force with few protections and cheap, dirty energy. The country’s scale — as a manufacturing base and as a consumer market — lured almost all the world’s biggest multinationals. But the underlying technology was retained by companies from the US and Europe. Now China’s research and development prowess is allowing it to compete, and potentially beat, the west. Whereas the biggest focus of US innovation has become potential moonshot technologies such as artificial general intelligence, for Beijing R&D largely focuses on addressing shortcomings in the real economy — part of Xi Jinping’s pursuit of technological self-sufficiency. After years of state, corporate and academic efforts to alleviate basic vulnerabilities, China’s advances are now setting up the country to dominate future global supply chains for energy and transport…
China’s R&D surge has been concentrated in applied areas tied to industrial transformation. This has included advanced materials, 5G, batteries, power equipment and other so-called “enabling” technologies that serve strategic goals… Many areas of Chinese R&D are at the sharp end of technological competition with the US, including artificial intelligence, robotics and quantum computing, bioscience and pharmaceuticals, aerospace and nuclear weapons. However, the OECD data reveals that a central focus for China over the past 15 years has been basic engineering and materials. China’s research advances across areas such as batteries, renewables and alternative fuels are edging the country closer to Xi’s aims of self-sufficiency by cutting a reliance on imported fossil fuels and tech across scores of heavy industries.
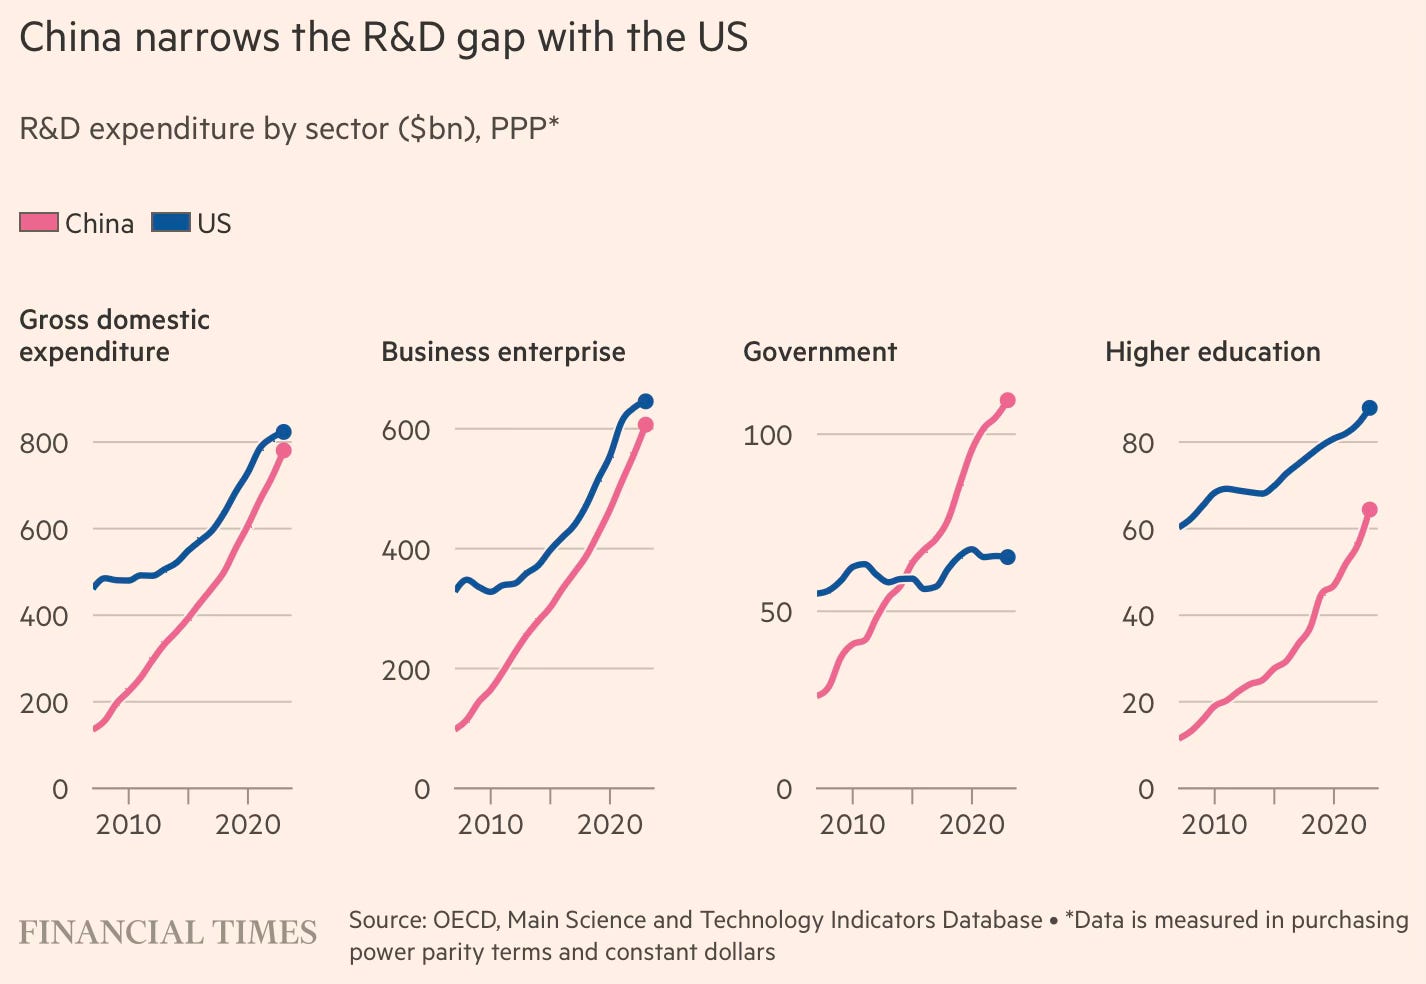
The article highlights the dramatic progress made by China in R&D efforts.
The country is close to overtaking the US in total expenditure on R&D, with China spending $781bn and the US $823bn in 2023, according to the OECD. It is a stark change from 2007 when China’s R&D spending of $136bn was less than one-third of the $462bn spent by the US… While government R&D spending in China has exceeded that of the US since 2015, Chinese companies have also rapidly increased their R&D efforts over the past decade, national statistics bureau data shows. The number of corporate R&D institutions has also nearly tripled to more than 150,000. And the number of corporate R&D personnel nearly doubled to 5mn. China is also producing around 50,000 PhD graduates in science, technology, engineering and mathematics (Stem) fields annually, compared to about 34,000 from US universities.
In fact, China is rapidly becoming the go-to place for businesses seeking to expand their R&D frontiers.
In Shanghai, long the country’s preferred hub for foreign companies, the number of foreign-owned R&D centres has increased to 631, as of September, from 441 in 2018. French automaker Renault does not even sell cars in China, but it is among those companies to have opened an R&D centre in Shanghai this year to learn from the local market. Beijing also saw 58 new R&D centres established by foreign groups in the first 10 months of the year, expanding the total number of foreign R&D centres in the city to 279, according to local officials.
China’s advantages in cutting-edge industrial R&D in industries where big data is an important input come from both its large population and lower regulatory barriers to taking research from the lab to the real world. China has been able to leverage these advantages in areas like autonomous driving, drug development, and AI.
As the FT long read shows, foreign car manufacturers have realised that their assisted driving functionality development efforts are far more likely to succeed in China than at home.
The technology (assisted driving functionality to customers), a forerunner to completely driverless cars, has taken the Volkswagen about 18 months to develop, test and now commercially deploy — all in China. It is the fruit of a 700-person research and development team comprised mostly of Chinese software engineers with masters or PhDs and more than five years’ experience. Asked how long it would have taken to deliver something similar back home, Hafkemeyer, who worked with Audi, Chinese state-owned auto group BAIC and tech giant Huawei before joining VW in 2022, sighs with exasperation. Typically, he says, the technology development cycle in Germany is a slog of around four to four-and-a-half years, where ideas are bogged down in endless internal debate and commercial negotiations with suppliers… Since 2018, Mercedes-Benz, BMW, Volkswagen and Stellantis have formed technology partnerships with at least 38 Chinese companies and research institutes, covering software, hardware, batteries and connectivity, UBS data shows.
Another article discusses the rapid advances made by China’s biotech industry, which has, in a short time, vaulted to the frontier in R&D and drug discovery.
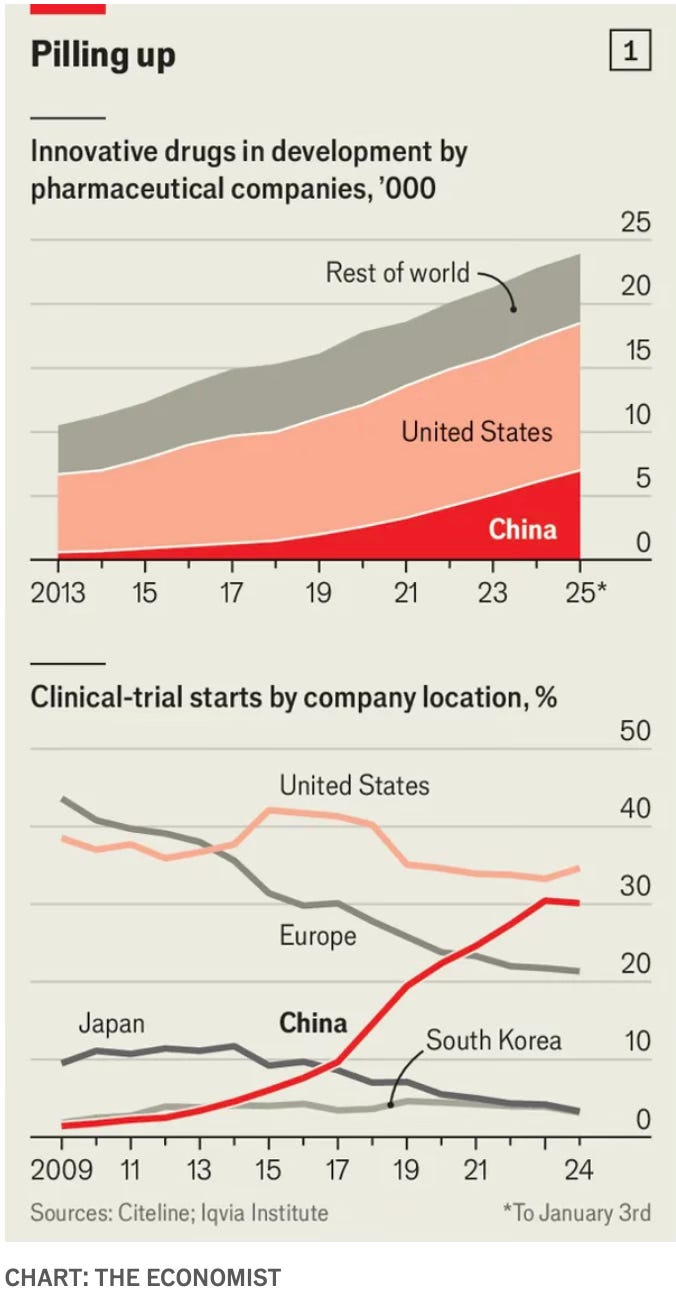
These trends extend to the pharmaceutical industry in general, where Chinese companies have been surging ahead in the drug development trajectory, and ran a third of all clinical trials last year.
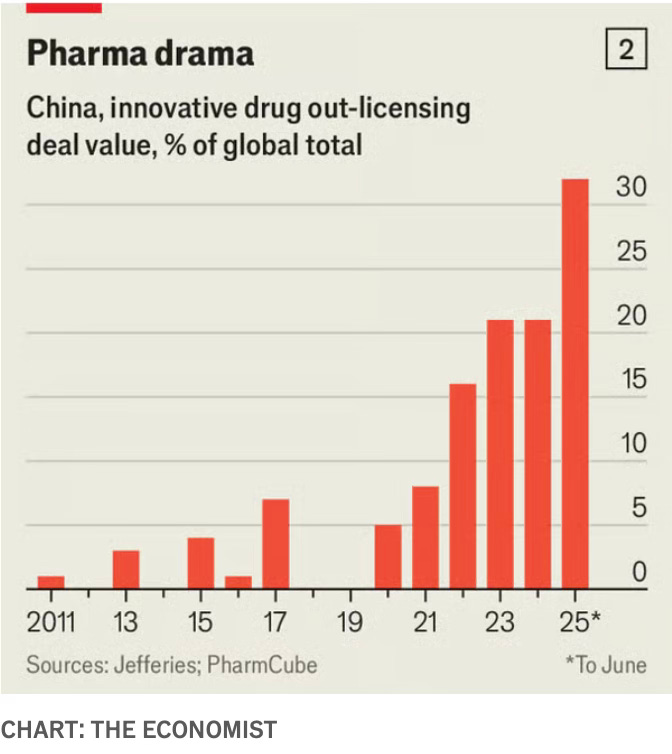
At the higher end of the value chain, Chinese firms made up nearly a third of all global licensing arrangements signed by the big pharma companies.
Cancer remains a central focus for Chinese firms… Weight-loss drugs are a hot target…local firms are not just copying. Bloomberg Intelligence, a research firm, reckons there are 160 new obesity drugs in development around the world; about a third of them are from China.
This is a brilliant description of the evolution of China’s pharmaceutical industry in the last quarter-century.
China has steadily climbed the rungs of the global drug supply chain. In the late 1990s and early 2000s, it nurtured a crop of generic drugmakers replicating off-patent medicines. It then moved into supplying active pharmaceutical ingredients, before becoming a preferred destination for outsourced biotech manufacturing and, later, drug development itself. At each step, Chinese clinical research organisations (CROs) and contract manufacturing organisations (CMOs), which develop and manufacture drugs on behalf of biotechs, accumulated expertise in ever more complex scientific and engineering processes.
The progression has turned outsourcing companies such as WuXi AppTec and GenScript into linchpins for drug development not only in China, but for biotech companies worldwide. “There is a joke in the US biotech industry that if you want to run a study, you ‘just WuXi it’,” says Ashoka Rajendra, founder of Orchestra, a San Francisco-based software platform for biotech companies. “There is an entire infrastructure in China that is supporting US and European R&D,” he says. “At first, companies would go to China for very specific deliverables, like making DNA or proteins. Then the work moved up the sophistication curve. It wasn’t just tasks with a precise set of instructions, but running studies and generating data.”…
Over the past decade, this same knowhow has been redirected from servicing foreign to local clients. China’s biotech sector is experiencing the same evolution seen in automotive manufacturing, consumer electronics and even textiles: from a low-cost outsourcing hub to a source of its own intellectual property. This shift is especially pronounced in biologics and cell therapy, areas that hinge on rapid experimentation and iterative lab work — tasks that are both cheaper and faster to execute in China.
The Economist has a similar description of how Chinese drug makers vaulted so quickly to the top.
The first answer concerns how quickly they innovated in order to produce “fast followers”, which improve on existing drugs’ safety or delivery. From there they were able to move on to “first-in-class” medicines with new targets (such as a protein or a gene linked to disease) or mechanisms (which might block or boost a target’s function). Fast-follower and first-in-class treatments now make up more than 40% of the industry’s pipeline, according to interesting research published last year in Nature Reviews Drug Discovery... Wang Xingli of Fosun Pharma, a Chinese drugmaker, explains that working on fast-follower drugs gave China’s industry the “courage to do the first-in-class”.
The second answer concerns the speed, scale and low cost of other processes. China’s firms can take a drug from discovery to the start of human trials in about half the global industry’s average time. Human trials themselves, usually the slowest stage in the development of a new drug, also move faster. A vast patient pool makes enrolment easier, and a large network of trial centres also speeds things along. This model has proved especially helpful for developing antibody-drug conjugates, a novel class of treatment that seems particularly potent at tackling cancer. One big-pharma executive says that China’s appeal lies in the sheer number of firms experimenting: “You can pick the winners and improve the odds of approval”... State insurance covers most purchases, pooling demand from hospitals and forcing firms into bidding wars. To win coverage, drugmakers must often slash prices by half or more to reach a wide patient pool, or accept a far smaller private market.
This is the journey that Indian generics manufacturers failed to travel despite having started much earlier than the Chinese. They have remained largely stillborn at the generics and Active Pharmaceutical Ingredients (API) stages.
This from the FT article describes the value proposition and advantages of Chinese biotech companies.
A McKinsey report… estimates that Chinese drugmakers can move two to three times faster than the global average in advancing a target molecule into a drug candidate and into early clinical trials. Once a therapy passes initial animal tests, patient enrolment for clinical trials in China is two to five times faster, depending on the therapeutic area, thanks to a large patient pool with unmet medical needs… It took officials just nine days to approve BiBo Pharma’s construction plans — a process that can drag on for up to six months in Europe, where Peng is scouting for another manufacturing site… According to McKinsey, the time it takes to enrol patients in clinical trials in China is about half the global average, and the cost per patient is roughly 50 per cent lower than in the US and Europe…
Chinese companies can achieve some of this speed and cost saving compared with western rivals due to generous state support… biotech start-ups that receive subsidies, cheap rent and start-to-finish assistance… Tapping into the country’s network of supply chains accelerates every stage of the research and development cycle, from discovery to scale-up manufacturing and clinical testing. Shorter timelines improve survival odds for early-stage biotechs, allowing them to test more ideas, kill failures quickly and improve their chances of discovering a blockbuster therapy…
Egan Peltan is one such US biotech founder who relies on Chinese suppliers. “Initially, the industry used Chinese CROs because they were cheaper. That is no longer true; their prices are similar. We use them because of the efficiency and time savings,” he says. For young biotech companies, supplier speed can be existential. “A project that takes a US CRO six to eight weeks would take a Chinese company about three . . . For early-stage companies with no revenue, every day you are waiting is money you have to set on fire,” Peltan says.
This speed, and associated lower costs, creates its set of advantages for Chinese companies (and their foreign partners).
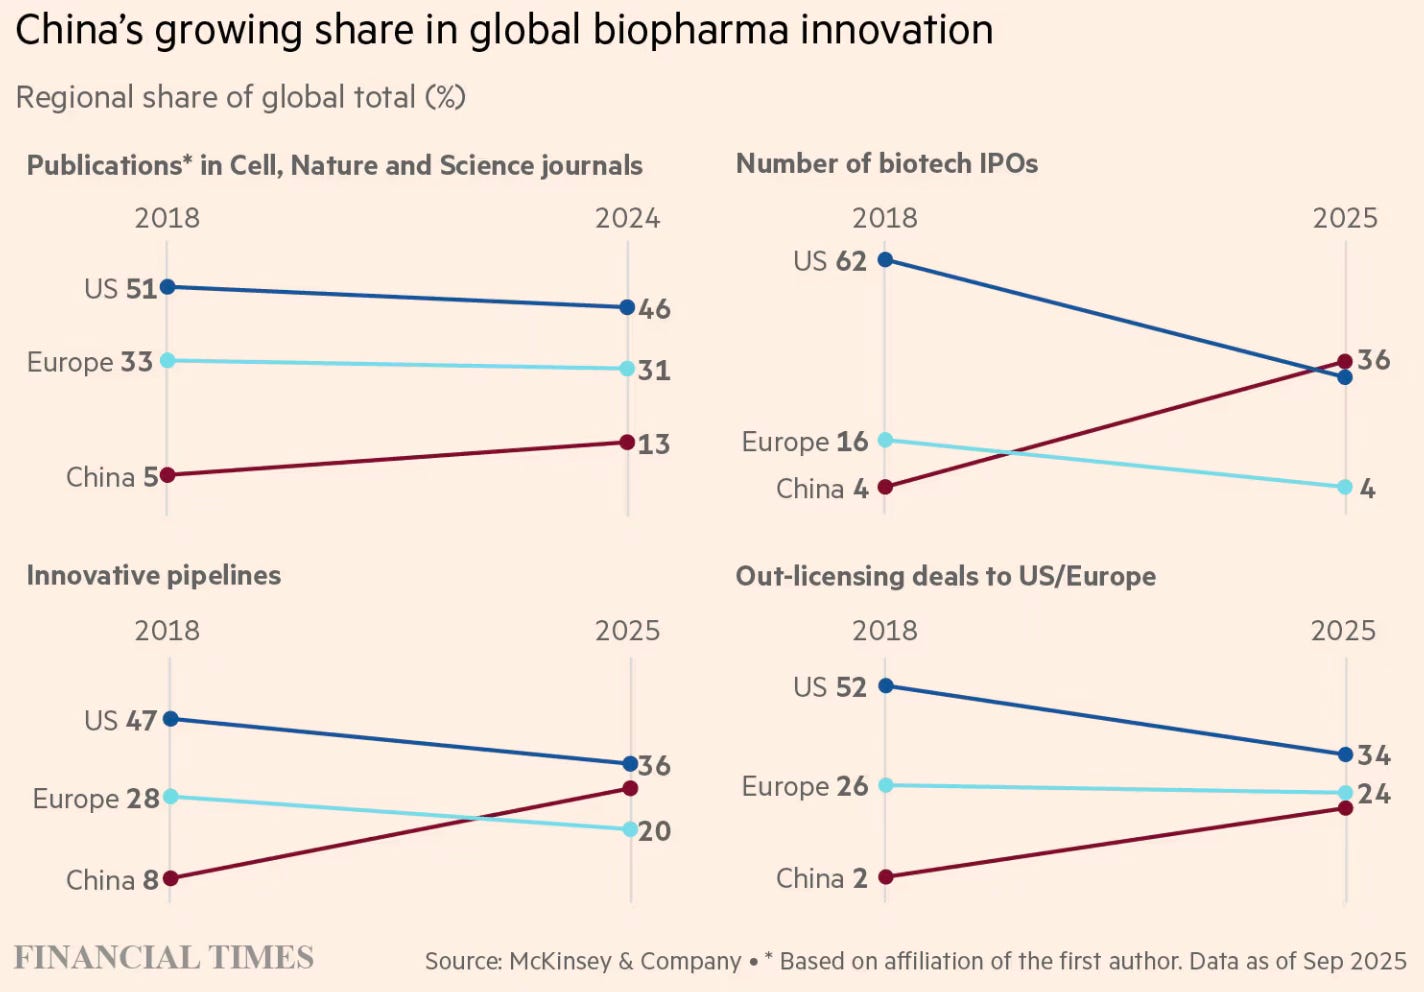
“Because the cost of developing a drug is so much lower in China, companies can afford a broader pipeline,” says founder and chief executive Stella Shi. “Where a US company might have to focus on a single asset, Chinese biotechs listing in Hong Kong typically have at least 10 candidates.” The data reflects that shift. China’s share of global innovative drug candidates in clinical trials has risen from 8 per cent in 2018 to 30 per cent this year, according to McKinsey. Over the same period, the US share has fallen from 47 per cent to 36 per cent.
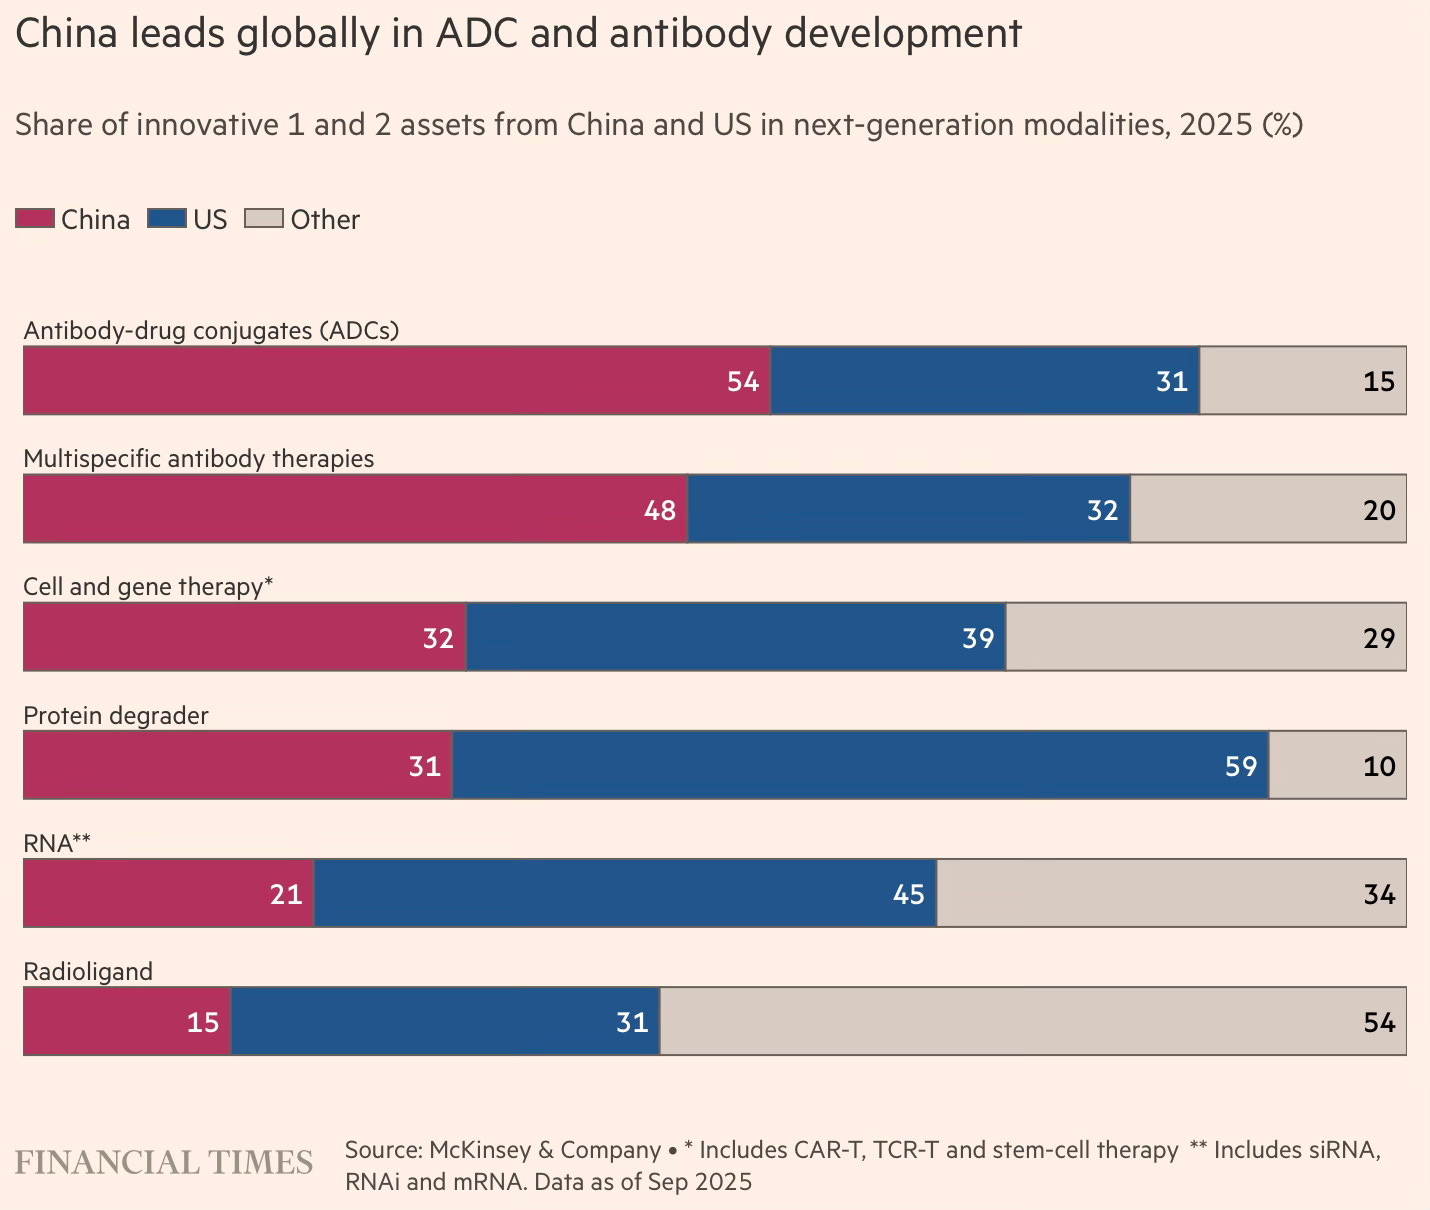
China’s strengths in biotech are concentrated in fields that demand intensive engineering and high-volume laboratory work to iterate and refine new therapies. This is particularly evident in antibody-drug conjugates (ADCs), so-called “biological missiles” that send chemicals directly to tumours, as well as multispecific antibodies, immune proteins that bind to the surface of cancer cells. McKinsey estimates that Chinese companies account for 54 per cent of innovative ADC assets in phase 1 and 2 clinical trials, and 48 per cent of multispecific antibodies… China’s growing capabilities have drawn pharmaceutical multinationals to the country to either buy or co-develop innovative drugs. China’s share of out-licensing deals to the US and Europe has risen from 2 per cent in 2018 to 20 per cent this year… China’s share of new drugs approved by the US Food and Drug Administration — defined as medicines containing active ingredients not previously approved — has risen from 1 per cent in 2018 to 6 per cent so far in 2025, according to McKinsey.
Antibody-drug conjugates (ADCs) are a good illustrative example of the strengths and value proposition offered by Chinese companies.
China’s strengths in biotech are concentrated in fields that demand intensive engineering and high-volume laboratory work to iterate and refine new therapies. This is particularly evident in antibody-drug conjugates (ADCs), so-called “biological missiles” that send chemicals directly to tumours, as well as multispecific antibodies, immune proteins that bind to the surface of cancer cells. McKinsey estimates that Chinese companies account for 54 per cent of innovative ADC assets in phase 1 and 2 clinical trials, and 48 per cent of multispecific antibodies. Sichuan Biokin, a listed company developing targeted ADC therapies for cancer, has 17 treatments in its pipeline.
ADCs drew significant investor enthusiasm in western biotech in the early 2010s, thanks to their potency in killing cancer cells. But many programmes stalled because of the difficulty in controlling toxic side effects. “ADCs have stronger tumour-killing power. The problem in the 2010s was that no one could solve the toxicity issue,” says founder and chief executive Zhu Yi. He describes the challenge as fundamentally an engineering puzzle: identifying the “right specific technical path” that allows a highly toxic payload to attack cancer cells without damaging healthy tissue. On this front, he argues, “Chinese companies have a natural advantage” due to the abundant supply of skilled technicians to run rapid-fire experiments and the relative ease of conducting clinical trials.
As with all other sectors where China today dominates, active industrial policy has played its facilitating role.
Zhang Fangning, McKinsey’s partner of life sciences in Greater China, says, “But the origins of this growth lie in factors that have worked in concert for more than a decade: a steady growth of talent and capital; supportive policies; a robust local supply chain; and the sheer intensity of engineers and scientists who are driving the execution.” Beijing accelerated this transition by prioritising biotech as a strategic sector both for economic growth and as a means to develop drugs tailored to the ethnic Chinese population. It introduced reforms in the mid-2010s that made it easier for biotech companies to raise capital and pursue innovation. Hong Kong then loosened stock market listing rules in 2018, enabling pre-revenue companies to list and the resulting wave of biotech IPOs ushered in venture capital investment. At around the same time, drug authorities in China relaxed clinical trial requirements for certain categories of innovative therapies, making it easier to progress drug candidates… Chinese regulators drive hard bargains on drug pricing, meaning companies must expand abroad to achieve the profitability needed for long-term growth.
Also this
Approval processes have been streamlined, priority reviews conducted for drugs tackling critical conditions, and regulations brought closer to international standards. The workforce at China’s drug regulator quadrupled between 2015 and 2018, and a backlog of 20,000 new drug applications was cleared in just two years. The time taken to secure approval for human trials shrank from 501 days to 87. And the output of new medicines soared. In 2015 China approved only 11 treatments, mostly Western imports. By 2024 the figure had risen to 93, with 42% developed domestically. These reforms have been matched by efforts to lure back students and professionals who had studied or worked abroad. Many of China’s “sea turtles”, as such returnees are jokingly known, came back with experience of building biotech firms and dealing with investors and regulators. Their entrepreneurial zeal was bolstered by rules making it easier to raise funds and to list on the Hong Kong stock exchange.
Echoing much the same, The Economist has another article that describes how China has come to dominate the automotive industry and is now threatening to do the same in the pharmaceutical industry.
A deep pool of talent, a broad manufacturing base and huge scale combine to propel it rapidly up the value chain. The production of robotaxis has piggybacked on mass EV manufacturing and a dominance in the supply of lidars and the other sensors needed for self-driving; scale has also helped bring down costs. Armies of patients enlisted in clinical trials and profits from generic drugmaking have speeded up pharma innovation.
A more surprising ingredient of China’s success is its nimble and permissive regulators. As in other industries, local governments have offered firms cheap credit and other help. But it is agile rulemaking that has really turbo-charged progress. Soon after political leaders set out their ambition for China to become a “biotechnology superpower” in 2016, the country implemented a number of reforms… Likewise, China was early to experiment with robotaxis. Local officials, keen to attract talent and investment, approved pilots at a rapid clip and installed sensors and other digital infrastructure to help guide self-driving vehicles; trials have run in over 50 cities. Many have experimented, too, with laws on liabilities and guidelines for testing. Though accidents have sometimes caused a hiatus, pilot schemes have helped engineers and policymakers understand the new technology.
Cut-throat competition at home imposes harsh conditions on individual companies, but the survivors are conditioned into becoming hypercompetitive export champions. China’s robotaxi operators compete with each other and with cheap human-driven taxis in an economy gripped by deflation. New technologies receive subsidies that ultimately come out of the pockets of its underpaid people. Many lossmaking enterprises will not survive the resulting price wars. But those that do will look overseas to make money.
The FT article also points out that the Chinese companies’ next challenge is to break into the global markets. It is here that they find value in foreign multinational drug companies.
China’s strengths in developing novel medicines lie in fields where the foundational research has already been established, but laboratory work is needed to figure out the right formulations… “China’s early-stage R&D is now globally competitive. But for late-stage development — overseas trials, regulatory filings and commercialisation — Chinese firms still have significant room to grow,” says UBS pharma analyst Chen Chen. “That won’t always be the case,” she adds. By partnering with multinational drugmakers to take products abroad, Chinese biotechs can “secure funding for continued innovation while learning from partners’ strengths in clinical development and commercialisation”. “Over time, Chinese companies will build their own global capabilities,” she says…
Josh Smiley, chief operating officer at Zai Lab, says it will take time for companies in China to develop “systems that contemplate global development. We’re going to continue to see really good innovation come out of China in the next few years. But in many cases, those innovators are going to need a partner to help them with development,” he says. They must also create international sales forces, navigate foreign regulatory systems and cultivate supply chains outside China, especially as western governments push to create localised manufacturing for critical industries such as pharmaceuticals. For many Chinese biotechs — often unprofitable and with volatile revenue — these investments remain out of reach…
“Partnering with a multinational lets us learn first-hand how global operations work. It’s like having a personal tutor showing you, day by day, how to build a global business,” says Sichuan Biokin’s founder Zhu Yi. Working with larger foreign companies, he adds, has helped Sichuan Biokin understand the organisational structures and capabilities needed to scale. “We mirrored that and learnt by doing. But we have also seen the weaknesses of Big Pharma — the bureaucracy and inefficiency — which has helped us avoid detours as we grow.”
In other words, Chinese pharma companies are now relying on foreign firms to do exactly what their counterparts in different sectors have done to build their capabilities, and then overtake and marginalise their foreign partners. The outsourcing of even research and clinical trials, and not just manufacturing, to Chinese firms also parallels the strategy followed by multinational corporations in other sectors on their path to marginalisation. Notwithstanding these sobering tales, attracted by the immediate commercial benefits of cheaper and quicker contract research, manufacturing, clinical trials and drug development processes, the US and European pharma companies are likely to overlook the long-term consequences. In the process, they are likely to build Chinese capabilities and fall by the wayside.
Given the demonstrated willingness to weaponise its manufacturing dominance, any Chinese dominance in an industry like pharmaceuticals will be even more dangerous. Further, unlike with other products, the issues of health safety and side effects are critical considerations with drugs, and the concerns with the quality of clinical trials and other tests done by Chinese pharma companies will remain a matter of concern. It is, therefore, important that US and European policymakers step in immediately to restrict their pharma companies from making such investments in China and forging partnerships with Chinese pharma firms. These kinds of decisions are easier to make when the market trends of outsourcing, licensing, and partnerships are in their early stages.
In this context, China’s pharmaceutical companies with their cheaper drugs will be attractive to consumers in developing countries. Imagine an Ozempic at a fraction of the price. For these countries that are already dependent on the US and European drug companies, the prospect of replacing them with Chinese companies is unlikely to be a problem. We should not be surprised if Chinese drugs come to dominate the markets across the developing world in a short time.
Here, India is in a unique position. It is unlike the other developing countries in that it has serious national security issues with China, and it has its own large pharmaceutical industry with aspirations to move up the value chain. Given the inevitability of Chinese drugs becoming available in the near future, and that too at lower prices compared to the Western alternatives, it may be prudent for India to tightly restrict their access to the Indian market.