Substack

Showing posts with label Transportation. Show all posts

Monday, August 31, 2026

Some thoughts on the Hyderabad model of urban growth

This is a long read, triggered by a recent article in The Economist lauding Hyderabad’s vertical growth-enabling policy. 

It is an opportunity to think more broadly about the drivers behind Hyderabad’s spectacular urban growth over the last three decades, one with few precedents in India. Also, to avoid drawing the wrong lessons from the city’s success in economic growth and real estate development, this post will provide some qualifications. It will point to the role of the government, the political economy and the role of large developers, and the consequences of deficient urban planning. Finally, it will offer some comparison between the Hyderabad model and those of Gurgaon and Shenzhen.

The Economist article lauds Hyderabad’s vertical growth and the enabling policy of the government. 

Hyderabad, unique among India’s cities, abolished fsi in 2006. And then, miraculously, life went on. NIMBYs foretell all sorts of doom the moment anyone talks about building anything. They warn of Gothamesque ghettos with gridlocked streets, dry taps and overflowing sewers. Nonsense. Today tall residential blocks line the highways in Hyderabad’s western suburbs and traffic still flows faster than in most major Indian cities. Dozens more towers, including the Trump ones, are sprouting in a neighbourhood called Kokapet that was not long ago full of custard-apple orchards and is now a forest of construction cranes. 

There are two reasons Hyderabad has not descended into dystopia. One is its 160 km-long orbital motorway, the first bit of which opened in 2008 and is now an arterial road in the new skyscraper belt. The other is that abolishing the arbitrary cap on FSI did not mean the abandonment of all rules. Regulations covering minimum street widths and required setbacks still apply. Aviation authorities impose restrictions around air-traffic funnels. The effect is that developers can build high only if they have a large enough plot next to a wide enough street somewhere far enough from an airport. Markets decide the rest. The cost of construction rises with height, so a builder’s decision about how much to pay for land and how tall to go rests on whether potential buyers of flats will cough up enough to make the project profitable. That has prevented a housing bubble.

For a start, Hyderabad’s spectacular urbanised growth over the last three decades owes primarily to government actions. Four, in particular, stand out. 

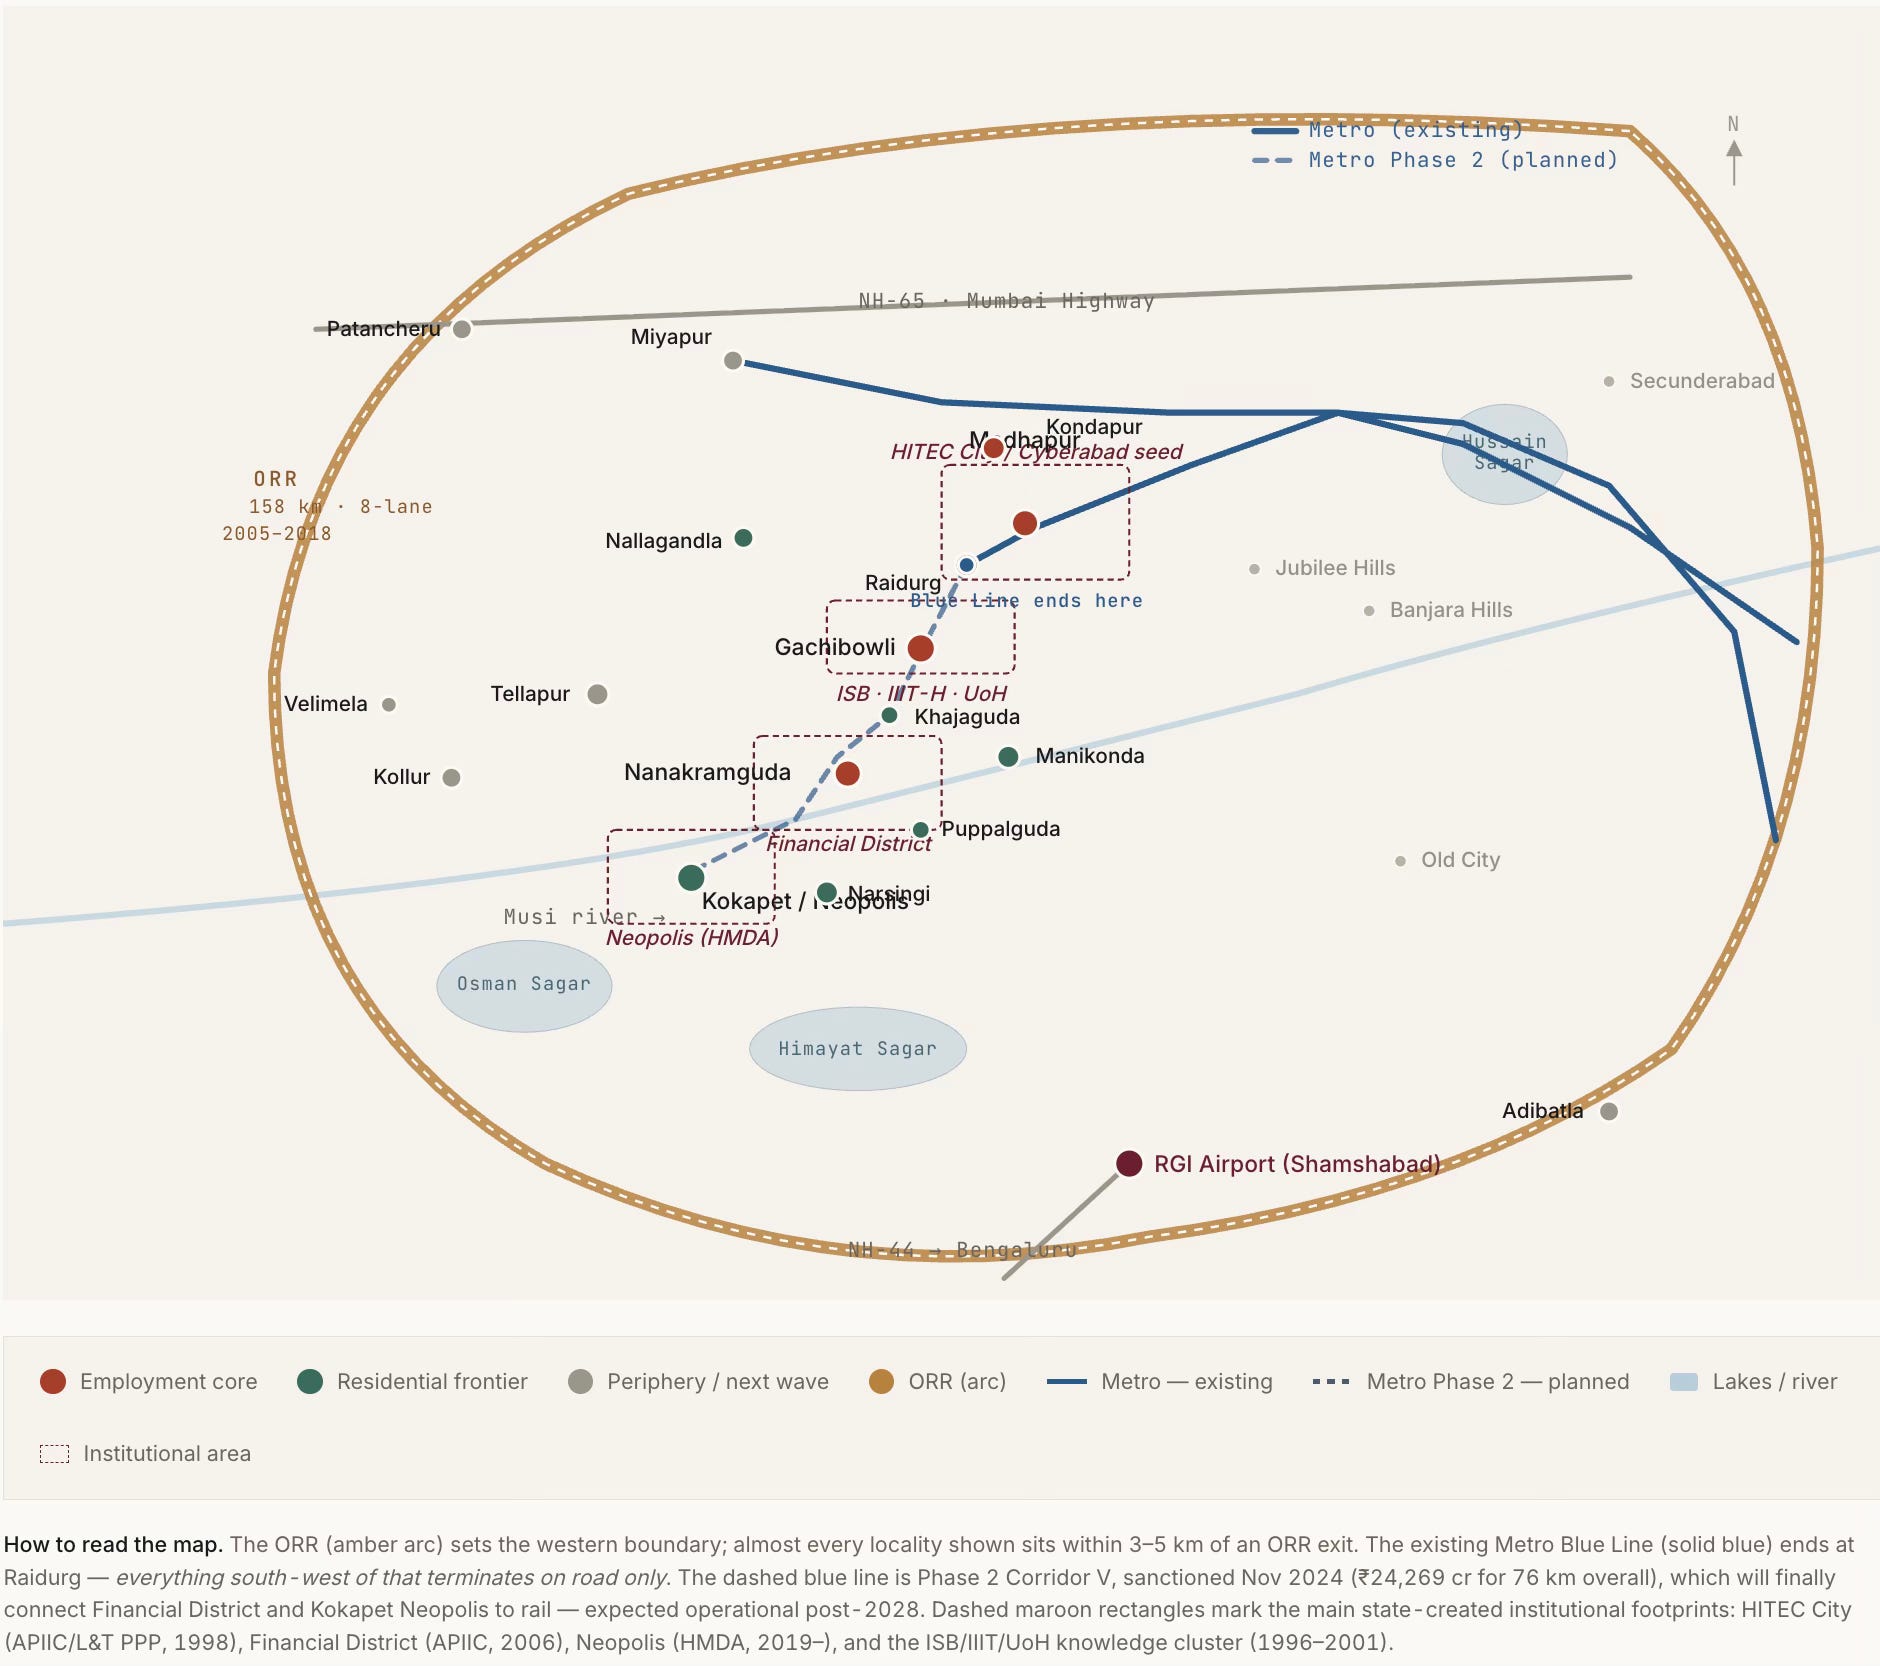
1. The spurt of IT services industries locating to Hyderabad provided the economic anchor to sustain the spectacular property development that followed. Its emergence owes all to government policies. From having nothing apart from a small software cluster at Mythrivanam, the spectacular boom in the IT industry was catalysed by the conscious efforts of the then government of Andhra Pradesh in the mid to late nineties. It established the 158-acre HITEC City at Madhapur through a PPP between APIIC and L&T, with Cyber Towers being the iconic building. The then Chief Minister, Mr Chandrababu Naidu, toured the US and Singapore extensively, wooing software firms, and his efforts culminated in Bill Gates's visit in 2001 and the announcement of Microsoft’s largest R&D centre outside Redmond. It was followed by GE and ICICI and a flood thereafter and continues to this date, expanding to all kinds of sectors and innovations. The Cyberabad brand took off. 

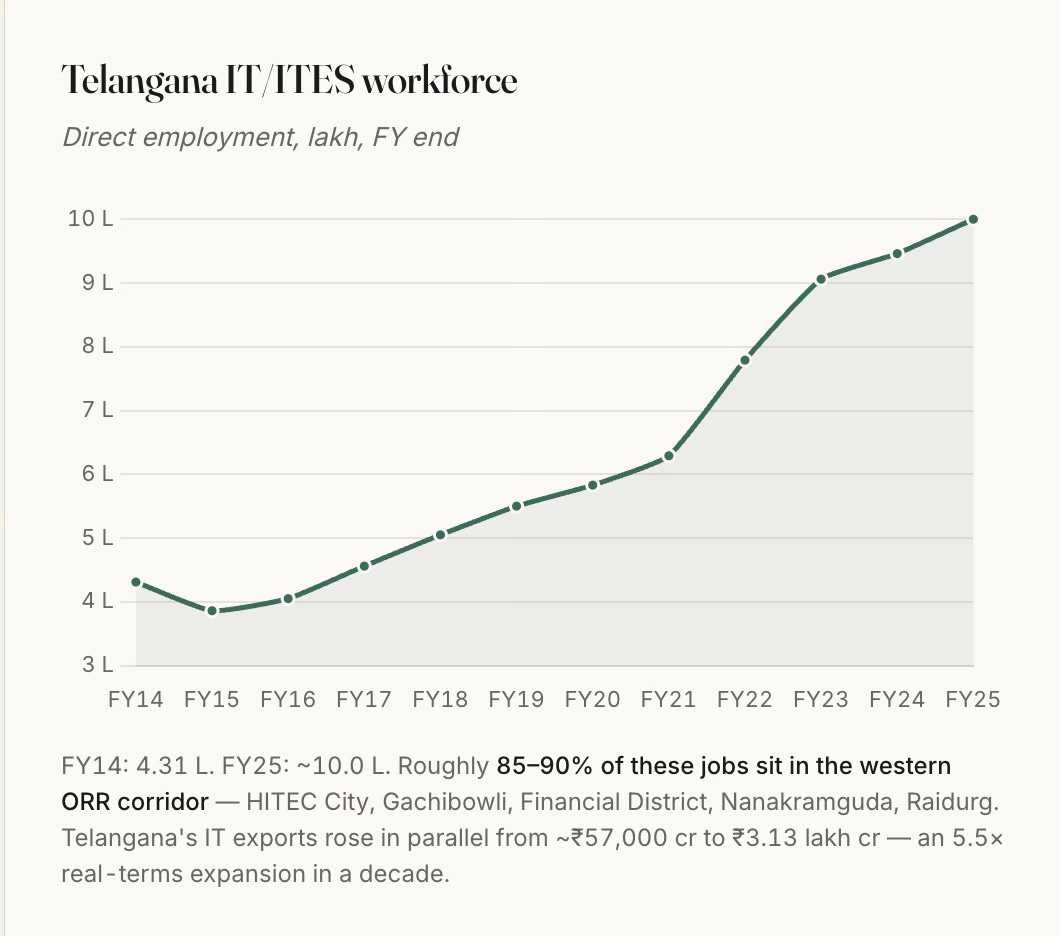
Starting with a few hundred in the early nineties, Telangana state’s IT employment has moved from 0.4 million in FY14 to about a million in FY25, and 85–90% of that sits in the western Hyderabad corridor. 
2. The state’s IT services push was supported by the Andhra Pradesh Infrastructure Investment Corporation (APIIC)’s model of acquiring land, developing trunk infrastructure (transport and utilities), and leasing/selling with clear titles through a single window at concessional rates to incoming firms. This too, like with the ORR, had its set of controversies and scandals.

Apart from the L&T HITEC City, APIIC developed the initial 100-acre Financial District at Nanakramguda, and several others. HMDA has been the price-discovery mechanism for the entire premium belt through its periodic auctions that have unlocked vast extents of government lands. The high premium commanded by these auctions is also because the state layout provides serviced plots with clear title. This is closer to a Chinese SEZ-style state land-lease model than to Gurgaon's private-land-assembly model.

3. The Outer Ring Road (ORR) has been transformational to the urban growth in the western part of the city. Notwithstanding all the controversies on the alignment finalisation, land acquisition, contracts, and tolling, the Hyderabad ORR should count as a totemic example of high growth-catalysing infrastructure investment in India’s history. It unlocked value by enabling the vast hinterland of barren and rocky lands to become productive centres. It was a truly visionary project when conceived in the early 2000s and even when its execution started in 2005. 

The ORR enabled orbital and radial access to the city, thereby resetting the commute dynamics and unlocking vast barren lands, reducing times by multiples. It is no surprise that every land price in the corridor is capitalised against ORR access time. HMDA’s designation of a 1-km high-density buffer on either side of the ORR effectively unlocked about 316 sq km of premium-development-eligible land, the value created from which dwarfs the ₹6,700 cr cost of the road itself.

The ORR did the work of several economic growth crowding-in instruments, and produced the pattern of intense capitalisation of access to it, and (on the flip-side) the neglect of everything it does not touch.
4. The last enabler, the subject of The Economist article, is the deregulated development control regulations, specifically the unlimited FAR adjoining wide roads brought in by the GO Ms No 86 of 2006. In fact, even among the DCR, the GO’s success was only in its deregulation of the FAR. The high FAR manifests in the most salient aspect of Hyderabad’s real estate growth, the skyline of massive high-rises. 

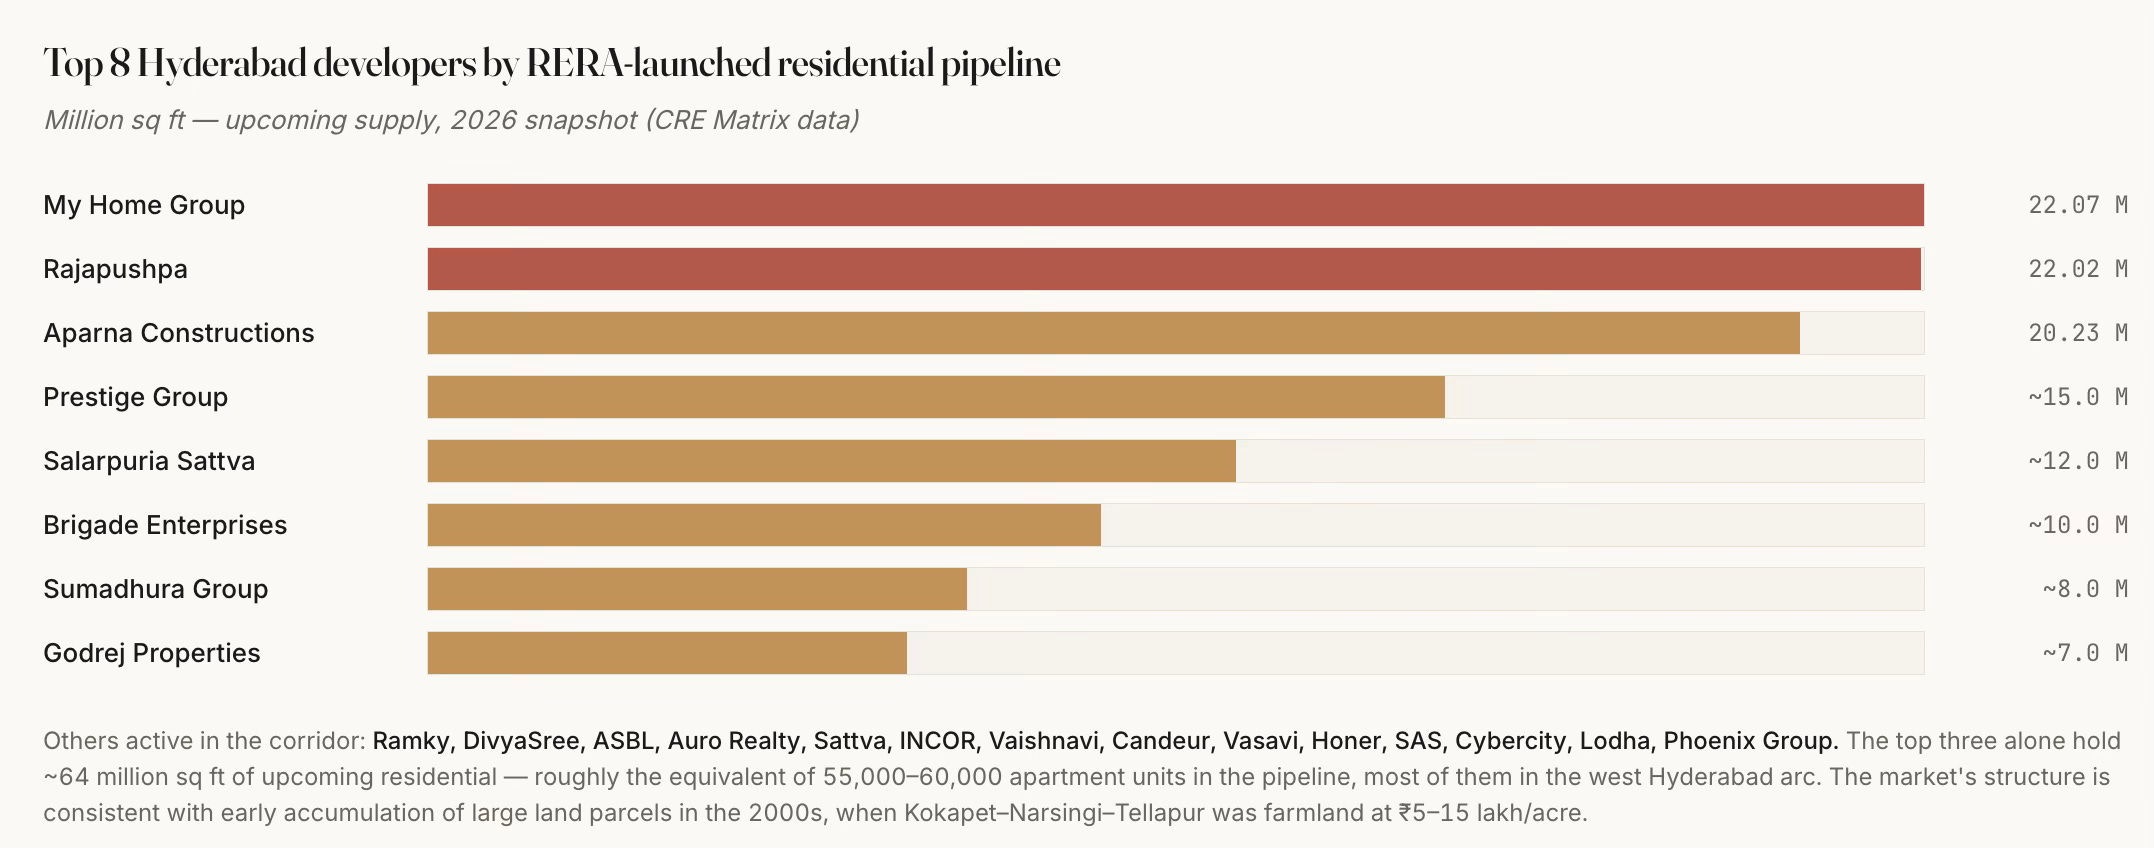
Even with all the above, it also critically required the enterprise, vision, and risk appetite of a handful of local real estate developers (My Home, Rajapushpa, Aparna, etc.) who hoarded large land banks in anticipation of the developments since the late nineties and early 2000s in the run-up to the boom. Only large real estate developers could afford to take the risks that lock up huge upfront capital and endure the vagaries of business cycles. 

However, it has managed to escape the market concentration that characterises markets like Gurgaon. The nature, scale and pace of development have also ensured that while a dozen developers account for the bulk of Grade-A supply, and the top three alone control about 64 million sq ft of upcoming pipeline, there is a long tail of over 30 mid-tier local names.
Such entrepreneurship could also flourish only in a political economy and social milieu which condoned the often questionable overlapping of public and private interest, and deep-rooted corruption. Governments changed, but the underlying model and ongoing work continued unhindered. It is a very good example of Mancur Olson’s stationary bandit at work. 

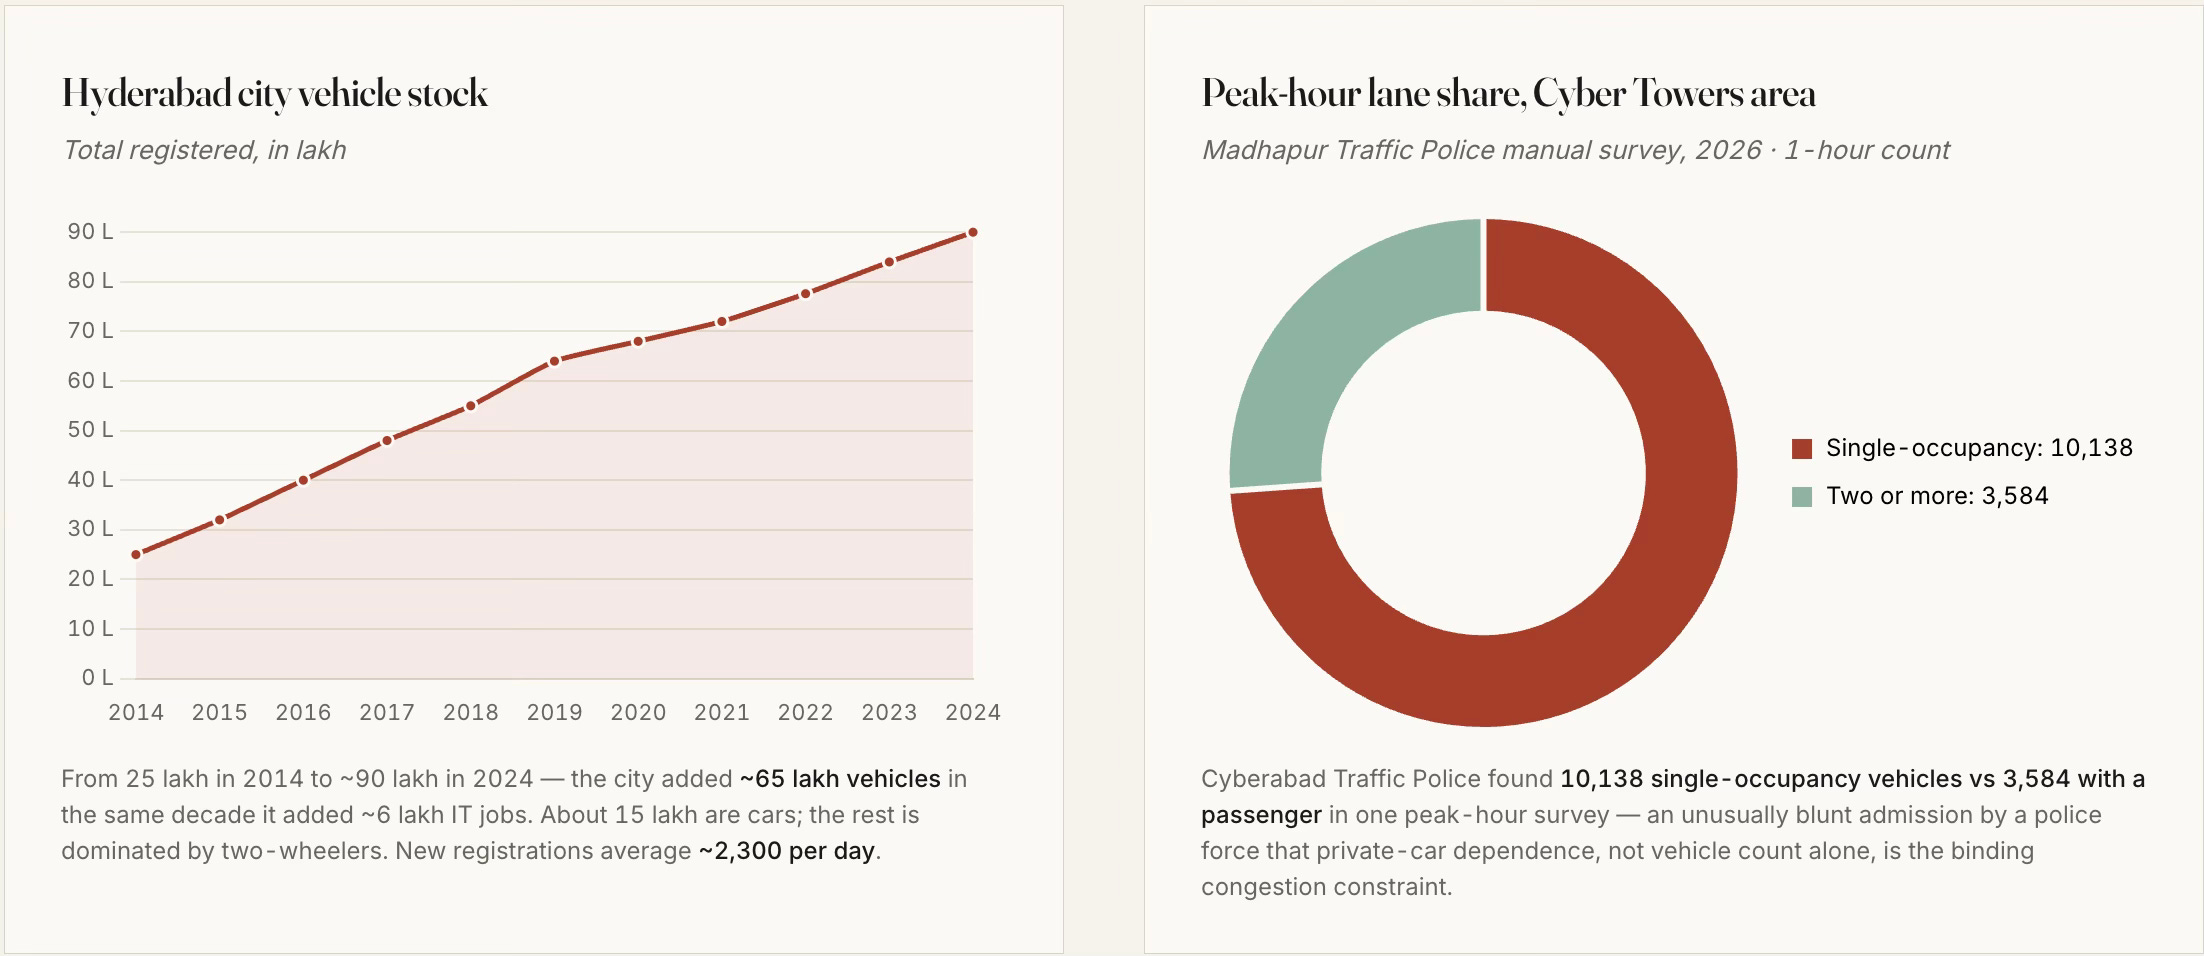
The combination of the 158-km Outer Ring Road, an unlimited-FSI building regime, a hospitable IT policy, and a handful of developers with 2000s-era land banks has added roughly a mid-sized city's worth of office, housing and vehicles to a 200-square-kilometre arc of west Hyderabad in about a decade-and-a-half. The public sector supplied the foundation. The private sector built on it. What emerged are pockets of car-dependent, single-use, higher-income, gated communities, with limited mass transit or affordable housing. 

This brings us to the issue of urban planning. 

Here, apart from the single instrument of unlimited FAR in the development control regulations, it is notable that the state fell short on the critical aspects of urban planning - master-planned mixed-use, walkable street grids, timely metro and mass transit access, transit-oriented density transfer, affordable housing, and vibrant public spaces and community life (apart from those in the gated communities). Even the unlimited FAR has its set of problems. 

However, it can also be argued that more than state failure, these outcomes were the result of private incentives and the political economy overwhelming urban planning imperatives. The reality of developers with large land banks near the ORR and their close relationships with both politicians and bureaucrats trumped all other factors. 

In any case, they have had several undesirable long-term consequences. Here are a few.

1. Residential real estate development has almost completely taken the form of high-rise gated communities and villas, all serving the upper middle-class and above. Affordability has been the casualty. 
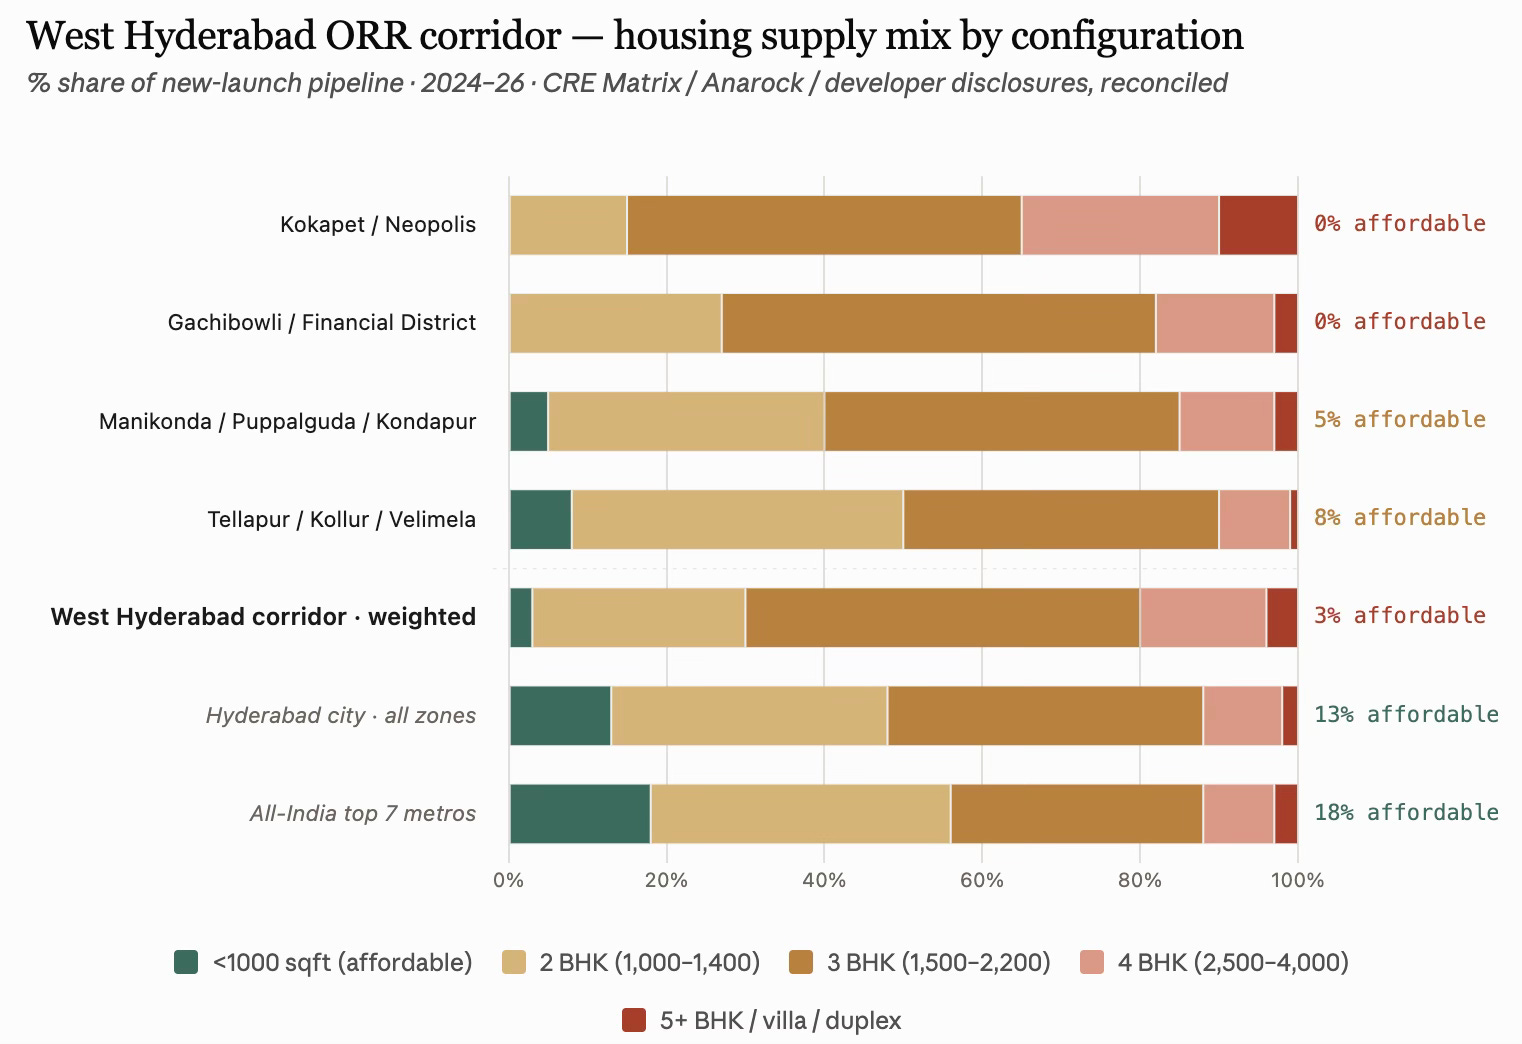
The sub-1000 sqft supply is a mere 2–4% of the west corridor’s pipeline, versus 13% for Hyderabad city and 18% at the all-India top-7-city level. Apart from public housing under various government schemes, it will be a big surprise if there is even one development of housing in the 600 sqft range and below, catering to the lower-income class. The corridor’s default product is a 1,500–2,200 sqft 3 BHK, forming half of everything built, and easily catering to the upper-income class. 

This is a resounding nod to the reality that even in the most deregulated contexts and rapidly growing economic regions, affordable housing and lower-income housing will remain heavily under-supplied. It must be acknowledged as an area of market failure, requiring policy action. 
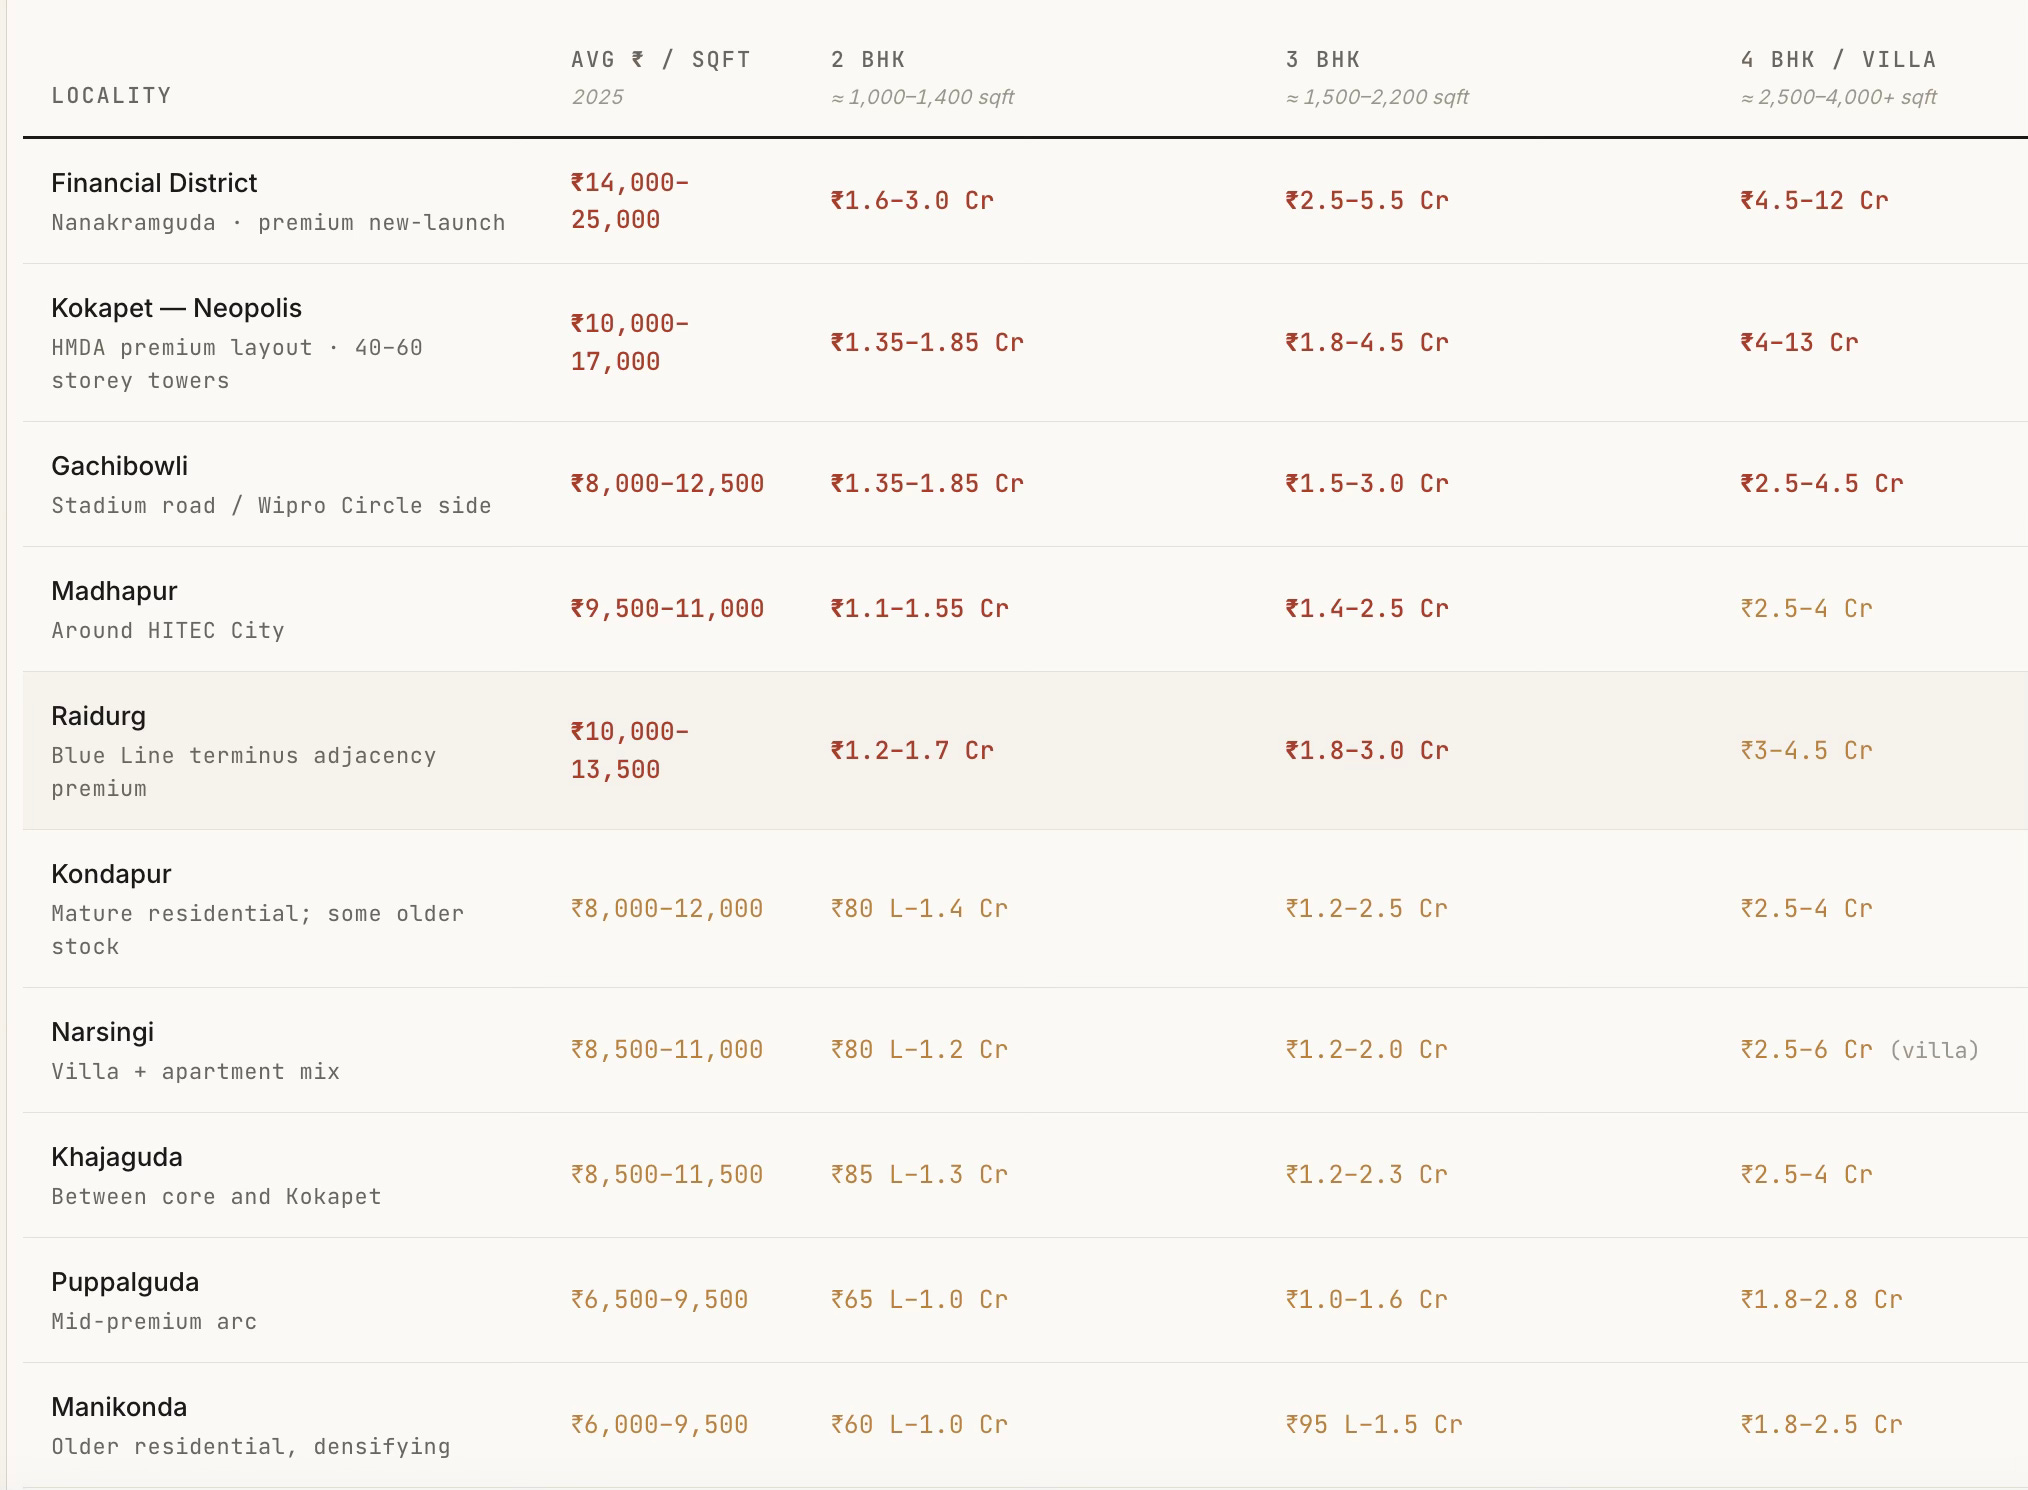
A ₹10 lakh household income supports roughly a ₹65–80 lakh home, which puts everything from Kokapet, Financial District, Gachibowli, Madhapur, and Raidurg out of reach for a typical mid-career IT professional. Even a ₹25–30 lakh household income (senior IT / GCC AVP) is stretched at ₹2 Cr pricing in Financial District. What this means is that the corridor is now selling primarily to senior tech and finance executives, NRI, and dual-earner-tech/finance households. Junior and mid-level tech workers are being pushed to Tellapur/Kollur/Miyapur. Even in these peripheral areas, sub-1000 sqft housing reaches only about 8%. 

2. The revenue bias of the state government may have compounded the problems. The massive premiums commanded in the land auctions, coupled with the restrictive DCR (on setbacks and open space requirements), have distorted the real estate market and skewed it significantly upwards. For illustration, at ₹150 cr/acre for Neopolis land, the input land cost alone works out to ₹8,000–10,000 per saleable sqft (assuming 2.5–3.5 FSI usable given the large setback and open-space rules). Add construction (₹3,500–5,000/sqft for a premium tower), financing costs (typically 12–18% of project cost), developer margin (20–30%), and GST and other statutory levies/fees, and the total cost comes to ₹13,500–17,000/sqft. This land economics forces ₹4 Cr and above units. In contrast, in Velimela, where land is still ₹5–10 lakh/acre (not for long, one would imagine), 2 BHKs can come at ₹40 lakh. 

In fact, it can be safely said that the entire land-use regime consisting of the ₹150 cr/acre Neopolis land price, the setback rules that make sense only for large plates, the developer economics that require more than ₹80 lakh units to sustain the ORR-belt cost stack, has displaced sub-1000 sqft out of the ORR corridor. The real affordable-format supply in Hyderabad now exists outside the ORR corridor’s western arc, in Miyapur, Bachupally, Nizampet, Kompally (north-west), Kukatpally (central), Uppal, Nagole, LB Nagar, Ghatkesar (east), and Rajendranagar, Shamshabad, Adibatla (south). These are outside the ORR corridor’s western arc. Anarock’s Q3 2025 Hyderabad realty breakdown indicates that 87% of the new supply added was in the premium, luxury, and ultra-luxury segments, priced upward of ₹80 lakh, a figure which rises to more than 95% in the ORR corridor. These are figures that point to a serious housing crisis. 

3. This has been despite the HMDA having a 5% of developable area mandate for each of the Economically Weaker Section (EWS) and Lower Income Group (LIG). Builders have the flexibility to construct it on alternative land within a 5 km radius. However, there is not even a single instance of any developer having built physical units using this option. Instead, they have preferred to use the cash-out loophole of paying a shelter fee, which was carved by amending the Special Development Regulations for the ORR Growth Corridor. It allows developers to pay a capitalisation fee equivalent to 1.5 times the basic land value to HMDA. The low basic land value means this becomes a cheap option, one immediately capitalised into the cost of construction. 

This must count as one of the biggest missed opportunities of Hyderabad’s ORR-based growth, and adds to the list of planning and policy failures. More importantly, the amendments to the EWS/LIG mandate underline the dominance of real estate developer interests. 

4. Also, given the lack of any public transport connectivity linking them, these gated communities are car communities. The very large enclosed boundaries of these communities mean that they are not walkable localities, thereby further isolating the communities and increasing the reliance on cars.
The Phase 1 Blue Line of the metro terminates at Raidurg, on the eastern edge of HITEC City, whereas the next 5–6 km, as in the schematic, contains the highest concentration of new office and residential capex in the corridor, and it has no rail transit at all (though they are included in the Phase 2 corridor of 11.6 km whose work has just started). They are also served sparsely by a fragmented bus network. Even when completed, the configuration and the nature of the development in the area make it sub-optimally useful. 

The metro gap is perhaps the single most consequential planning failure of the western corridor. Hyderabad, like others in India, are seeking to fit the metro into a built-form, instead of shaping the built-form around a built or planned metro. 

5. Furthermore, they are also not mixed-use developments (the institutions/offices, residences, and commercial areas are distinct), thereby forcing households to commute to buy their groceries and vegetables. To some extent, the basic requirements are met by having small shops inside each gated community selling groceries and vegetables/fruits. But outside of this, all commutes are long and car-based. It is unsurprising, therefore, that, like elsewhere in India, there is not one example of Transit Oriented Development (TOD) among the current stations. 

6. The absence of lower-income housing, coupled with the redevelopment and gentrification of even the erstwhile villages, has meant that West Hyderabad must rely on distant areas for various household services. Housemaids, drivers, and other help must travel long distances using autos and bikes to come and work in these communities. Apart from the costs on their lives, this creates their own set of problems (like getting a housemaid early morning or having a driver stay back late, or even their reliability). 

7. The “unlimited” FAR also meant that the government has foregone large revenues in the form of sale of purchasable FAR permitted over a base FAR (which comes with the property right). It can, however, be said that its absence has lowered the cost of construction and boosted supply. For now, the foregone revenues have been recovered many times over in various forms of economic activities, thanks to all the complementary actions that confluenced in the region’s development. 

All this means that West Hyderabad has made its choice of a pattern of living that revolves around secluded gated residential communities and is car-based, instead of the walkable, mixed-use, mass-transit and outdoor public-spaces-based living that characterises many western cities. There are benefits and costs with each model. But once the choice is made, it is almost cast in stone. 

It is also pertinent that while West Hyderabad has developed at this pace, the same planning and development control regulations (DCRs) have had no impact on the rest of the city. Economic growth over the last two decades has largely bypassed the existing twin cities of Hyderabad-Secunderabad and facilitated western suburban expansion. It is hard to think of even one example of meaningful-sized urban regeneration or redevelopment in the remaining parts of the city. It can even be argued that the development of the western ORR corridor has come at the cost of the rest of the city. 

This also reflects the restrictive nature of the existing DCRs, despite the unlimited FSI. Very few, or hardly any, plots in the built-up city can avail this unlimited FSI, thereby pushing development outside to the suburbs and benefiting builders. This is one more illustration of the fact I blogged here that reforms to DCRs across Indian states have largely bypassed the built-up city and benefit only the greenfield suburban developments. 

How does Hyderabad’s development compare with two similar examples of rapid growth to scale - Gurgaon and Shenzhen? 

Unlike Gurgaon, which emerged primarily on the back of private land assembly enabled by the licensing regime of Haryana’s Development & Regulation of Urban Areas Act (1975) and even private infrastructure development (e.g., CyberHub metro), the government had a big role to play in the development of the other two. In Hyderabad, as aforesaid, the government aggregated lands, allocated and auctioned them, while also developing the trunk infrastructure. 

Shenzhen is the extreme case of transformation of farmlands, with population rising from a mere 30,000 to 17.6 million in 40 years, and is instructive for its sequencing. It built the metro alongside, not decades behind, the office and housing pattern. Shanghai Pudong transformed farmland east of the Huangpu into finance-and-office from 1990 onward, but again with subway preceding the office boom. Songdo (Incheon) in South Korea is a smaller-scale but similarly planned-from-blank comparison.
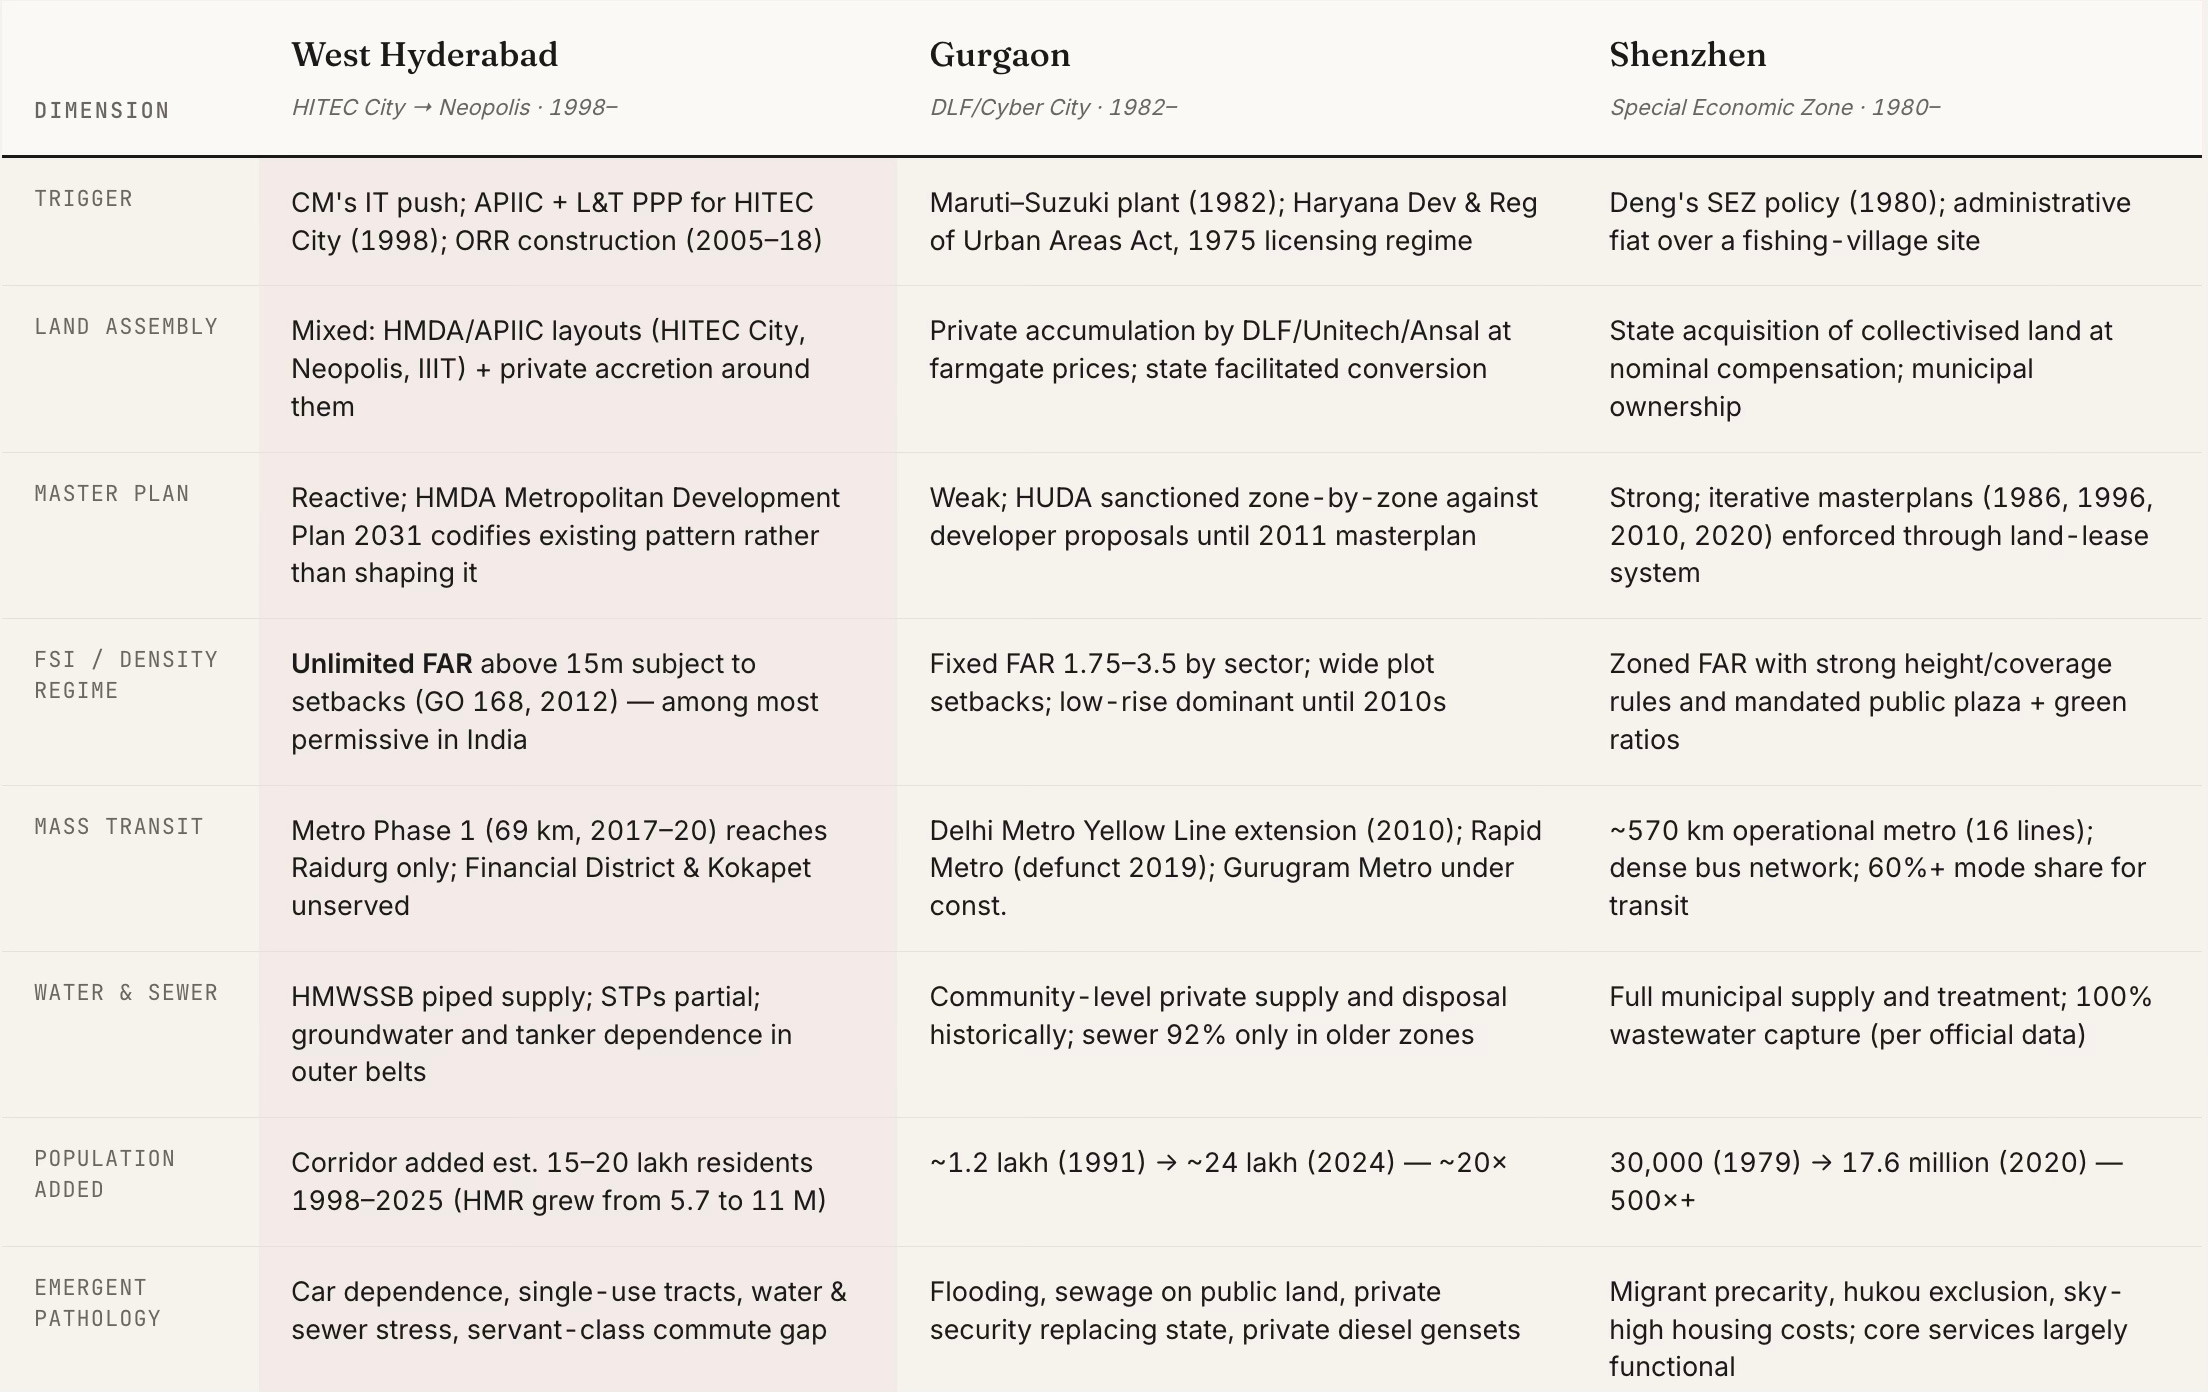
Among the three cities, only Shenzhen retained state agency over the density and transit pattern of what it was building. West Hyderabad and Gurgaon both handed the pattern to developers who, rationally, given their incentives, built gated single-use tracts at the highest FAR they could get. The transit, water and sewer bill is what the state pays afterwards.

The best comparison for west Hyderabad is not Shenzhen (which had state agency), nor Gurgaon (which lacked any state trunk infrastructure). It is a distinct third pattern, created by strong state trunk infrastructure, state land assembly and allocation, weak state land-use and transportation planning, strong private densification, and remarkable entrepreneurship and risk-taking, all riding on a booming IT services industry. This third pattern deserves its own space in the Indian urban development literature.

Saturday, December 20, 2025

Weekend reading links

1. Mouth-watering prospects for Wall Street in 2026.
SpaceX is hoping to be valued at $800bn in its latest private share sale, while Anthropic is targeting $350bn. OpenAI’s most recent share sale was at $500bn. Given that anyone investing now would be hoping for another big lift before IPO day, the eventual numbers, if all goes to plan, would be much larger still. Any one of these would put the previous record for a tech IPO — the valuation of more than $230bn Alibaba achieved in its 2014 debut — in the shade.

2. Barring Tesla, at PE multiples of 20-30, the stocks leading the AI bubble do not look comparable to their peers in earlier bubbles. 

3. As the tech bros pursue self-governing enclaves, Prospera in Honduras offers a cautionary tale
Arguably the most evolved experiment in alternative governance is Próspera, a gated private community on a Honduran island run by a Delaware-based company, where close to 1,000 residents can enjoy co-working spaces, a beach resort and a golf course. As a for-profit semi-autonomous zone, Próspera has low taxes, its own labour rules and an arbitration system run by retired Arizona judges who hear its cases online. Bitcoin is one of the currencies of choice. Its founder, Venezuelan-born wealth fund manager Erick Brimen, describes his work as “an evolved way to drive socio-economic development” through public-private partnerships... Próspera’s hands-off approach to medical regulation has made it a mecca for people seeking experimental treatments as the field of longevity — or trying to live forever — becomes more popular in Silicon Valley circles...

Critics argue that the special economic zones legislation that allowed for Próspera to be established was championed by a corrupt former government whose leader, Juan Orlando Hernández Alvarado, has just been released from prison, where he was serving a sentence for narco-trafficking and weapons crimes, following a pardon from Trump. The government at time of writing (an election took place on November 30) since tried to repeal its charter on the grounds that, as ruled by the country’s supreme court, self-governing special economic zones are unconstitutional. Próspera is now suing the government for $11bn — just under a third of the country’s GDP — for lost future profits, through an international arbitration process... Cornell University historian Raymond Craib, author of Adventure Capitalism: A History of Libertarian Exit, from the Era of Decolonization to the Digital Age, says it offers a warning to elected politicians about the dangers of carving out semi-autonomous zones: “Precisely what Próspera is doing [suing Honduras] is precisely the argument governments are going to make about why you should not be editing your constitution to allow for this.”

4. John Burn-Murdoch has a great post arguing that the rising cost of services in developed economies may not mean that household consumption expenditures and living standards are declining. 

Add together the increased portion of incomes accounted for by healthcare (up by 3 percentage points over recent decades), childcare (up 2 points), housing (up 4 points) and food (up 1 point in recent years), and total spending on these unavoidable costs has climbed from just over a third of middle class disposable income to half of the total. But this squeeze from essentials has not led to an increase in the share of income American households spend in total across all categories, which is broadly in line with the historical average — even slightly down on where it was when all of these things were cheaper in real terms. This has been made possible primarily by dramatic falls in the price of clothes, electronics, household appliances and other mass-produced tradeable goods, which have more than offset the rise in essential services...
Rather than the increasing burden of essential costs suggesting living standards are being eroded, if we take a step back, it’s an indication that people across society are becoming more prosperous... William Baumol’s 1967 famous observation, as countries develop economically, the same productivity growth that drives down the cost of tradeable goods causes the cost of in-person services to balloon. Wages in sectors like healthcare and education that require intensive face-to-face labour, and have slow (if any) productivity growth, are forced upwards in order to attract workers who would otherwise opt for high-paying work in more productive sectors. The result is that even if people keep consuming the exact same basket of goods and services, as living standards in their country increase they will find more and more of their spending is going on essential services.

5.  Water metro facts.

A 75km elevated metro network could cost ₹15,000 crore. But a water metro of the same length would cost roughly ₹1,500 crore... Rail metros require continuous elevated corridors, viaducts, stations, land acquisition and traffic diversions through dense urban areas. Water metros, by contrast, rely on existing waterways, building only terminals, pontoons, control systems and a fleet of electric boats.

On Kochi metro

In Kochi, the water metro is priced to encourage regular use, with single-journey fares typically between ₹20 and ₹40 depending on distance, and monthly passes at ₹600. What makes it especially convenient is that passengers can use the same Kochi1 smart card, issued by KMRL, to access both boats and trains seamlessly... Kochi needs 53 water metro boats for its complete network but currently has only 20 operational vessels. Manufacturing electric-hybrid boats is a specialized, time-consuming process with limited global suppliers... With only 20 boats operating across six of the planned 15 routes, demand is concentrated on tourist-facing corridors... More than 80% of commuters are tourists... The shortfall in boats, and the resulting partial network, means many daily-use routes for local residents are still not operational.

Mumbai is seeking to emulate Kochi to develop a water metro system.

Amchi Mumbai Water Metro, covering nearly 200 nautical miles with more than 30 routes, represents a very different ambition. The planned routes are along the city’s western waterfront and eastern creeks, linking places such as Versova, Bandra, Wadala, Vashi, Airoli, Kalyan and even the upcoming Navi Mumbai airport.
6. For all the 200-plus PE multiples of Tesla riding on robotaxi prospects, the Chinese autonomous driving industry has a reality check
The recent listings of Pony.ai and WeRide in Hong Kong... shares in both have fallen since their November debuts, even as they pledged to use the funds towards scaling their fleets and advancing Level 4 autonomous driving — technology capable of operating without human monitoring or intervention... That is surprising given the businesses are already showing signs of viability. They have deployed more than 2,000 autonomous vehicles across 10 cities in China and have recorded millions of paid user rides. Many cities now allow fully driverless service. One explanation is that for Chinese investors, autonomous driving is still seen as a more costly hardware race than a software breakthrough.

7. Ed Luce sums up Trump's engagement with China.

On the grounds of never interrupting your enemy while he is making a mistake, Xi Jinping is 2025’s winner. The year’s hinge moment was Donald Trump’s cave-in to Xi in South Korea in late October. Trump’s trade war climbdown marked a new epoch. After mulling decoupling for years, talk of US-China divorce was suspended. Even so-called de-risking is now in question. Trump awarded their meeting a 12 out of 10. China took 10 of those points. Xi has profited simply by waiting for strategic gifts to come his way. Rarely has the inverted motto, “don’t just do something, stand there,” been more apt. Last week, Trump added to Xi’s windfall by approving Nvidia’s sale of H200 chips, albeit with a 25 per cent export tariff... Trump just handed China his biggest freebie so far. Advanced semiconductors are the one key area where China is still lagging behind the US. Trump is helping to close that gap.

8. Very good article by Ananth Narayan on India's currency management challenge

From FY2017-18 to FY2021-22, average annualised daily volatility was 5.5 per cent, close to the 6 per cent annualised daily volatility of the DXY index (which tracks the US dollar against a basket of six major currencies). During this period, net investment capital flows into India averaged 1.7 per cent of GDP. In contrast, between FY2022-23 and FY2024-25, annualised USD/INR volatility dropped to 3.3 per cent, even as DXY volatility rose to 7.4 per cent. USD/INR became significantly less volatile than other major currency pairs. Media reports attributed this to active RBI intervention that prevented INR depreciation, while dousing volatility. Notably, capital flows dropped to 0.6 per cent of GDP during this three-year period, pointing to the possible impact and constraint of the trilemma.

9. French President Emmanuel Macron makes the clearest signal towards a nuanced trade and financial market protectionism.

We should not be ashamed of a “European preference” as long as it means supporting strategic production — in automotive, energy, healthcare and tech — within our own borders. Protection against unfair competition is the foundation of resilience. We must not be naive: a credible protection strategy requires that we have the means to defend ourselves against those who break the rules. That is why we have a range of trade protection tools, including tariffs and anti-coercion measures. No one should be in any doubt about our willingness to use them. Second, in order to finance the investment we need, Europe must leverage its pool of around €30tn in savings. Each year €300bn is invested abroad. It is time we Europeans took the risk of investing in our own companies. Regulation simplification, securitisation and unified supervision will free much needed capital. Implementing the Savings and Investments Union will ensure European savings circulate freely to finance innovation and growth. Europe should also seek to reinforce the international role of the euro through the development of euro stablecoins and the introduction of a digital euro, as well as the creation of safe and liquid assets to finance defence and technologies.

He also invites Chinese investments into Europe but at certain terms.

China has long benefited from European FDI and co-operation, including on technology. The EU has invested close to €240bn in China while China has invested less than €65bn in the EU. Today, it leads in energy transition and clean mobility technologies, while Europe continues to lead in many service sectors. An optimal framework for our two regions is a co-operative one. The EU must stay open for China to invest in the sectors where it is a leader, provided the Chinese help generate employment and innovation and share technology.

This is a clear direction for engagement between Europe and China.

During my last trip to China, I made it clear that either we rebalance economic relations co-operatively — engaging China, the US and the EU in a genuine partnership — or Europe will have no choice but to adopt more protectionist measures. I much prefer co-operation, but will argue for using the latter if need be.

10. India FDI facts

Our assessment shows that the average risk-adjusted return on FDI investment in India remains quite attractive. We have estimated returns on inward FDI as the ratio of FDI equity income receipts to the total inward FDI stock, with a time lag (inspired by OECD and Eurostat methodologies). The risk-adjusted return has been calculated as the ratio of the 10-year average return to its standard deviation. Our assessment indicates that the average risk-adjusted return on FDI investment in India over the past 10 years is around 7.3 per cent, ranking second only to Indonesia (10.6 per cent). The risk-adjusted returns for other emerging economies are 6.6 per cent for Mexico, 4.5 per cent for South Africa, and 4.3 per cent for the Philippines, according to our assessment.

11. Good story in The Ken about how southern states are embracing a decentralised model of promoting ICT investments. 

Among the anchor cities in the four states, Visakhapatnam has a major competitive advantage. 

12. Western multinationals are finding ways to exit their China operations.

Global companies are seeking private equity partners in China to take on their local operations as they grapple with an increasingly competitive local market, a sluggish economy and volatile US-China relations. The owners of sports retailer Decathlon, ice cream brand Häagen-Dazs, coffee houses Peet’s and Costa, convenience store operator Lawson and GE HealthCare are all weighing options for their China operations, including selling parts or all of their businesses, said people familiar with their thinking. The rush to rethink China comes amid whiplashing relations with the US, the slowing of the world’s second-largest economy and the rise of fast-moving and better-adapted local rivals across a swath of industries.

13. Ruchir Sharma points to a deadly combination of over-valuation, over-ownership, over-investment, and over-leverage threatening the US economy. 

Households hold a record 52 per cent of their wealth in stocks, which is higher than the peak in 2000 and far above levels in the EU (30 per cent), Japan (20 per cent) and the UK (15 per cent). A closely related signal is overtrading. Over the past five years, the number of shares traded each day in the US has risen by 60 per cent to around 18bn. The retail share of short-dated stock options has grown from a third to more than half... Counting just the Magnificent Seven, AI spending has more than doubled since 2023 to $380bn this year and is on track to exceed $660bn by 2030. The potential returns are far from clear... the Magnificent Seven are not the cash machines they were even a year ago. Amazon, Meta and Microsoft are now net debtors, up from one in 2023. Their profits continue to rise but with so much flowing into AI, only Google and Nvidia still generate piles of cash.

Monday, September 1, 2025

Thoughts on affordable housing XI

This post in the series on affordable housing discusses the importance of transportation investments in promoting housing affordability. 

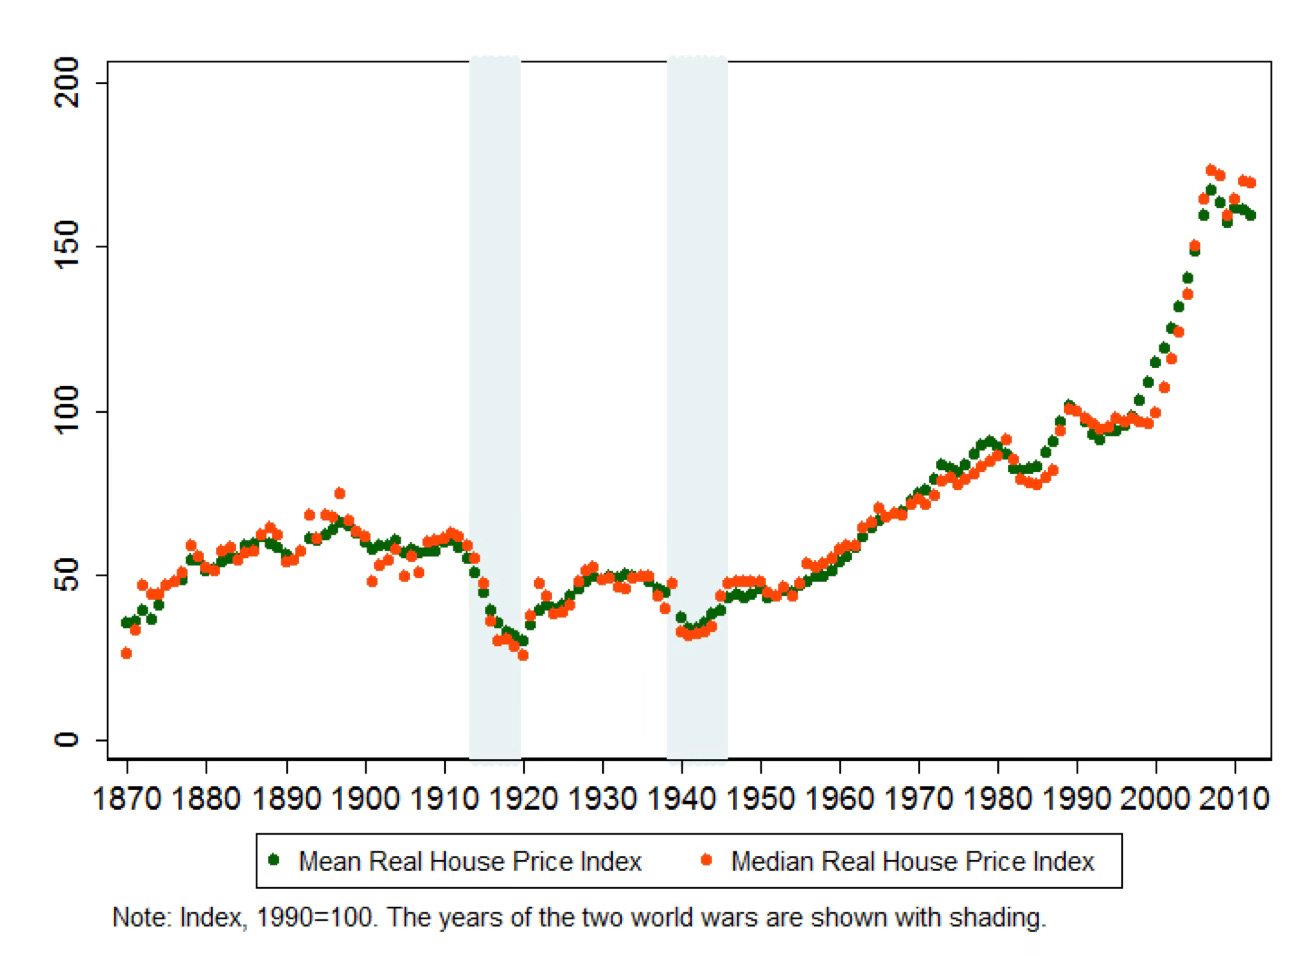
In an excellent 2014 paper, Katharina Knoll, Moritz Schularick, and Thomas Steger show that property prices remained constant in real terms for the major part of the development stages of 14 advanced economies (studied in the paper), driven in large part by transportation technologies and investments. 

This paper presents annual house price indices for 14 advanced economies since 1870. Based on extensive data collection, we are able to show for the first time that house prices in most industrial economies stayed constant in real terms from the 19th to the mid-20th century, but rose sharply in recent decades… By the 1960s, they were, on average, not much higher than they were on the eve of World War I. They have been on a long and pronounced ascent since then. For our sample, real house prices have approximately tripled since the beginning of the 20th century, with virtually all of the increase occurring in the second half of the 20th century. We also find considerably cross-country heterogeneity. While Australia has seen the strongest, Germany has seen the weakest increase in real house prices in the long-run. Moreover, we demonstrate that urban and rural house prices have, by and large, moved together and that long-run farmland prices exhibit a similar long-run pattern… 

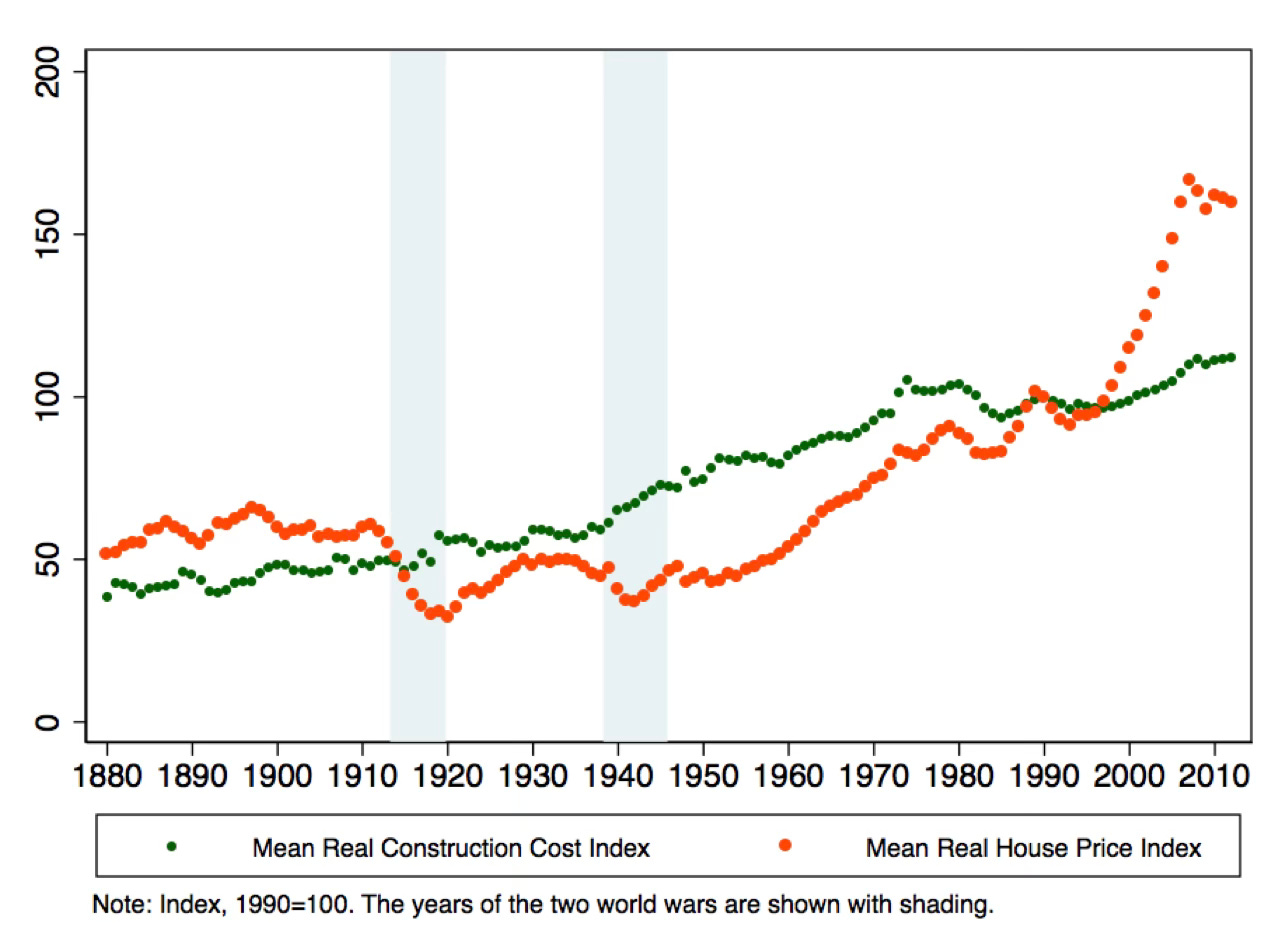
While construction costs have flat-lined in the past decades, sharp increases in residential land prices have driven up international house prices… During the past four decades, construction costs in advanced economies have remained broadly stable, while house prices surged… Our decomposition suggests that about 80 percent of the increase in house prices between 1950 and 2012 can be attributed to land prices. The pronounced increase in residential land prices in recent decades contrasts starkly with the period from the late 19th to the mid-20th century. During this period, residential land prices remained, by and large, constant in advanced economies despite substantial population and income growth…

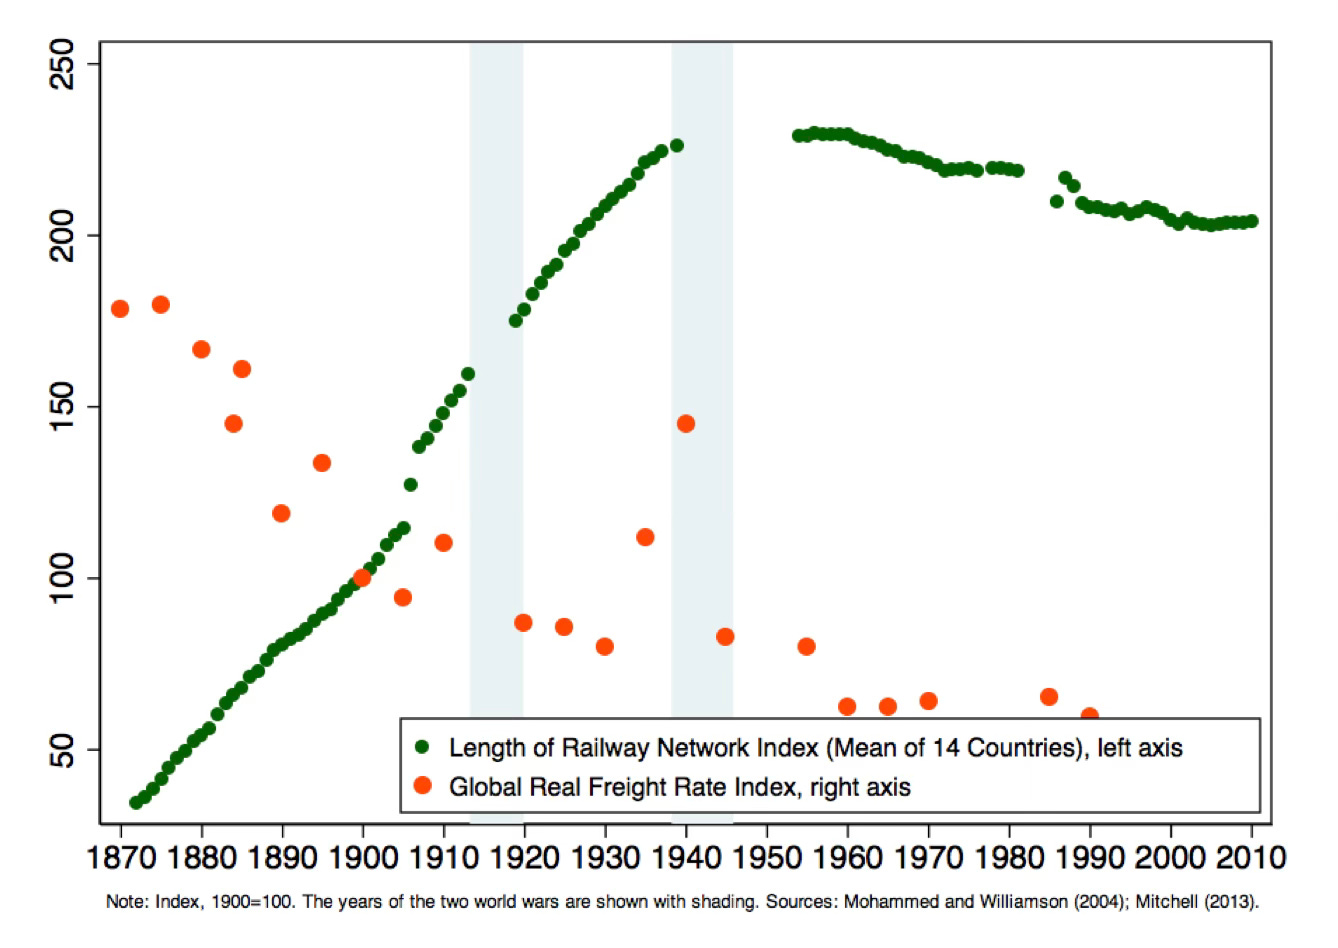
From the 19th to the early 20th century the transport revolution – mostly the construction of the railway network, but also the introduction of steam shipping and cars – led to a massive and well-documented drop in transport costs, often referred to as the transportation revolution. An important effect of the transport revolution was to substantially augment the supply of economically usable land… We show that this land-augmenting decline in transport costs subsides in the second half of the 20th century so that land increasingly became a fixed factor. At the same time, zoning regulations and other restrictions on land use also inhibited the utilisation of additional land in recent decades while rising expenditure shares for housing services added further to the rising demand for land…

Glaeser and Kohlhase calculate that the average cost of moving a ton a mile was 18.5 cents (in 2001 Dollars) in 1890 but had fallen to 2.3 cents at the beginning of the 2000s… The length of the railway network can serve as a proxy for the opening up of new territories over time. For our 14 countries, the length of the railway network peaked in the interwar period and has not grown materially since then… By 1930, essentially the entire world had been made accessible. Subsequent expansions of the transportation network through highways did not lead to a comparable fall in transportation costs… The dramatic efficiency gains in maritime transportation were also realized in the late 19th and early 20th century. The 19th century revolution in shipping rested on two developments: first, the fall of iron and steel prices that led to the introduction of metallic hulls; second, parallel advances in engine technology that led to much improved fuel efficiency Between 1870 and 1914 shipping costs fell by about 50 percent relative to the prices of commodities. By contrast, commodity-deflated real freight rates barely fell after 1950.

They offer a reinterpretation of David Ricardo’s hypothesis (made in the context of agricultural land, specifically where corn is grown) that, since land is a fixed factor, in the long run, economic growth will disproportionately benefit landlords. Further, given the unequal distribution of land, the rising land prices is likely to worsen inequality. They write,

The decline in transport costs kept the price of residential land constant until the mid-20th century. Yet the price surge in the past half-century could be an indication that Ricardo might have been right after all.

Illustrating the insights on the interaction between transportation developments and land prices, Binyamin Applebaum in the Times has an excellent article which shows how Tokyo has become a standout success in affordable housing on the back of a housing development strategy that revolves around mass transit. It has become the largest city in the world while also remaining affordable for its residents. Here’s a striking statistic.

Two full-time workers earning Tokyo’s minimum wage can comfortably afford the average rent for a two-bedroom apartment in six of the city’s 23 wards. By contrast, two people working minimum-wage jobs cannot afford the average rent for a two-bedroom apartment in any of the 23 counties in the New York metropolitan area.

This success comes with its costs and benefits

Maintaining an abundance of affordable housing has its downsides. Green space is scarce in Tokyo, living spaces are small by Western standards, and relentless redevelopment disrupts communities. But the benefits are profound. Those who want to live in Tokyo generally can afford to do so. There is little homelessness here. The city remains economically diverse, preserving broad access to urban amenities and opportunities. And because rent consumes a smaller share of income, people have more money for other things — or they can get by on smaller salaries — which helps to preserve the city’s vibrant fabric of small restaurants, businesses and craft workshops.

This is an important pointer to how Tokyo has managed a balancing act between urban growth and affordable housing.

From the air or from one of the city’s many observation decks, Tokyo appears as a vast sea of low- and midrise buildings laced with archipelagoes of high-rises, each island marking the location of a station along one of the city’s railroad lines.

This brilliantly captures the evolution of Tokyo’s housing landscape.

The Tokyu Railways Company developed the Den-en-toshi, or Garden City, line, which stretches southwest from the city center, in the 1950s as the backbone for a series of suburban neighborhoods of single-family homes… As Tokyo grew and demand for housing increased, the railroad has rebuilt the areas around its stations with condominium towers, shopping malls and office buildings. Around Futako Tamagawa Station, the largest of these new urban centers, Tokyu knocked down more than 100 homes to make way for more than 1,000 units in new apartment towers, as well as a new headquarters for the technology company Rakuten… 

The communities around the stations have grown denser, too, with apartment buildings interspersed among single-family homes. The population served by the Den-en-toshi line has increased from 20,000 people to more than 600,000. And the railroad, which once ran two-car trains three times an hour, now runs subway-style trains every few minutes, many of which continue into central Tokyo on a subway line. “We consider ourselves as a city-shaping company,” Hirofumi Nomoto, then chief executive of Tokyu, said in a 2016 interviewafter the completion of the Futako Tamagawa redevelopment project. “In Europe, for instance, railways companies simply connect cities through their terminals. That is a pretty normal way of operating in this industry, whereas what we do is completely different: We create cities.”

In stark contrast to Tokyo, cities like New York and others have stopped investing in mass transit lines and have strict restrictions on development along existing lines. And the consequences are evident in terms of housing unaffordability. 

This transit-led urban growth model has been supported by the city’s remarkably liberal zoning regulations.

In Tokyo, by contrast, there is little public or subsidized housing. Instead, the government has focused on making it easy for developers to build. A national zoning law, for example, sharply limits the ability of local governments to impede development. Instead of allowing the people who live in a neighborhood to prevent others from living there, Japan has shifted decision-making to the representatives of the entire population, allowing a better balance between the interests of current residents and of everyone who might live in that place. Small apartment buildings can be built almost anywhere, and larger structures are allowed on a vast majority of urban land. Even in areas designated for offices, homes are permitted. After Tokyo’s office market crashed in the 1990s, developers started building apartments on land they had purchased for office buildings.

Tokyo makes little effort to preserve old homes. Historic districts subject to preservation laws exist in other Japanese cities, but the nation’s largest city has none. New construction is prized. People treat homes like cars: They want the latest models. Between 2013 and 2018, new homes accounted for 86 percent of home sales in Japan, according to the most recent government data. In the United States, new homes typically account for about 15 percent of sales, according to data from the National Association of Realtors. One reason Tokyo looks forward is that little remains of the city’s past. Earthquakes, fires and American bombers destroyed much of the prewar city, and after the war, the rush to provide housing and the nation’s relative poverty produced a city that wasn’t meant to last… New buildings, and their occupants, also are more likely to survive the next earthquake… The ease of building in Tokyo means that new construction is not synonymous with luxury housing. Small workshops and factories are common…

Parks, too, are sometimes treated as unaffordable luxuries. Parks and gardens occupy just 7.5 percentof the city’s land, far below the figures for New York (27 percent) and London (33 percent). Mitake Park, once one of the few green spaces in the dense Shibuya neighborhood, is being transformed into a 26-unit apartment building. In the nearby neighborhood of Shinjuku, the government this year authorized construction of three high-rises that will eat into the Meiji Jingu Gaien, one of the city’s oldest and best-loved parks.

In another article in the Nikkei Asian Review, Benjamin Banzal and Jorge Almazan provide a nice description of Tokyo’s urban form.

After the firebombing of 1945, rebuilding was chaotic. Black markets flourished around train stations, while a severe housing shortage was often met with makeshift wooden homes on tiny plots, rather than large public housing. The government, constrained by weak institutions and scarce resources, was in no position to guide the city's recovery. When Japan's economic miracle took off in the 1950s, much of Tokyo's growth was driven by small, labour-intensive workshops embedded in residential districts. Zoning was flexible. Mixed-use, live-work arrangements were commonplace. Production chains were held together not by vertical corporate hierarchies but by horizontal social ties and local agglomeration economies. Subway expansion gradually allowed the city to grow outward, easing pressure on the center. Population density thus evened out across the metropolis. From above, Tokyo's vastness appears homogeneous, but its neighbourhoods remain distinct -- unified more by a shared set of local amenities than by architectural design. 

These amenities -- sento bathhouses, mom and pop stores, small manufacturing workshops, construction and building material contractors, eateries -- were tightly interwoven into the urban fabric and often owned and operated by local inhabitants, anchoring employment in neighborhoods. This model proved both functional and socially cohesive. With little open space, residents placed planters on pavements. Festivals were organised block by block. Economic growth did not produce stark urban divides. Tokyo remained relatively egalitarian in spatial terms.

The compact neighbourhoods that emerged in post-war Japan resemble the lightly planned, dense, mixed-use localities with small plots, narrow roads, limited public spaces, and low-rise multi-tenanted housing that characterise the majority of localities across all Indian cities. They have emerged organically through development by the original small plot owners, and encompass both slums and lower-middle and middle-class housing colonies. 

While in India, these colonies have largely remained stuck in time, with a slum-like quality of basic infrastructure. In contrast, Japan's provision of infrastructure and liberalised zoning regulations have allowed these colonies to become vibrant neighbourhoods that have retained their original character and social cohesion. 

The foundations of what we call the "Tokyo model" include dense, low-rise neighborhoods of around 20,000 residents per square kilometer woven together by narrow streets, gradually upgraded over time. Urbanism was "emergent," that is bottom-up and responsive to local needs… Private railway conglomerates such as Tokyu, Keio and Seibu also played a central role. They captured real estate value along their commuter rail lines -- building commercial hubs around stations and housing developments further out. In turn, Tokyo's transit system became one of the most efficient in the world, and helped spread the neighbourhood model across the metropolitan region… 

A mix of three phenomena around train stations added dynamism to this urban model. First, shotengaishopping streets, often covered arcades, branch off from station plazas and are filled with small, owner-run stores. Second, yokocho alleyways emerged when postwar black markets were regularised, allocating compact plots to bars and restaurants. These alleys still foster a strong sense of community. Third, zakkyobuildings -- narrow, multi-tenant towers on small lots -- stack diverse uses vertically, with their characteristic (neon) signage testifying to the vibrancy within.

Tokyo's urbanism has never been static. Over time, manufacturing gave way to services. Stricter environmental rules and broader economic shifts pushed industry out of the inner city. Height limits were relaxed, and taller apartment buildings began to rise along major thoroughfares. Since the 1980s, however, Tokyo's urban policy has increasingly tilted the balance toward top-down development. Floor-area-ratio restrictions were eased significantly. Special planning zones were introduced with looser urban restrictions. Tall, mixed-use towers -- especially near train stations -- became much easier to build, particularly since 2002… These towers often concentrate hundreds of apartments in a single building…

Unlike other countries that have incorporated tools for public participation, Tokyo's planning remains largely in the hands of powerful institutions: the central government, the Tokyo Metropolitan Government and its 23 special wards all have a say in decisions and have systematically sided with developers. As public consultation is minimal, community voices are rarely heard or often overruled. Over 200 redevelopment projects have already been completed since 2002 -- mostly in central areas like Roppongi, Shibuya and Toranomon. Many more are in the pipeline, including a second Roppongi Hills. As central areas will inevitably reach saturation at some point, developers are looking further afield in search of yield.

This is a good summary of the balance Tokyo has achieved between renewal and social cohesion. 

The Tokyo model deserves more recognition -- not out of nostalgia, but as a viable framework for future growth. Its buildings are constantly renewed. Its shops shift with demand. Its density supports both economic dynamism and social cohesion. It is a model built for change.

While I have quoted the trajectory of change in Tokyo’s urban form, the article itself cautions against the pace of change, which threatens the local character and social capital, replacing compact localities with homogeneous, gentrified high-rises. 

This has important lessons for developing countries like India, where the largest cities are already bursting at their suburban seams, mired in traffic congestion, and housing affordability is an acute crisis, with urban growth prospects facing strong headwinds. Sample this FT long read on Bangalore. 

The Tokyo example has strong relevance since Indian cities, too, are characterised by similar dense localities. Indian cities must create enabling mechanisms to allow them to shape and accommodate economic growth dynamically. It should allow, over time, pockets of high-rises to emerge so that the localities combine people from all economic classes.

This is important because the emerging landscape of India’s urban growth is that of older localities (both slums and middle-class colonies) frozen in time, increasingly congested, and with poor quality infrastructure (interspersed with pockets of affluent colonies), and suburban growth of homogeneous high-rise gated communities, interspersed with slums and squatter settlements. This is a deeply inefficient, unequal, socially dissonant, and growth-constricting form of urban development. 

A fundamental insight in urban development is that, given the fixed extent of land available in any city, there are only two ways to increase supply. The first is to develop vertically by raising the Floor Area Ratios (FARs), a topic discussed extensively in this blog (also this paper). The other option is to expand outward to encompass suburbs, while simultaneously building transportation infrastructure that shrinks the suburban sprawl and lowers commute distances. Tokyo illustrates how the combination of the two can keep housing prices affordable.

Transportation has traditionally been a performative aspect of urban planning in India, confined largely to instruments like road widths, land-use, and transport infrastructure creation (roads, Bus Rapid Transit, and metro railways). Unfortunately, public policy actions have largely been a form of isomorphic mimicry by transplanting top-down technocratic institutional arrangements (like UMTA/MTA and concepts like Modal Integration and Transit Oriented Development) that have worked in the cities of mature developed economies, without any thought for their integration with the local urban planning norms and without any meaningful social and political engagement and ownership by those stakeholders of the need for such changes. Even when implemented, they have remained only in form and have had little to show as substance. 

Accordingly, over the last two decades, we have seen that large transportation investments are made with limited changes to the master plan norms on land-use, FAR, and other measures to use the opportunity (presented by those investments) to shape urban growth and the future of the city. This is most egregiously manifest in the investments being made in new roads, road widenings, ring roads, BRT lines, metro-railway lines, and (now) the railway station redevelopment projects. In all these cases, there’s rarely any conscious, highest-level engagement to capitalise on the infrastructure investment’s geography-shrinking and housing supply-increasing potential by leveraging urban planning instruments. 

I blogged here that instead of being stand-alone PPP projects undertaken by the Indian Railways, railway station redevelopment projects should be viewed as urban regeneration projects that lay the foundation for the future of the locality and the broader city itself. I blogged here on the need to utilise metro railway investments as an opportunity to shape urban form by densifying the well-connected localities around stations through higher FAR and mixed land use. This and this are illustrative examples of transit-oriented development from London.

In conclusion, Indian cities require policy action at two levels. On the demand side, municipalities should adopt liberal planning regulations, such as those in Japan, that encourage renewal and vertical development, where feasible. The development of infrastructure,ties should complement thi roads and utilis. On the supply side, all transportation investments, especially metro rails, BRTS, or bus routes, should be approved only after easing planning regulations to permit significantly increased FAR and mixed-use developments around mass transit stations. This post provides more details on how to achieve such renewal.