Substack

Showing posts with label Fiscal Policy. Show all posts

Monday, April 27, 2026

Impact of policy interventions and shocks on India's economic growth

The sustainable growth rate of any economy is that which strips out the positive effects of the government’s fiscal interventions and the negative effects of economic shocks. This blog has held that, given its deficient human, physical, and financial capital, India’s neutral growth rate is about 5-5.5%. 

This post provides a framework to figure out the underlying economic growth rate by stripping these positive and negative contributors. 

So, what has been India’s underlying neutral (stripped of the impact of policy interventions) economic growth rate? 

Answering this requires us to identify the specific interventions and events that have contributed to the positive and negative shocks, and to try to figure out their respective economic impacts. 

In the last decade or so, the economy has faced three large negative shocks: demonetisation, the introduction of GST and associated efforts to formalise the economy, and the pandemic. In addition, on the external front, it has faced the oil shocks from the Ukraine and Iran wars, and the Trump tariffs. 

The economy as a whole has benefited from three fiscal events - corporate tax rate reduction, income tax rate reduction and rationalisation, and the GST rate reduction. 

While it is now clear that the government suffered revenue loss from the corporate tax rate reduction, the income tax rate reduction, and rationalisation appear to have boosted the tax base and increased revenues. It appears (at least for now) that the existing corporate tax rate was on the left side of the Laffer curve, whereas the direct tax rate was on the right side. 

The government clearly benefited from three positive fiscal events: the long period of low oil prices (increased excise tax revenues due to not passing through the reduced oil prices), the surge in RBI dividends, and the large additional fiscal space from discarding the FRBM framework. 

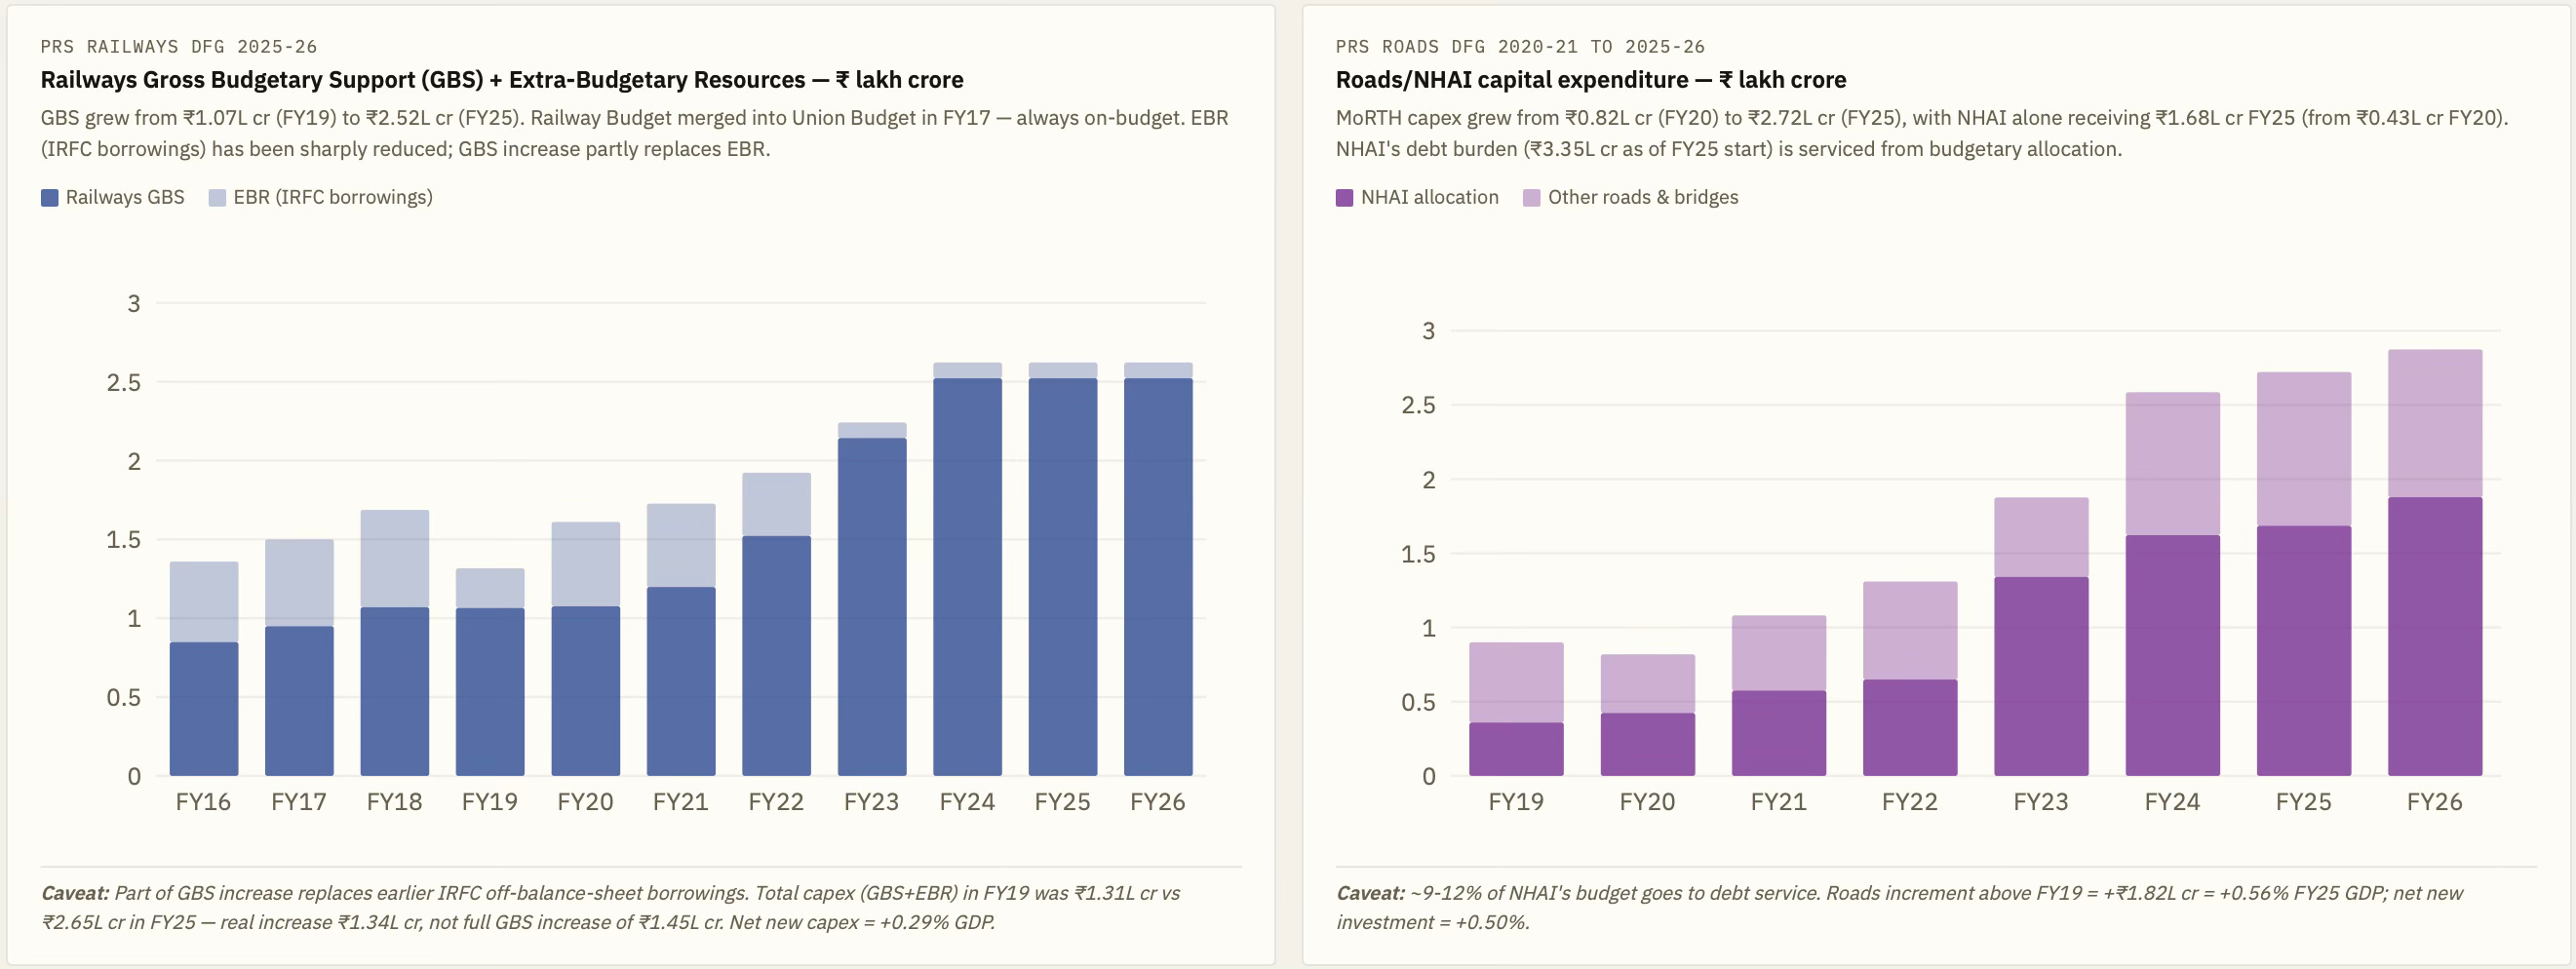
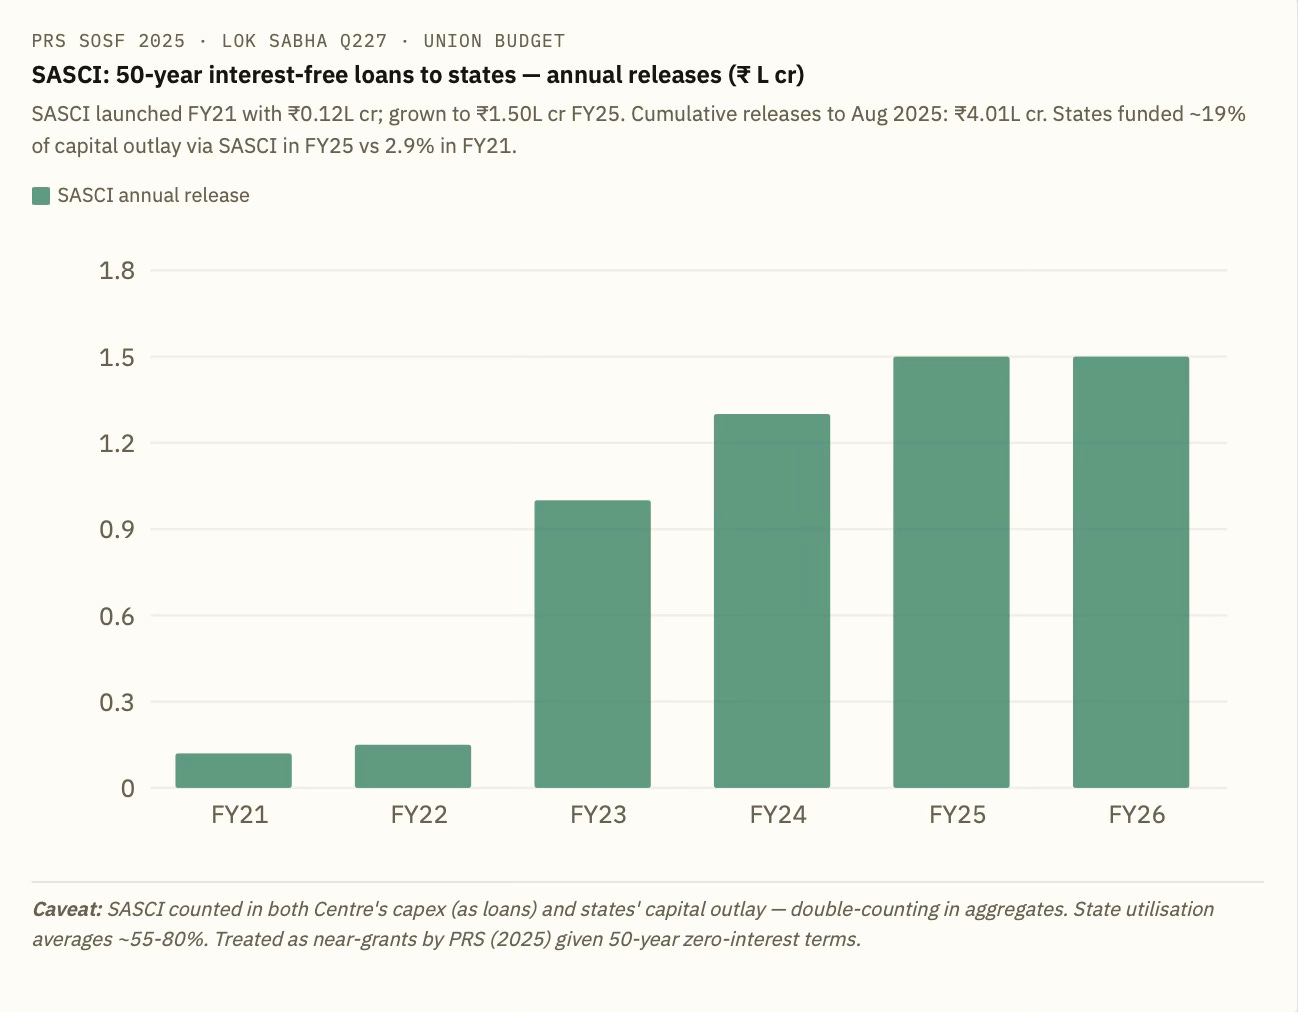
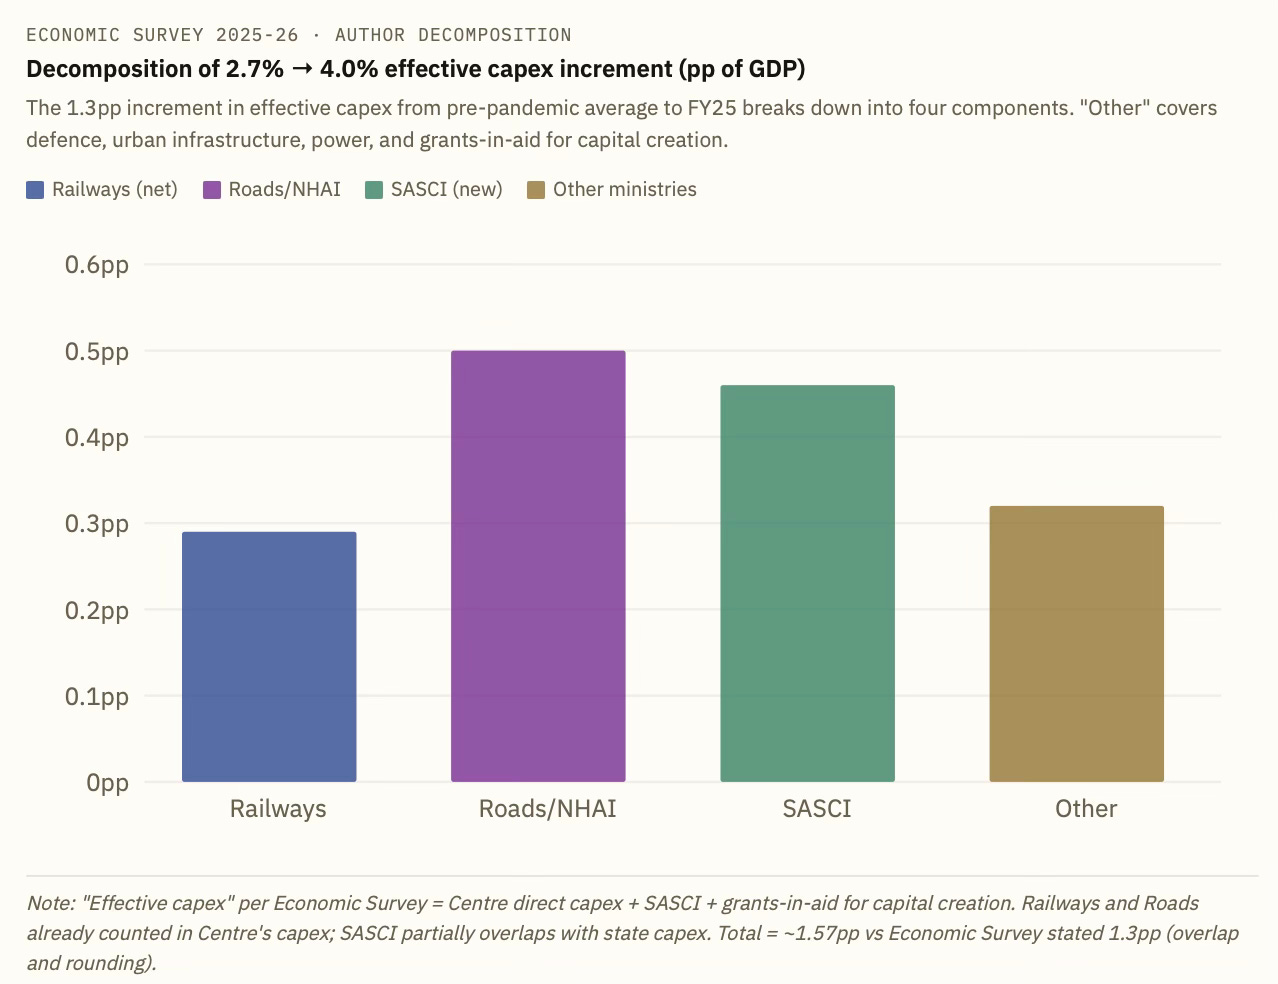
The net boost to fiscal balance resulted in a sharp spike in capital expenditure. It is to the credit of the government that it eschewed the subsidies and revenue expenditure route. This increase in capex includes taking on the budget account capital expenditures of NHAI and Railways. In addition, there has been the introduction of the zero-interest 50-year loan to state governments under the Special Assistance to States for Capital Investments (SASCI). 

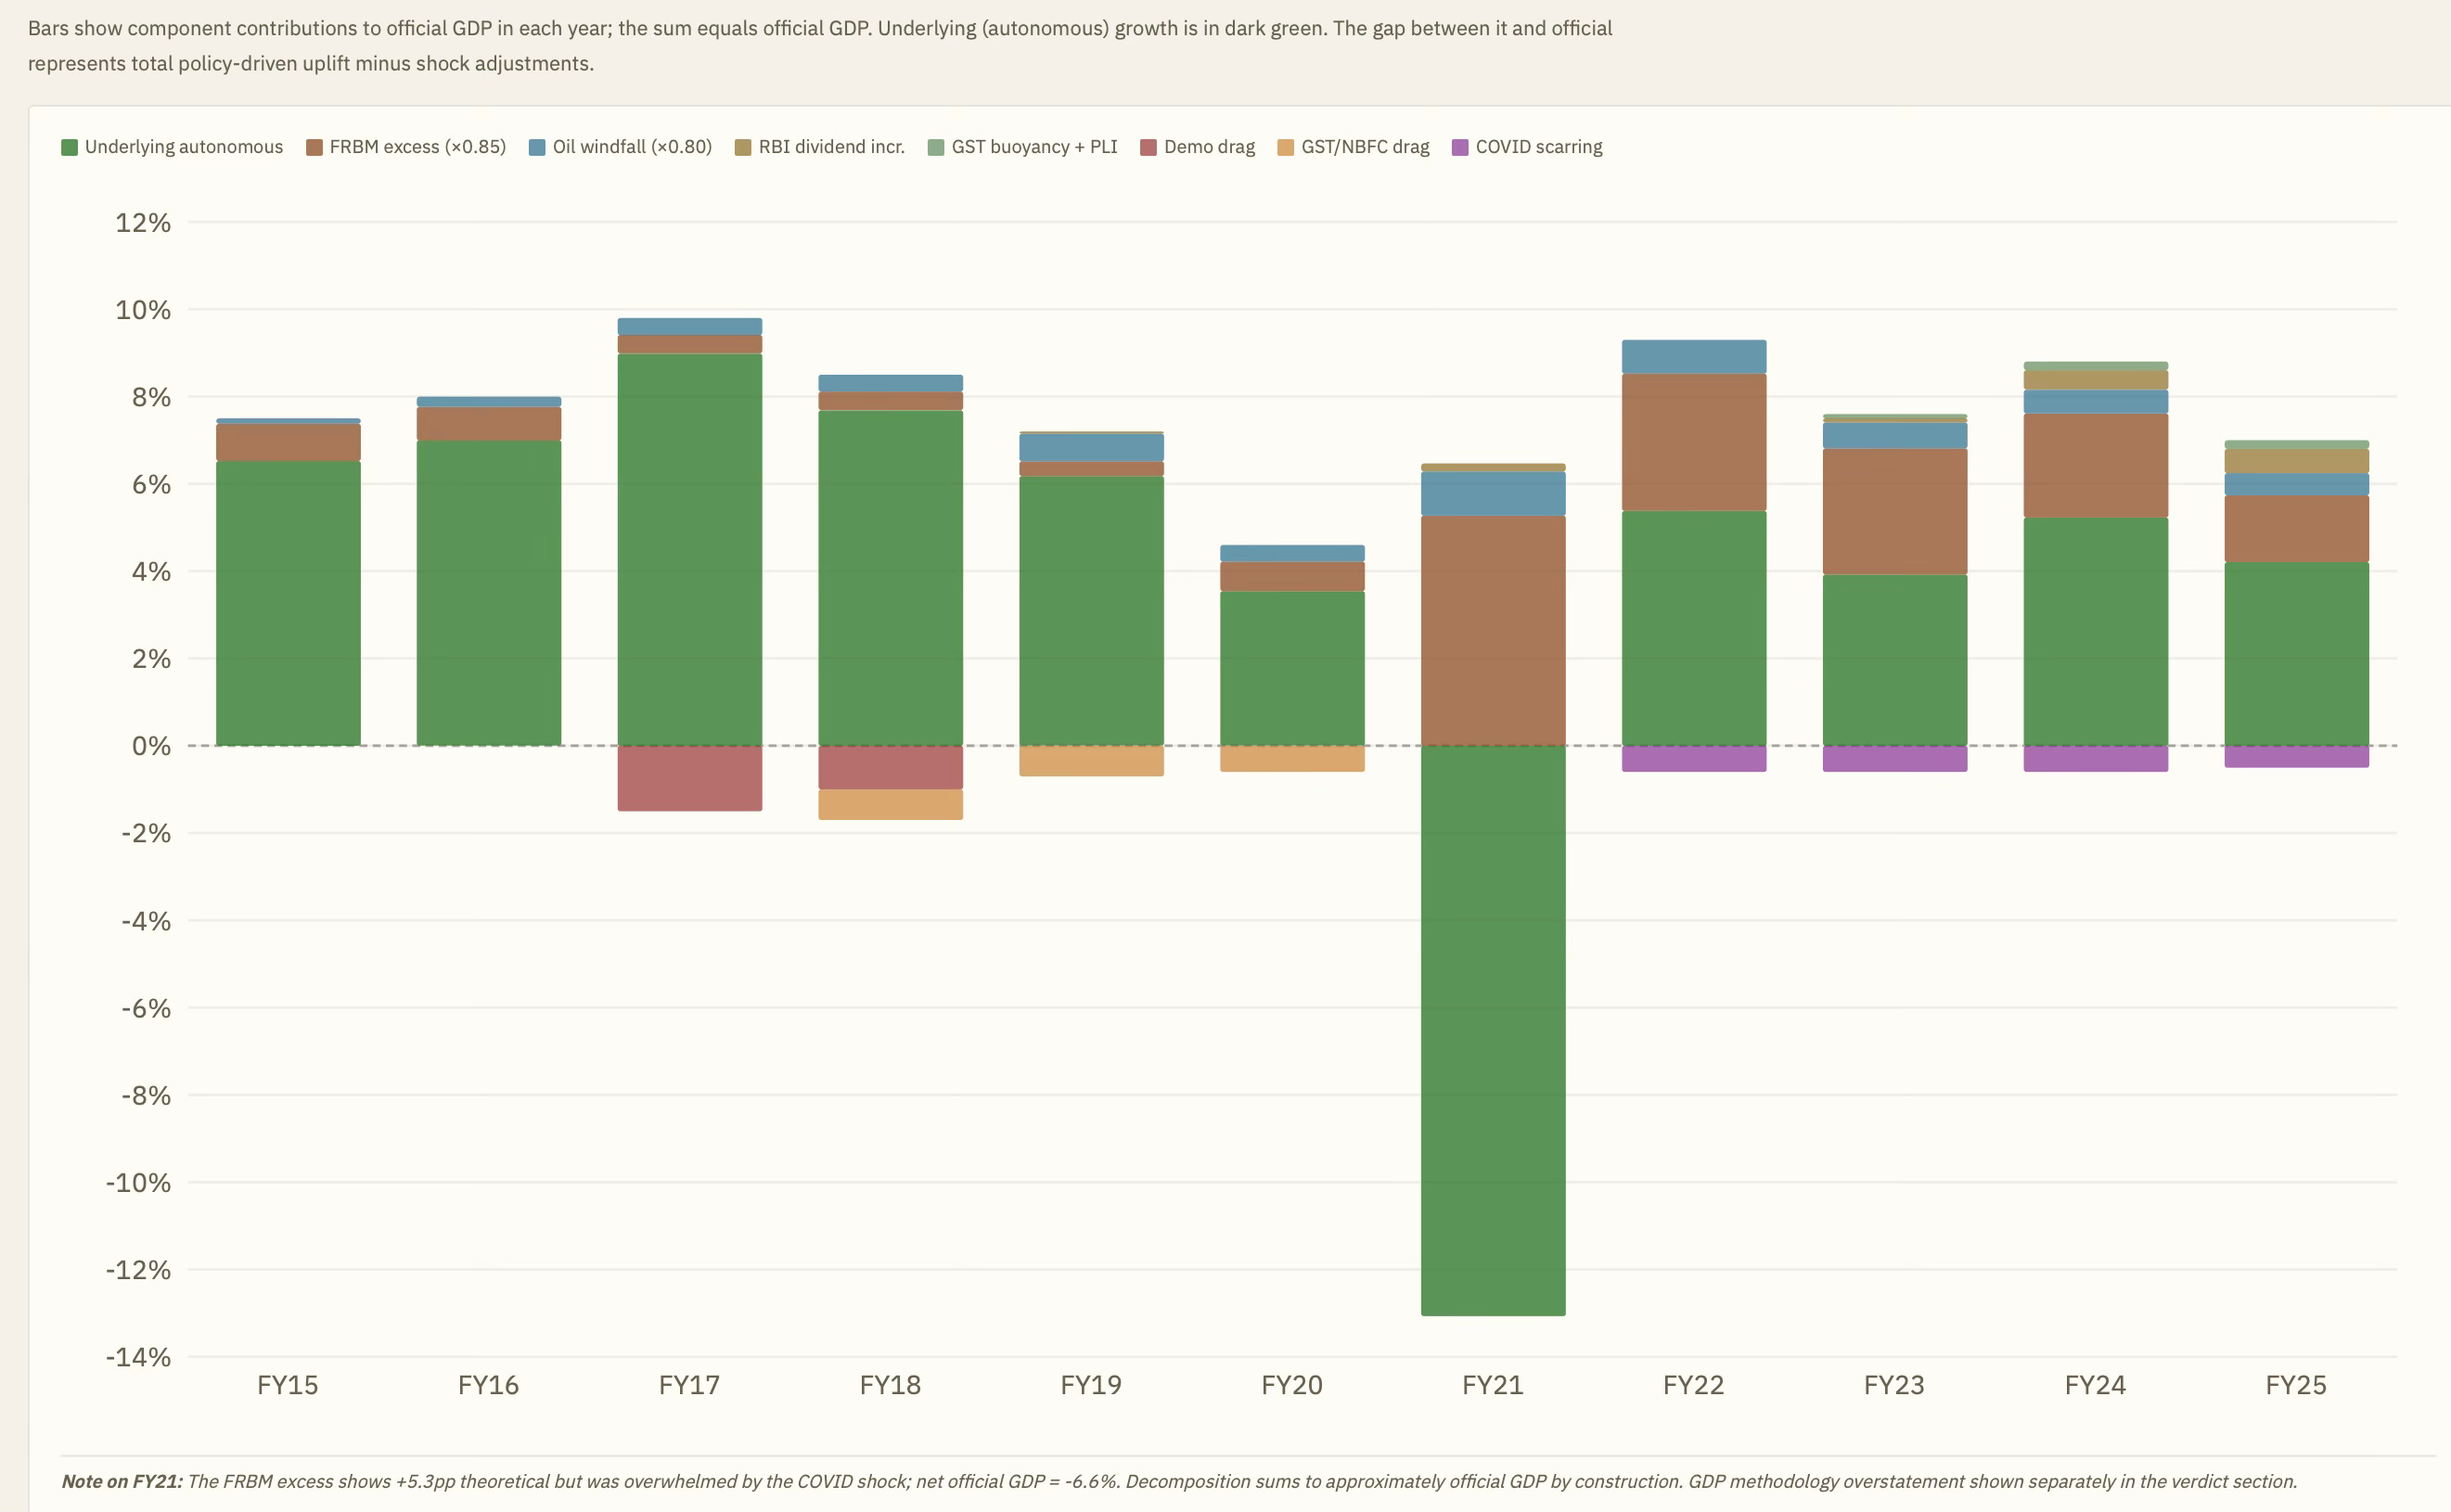
What have been their respective contributions to the output growth? Here is a graphical summary.

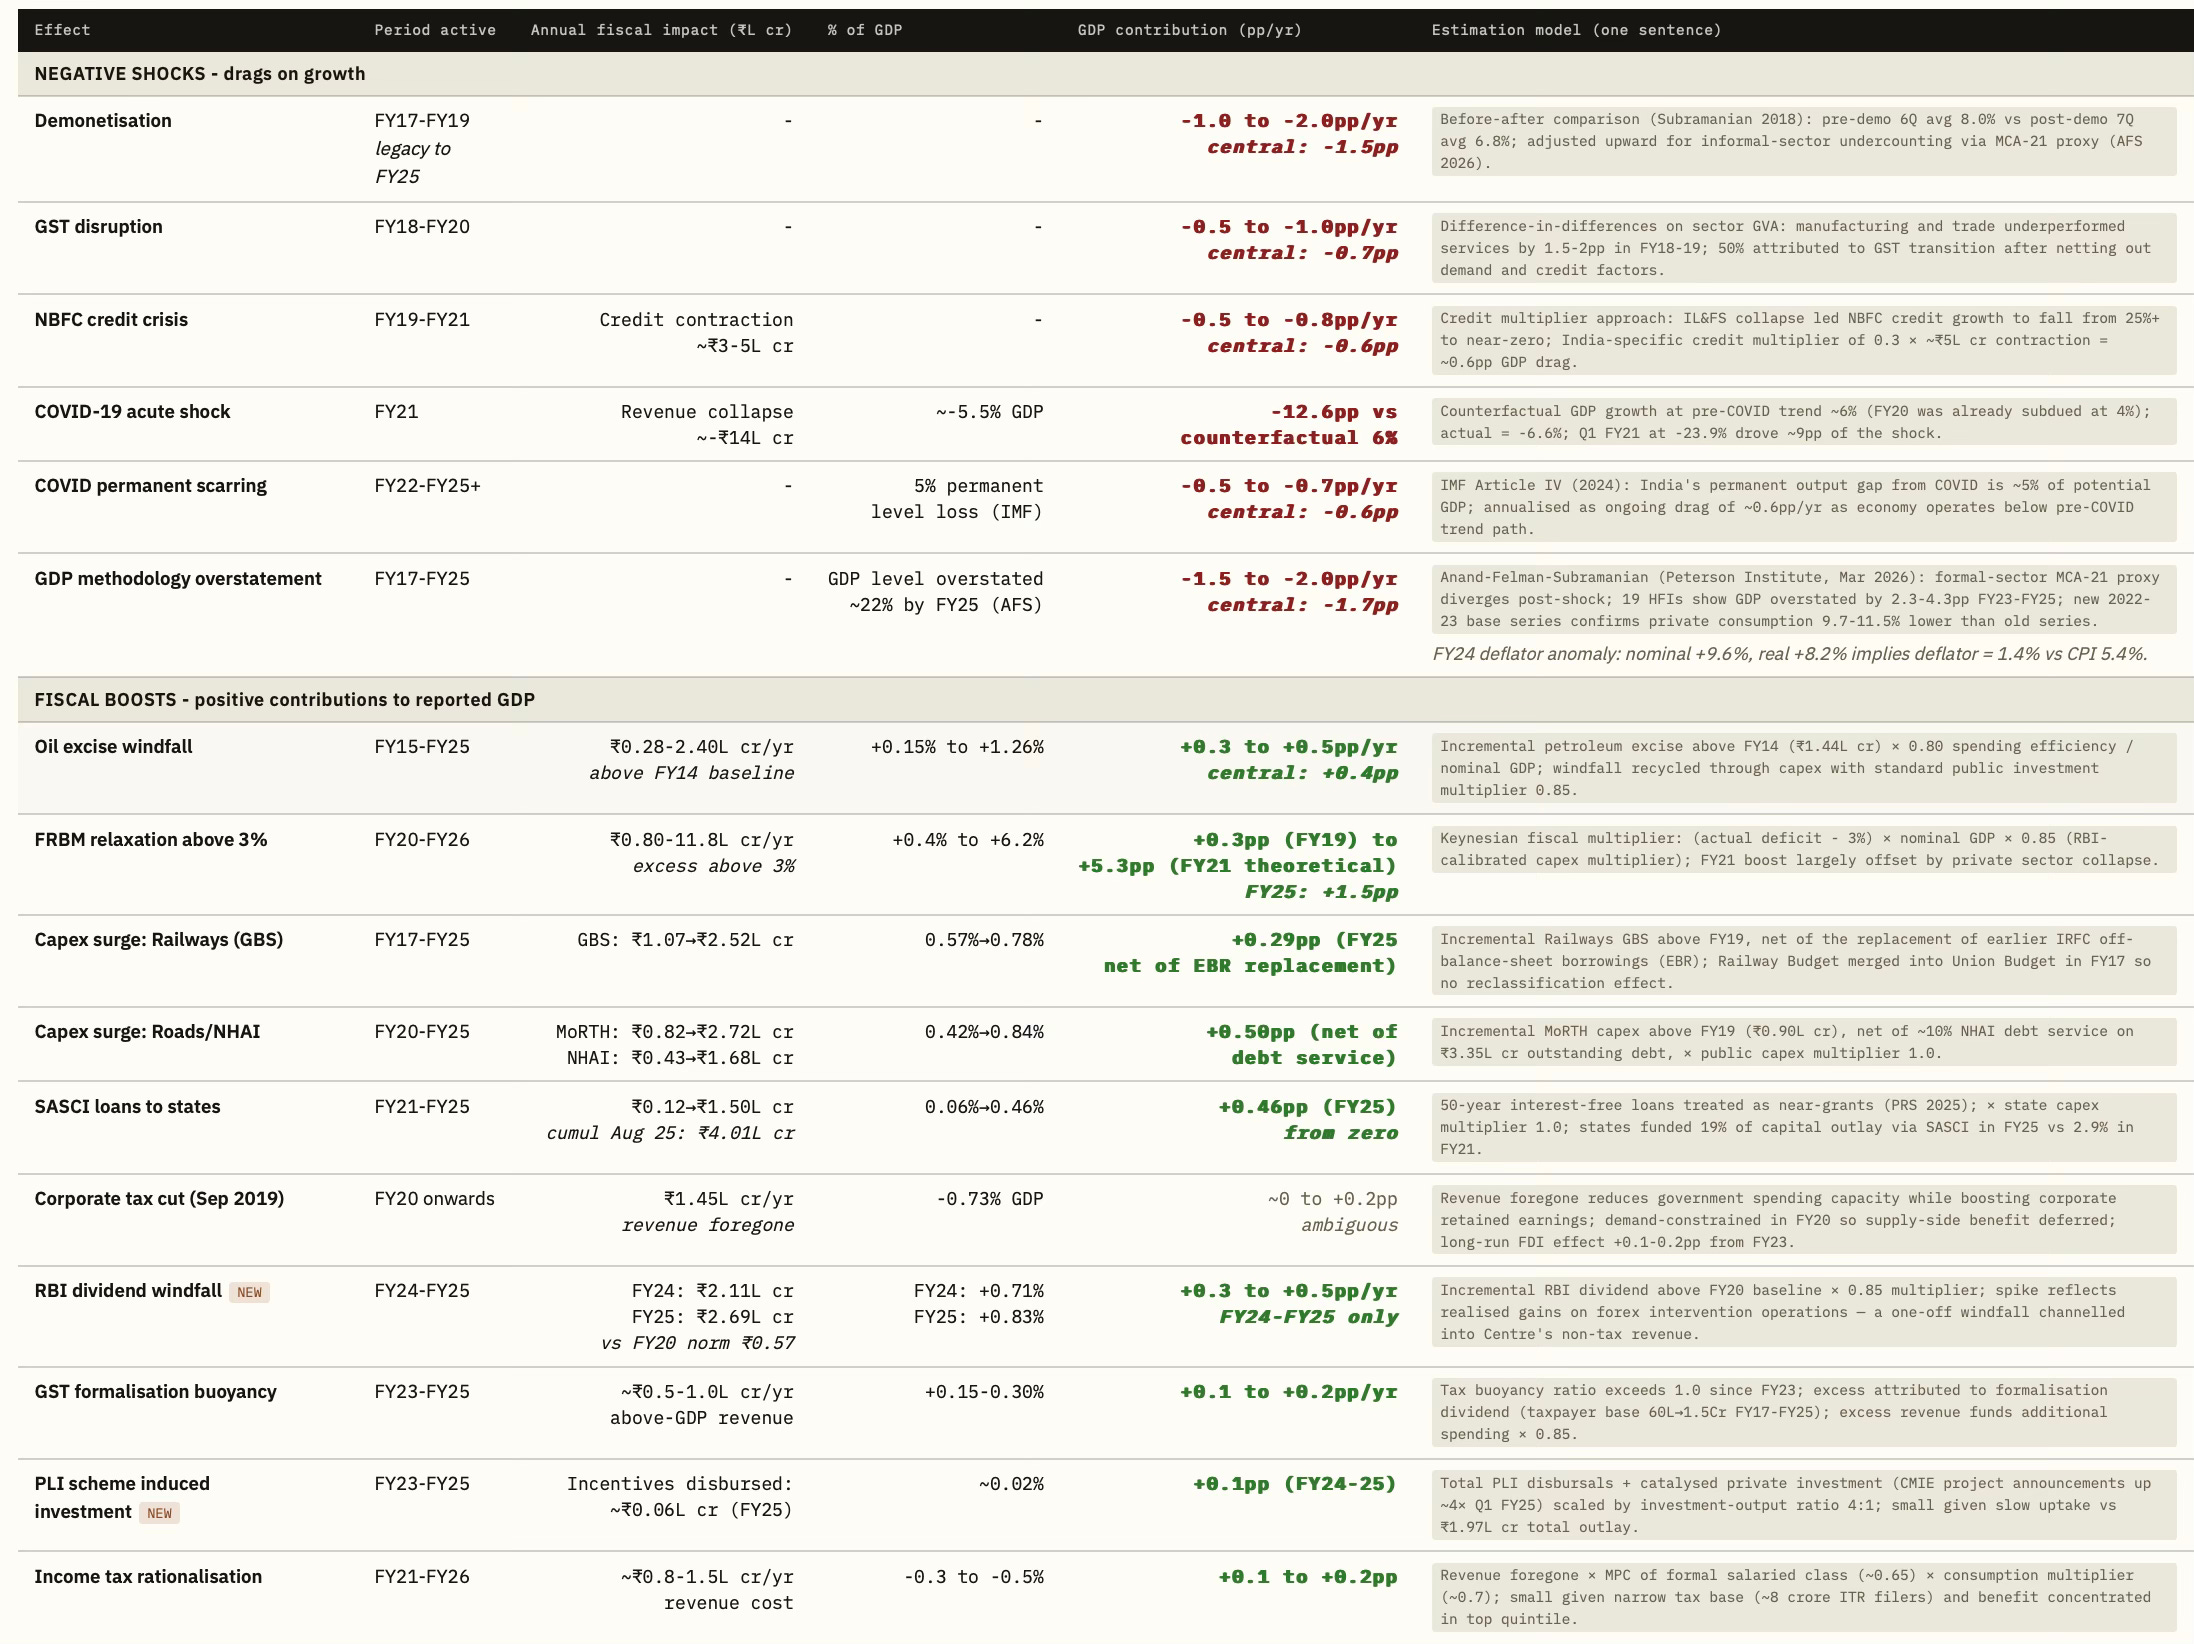
This table captures a brief description of the assumptions and estimations used. 

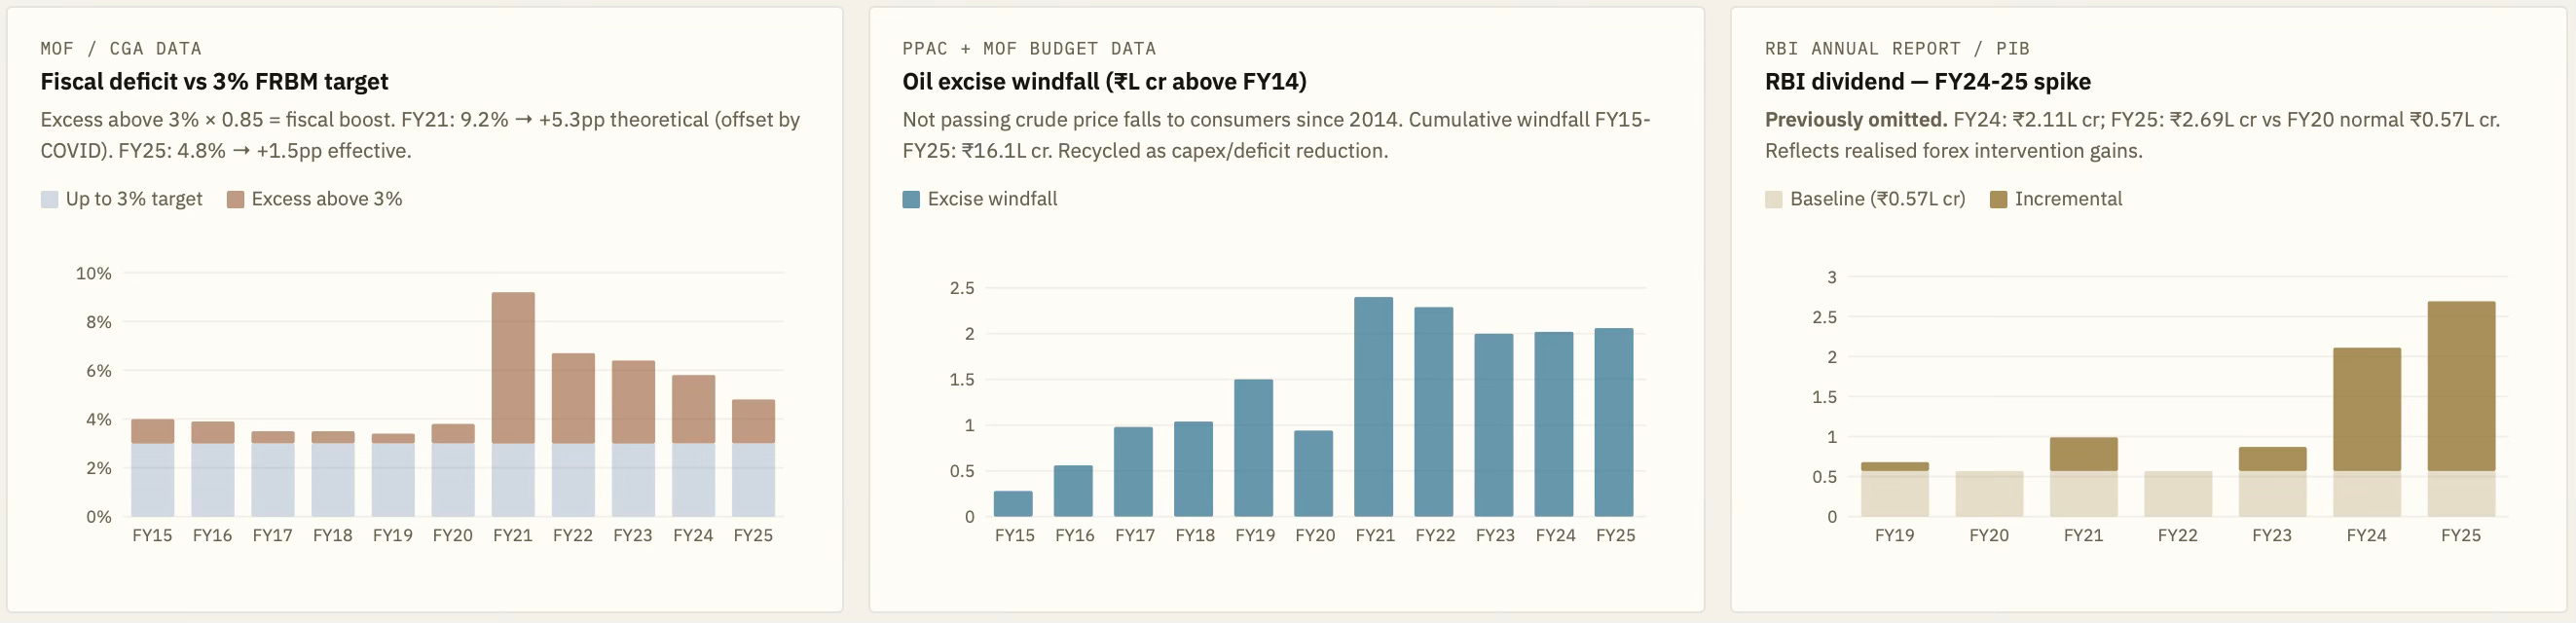
On the positive boosts to the government’s fiscal position, the contributions of the three factors are shown below. 

On the capital expenditure side, the government assumed in the budget the expenditures on railways and highways. 

The fifty-year interest-free loan to states under SASCI was a new addition, amounting to about Rs 1.5 lakh Cr each year. 

This explains how the increase in capex could be disaggregated and distributed among the different parts discussed above. 

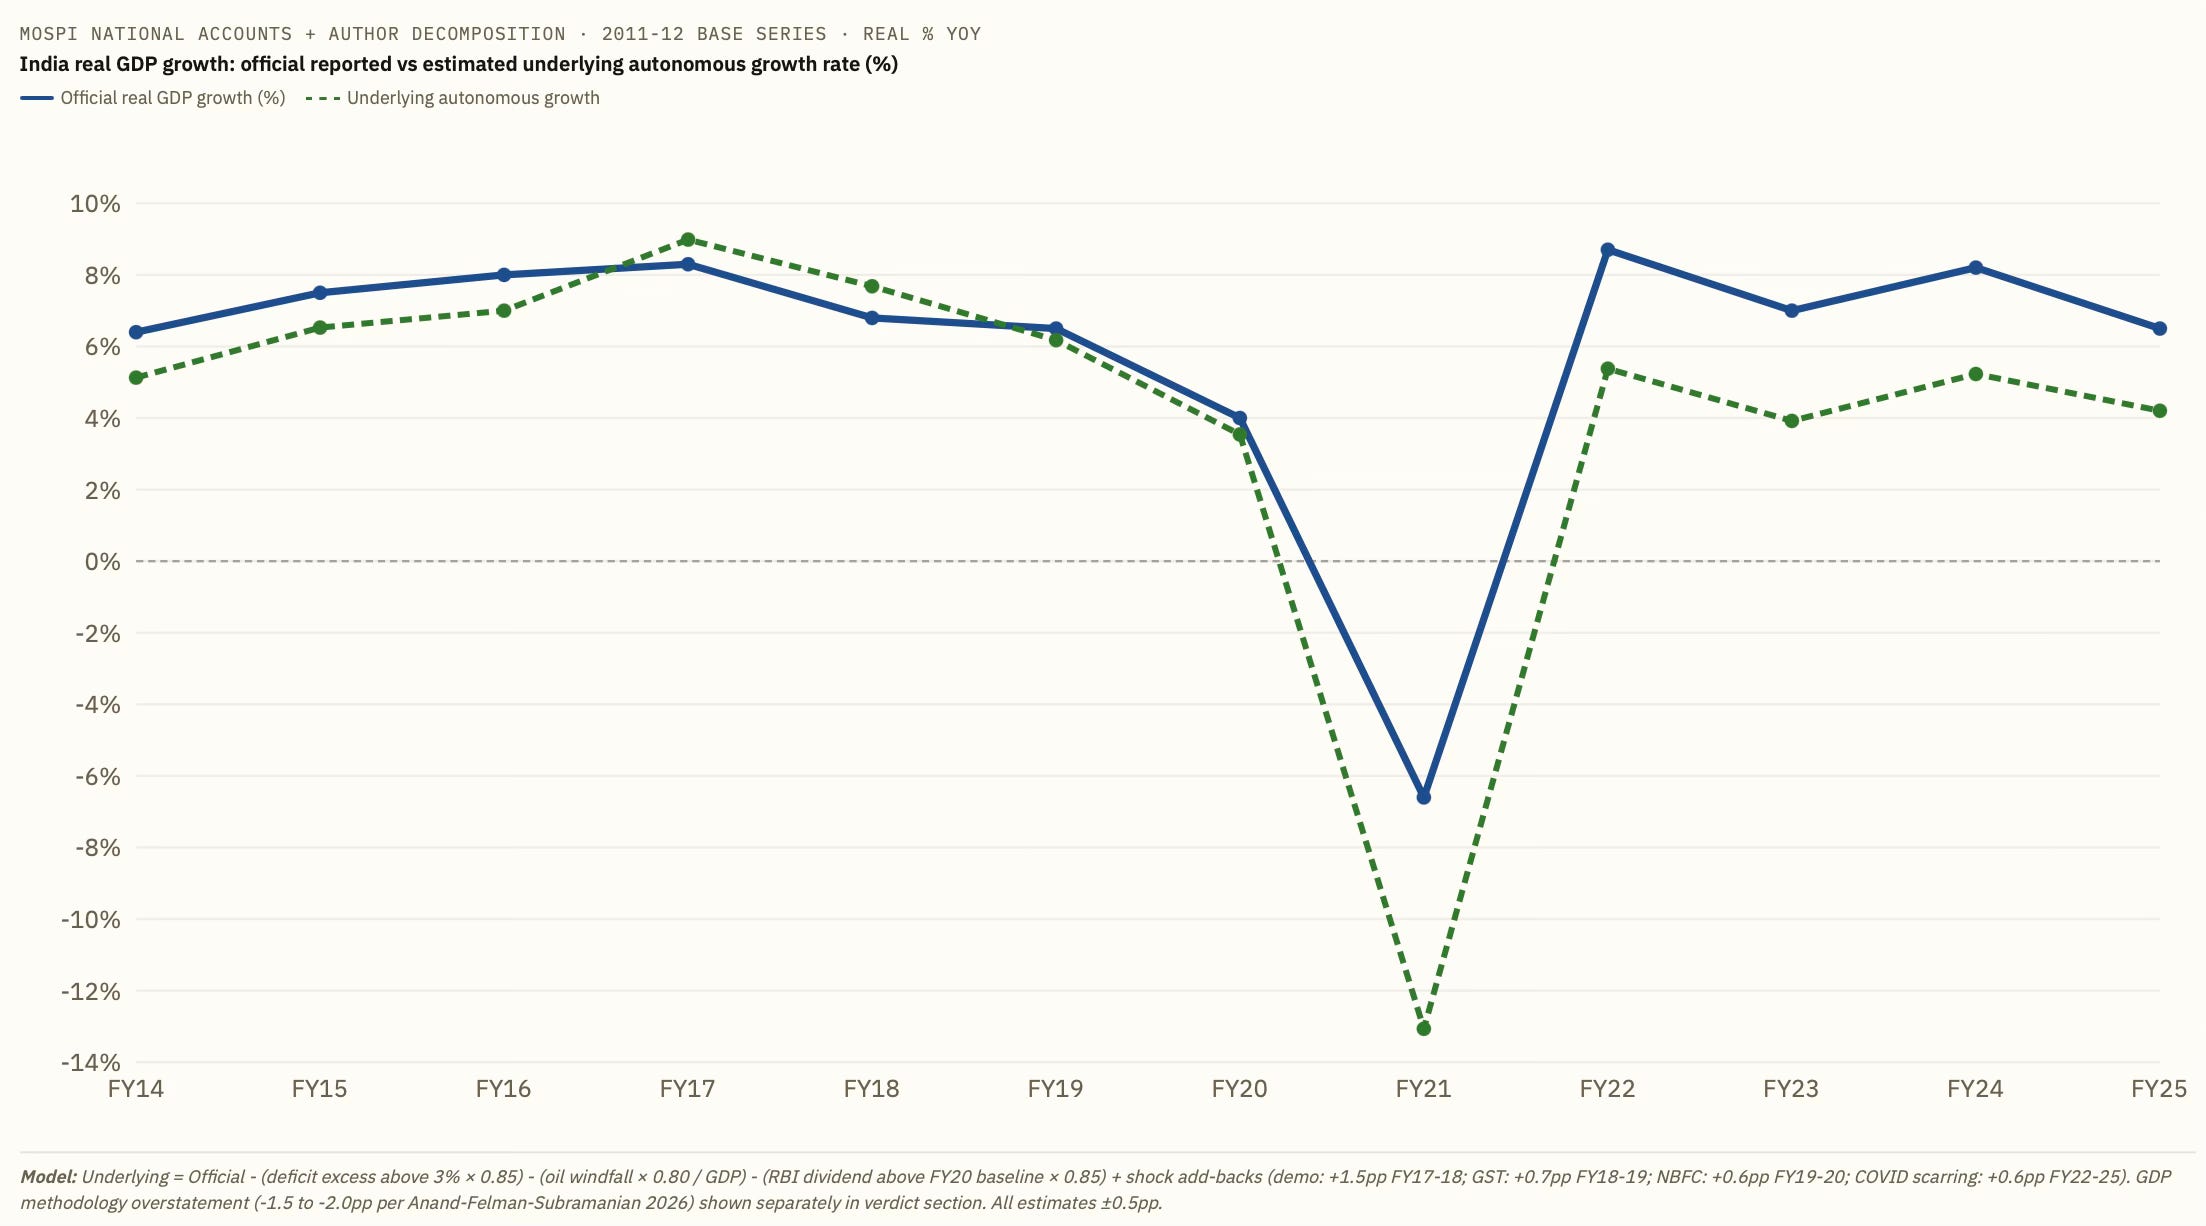
The disaggregated impact of the positive and negative factors on the economic output is shown below. 

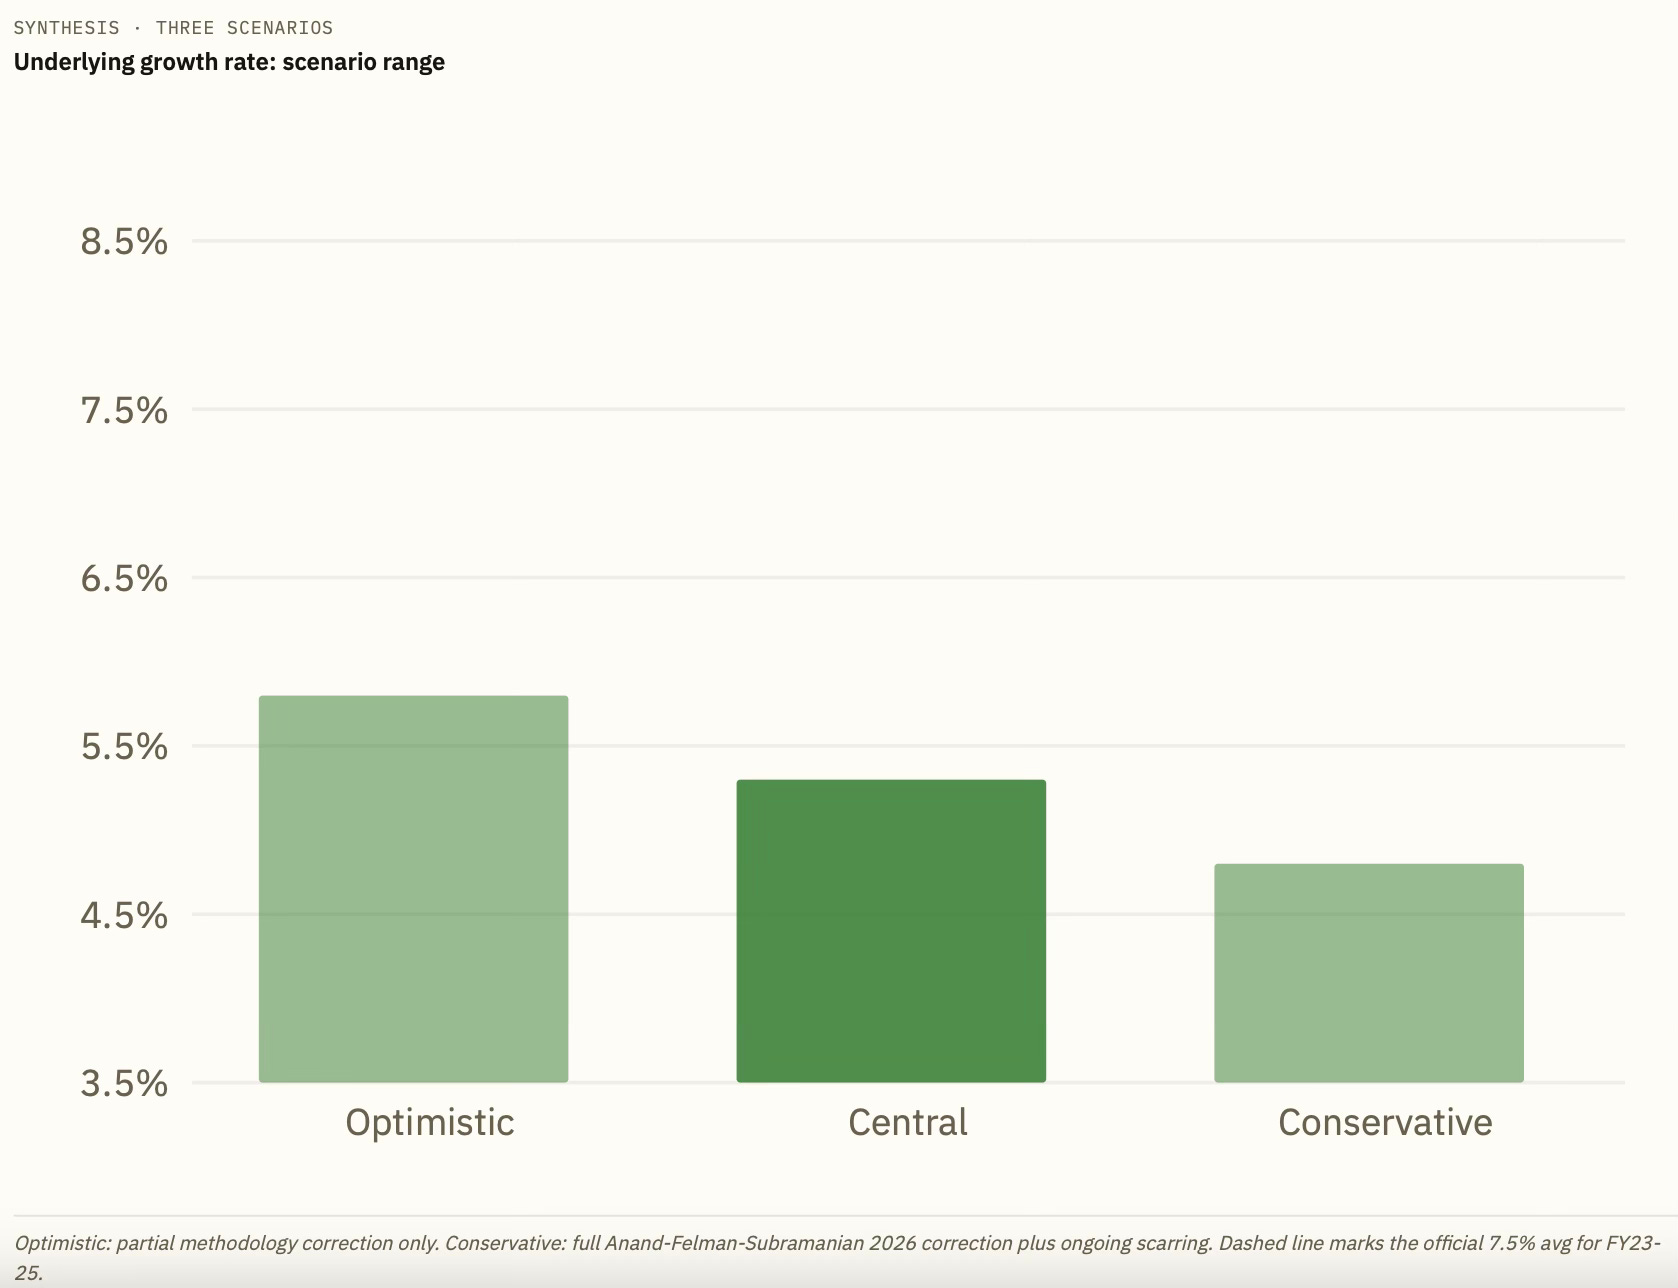
Based on the above, the underlying neutral economic growth appears to be in the range of 5-5.5%.

Clearly, since the pandemic, policy interventions have played an important role in boosting the economic output. 

The important point here is that while policy interventions may have boosted economic growth for some time, it remains to be seen in the coming years whether they have shifted the economy onto a higher underlying steady state growth trajectory. This is especially important since the headroom for further interventions, like fiscal space for more capex or tax cuts, may have shrunk, and we may be entering a world of increasing uncertainties and headwinds for the foreseeable future. 

In the final analysis, the balance sheet of the policy interventions will boil down to this question. Did the fiscal transfers of the last few years create the conditions (by broadbasing economic growth or increasing capital accumulation, for example) for a shift to a higher trajectory of growth, or was it a case of merely providing a temporary boost to the national output?

Monday, February 16, 2026

Preventing small recessions risks big recessions

It is said that periodic episodes of small forest fires prevent the big ones, and smaller avalanches prevent the big ones. On the same lines, it can be argued that periodic episodes of equity market corrections and small recessions prevent the bigger crashes and recessions. In each case, the small episodes clear out the excesses and fault lines that continuously develop in any system and prevent their accumulation.

However, for a variety of reasons, over at least the last two decades, central banks and governments in the developed economies, especially the US, have pursued policies that have sought to prevent even such small episodes. This has led to an accumulation of excesses in the dark corners of the financial markets and the economy, whose implosion may be only a matter of time. The likes of an AI-led investment boom can only postpone the inevitable. 

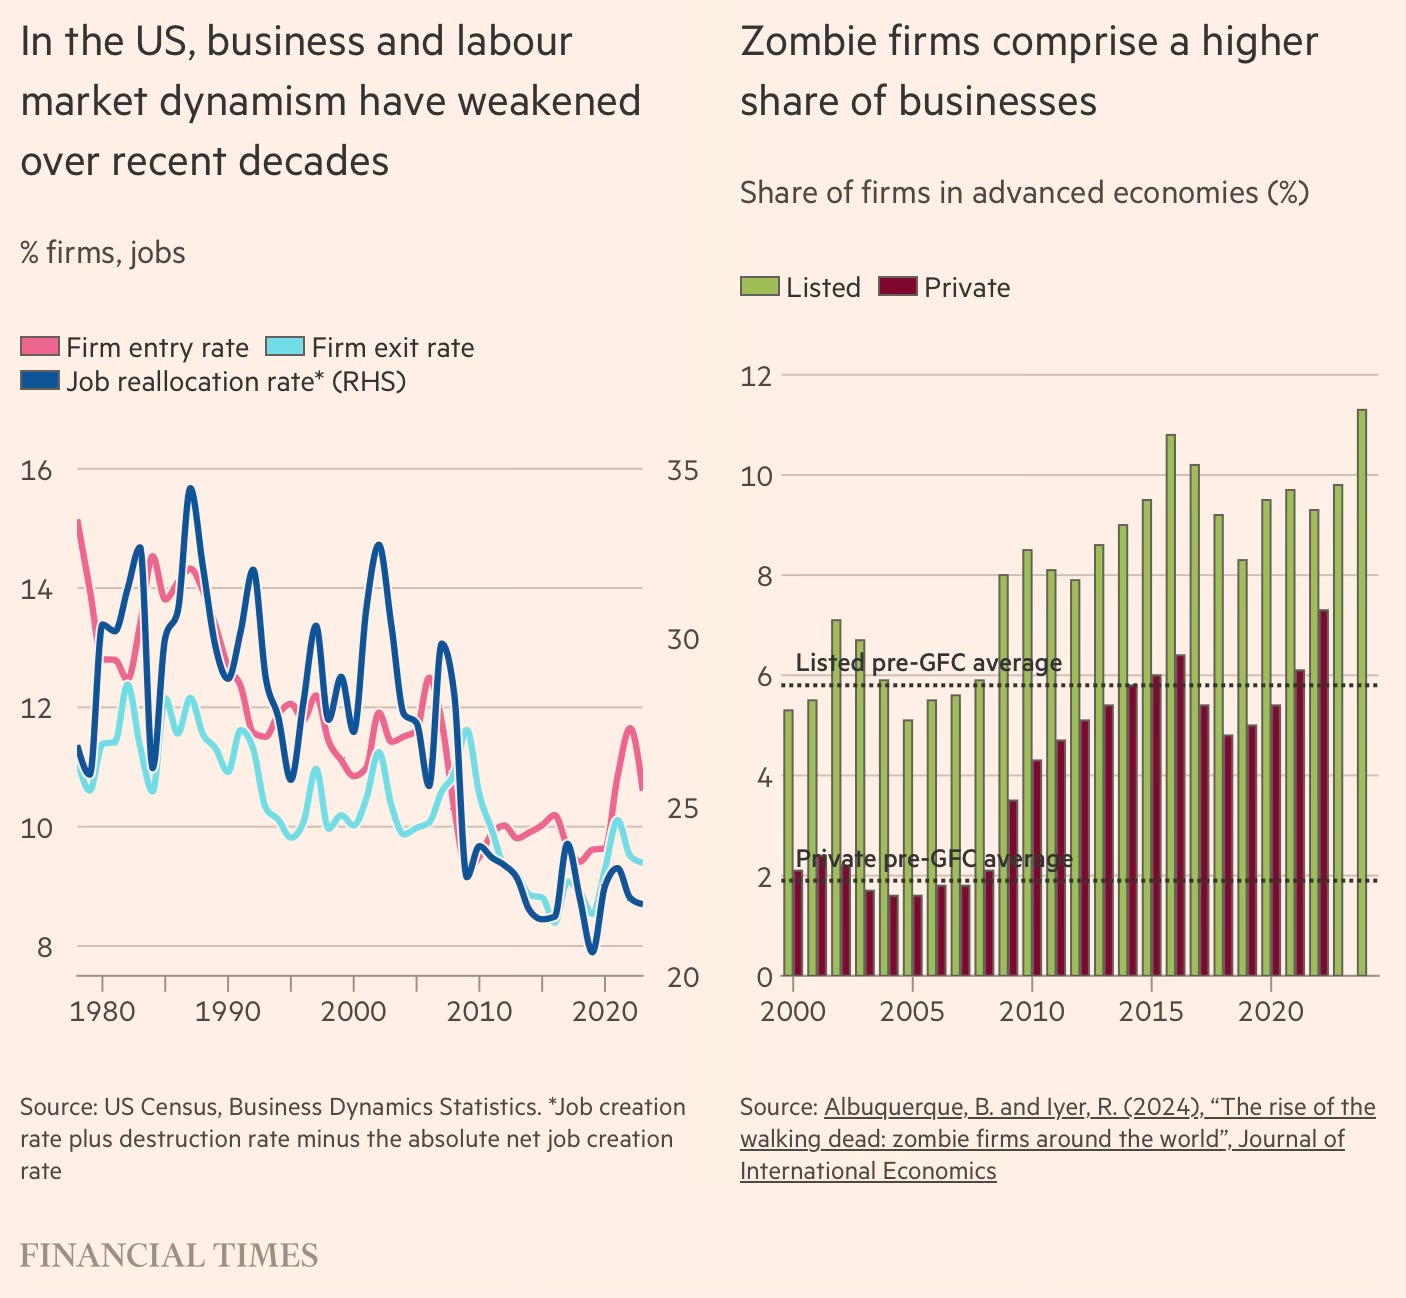
Tej Parikh has an excellent column which explains how an extended period of monetary and fiscal accommodation has contributed to plentiful cheap financing, eroded financial market discipline, kept zombie companies going, lowered business entry and exit, delayed recessions, and led to the accumulation of ever-increasing risks across the economy. 

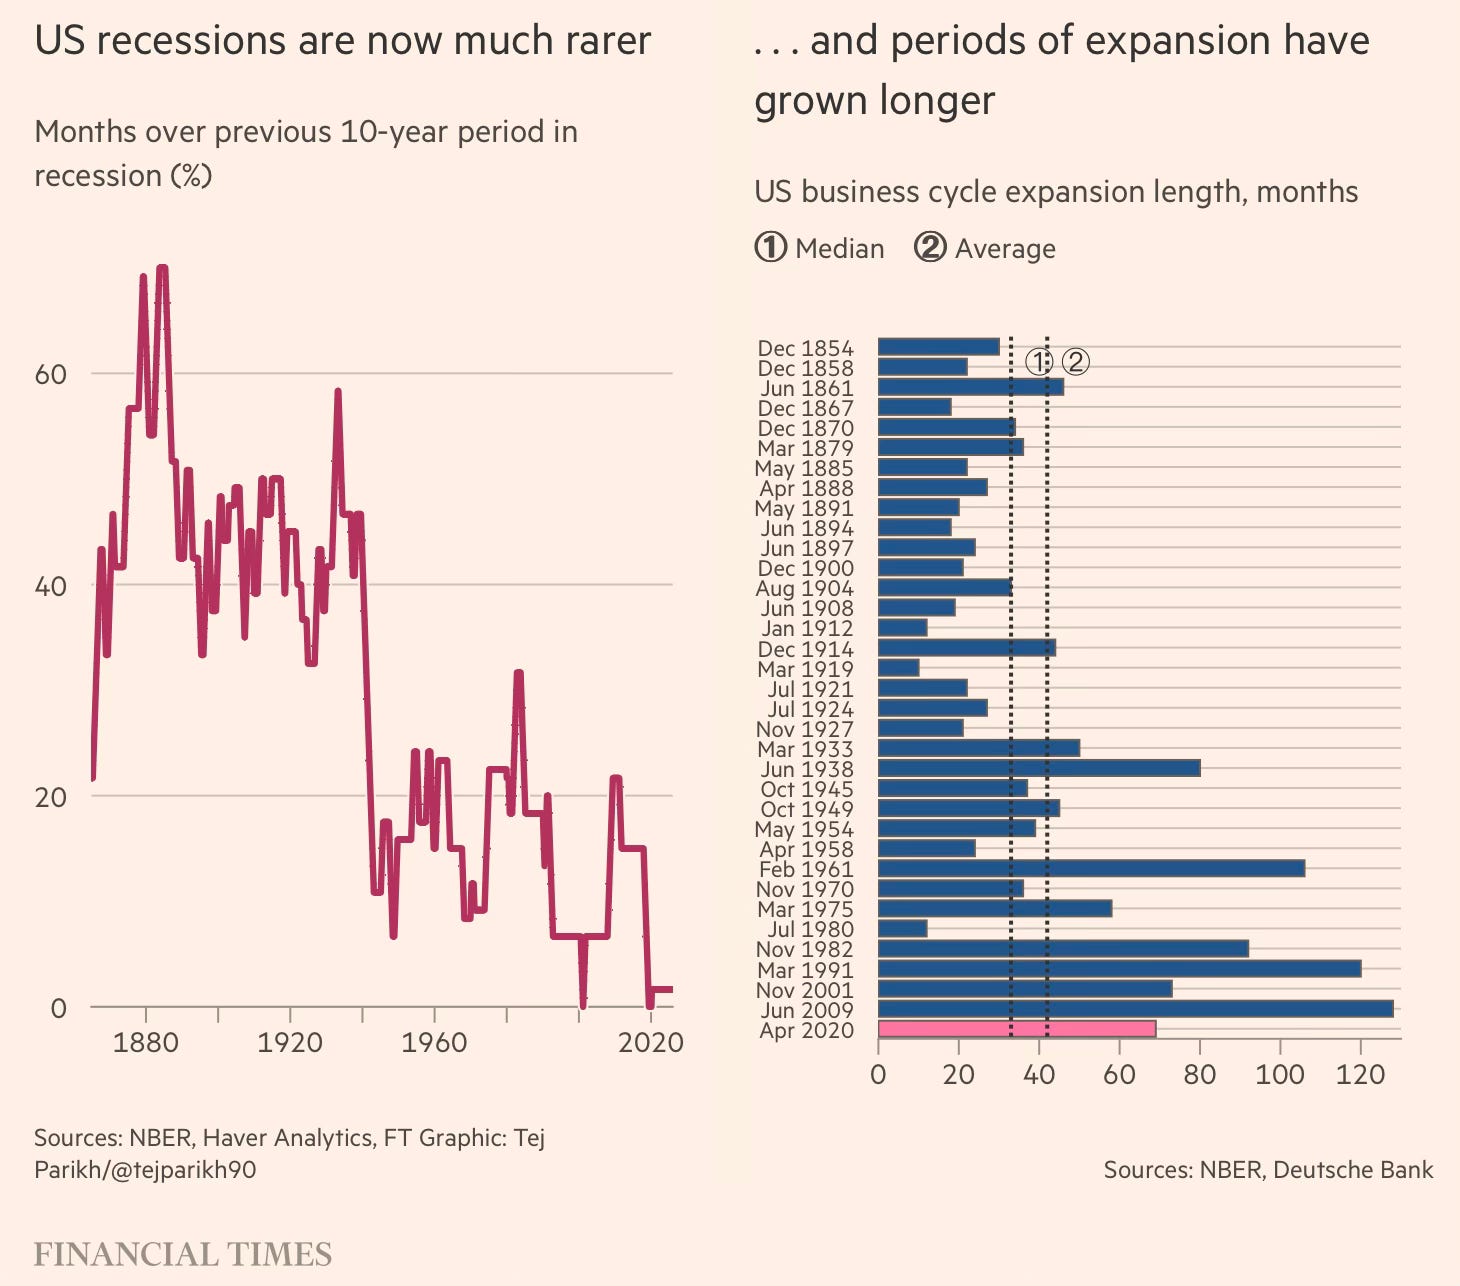
Sample these statistics about the trends with US recessions. 

The US has only seen four recessions since 1982. But over the previous 40 years there were nine, and over the 40 years before that there were 10… The US economy was in recession for 58 months over the past five decades compared to 143 in the equivalent period prior, based on data beginning in the 1850s from the National Bureau of Economic Research… The past five cycles of US economic expansion — including the current one that began in the aftermath of the Covid-19 lockdowns — have averaged more than eight years, which is close to triple the average length of cycles before.

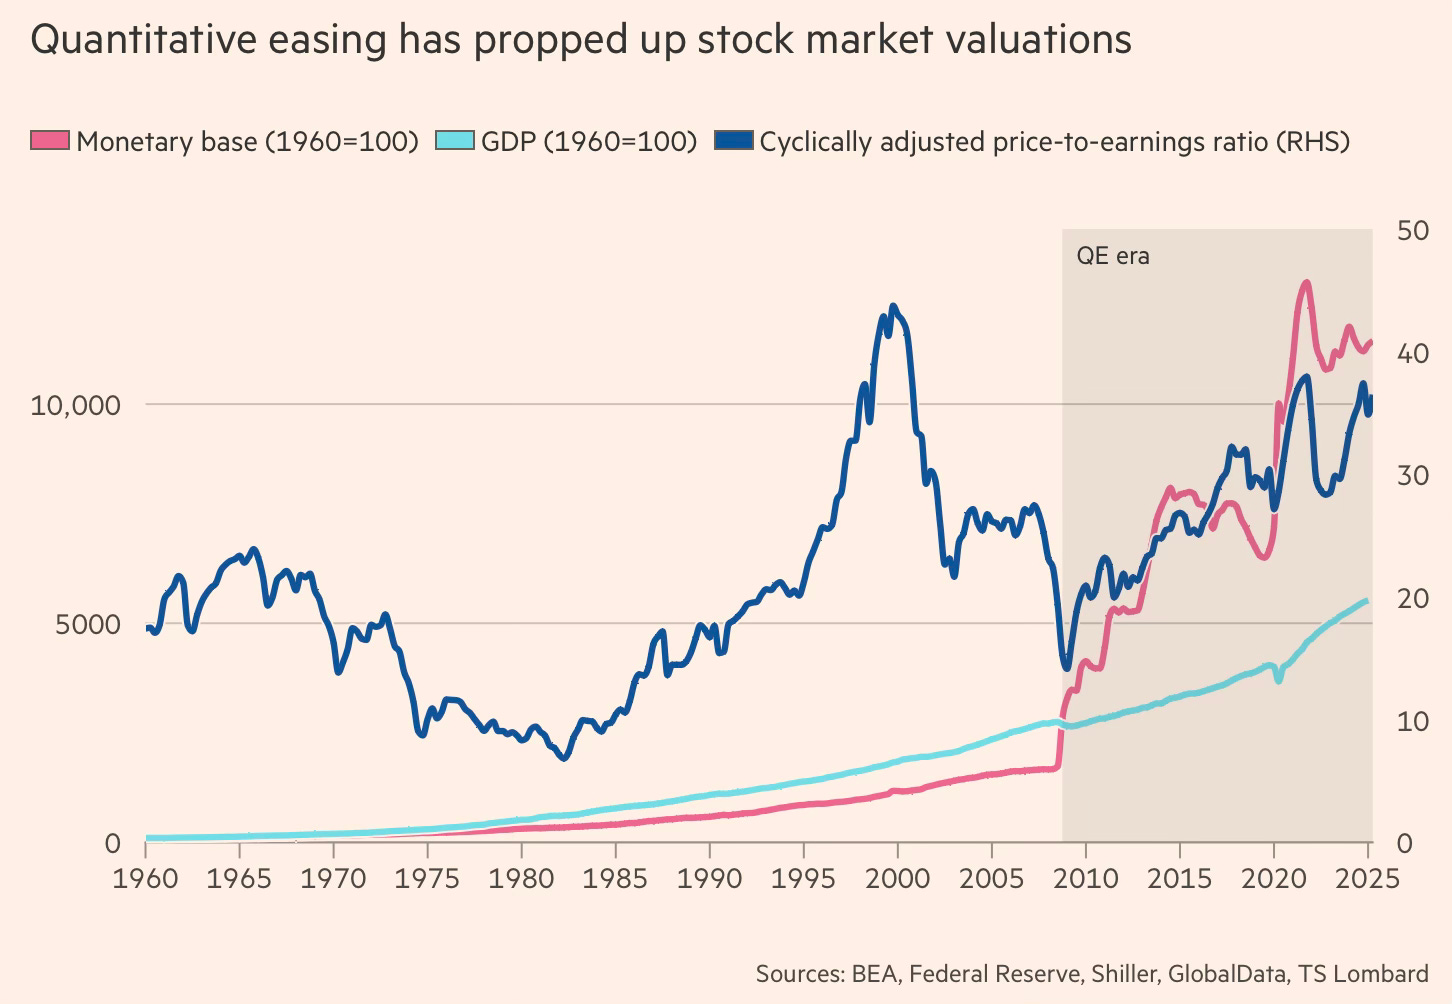
Thanks to quantitative easing, the US monetary base has expanded dramatically since the GFC, and equity market valuations have continuously soared. 

The extended period of cheap money has distorted incentives by misallocating resources, keeping capital and people locked up in less productive parts of the economy, keeping alive zombie firms and funds, and weakening economic dynamism. 

See also this graphical feature from Parikh on how economic dynamism is impeded by “statism, easy money, and risk aversion”.

It is useful here to step back and reflect on the role played by economic thinking. Economics has doubtless contributed to a better understanding of macroeconomic issues and the formulation of policies to address problems. In fact, it has played an important role in shaping the extraordinary period of human development and economic prosperity since the War. 

However, economic thinking has also resulted in many undesirable trends and distortions. Arguably, the most important trend of relevance to our times is the regime shift in monetary policy from one that sought to control inflation to one that balances inflation control with backstopping the financial markets and economic growth

While this regime shift in monetary policy is associated with the global financial crisis (GFC), it may have had its origins in the Greenspan put that emerged in the aftermath of the 1987 stockmarket crash. Since then, through a series of instruments, the scope and breadth of monetary policy actions have expanded continuously. It has been the big triumph of technocracy in economic policymaking. 

Interest rate changes have come to be supplemented with central bank balance sheet expansion through liquidity injection windows, quantitative easing, macroprudential measures, yield control actions aimed at long-term sovereign bond rates, direct purchases of corporate bonds, and forward guidance actions. 

What started as measures to ensure financial stability has now morphed into an institutionalised set of tools to backstop financial market declines, and thereby economic growth itself. There has been a wholesale reshaping of expectations among a generation of investors and market participants. This has resulted in a sharp erosion of the disciplining powers of the financial markets in capital allocation.

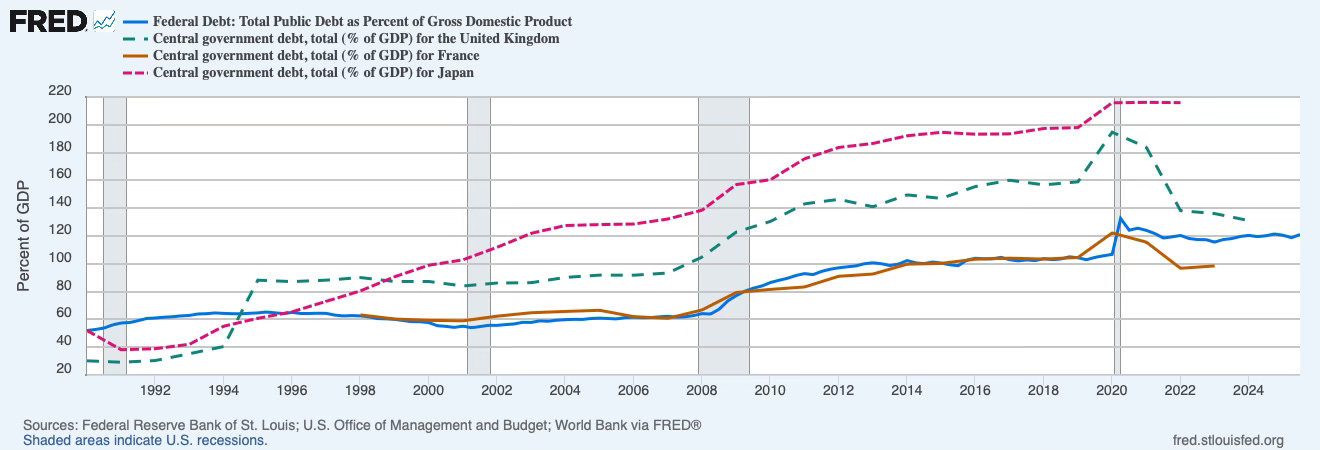
Economic thinking has emboldened governments on fiscal policy, too. The result has been the dramatic fiscal expansion, especially but not only since the GFC, as governments have run persistent large fiscal deficits to sustain economic growth. The US public debt to GDP ratio has nearly doubled since 2008. 

Worryingly, these actions have engendered perverse incentives among politicians and policymakers. A generation has come to believe that fiscal and monetary policy offers an unlimited arsenal of options to stabilise equity markets and prevent recessions. The ideological cover provided by economists, coupled with the rising applications of these tools with little apparent costs, has emboldened them. 

This is most evocatively captured in the unqualified “whatever it takes” assurance given by Mario Draghi, the President of the European Central Bank, at the height of the Eurozone crisis in 2012. It was followed up by the ECB in the 2012-15 period with its ‘Big Bazooka’ measures involving aggressive QE, liquidity windows, and reduction of rates to negative territory. He was merely following in the footsteps of Ben Bernanke during the GFC, and was followed subsequently by Jerome Powell during the pandemic meltdown.

Donald Trump’s arguments for lower rates must be seen against this backdrop. As a democratically elected leader, he is making a legitimate political choice of wanting to sustain high economic growth rates and continue the equity market boom. Further, never mind its consequences, he’s probably right in arguing that lower rates can help both political objectives, even if only for some time. Alan Greenspan, Ben Bernanke, Janet Yellen, Jerome Powell, and Mario Draghi made similar choices, especially in continuing monetary expansion far beyond what was required, to much acclaim and little pushback. Their decisions were accepted as technically correct choices. Donald Trump cannot be faulted for being upset at the apparent hypocrisy. 

The political pressures to keep rates low are supplemented by the emerging high stakes of the big technology firms leading the AI charge. The two have become intertwined, also because of the outsized role of the surging AI investments in economic growth in the US. Nobody wants monetary policy to rock the boat in these euphoric times of impending transformative change. 

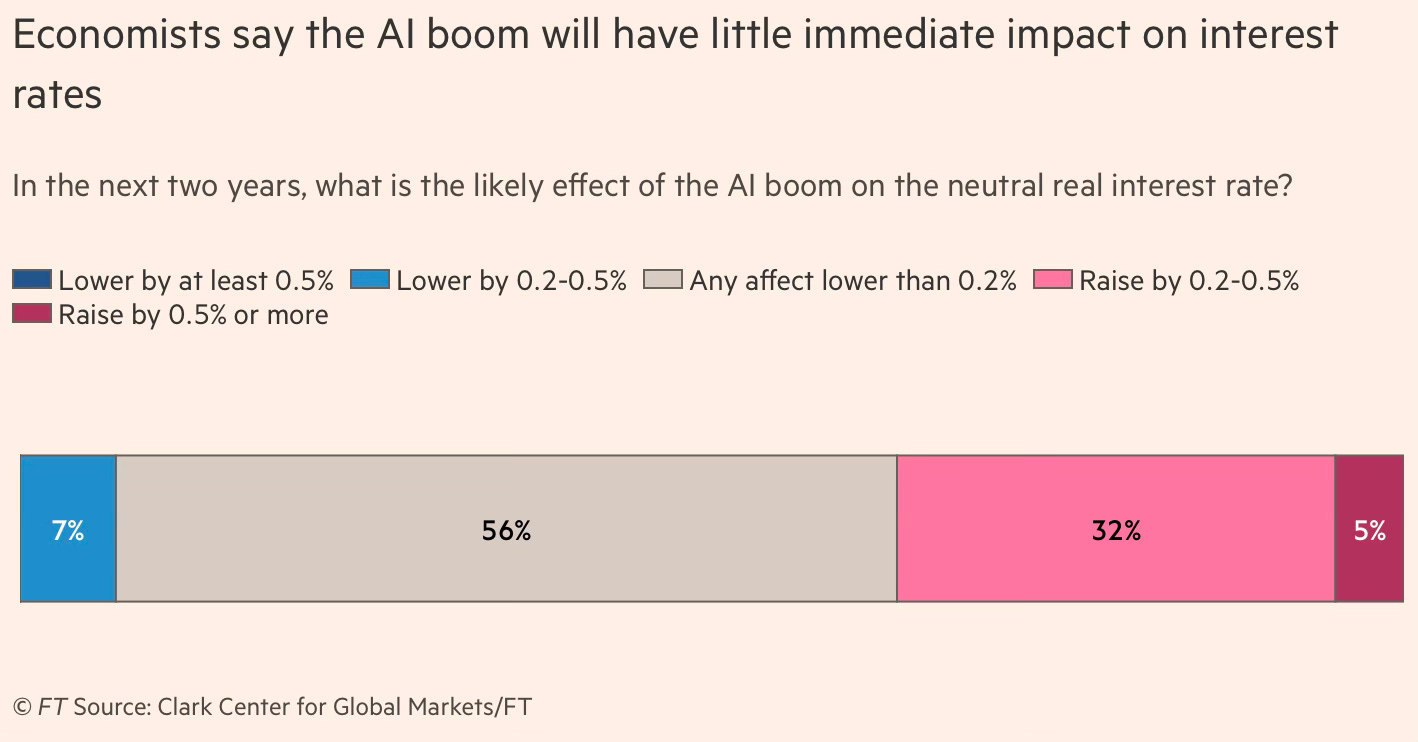
It is therefore unsurprising that Kevin Warsh, the incoming Chairman of the US Federal Reserve, has already indicated his bias towards monetary accommodation, arguing that the productivity boom likely from AI adoption will create the space for interest rate cuts. Warsh has claimed that AI will trigger “the most productivity-enhancing wave of our lifetimes — past, present and future”. Never mind that his fellow economists think otherwise, and argue that it could raise demand and price pressures, at least in the short-term.

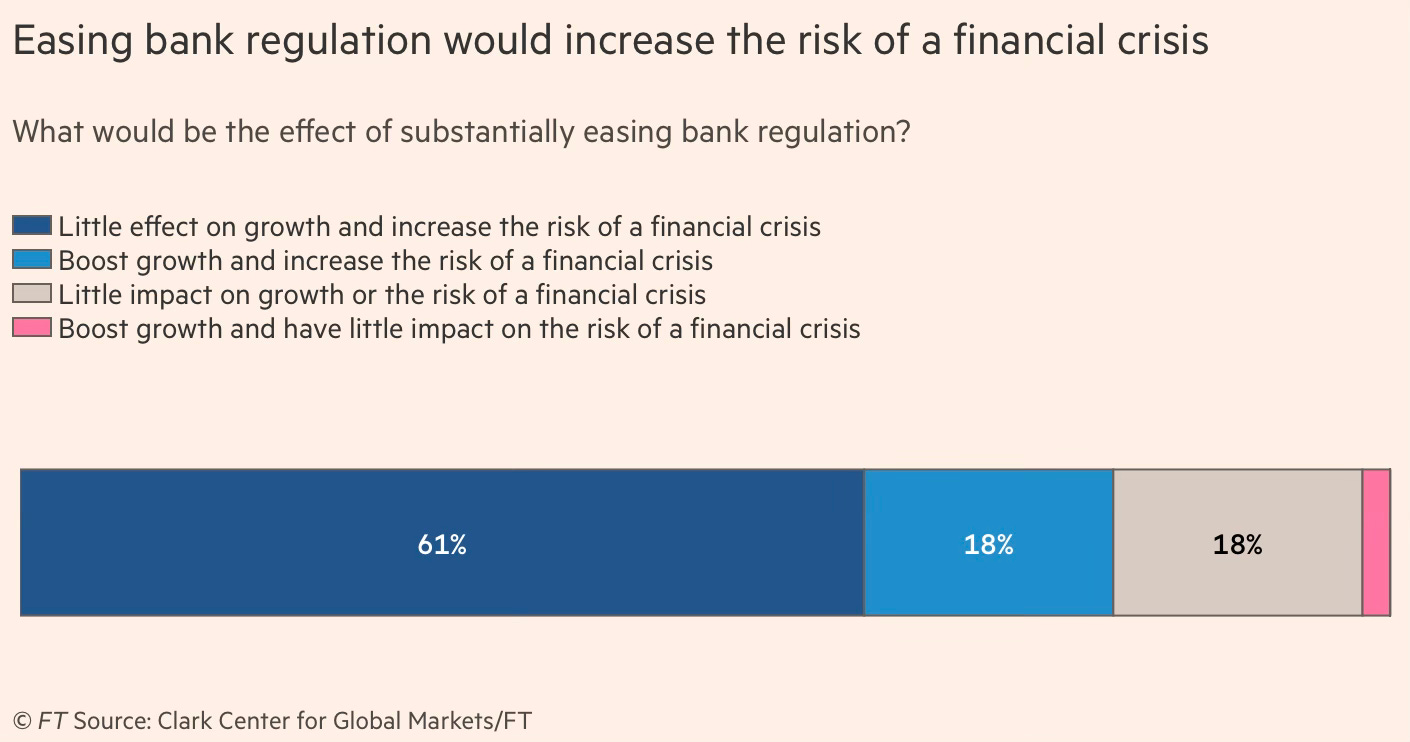
Interestingly, Warsh also argues in favour of easing bank regulation, another policy favoured by President Trump, whereas his colleague economists feel that it would increase the risk of a financial crisis. 

John Maynard Keynes famously said, “Practical men, who believe themselves to be quite exempt from any intellectual influences, are usually the slaves of some defunct economist.” It is equally likely that “defunct economists” are the slaves of “practical men” of the political variety. Kevin Warsh appears to be a likely candidate. 

A problem with economic arguments is that the discipline allows one to make conflicting arguments grounded in theory. It is not surprising that a frustrated Harry Truman famously demanded a one-handed economist. Sample this on the likely impact of the AI-boom highlighted by Robert Barbera of Johns Hopkins University.

“The AI boom may generate a booming economy, shrinking budget deficits, higher neutral interest rates and comfortable shrinkage of the Fed’s balance sheet. Or we may experience a financial market crack-up, a deep recession, a dramatic rise for deficits, eliciting a return to zero short rates, a swoon for the dollar, and demands for another big dose of [balance sheet expansion].”

Jason Furman writes about the complicated nature of the relationship between productivity and inflation.

Over the long run, productivity growth does not determine inflation. Productivity reflects the economy’s real productive capacity; inflation reflects monetary policy choices. But sustained faster productivity growth does raise the economy’s neutral real interest rate. To prevent inflation, central banks must therefore maintain higher nominal rates. The mechanism is straightforward. Faster productivity growth allows households to save less because they anticipate higher future income, while prompting businesses to invest more because expected returns rise. Both of these boost demand and push up real interest rates. In the short run, an unexpected acceleration in productivity can influence inflation, but the direction is ambiguous. 

Greenspan’s hypothesis was that higher productivity allowed nominal demand to grow faster without igniting inflation. Because wages adjust less frequently than prices, this initially showed up as slower price growth rather than faster wage growth. That dynamic may well have characterised the early years after productivity began accelerating in the mid-1990s. But there is a competing short-run effect that runs in the opposite direction. Anticipation of a sustained productivity boom can itself be inflationary, by lifting equity prices and household spending and by spurring business investment. At bottom, this is a timing race: does demand surge ahead of supply, or does supply expand fast enough to accommodate demand without inflation? In the late 1990s — just as today — there was no clear way to know in advance which would dominate.

Another Warsh preference is likely to be to steepen the yield curve by lowering short-term rates through lowering repo rates and raising long-term rates by winding back the Fed’s balance sheet. Martin Sandbu describes how the same set of policies can have contrasting effects.

It is not at all clear whether a steeper yield curve will by itself amount to a looser or tighter overall monetary policy stance. That depends on the relative moves at the different maturities, and how strongly they affect the economy — through exchange rate movements, market valuations and government borrowing costs at the short end, and through “real economy” financing costs such as mortgage rates at the long end. Warsh himself has intimated that the long benchmark Treasury rates are more consequential than short-term policy rates. I share this view. But it is clear that short-term rates matter a lot too. So the macroeconomic effects of a yield curve steepening go in both directions and it’s hard to be confident of the overall impact.

The larger point here is that in the US (and maybe elsewhere), the political acceptability of even small shocks has diminished significantly; economists have come to embrace hitherto unorthodox fiscal and monetary policy measures; and equity markets have become very high-stakes bets. The consequence of these trends is the postponement of smaller recessions and the accumulation of vulnerabilities that increase the risk of bigger recessions.
Saturday, February 14, 2026

Weekend reading links

1. Gig economy may create over a million jobs in FY26, taking the total workforce to 14 million.

According to data from TeamLease Services, ecom and qcom are likely to add nearly 1 million jobs this year, followed by the logistics and warehousing sector. Balasubramanian A, senior vice president, TeamLease, said: “Qcom and ecom are estimated to generate 900,000 to 1 million jobs as they expand into Tier-II, -III cities; logistics and warehousing are expected to create nearly 500,000 roles driven by new multi-modal parks and electric vehicle fleets.” A similar trend was evident last year (CY25) when ecom and qcom firms created 600,000 jobs, logistics players generated 400,000, and the banking, financial services, and insurance (BFSI) sector added nearly 200,000 new gig roles for field sales and digital verification. Similarly, data from jobs and career platform Apna, for financial year 2026-27, said that hiring is expected to be driven largely by qcom expansion into Tier-II and Tier-III cities with around a million jobs. Kartik Narayan, chief executive officer of jobs marketplace at Apna, said: “The top three sectors— qcom, retail, and logistics — will continue to dominate the space. Qcom would add nearly 1 million jobs and logistics may generate approximately 500,000-700,000 jobs.”

On wages

On whether an increase in demand will lead to a rise in salaries or incentives of gig workers, Apna said, “Salaries are variable payout given the job but are approximately between ₹12,000-₹25,000 with the mean being ₹15,000 for nearly 40 per cent of these employees. Gig worker payouts might remain flattish due to intense competition and any increase would be attributed to incentivising festival period delivery and other holidays than the actual pay-out per delivery.”

2. Sanae Takaichi wins the largest majority for the LDP in the 465-seat Japanese lower house since its formation in 1955, securing 310 seats in the snap polls. The result saw the Nikkei rise sharply and bond yield climb in expectation of increased borrowings to fund Takaichi's committed spending program. 

3. Contrary to all the talk of a declining US economy, investors are flocking to US assets.

Last year foreigners poured around $1.6tn into US financial assets, including nearly $700bn into stocks, both new records and significantly higher than the levels of recent years. The story is much the same for US corporate bonds, with foreign purchases up sharply... From Singapore to Seoul, they are staying up all night to trade on increasingly popular after-hours US trading platforms. Among the few foreigners sitting out this buying spree were central banks, which have been moving money from the dollar into gold... Foreign institutions alone now own nearly 15 per cent of US stocks, a record share and up by half from the level a decade ago... Notwithstanding all the America bashing, foreigners now own nearly $70tn in US assets, double the level a decade ago. And in the last year, most of those flows arrived as “hot money”. Foreign direct investment in factories and businesses, which cannot withdraw quickly, was much weaker than portfolio flows into assets such as stocks and bonds, which can reverse in an instant.

4. US plans tariff carve-outs to chip makers, especially the likes of TSMC, who make investments in the US. 

The size of the potential rebate programme would be linked to the recent US-Taiwan trade agreement. The White House has agreed to slash tariffs on imports from the island to 15 per cent in exchange for a $250bn investment in the chip industry in the US. Under the deal, Taiwanese companies including TSMC that invest in the US will be exempt from the forthcoming tariffs in proportion to their planned US capacity. The White House said it would allow Taiwanese companies building semiconductor plants in the US to import 2.5 times the new facilities’ planned capacity tariff-free during the construction period, according to an outline of the trade deal released by the commerce department. Taiwanese companies that have already built plants in the US will be allowed to import 1.5 times their capacity. TSMC would be able to allocate the exemptions it earns under the trade deal to its Big Tech clients in the US, allowing them to import chips from the company tariff-free. The size and scope of the rebates for US hyperscalers depend on the production capacity that TSMC forecasts it can reach in the US in coming years.

5. China is treating data as an asset.

In 2024, China became the first country to allow enterprises to classify data as intangible assets on their balance sheets. Beijing had already declared data a “factor of production” alongside land, labour, capital and technology. The National Data Administration now oversees dozens of data exchanges. China Unicom, one of the world’s largest mobile operators, reported Rmb204mn ($29mn) in assets in its first filing under the new rules. The motivation isn’t purely philosophical. Local government financing vehicles — the off-balance-sheet entities Chinese municipalities use to fund infrastructure — are drowning in debt. Some use data as collateral for fresh loans.

6. The rising Apple margins

7. Mirroring the changing trends, as EV sales slump across the US, EV battery plants are being converted into energy storage systems (ESS) for the surging demand to power data centres. Sample this
Tesla, which incorporates batteries from a range of suppliers including CATL and LG into its Megapack and Powerwall energy storage systems, reported that energy and generation storage revenues grew 27 per cent year-on-year to $12.8bn — up from $2.8bn in 2021, while its revenues from EV sales fell 9 per cent to $64bn. The shift to ESS has been accelerated by weakening government support for EVs, after the Trump administration slashed tax credits established in the Biden-era Inflation Reduction Act and moved to cut tailpipe emission rules and state clean-air standards intended to encourage drivers to switch to EVs... These policy rollbacks led analysts at BloombergNEF to revise down their forecast for EVs’ total share of 2030 car sales from 48 per cent to 27 per cent. EVs currently account for about 8 per cent of US new car sales. Stellantis is selling its 49 per cent stake in a battery plant just over the Detroit River in Windsor, Ontario, to Korean battery giant LG for just $100, after the European car group announced a €22bn writedown last week tied to its aggressive expansion into EVs. It had invested $980mn in the Windsor facility...
While the administration has cut consumer tax credits for EVs, President Donald Trump’s flagship One Big Beautiful Bill Act passed last year retained generous production credits for battery manufacturers. They include a $35 per kilowatt-hour manufacturing credit for battery production, and a 30 per cent investment tax credit for energy storage that will be phased out starting in the 2030s. The credits, along with US tariffs on Chinese energy storage batteries of close to 60 per cent, mean ESS cells can be produced in the US at prices close to parity with the Chinese imports that dominate the market.

8. Migrants make a disproportionately large share of successful US startup founders. 

Some 44 per cent of the 1,078 founders who created a US tech start-up valued at more than $1bn between 1997 and 2019 were born outside the country, according to a Stanford Graduate School of Business study. The top five grey matter exporters to the US were India, Israel, Canada, the UK and China.

9. AK Bhattacharya points to some facts about the Government of India's capital expenditure trends. 

Between 2005 and 2020, a period of 15 years, capital expenditure crossed 2 per cent of GDP only twice — in 2007-08 and in 2010-11... Between 2020-21 and 2024-25, she grew capex by 26 per cent on average every year... As a percentage of GDP, capital expenditure rose from 1.67 per cent in 2019-20 to 3.2 per cent in 2024-25... Interest-free 50-year loans to states... in 2020-21... accounted for only 2.8 per cent of the total capex outlay of the Centre. Over the years, this share has gone up and, in 2025-26, it was 13 per cent and is set to go up to 15 per cent in 2026-27... Almost 41 to 52 per cent of the government’s capital outlay is allocated to PSUs. In other words, the Union government depends not just on the states for executing its capex plan, but also on PSUs... almost half of the government’s capex is dependent on providing equity and loans to PSUs.

10. Martin Sandbu points to Michael Sandel's prophetic warning in 1996 in his book, Democracy's Discontent.

“To the extent that contemporary politics puts sovereign states and sovereign selves in question, it is likely to provoke reactions from those who would banish ambiguity, shore up borders, harden the distinction between insiders and outsiders and promise a politics to ‘take back our culture and take back our country’, to ‘restore our sovereignty’ with a vengeance.”

11. London has the lowest new housebuilding among all major cities in the world!

London has been set a target of building 88,000 new homes per year over the next decade. Last year construction started on just 5,891 — 94 per cent below target, a 75 per cent year-on-year decline, the steepest drop in the country, the lowest tally since records began almost 40 years ago and the lowest figure for any major city in the developed world this century... New starts by private developers were down 79 per cent over the past two years, compared with collapses of 85 and 94 per cent for affordable and council housing respectively, with work started on just 100 council-funded homes in 2024-25 by one estimate.

And rising costs due to regulatory changes are behind this. 

This is a good example of how well-intentioned policies to discourage foreign investors from buying up properties in London (and thereby squeeze out the local residents) may have had a perverse impact. 
Such investors are frequently blamed for worsening affordability, but a 2017 report led by the LSE’s Kath Scanlon found that these investors “had a positive net effect on the availability to Londoners of new housing, both private and affordable”, warning that “there would be real costs to the London housing market if overseas investment . . . began to feel unwelcome”. That is precisely what has happened over a decade of increased charges on owners of second homes and foreign investors.

This about the regulatory layers added in response to the 2017 Grenfell Tower fire. 

This has taken two forms: significant costs of upgrading existing homes to new standards, and the introduction of a new body — the Building Safety Regulator (BSR) — which has added a lengthy and exacting step between planning approval and starting construction, with inadequate resources quickly creating a logjam. This has placed a particular squeeze on the finances of affordable housing providers, who cite “additional costs and delays as a result of new building safety regulations” as a key reason for low build rates, leaving £120mn worth of council-funded homes on hold. Tens of thousands of provisionally approved homes in the capital are waiting on supplementary review by the BSR, which green-lights only a third of cases and takes an average of eight months to do so. These delays — at a point when developers have typically already poured large sums into a project — add huge financing overheads, in some cases expanding projects’ overall cost by more than 15 per cent. Adding to these are enhanced environmental regulations that are far more stringent than those in other European countries and levies requiring developers to invest in local infrastructure.
12. Tej Parikh has an excellent graphical summary that explains how the combination of an extended period of monetary and fiscal accommodation has led to plentiful cheap financing, eroded financial market discipline, kept zombie companies going, lowered business entry and exit, delayed recessions, and led to the accumulation of ever-increasing risks across the economy. 

Monday, February 2, 2026

Lessons from India's fiscal policy management

It has become a feature of economic policymaking to define thresholds for fiscal prudence and macroeconomic stability. Accordingly, it is held that fiscal deficits should not exceed 3% of GDP, public debt should not exceed 60% of GDP, inflation should not exceed 2% (or 4%), etc. 

I have blogged earlier here and here about the problems with the uniform adoption of such targets. 

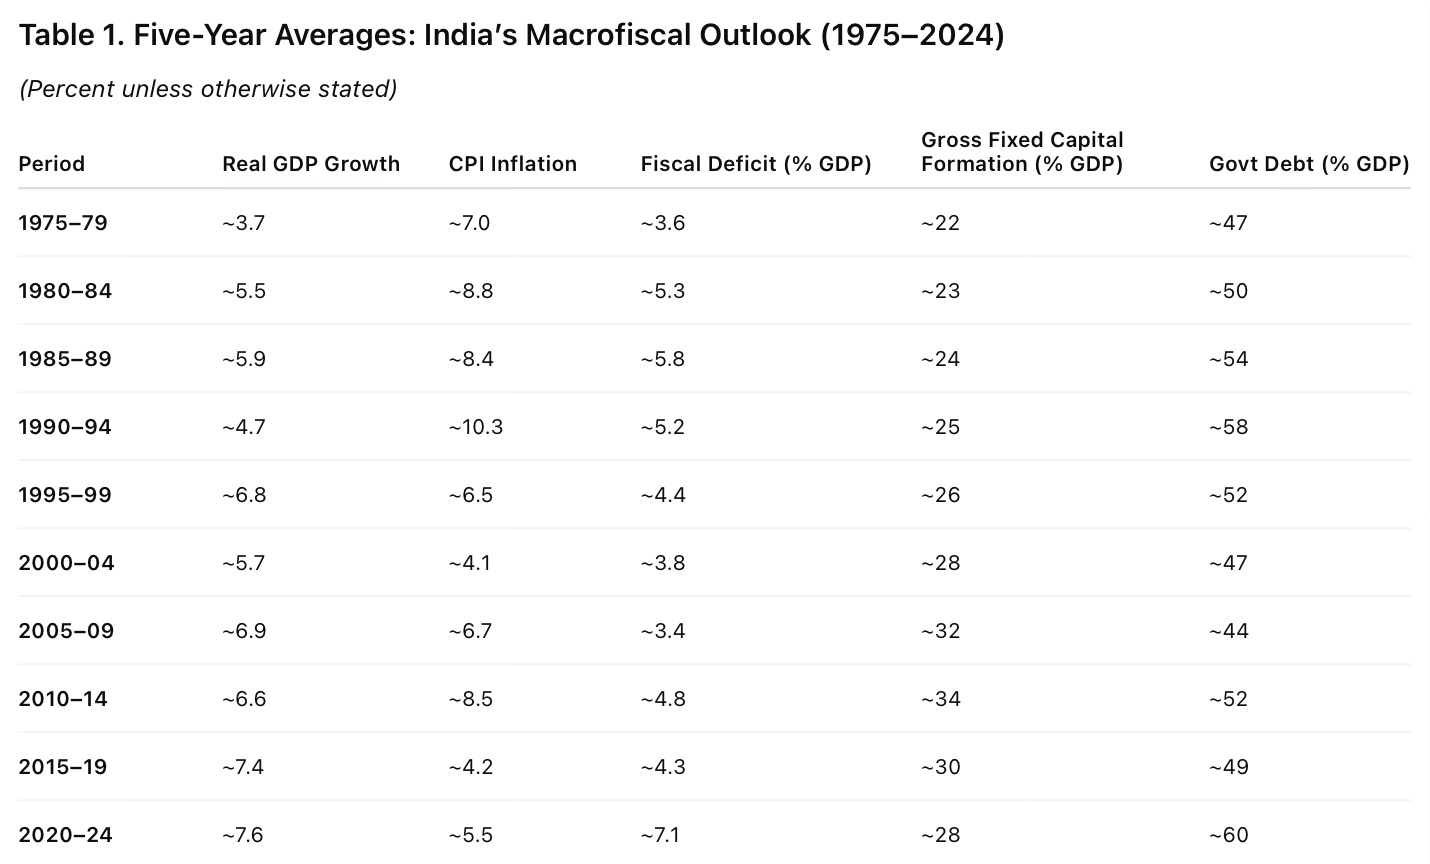
This post will examine India’s macroeconomic record over the last fifty years against these benchmarks. It will use data for 1975-2024 from the World Bank’s WDI to assess the impacts of CPI inflation, central government debt (% of GDP), fiscal deficit, and gross fixed capital formation (GFCF) on GDP growth rates. 

The table below captures the five-year averages on each of the above parameters. 

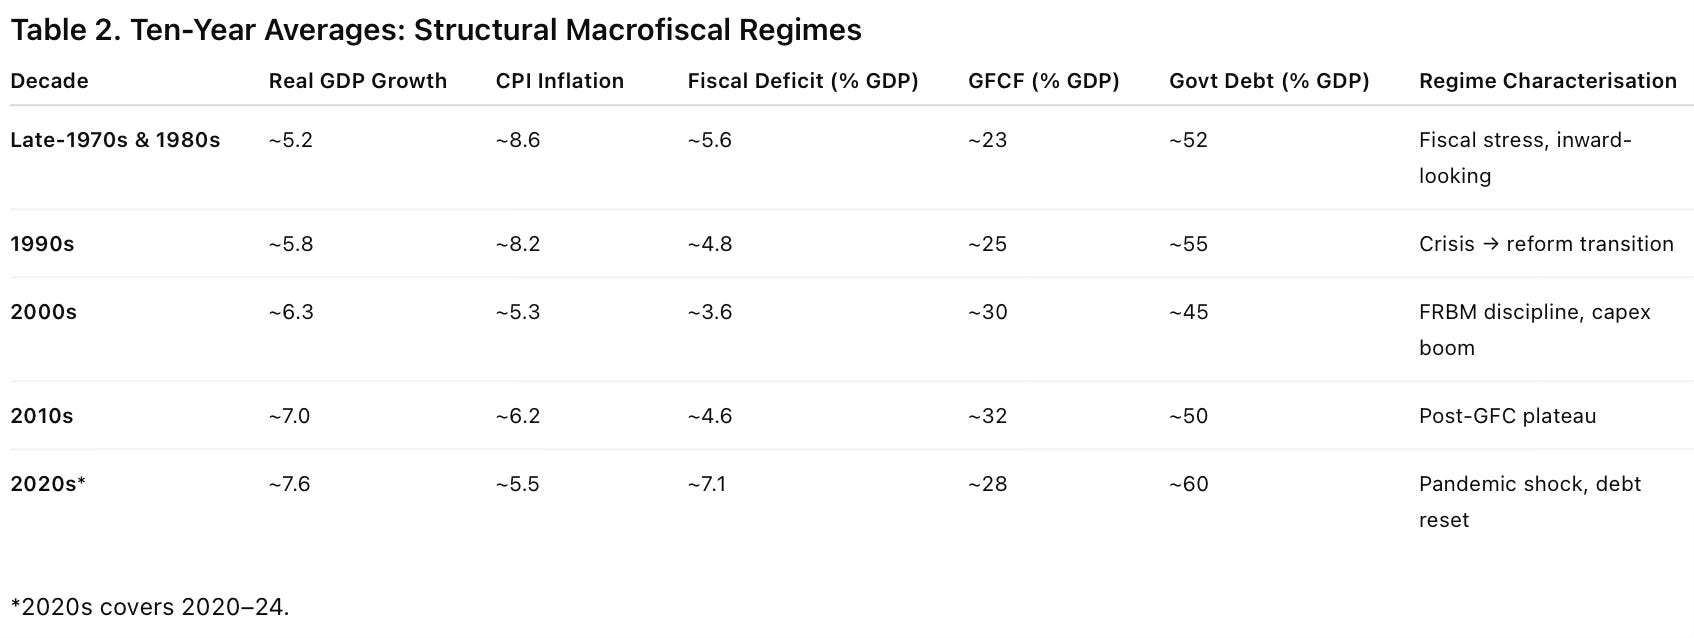
This is the same table with ten-year averages.

This is a ChatGPT summary which broadly conforms to the economic orthodoxy on macroeconomic stability. 

A five- and ten-year view of India’s macrofiscal indicators highlights a clear structural shift after the mid-1990s, marked by lower inflation, higher investment, and improved growth outcomes. The FRBM period stands out as the most balanced macro regime. However, major shocks since 2008—particularly the COVID-19 pandemic—have resulted in persistently higher fiscal deficits and public debt, underscoring the importance of restoring fiscal space while protecting capital expenditure.

We get broadly similar conclusions from models with different specifications (lagged multivariate growth regression, structural break regression, and reduced-form VAR).

India’s growth experience shows that fiscal deficits support growth only in the short run and only when macro-credibility is intact. Sustained growth is driven far more by investment and macro-stability than by deficit expansion, while rising public debt increasingly constrains long-term growth.

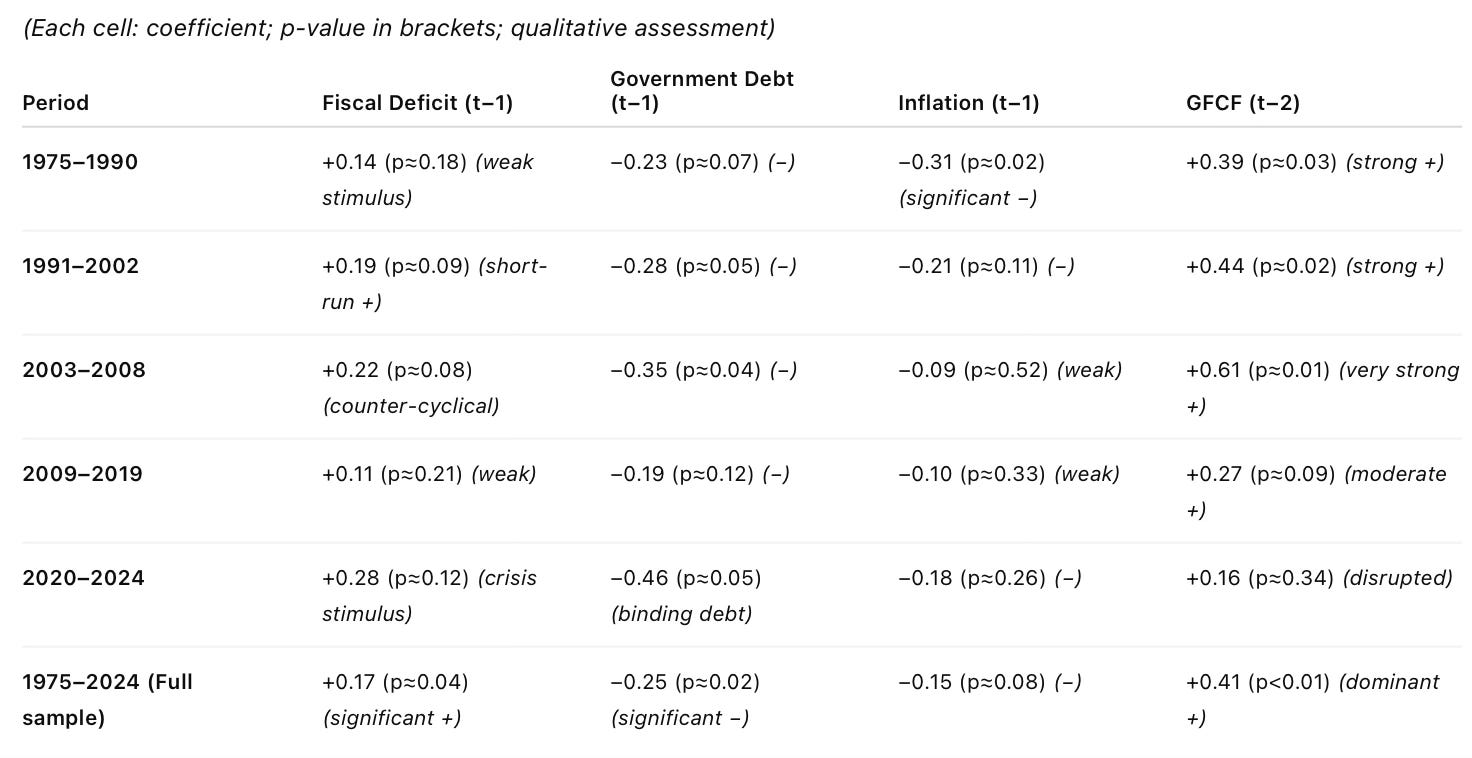
However, if we disaggregate the fifty years into identifiable macroeconomic regimes and perform lagged GDP growth regressions against each parameter separately, the shorter-term trends become less clear and regime-dependent. It provides some useful takeaways. 

There are some distinct takeaways. The strongest relationship is that between GFCF and growth. It holds in both short and long-run time frames. 

The short-run relationship with fiscal deficits is generally positive. However, the magnitude of this relationship depends on the regime. As can be expected, the three periods with the greatest perceived thrust on macroeconomic stability - post-liberalisation decade, FRBM era (2003-08), and post-Covid 19 years - are also associated with the highest positive impulse from fiscal deficits. 

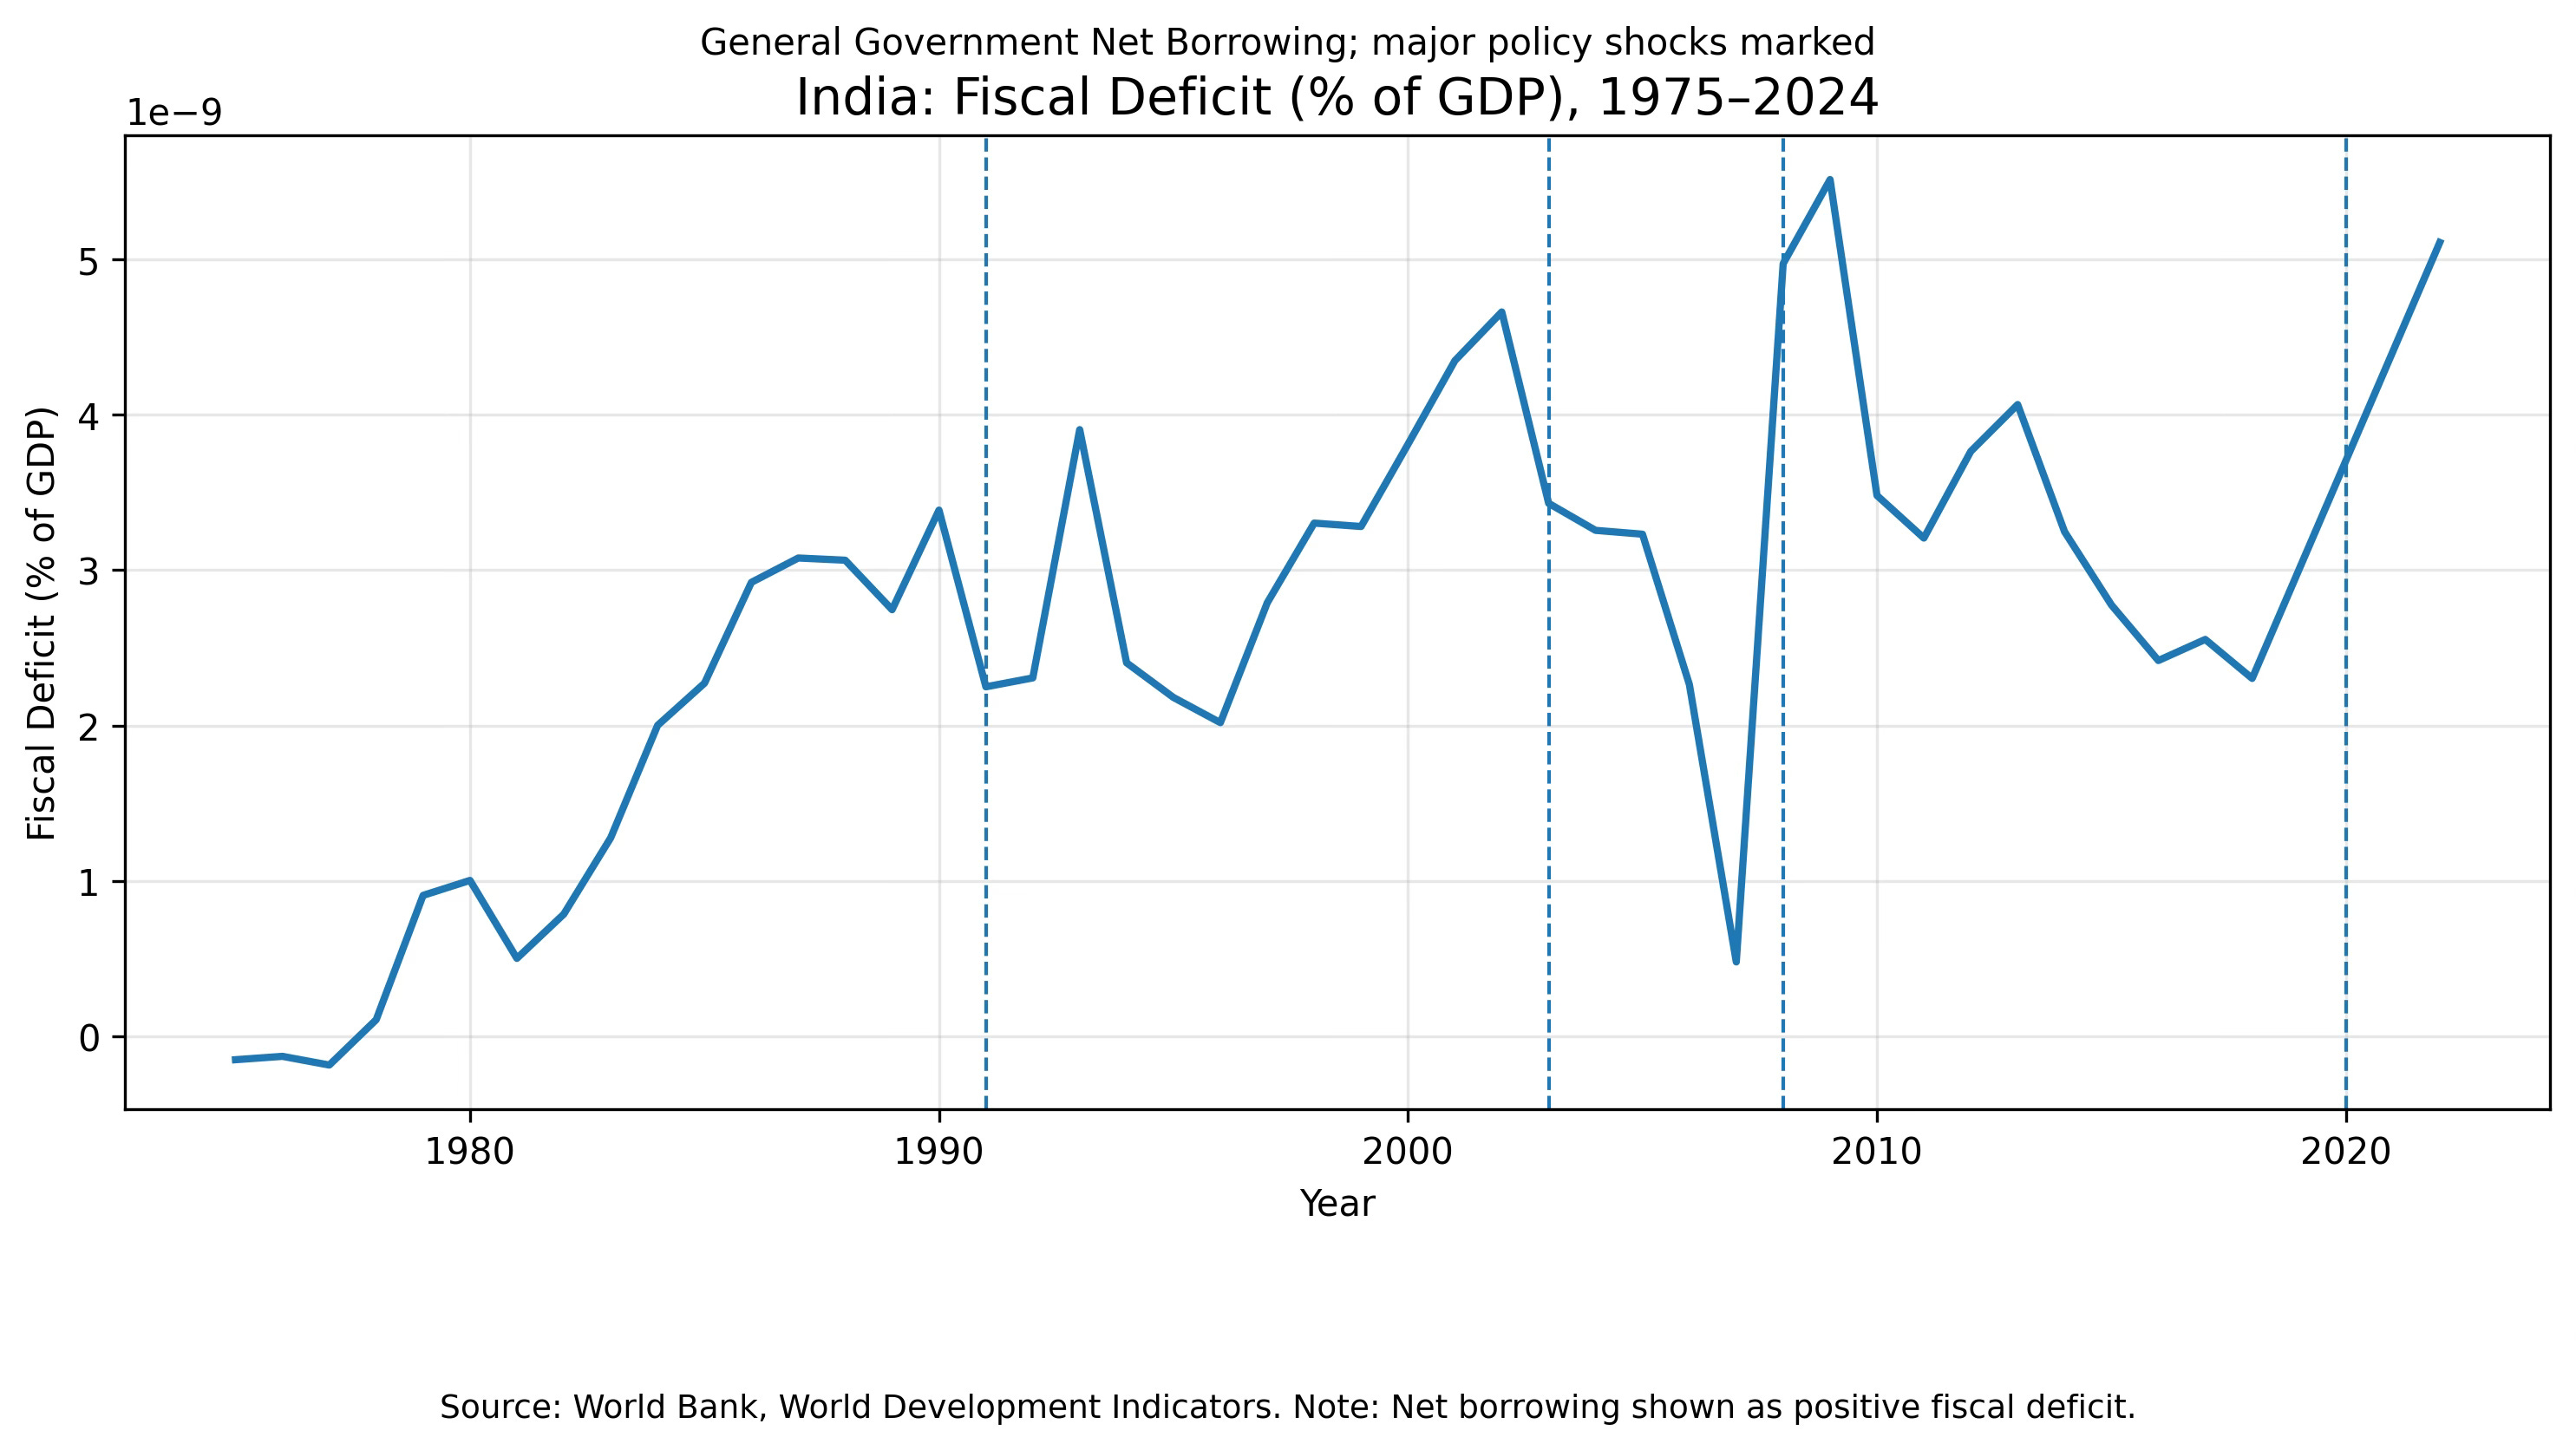
The trends on fiscal deficit show a distinct shift towards a higher deficit. Interestingly, though the post-pandemic period has had the highest deficits, it has also been associated with the highest economic growth rates. 

In fact, since 2010, the economy has shifted to a regime with fiscal deficits that are much above the 3% of GDP threshold. But it does not appear to have adversely impacted growth rates, nor market perceptions. An obvious reason is the quality of fiscal deficits, which have shifted sharply towards capital expenditures. 

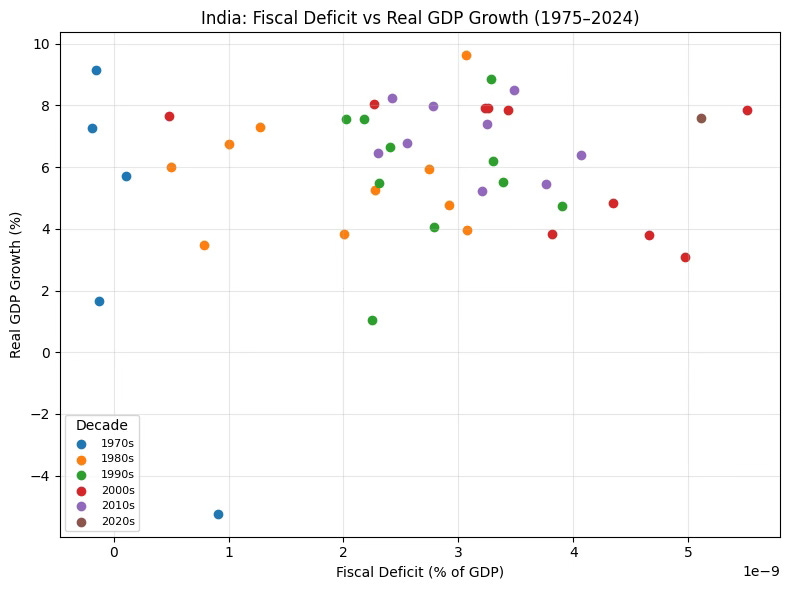
Overall, as the graphic below shows, there’s a very weak correlation between growth and fiscal deficit. At least, there’s nothing to suggest a fiscal deficit threshold around 3% of GDP. 

Since around 1995, successive governments in India have generally exercised fiscal prudence in terms of the public debt to GDP ratio being range-bound in the 45-50% range. However, unlike fiscal deficit, there’s a strong inverse correlation between the stock of public debt and GDP growth rates. Therefore, the rise in the public debt ratio in the post-pandemic period should be a matter of concern. When the state government debt is added, the gross public debt is inching towards 100%, easily the highest among all major developing countries. 

Similar to fiscal deficit, inflation higher than the target rates has been found to co-exist with high growth rates. There’s little relationship between an inflation rate of 2%, or even 4%, and GDP growth rates. In general, inflation effects tend to weaken once macro stability is achieved. 

Over the last decade, India has significantly improved its economic attractiveness. This has come about through a combination of political stability, large infrastructure investments, expansion in the IT services market (GCCs), the emergence of e-commerce and startups with the resultant job creation, gradual but consistent pursuit of economic reforms, interspersed with some critical reforms, and generally good macroeconomic governance through fiscal discipline, quality of public expenditures, and transparency. It has also helped that the country has been growing at steady high rates, and has emerged as the fourth biggest economy in the world and is one of the few big growth markets. 

All this has provided the fiscal credibility to run a higher level of deficits. In fact, the Indian economy has benefited from the free lunch of an additional 2-3 percentage points of GDP of fiscal space for the last decade or so, which was unavailable in the FRBM-constrained regime. This fiscal boost has been central to the high growth rates of recent years. 

This is a good case study for at least two reasons. One, while such quantitative targets do play a fiscal disciplining role, there’s nothing sacrosanct or objective about arbitrarily defined thresholds. In fact, a rigid adherence to such targets is counter-productive and growth-squeezing. Second, in a world where these targets have become accepted norms, market perceptions about reform commitment and fiscal prudence can significantly expand the fiscal space available for governments. Market credibility provides the flexibility for fiscal expansion. 

So what does this all say? Here is the summary from ChatGPT

Over the last five decades, India’s growth experience shows no stable linear relationship between fiscal deficits and growth. Periods of high growth have occurred under both fiscal expansion and consolidation. Inflation control appears growth-enhancing primarily in high-inflation regimes, while capital formation is largely pro-cyclical. The results underscore that fiscal quality, institutional credibility, and macro stability matter more than headline fiscal aggregates.

A major macroeconomic challenge for India going forward will be the management of its fiscal balance. It must pursue fiscal consolidation to significantly reduce its current high flows and stock of debt, while also significantly raising GFCF. And it must do all these at a time when private investment remains caught in a low equilibrium trap with no signs of a breakout, and when global headwinds are likely to squeeze capital inflows and export growth. This is especially daunting since, as the figures show, economic growth since the GFC, and more so since the pandemic, has been largely propped up by public investment, which is now hitting hard fiscal constraints.