I blogged here highlighting the nature of metropolitan growth.
Historically, metropolitan growth is characterised by separation of the geographies of residences and workplaces, facilitated by mass transit systems. Accordingly, all great cities are workplaces in the day. This is made possible by mass transit infrastructure that shrinks the commutes from the hinterland and expands the potential workforce for the metropolitan centre. This concentrates labour and talent and creates economies of scale, which creates the conditions for economic specialisation and innovation.
London is a great example of this phenomenon and it has been documented. Stephan Heblich, Stephen J Redding, and Daniel M Sturm have an excellent paper that demonstrates this trajectory of metropolitan growth using spatially disaggregated data for London from 1801-1921, spurred by the invention of the steam engine.
In counterfactuals, we find that removing the entire railway network reduces the population and the value of land and buildings in London by up to 51.5 and 53.3 percent respectively, and decreases net commuting into the historical center of London by more than 300,000 workers.
The figures below show the residential population trends for the City of London and Greater London, expressed as an index relative to its 1801 value. After being constant in the first half of the 19th century, the population of the City declined sharply by around 90% to 13,709 over 1851 to 1921, whereas that of the GL area rose from 2.69 million to 7.39 million. This trend is not confined to the City, but most central parts of GL.
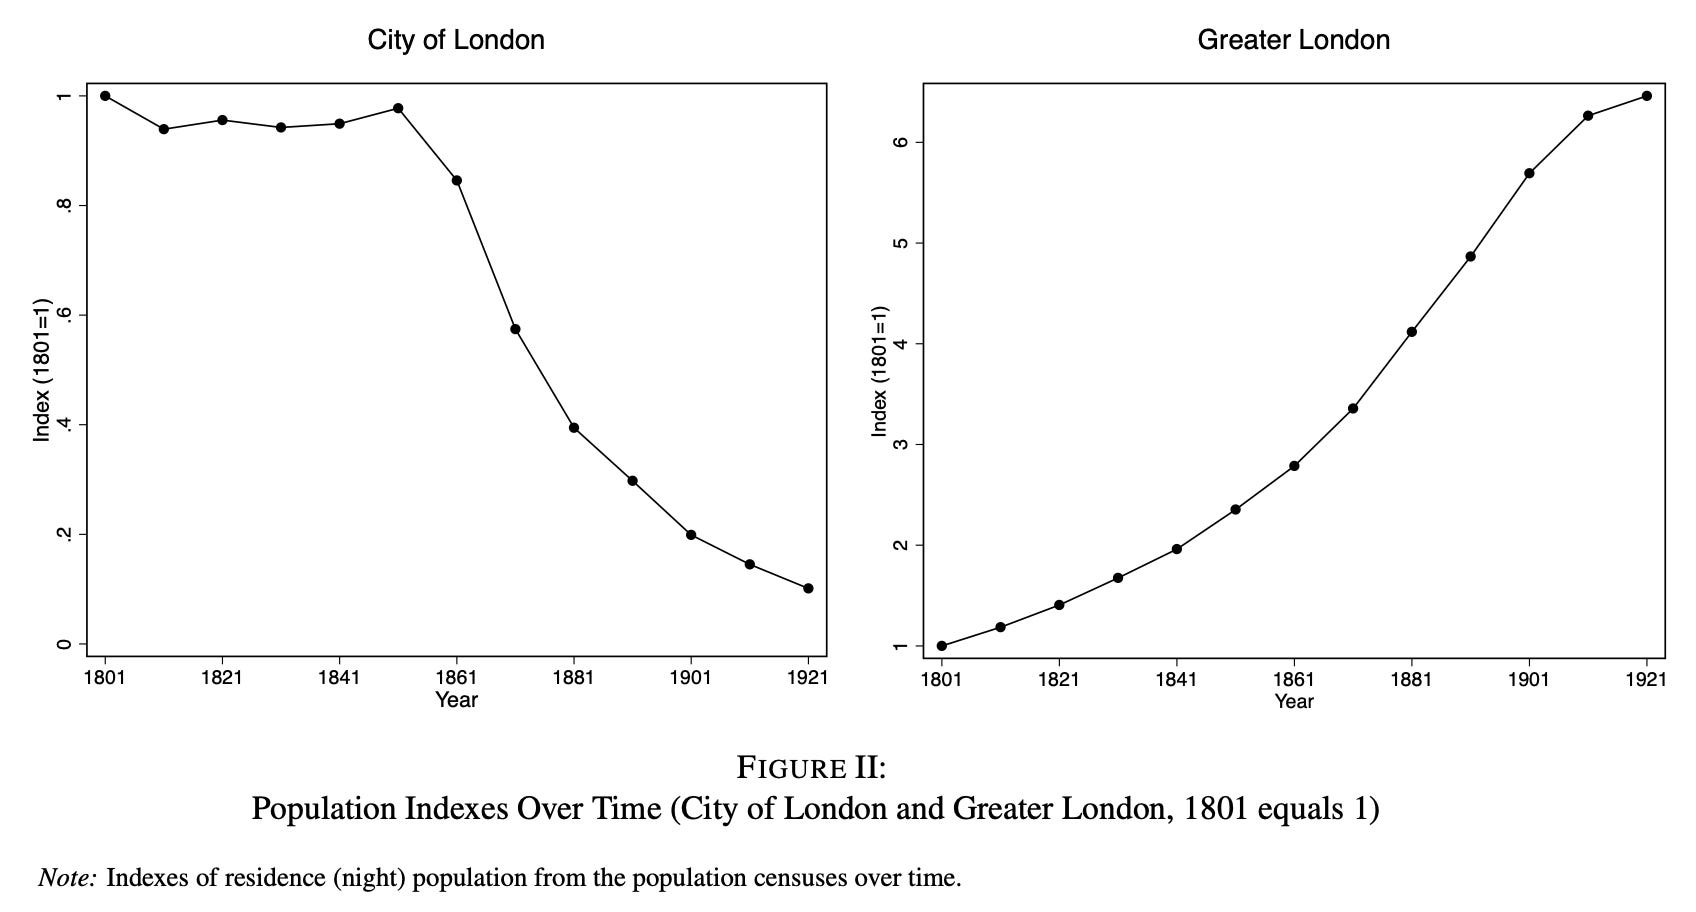
Following the arrival of the railway, we find a reduction in population growth relative to trend in parishes close to the center of Greater London, and an increase in population growth relative to trend in parishes further from the center of Greater London.
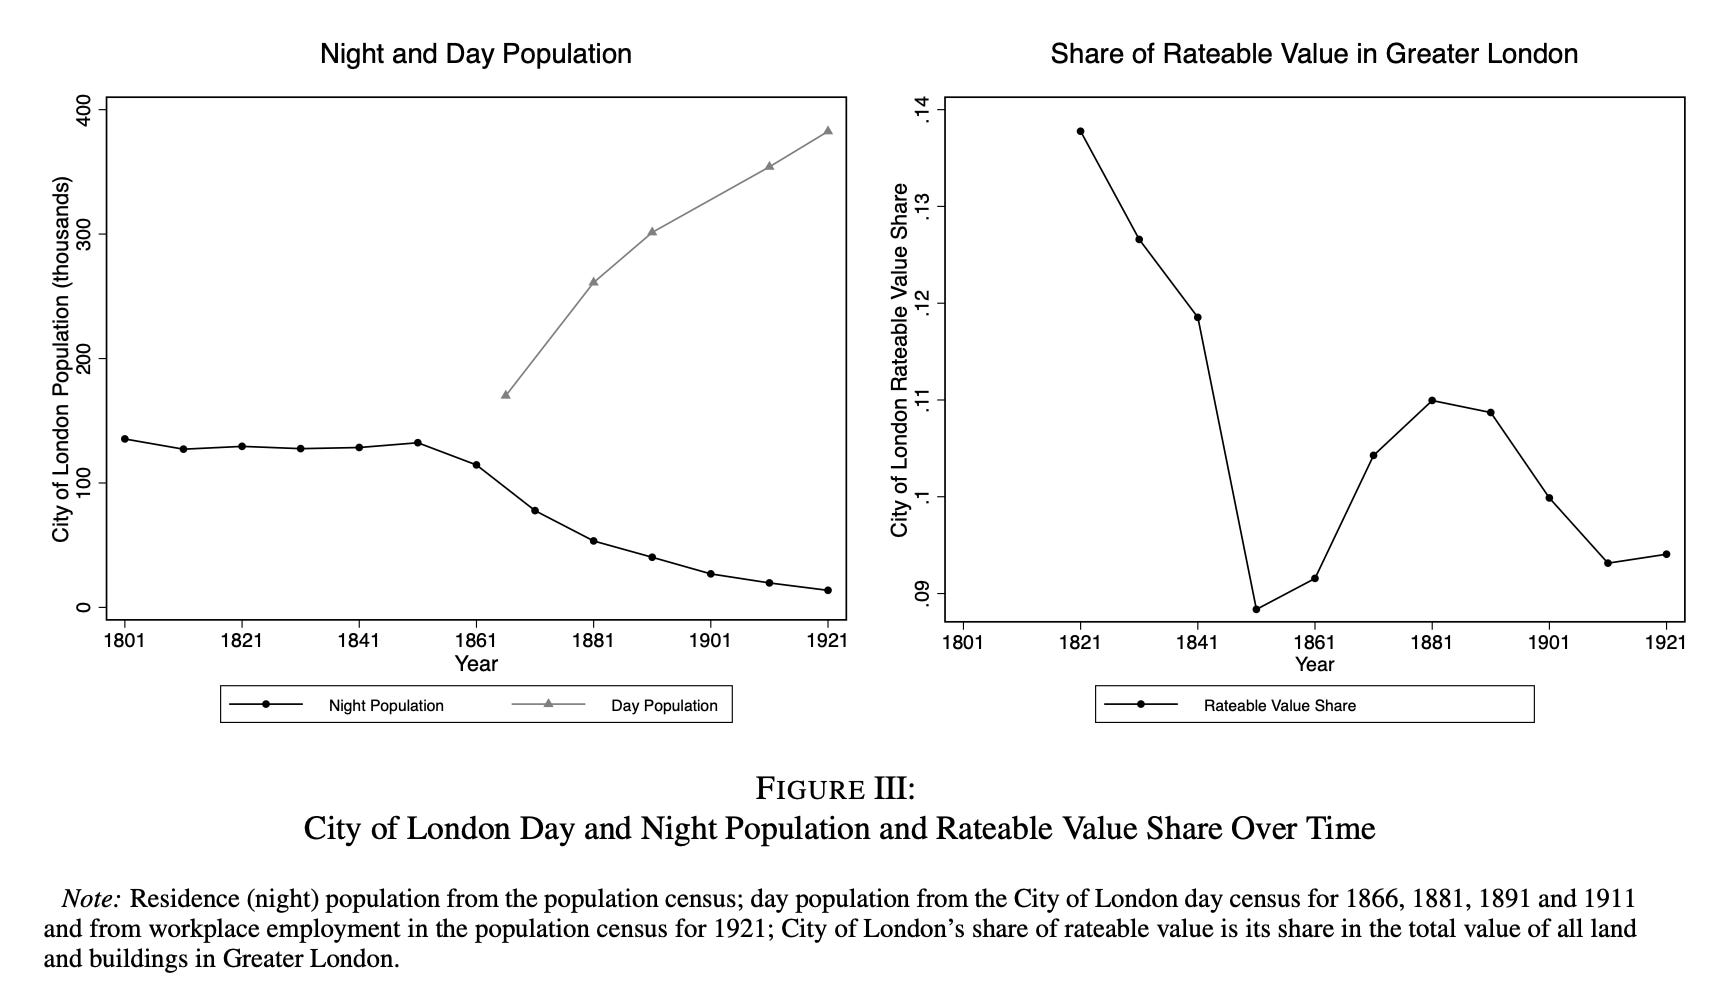
The graphic below shows the population trends in the City over day and night, with absolute numbers.
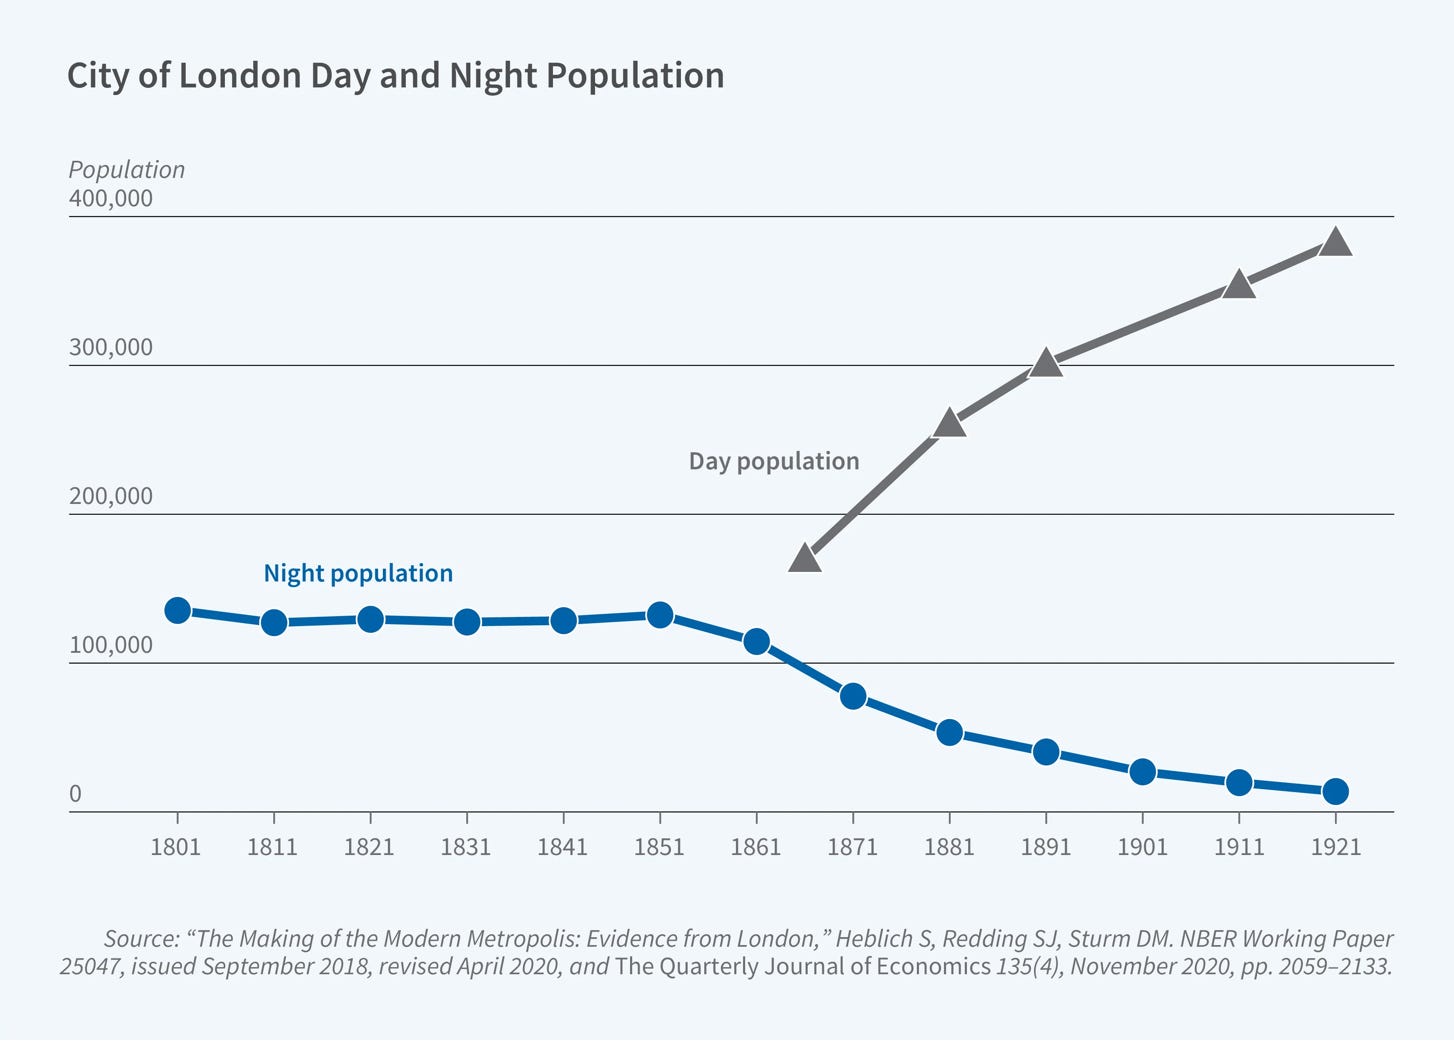
While the residential (night) population of the central city declined sharply, workplace (day) employment increased, reflecting a shift toward a commuting-based urban structure. Lower commuting costs allowed locations to specialize: High-productivity areas became centers of employment, while areas with better living conditions became residential. Transport therefore did not simply support urban growth. It changed the internal structure of cities. By decoupling production from residence, it allowed cities to expand spatially while maintaining high levels of economic concentration. This increased the scale at which agglomeration forces could operate, since firms could cluster in highly productive locations without being constrained by the need for workers to live nearby.
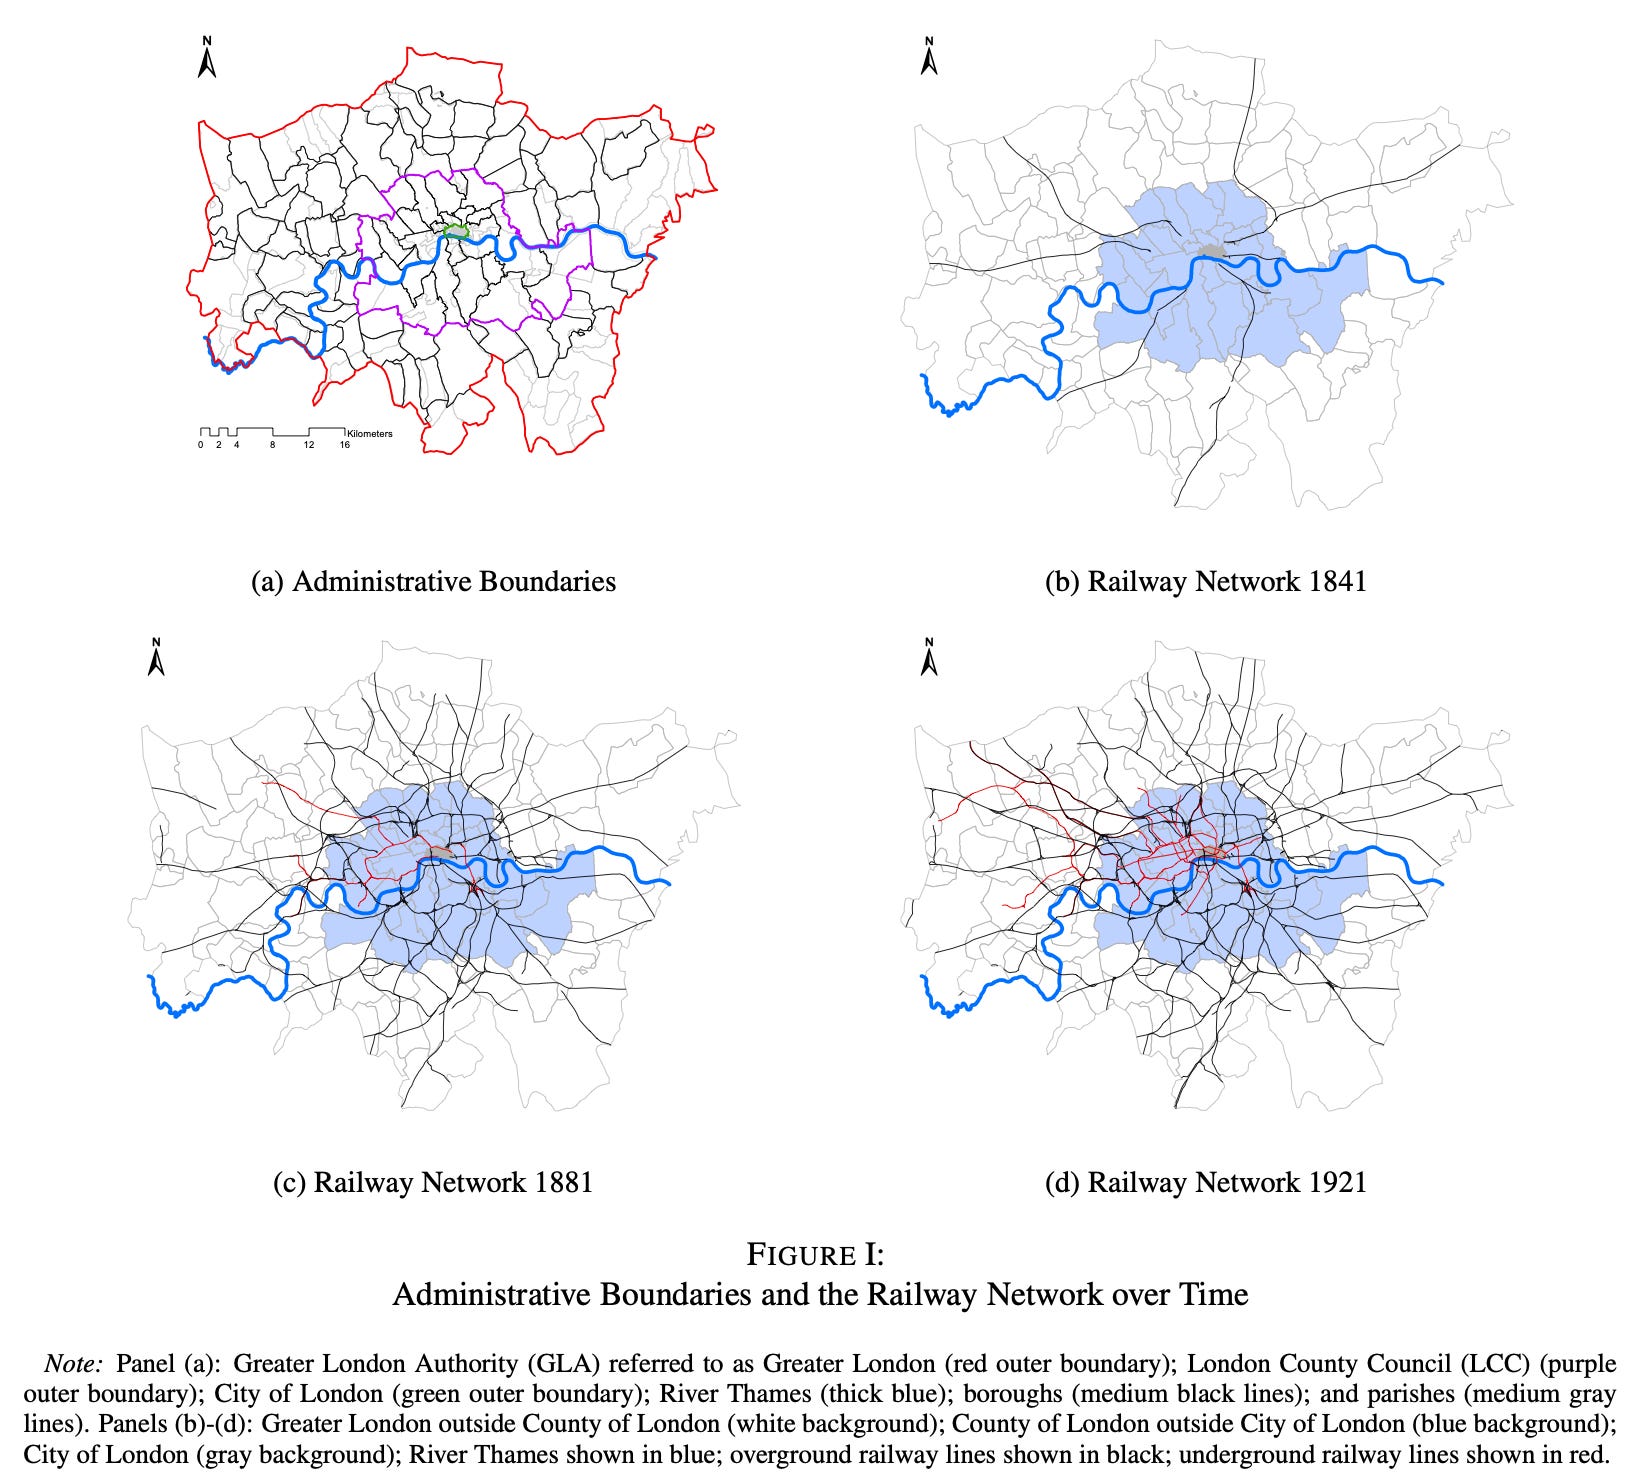
What triggered this trend was the expansion of the railway network after 1836. It facilitated the dispersion of population to the suburbs and a rapid increase in population for the metropolitan area as a whole.
Mass transit shrunk commute times between the City and other London boroughs. The graphic captures the reduction in travel time in terms of an index that is a population weighted sum of the bilateral travel time reductions (between the City and the boroughs).
Following the construction of the first railway in 1836, we observe a sharp reduction in the City of London’s population-weighted average travel times to other boroughs, which is followed shortly thereafter by the precipitous decline in its population discussed above. Although the decline in population-weighted average travel times slightly leads the decline in the City’s of London’s population, both follow a similar trajectory, with their rates of decline slowing towards the end of the 19th century and beginning of the 20th century.
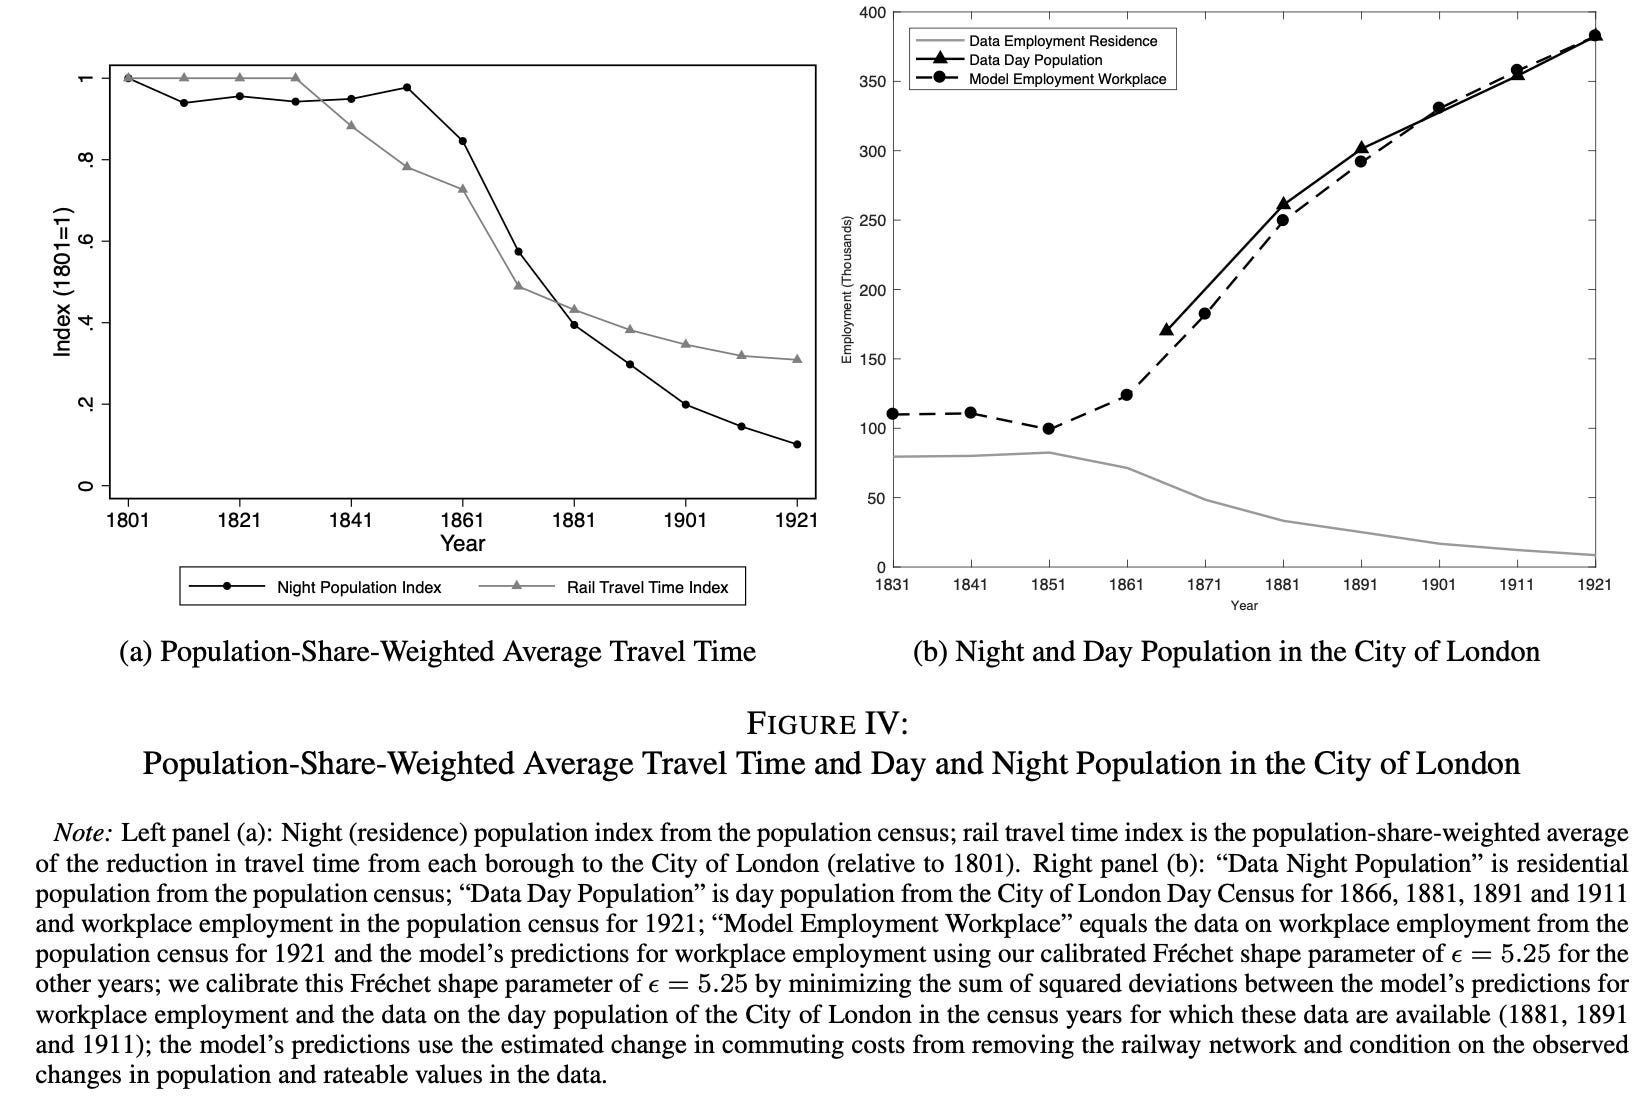
This allowed City of London to specialise as a workplace, and attract commuters from the hinterland to work there.
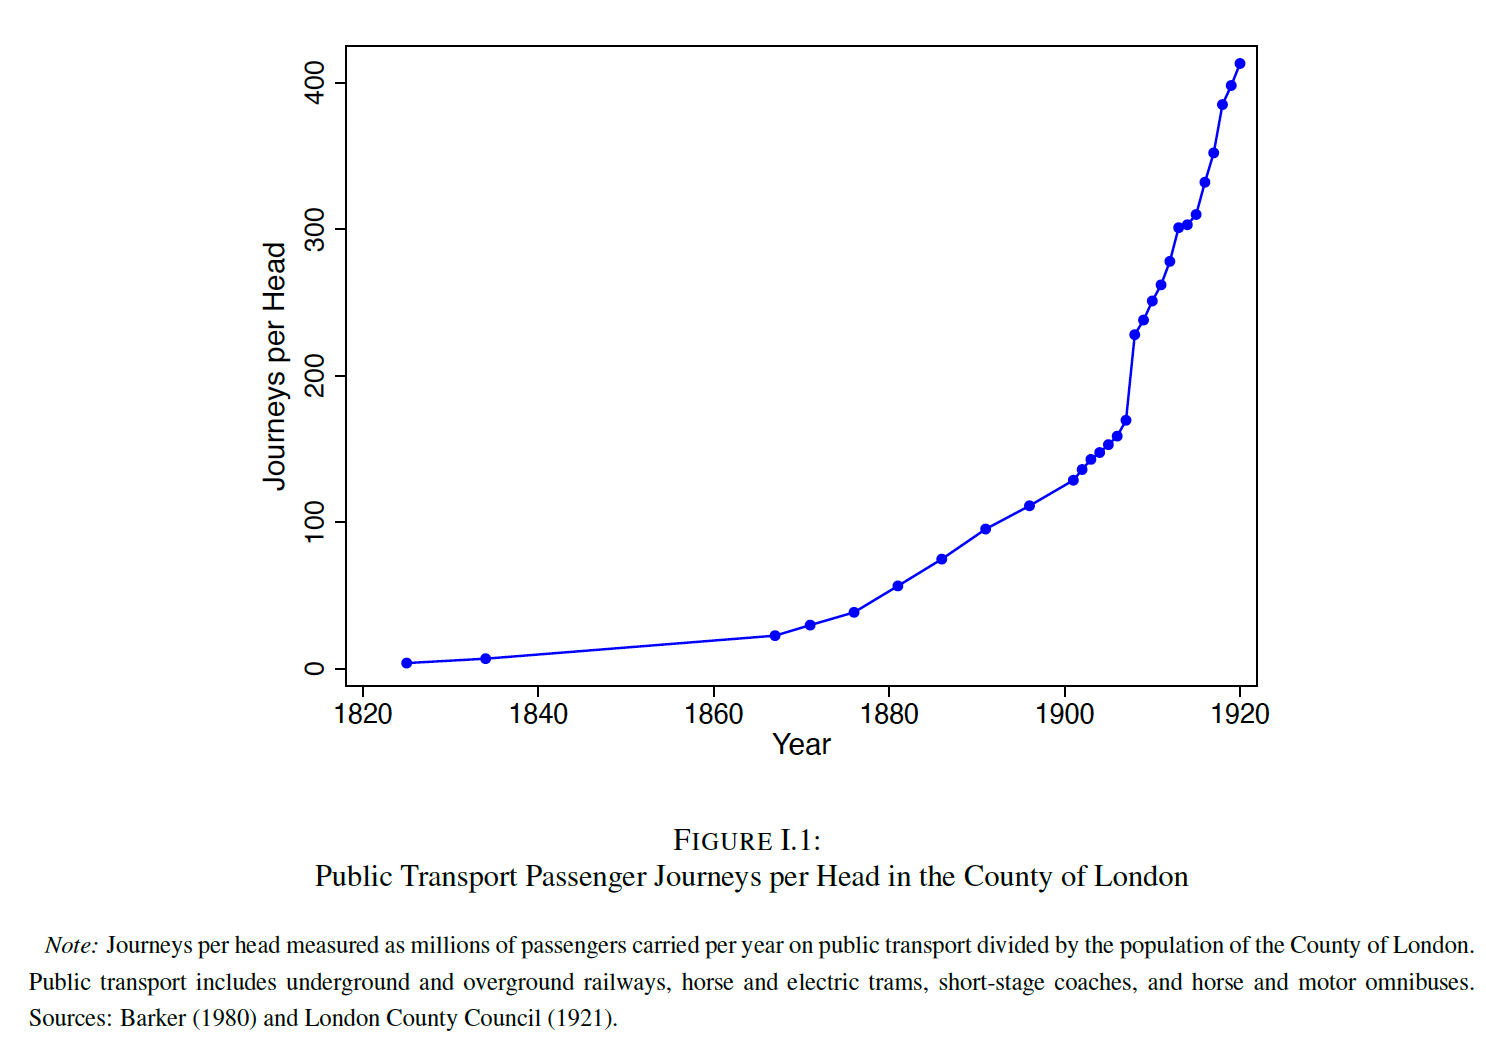
Consistent with the City of London increasingly specializing as a workplace, we find that the steep decline in its night population from 1851 onwards coincides with a sharp rise in its day population. This evidence of an increasing specialization of locations as either workplaces or residences is also consistent with a sharp rise in public transport journeys per head of population from around 7 in 1834 to just under 400 in 1921.
This specialisation had its impact on the value of land and buildings, which manifests in the form of the City’s share of GL’s rateable value of developed land.
In the early-19th century, this share declines from around 14 to 9 percent, which is consistent with a geographical expansion in the built-up area of Greater London. As this expansion occurs, and undeveloped land becomes developed, the share of already-developed land in overall land values tends to fall, because the denominator of this share increases. In contrast to this pattern, in the years after 1851 when the City of London experiences the largest declines in its residential population, its rateable value share increases from 9 to 11 percent. Finally, in the decades at the end of the 19th century, the pattern of a decline in this rateable value share again reasserts itself, consistent with the continuing geographical expansion in the built-up area of Greater London. Therefore, the change in the City of London’s pattern of specialization in the decades immediately after 1851 increases the relative value of this location.
The online appendix to the paper by Heblich et al documents strikingly similar trend of urban development in Paris, Berlin, Boston, Chicago, New York, and Philadelphia over the same period (1800-1921).
I want to qualify this story given the evidence we have from developing country cities. There are perhaps three big differences in the metropolitan development trajectories of the Western and developing world cities. The first is that in the latter the mass transit systems generally followed the development of urban settlements. This is unlike the former where, as we have seen, mass transit shaped the form of urban development. The second is that the residents of the latter cities now have access to the option of car commutes, a choice unavailable for the suburban residents in the Western cities in the 19th and early 20th centuries.
The third is that the Western cities built their mass transit when their regulatory regimes (zoning, building codes, and land-use planning) were themselves being invented so that the two co-evolved. In contrast, developing world cities are encumbered with fossilised regulatory regimes whose change requires overcoming political-economic lock-in that Western cities did not face during their development phase.
The three factors together make the retrofitting problem harder - transit comes after the form, cars offer an alternative, and the regulatory apparatus is sticky.
It is probable that such cities could remain entrapped in a model of metropolitan growth characterised by suburban sprawl revolving around car-commutes, unaffordable housing, and traffic congestion. Further, the last two have a self-reinforcing nature - increasing unaffordability expands the sprawl, increases vehicle density on the road (both in numbers and time spent on the road). This equilibrium erodes the productivity and competitiveness of the urban agglomeration and sets the stage for its gradual decline. This is apparent in the lived realities of metropolitan cities across the developing world.
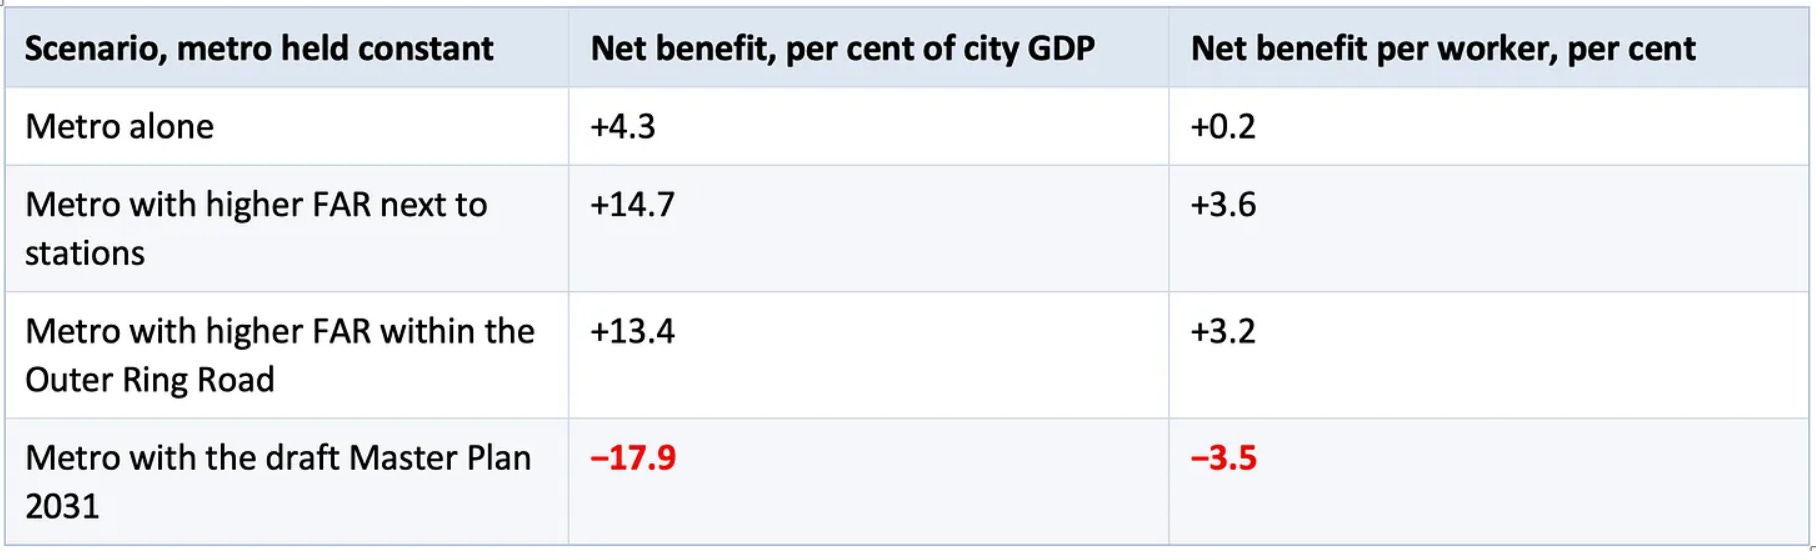
The best research evidence so far in this regard comes from the study by Liming Chen, Rana Hasan, Yi Jiang, and Andrii Parkhomenko (and here) on the impact of the opening of the Bangalore metro in 2011. They show that in a regime of low building heights, while the metro increases citywide output and welfare, those gains are several times larger with transit-oriented development (TOD). Using a quantitative spatial model calibrated to Bengaluru, they show the same metro can produce a 32 percentage point spread depending on the planning regime. The bigger takeaway is that mass transit with a bad planning regime produces a worser outcome than without mass transit.
In their comprehensive survey of mass transit, World Bank economists Hiroaki Suzuki, Robert Cervero, and Kanako Iuchishow that transit systems whose returns were disappointing almost always lacked integrated land-use regimes, while those that performed best (Hong Kong, Singapore, Curitiba, Tokyo) treated transit and land use as a single planning object.
The takeaway is stark and simple - regulatory norms are what converts transit accessibility into measurable urban-form outcomes, and without it, the accessibility exists but the form does not change.
So, in these developing country cities where the urban form is already laid out, and where the convenience of car commutes can often trump, what can be done?
The only option is to retrofit pre-existing neighbourhoods, and make mass transit commutes attractive both in terms of convenience and cost. In these contexts, it is essential for mass transit facilities to be complemented with urban planning norms that encourages the concentration of incremental development around the stations and also incentivises the redevelopment of the station surroundings. This is the case for TOD and is critical to discourage the use of cars and choose mass transit for work commutes.
So, what are the successful examples of retrofitting?
In 1979, Curitiba introduced Bus Rapid Transit (BRT) with zoning relaxation only along the BRT corridors (“structural axes”), with density tapering sharply away from it. The result is that after 50 years, Curitiba has the highest transit mode share of any Latin American city, and the structural axes are visibly the densest and most economically dynamic parts of the city.
Another example of retrofitting is that of Arlington County in the Washington metropolitan area which after the Orange Line was built in 1979 upzoned the five stations along the Rosslyn-Ballston corridor to high-density commercial and mixed-use, while preserving single-family character immediately beyond the station catchments. Today the corridor hosts over 50,000 jobs and over 40,000 residents within half a mile of the stations, generates roughly half of the County’s property tax revenue from 11% of its land, and ridership on the Orange Line is three times what was forecast.
Another example is that of Copenhagen which regulated and channelled post-war suburban growth along the S-train (commuter rail) corridors, keeping the spaces between the radiating lines (or fingers) as green wedges. The regulatory decision was made as the suburbs began forming and required active enforcement against sprawl. Today 70% of Copenhagen’s population lives within 1 km of an S-train or Metro station.
Other examples include Hong Kong’s “Rail + Property” model (where the MTR Corporation receives development rights at every new station and co-develops the station area with private partners), Seoul’s subway Line 2 which opened in 1980 (built through what was then farmland south of the Han river, and the Gangnam district was then zoned for high-density mixed-use development around every station), Shanghai’s Pudong area (the metro was built in parallel with the development of essentially a greenfield area east of the Huangpu, and the zoning placed Lujiazui’s financial district at a specific metro interchange), and London’s Docklands and the Jubilee Line extension from 1990s (which created dense developments at Canary Wharf, North Greenwich, and Stratford).
So, what for India?
I had blogged here pointing to three requirements - relaxing development control regulations around stations, right kind of value capture instruments and their sequencing, and an incentive compatible institutional architecture.
The third one is the most important, and can address the other two. It is about aligning the incentives between those constructing the transit system (and repaying the debt mobilised) and those responsible for the land use and other decisions that determine the commercial viability of the system. This is perhaps the hardest given India’s political economy and its less than satisfactory track record with such kind of coordination failure bridging reforms across sectors.
Incidentally, every one of the aforementioned examples of successful retrofitting of mass transit shares two institutional features. The first is a unified authority with jurisdiction over both transit and land use in the station catchment. The second is the presence of value capture mechanisms that let the transit entity benefit directly from land-value uplift. In the Indian metropolitan areas, the simplest solution would be make the urban development authorities own the metro or regional rail entities. Needless to say, it may also be the politically hardest.
In conclusion, the empirical evidence suggests that mass transit without the complementary planning regime and institutional structure that facilitates TOD actively produces worse outcomes than no transit at all, because it legitimises continued sprawl by appearing to offer a mobility solution while in fact raising car dependence.


No comments:
Post a Comment