The flight of foreign portfolio investors since October 2024, coupled with the declining net FDI, has sparked a debate on what should be done to attract and retain foreign capital to India. This has assumed greater significance given the stagnation in domestic savings at about 30% of GDP.
It is an accounting reality that if the economy has to sustain high growth rates, it must have the capital to support the high investment rates required. Domestic savings must therefore be supplemented with foreign capital. But how much can foreign capital contribute?
A recent op-ed argued that to achieve the Vikasit Bharat 2047 goal, which necessitates a 9% annual growth over the next two decades, India must strive to attract foreign capital in the range of 15% of GDP.
This may be an opportunity to step back and assess the realistic envelope of foreign capital that India can target. As an analytical framing, this would entail examining both the demand and supply sides for the different types of foreign capital available, India’s track record in attracting them, and then making a judgment.
What are good comparators of countries having successfully attracted significant foreign capital? What is the envelope of foreign capital that is looking to invest in markets like India? What’s the level of capital that India can absorb without engendering too many distortions? Based on all these, what is the realistic foreign capital target for India?
India’s net FDI inflows from foreign investors as a % of GDP have shown a continuous decline since 2020.
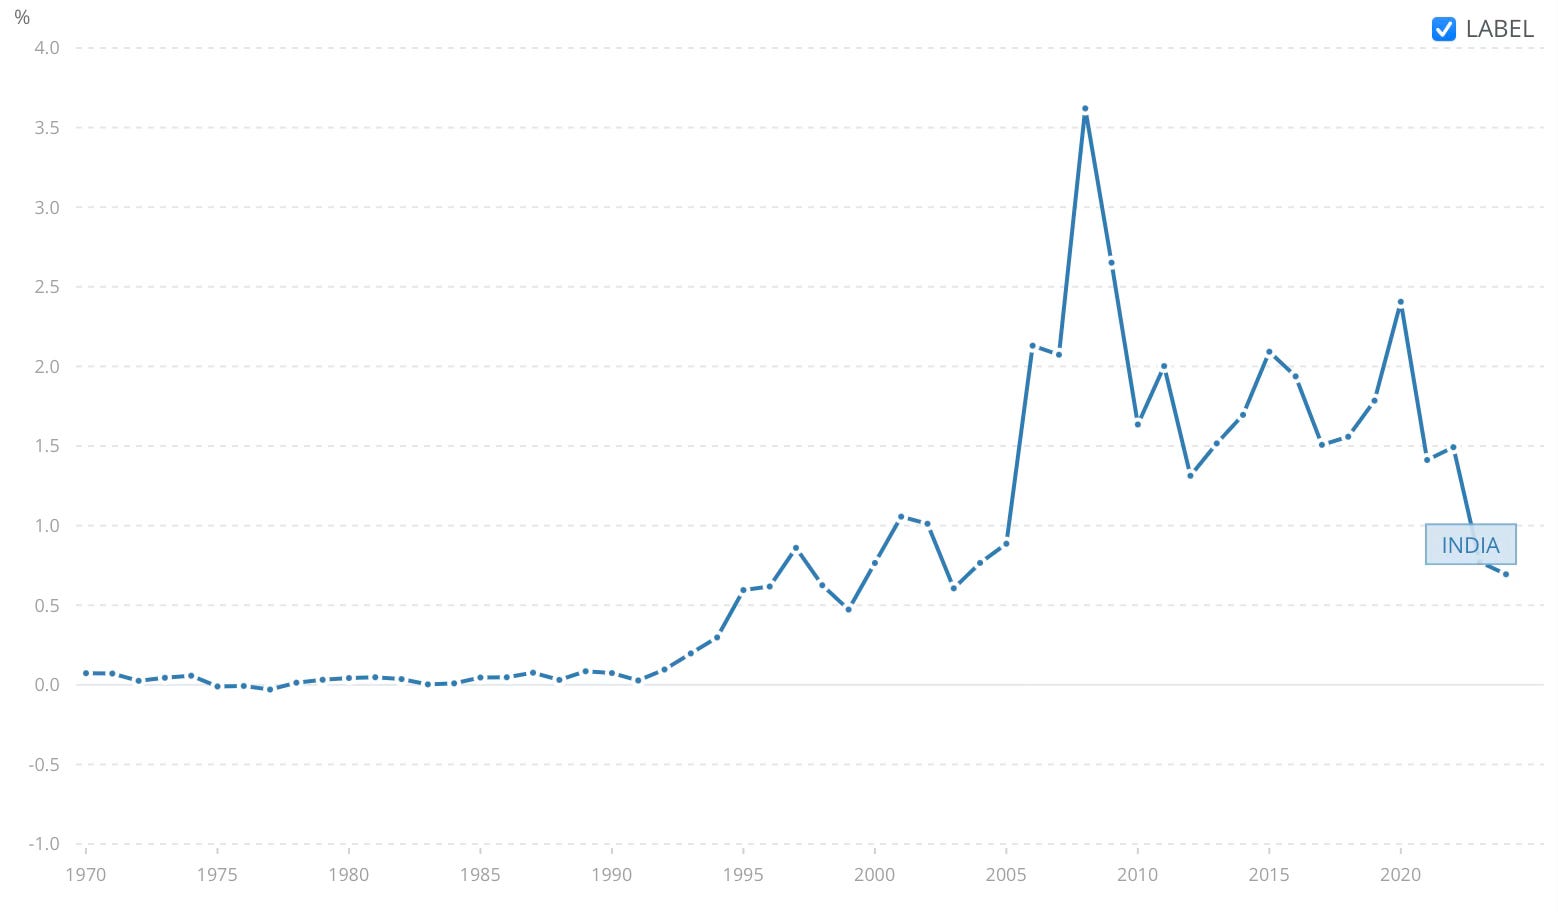
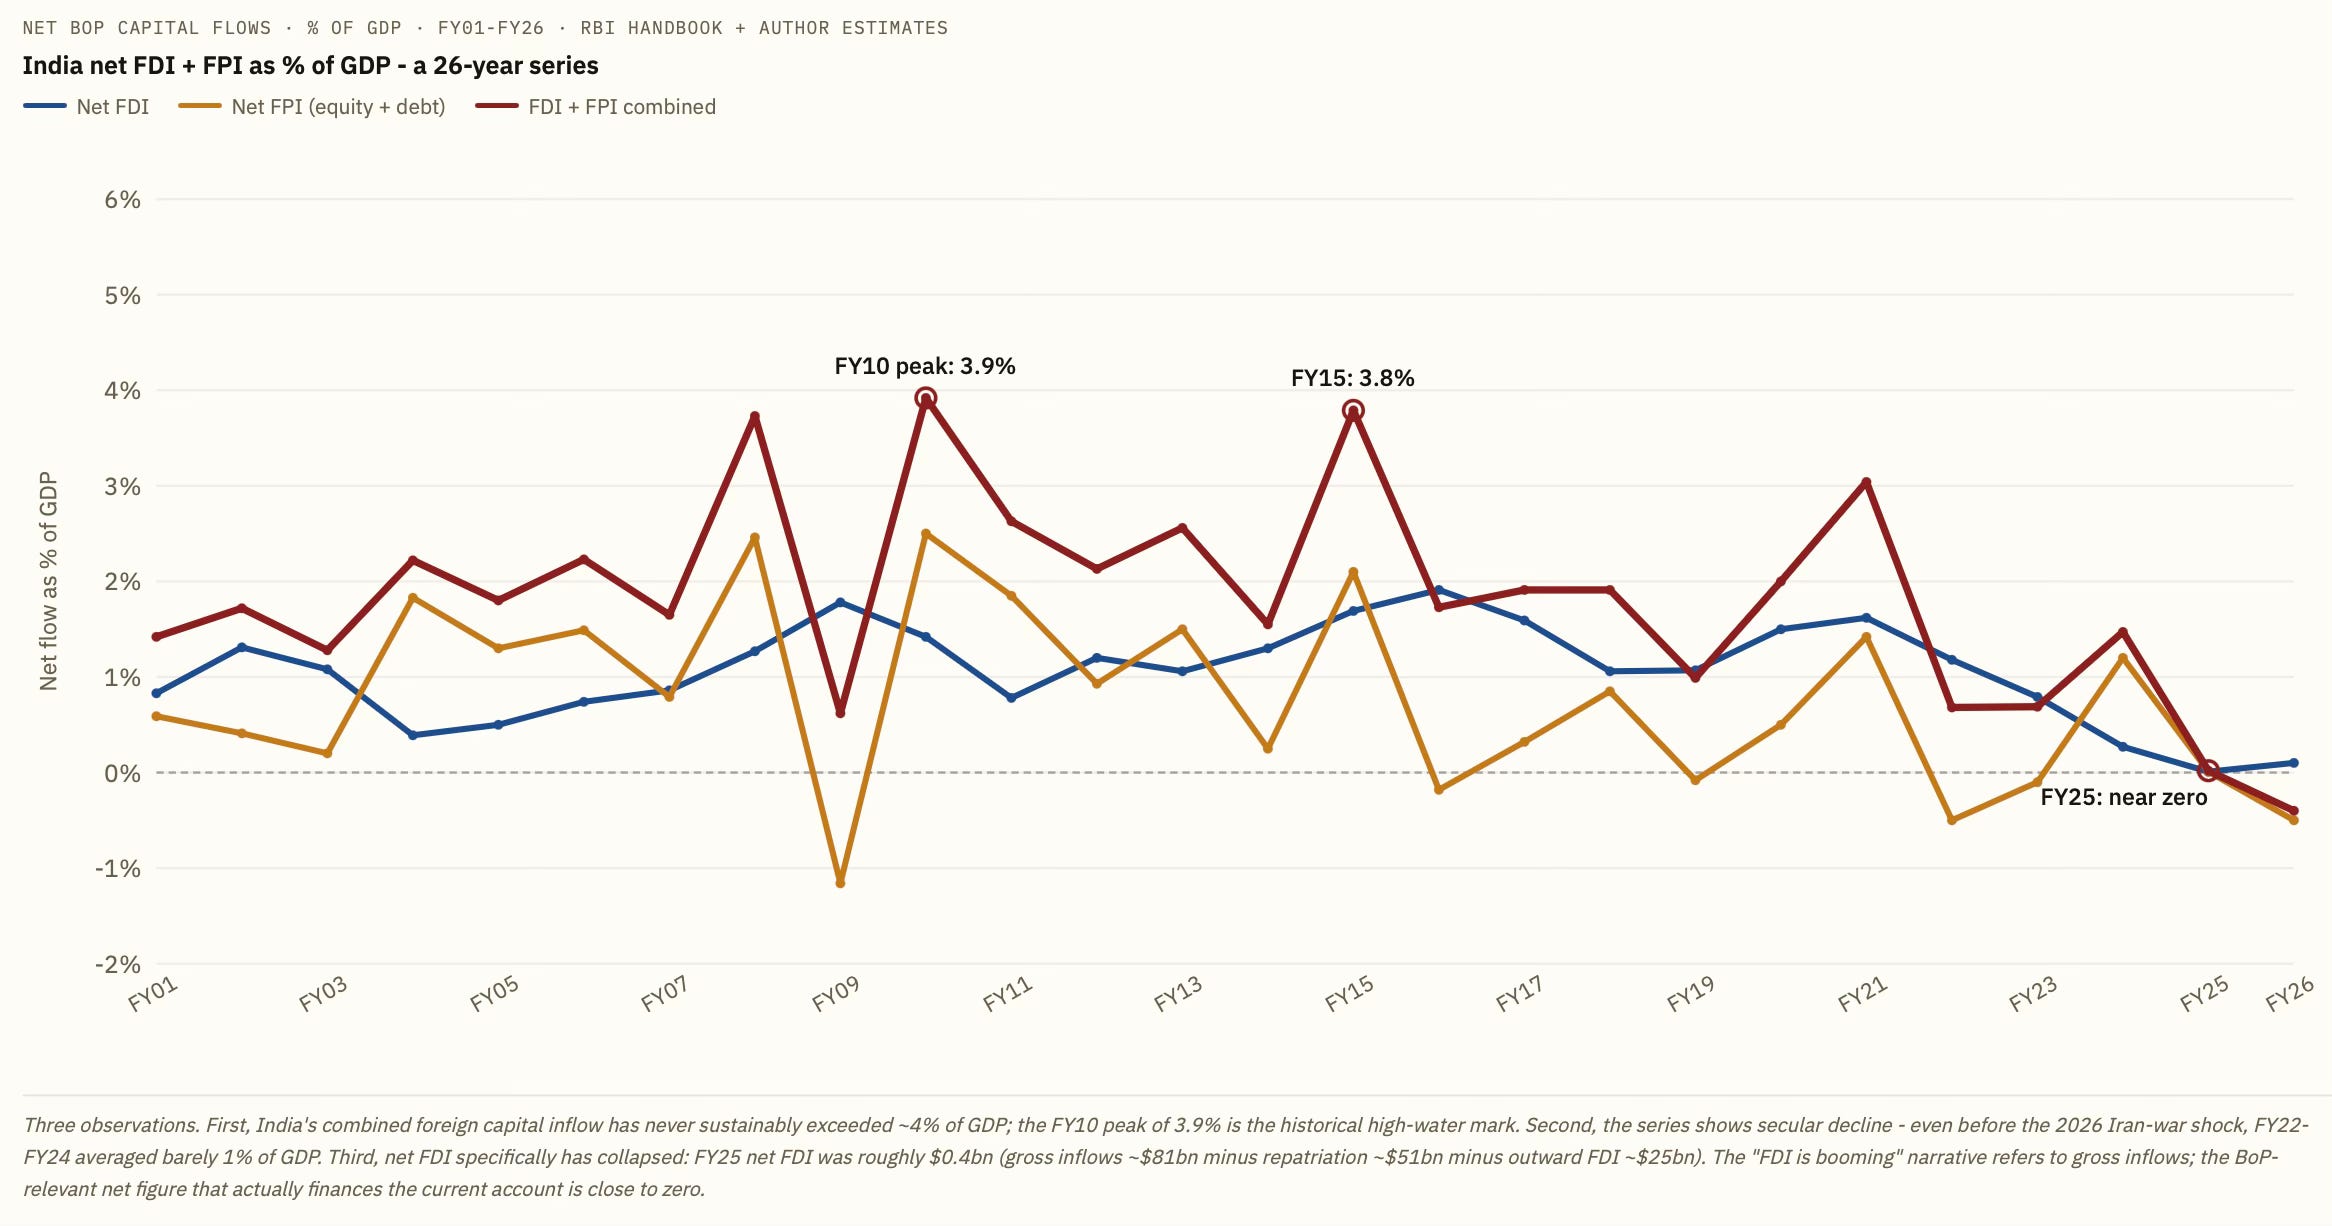
Taken together, net FPI and FDI as a share of GDP have never exceeded 4%, have been declining since the pandemic, and have been negative over the last two years. (All graphics below generated using ClaudeAI).
The highest FDI share of GDP was 3.6% in 2008, which has been more of an outlier since it has struggled to cross 2% in recent years.
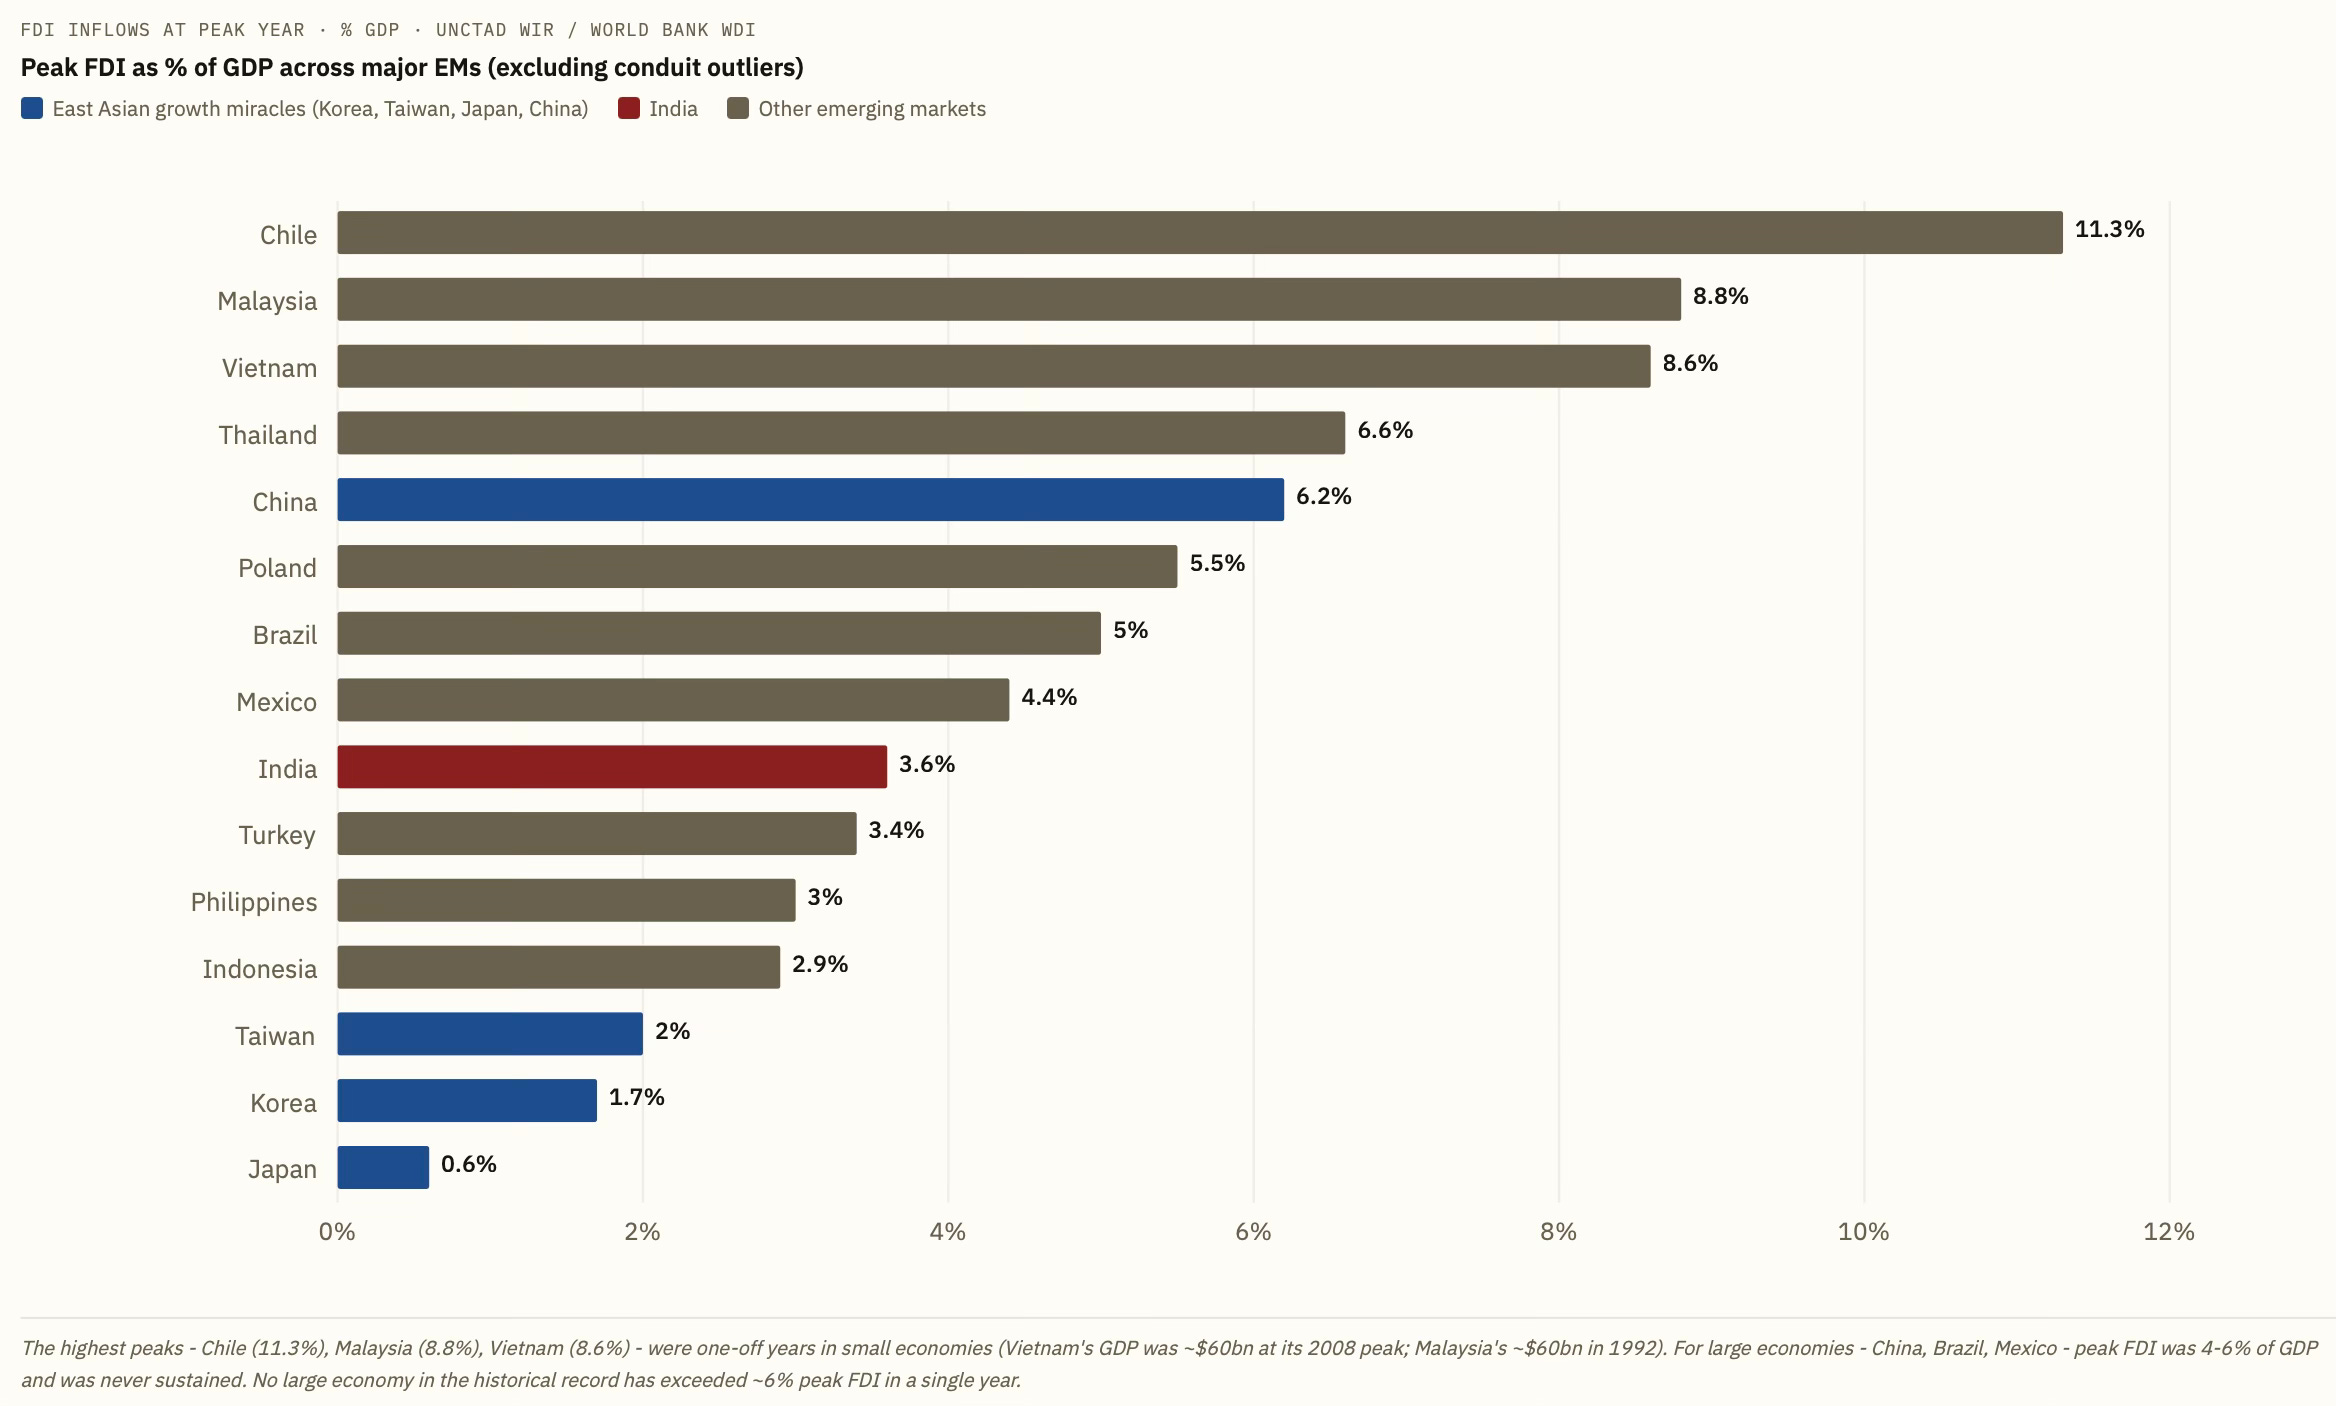
One important thing to keep in mind is that none of the bigger economies have managed to sustain FDI beyond 3% of GDP for long periods. India’s sustained 10-year average has been 1.5% of GDP. Even sustaining it at 2% will be a challenge, leave aside 3% and above.
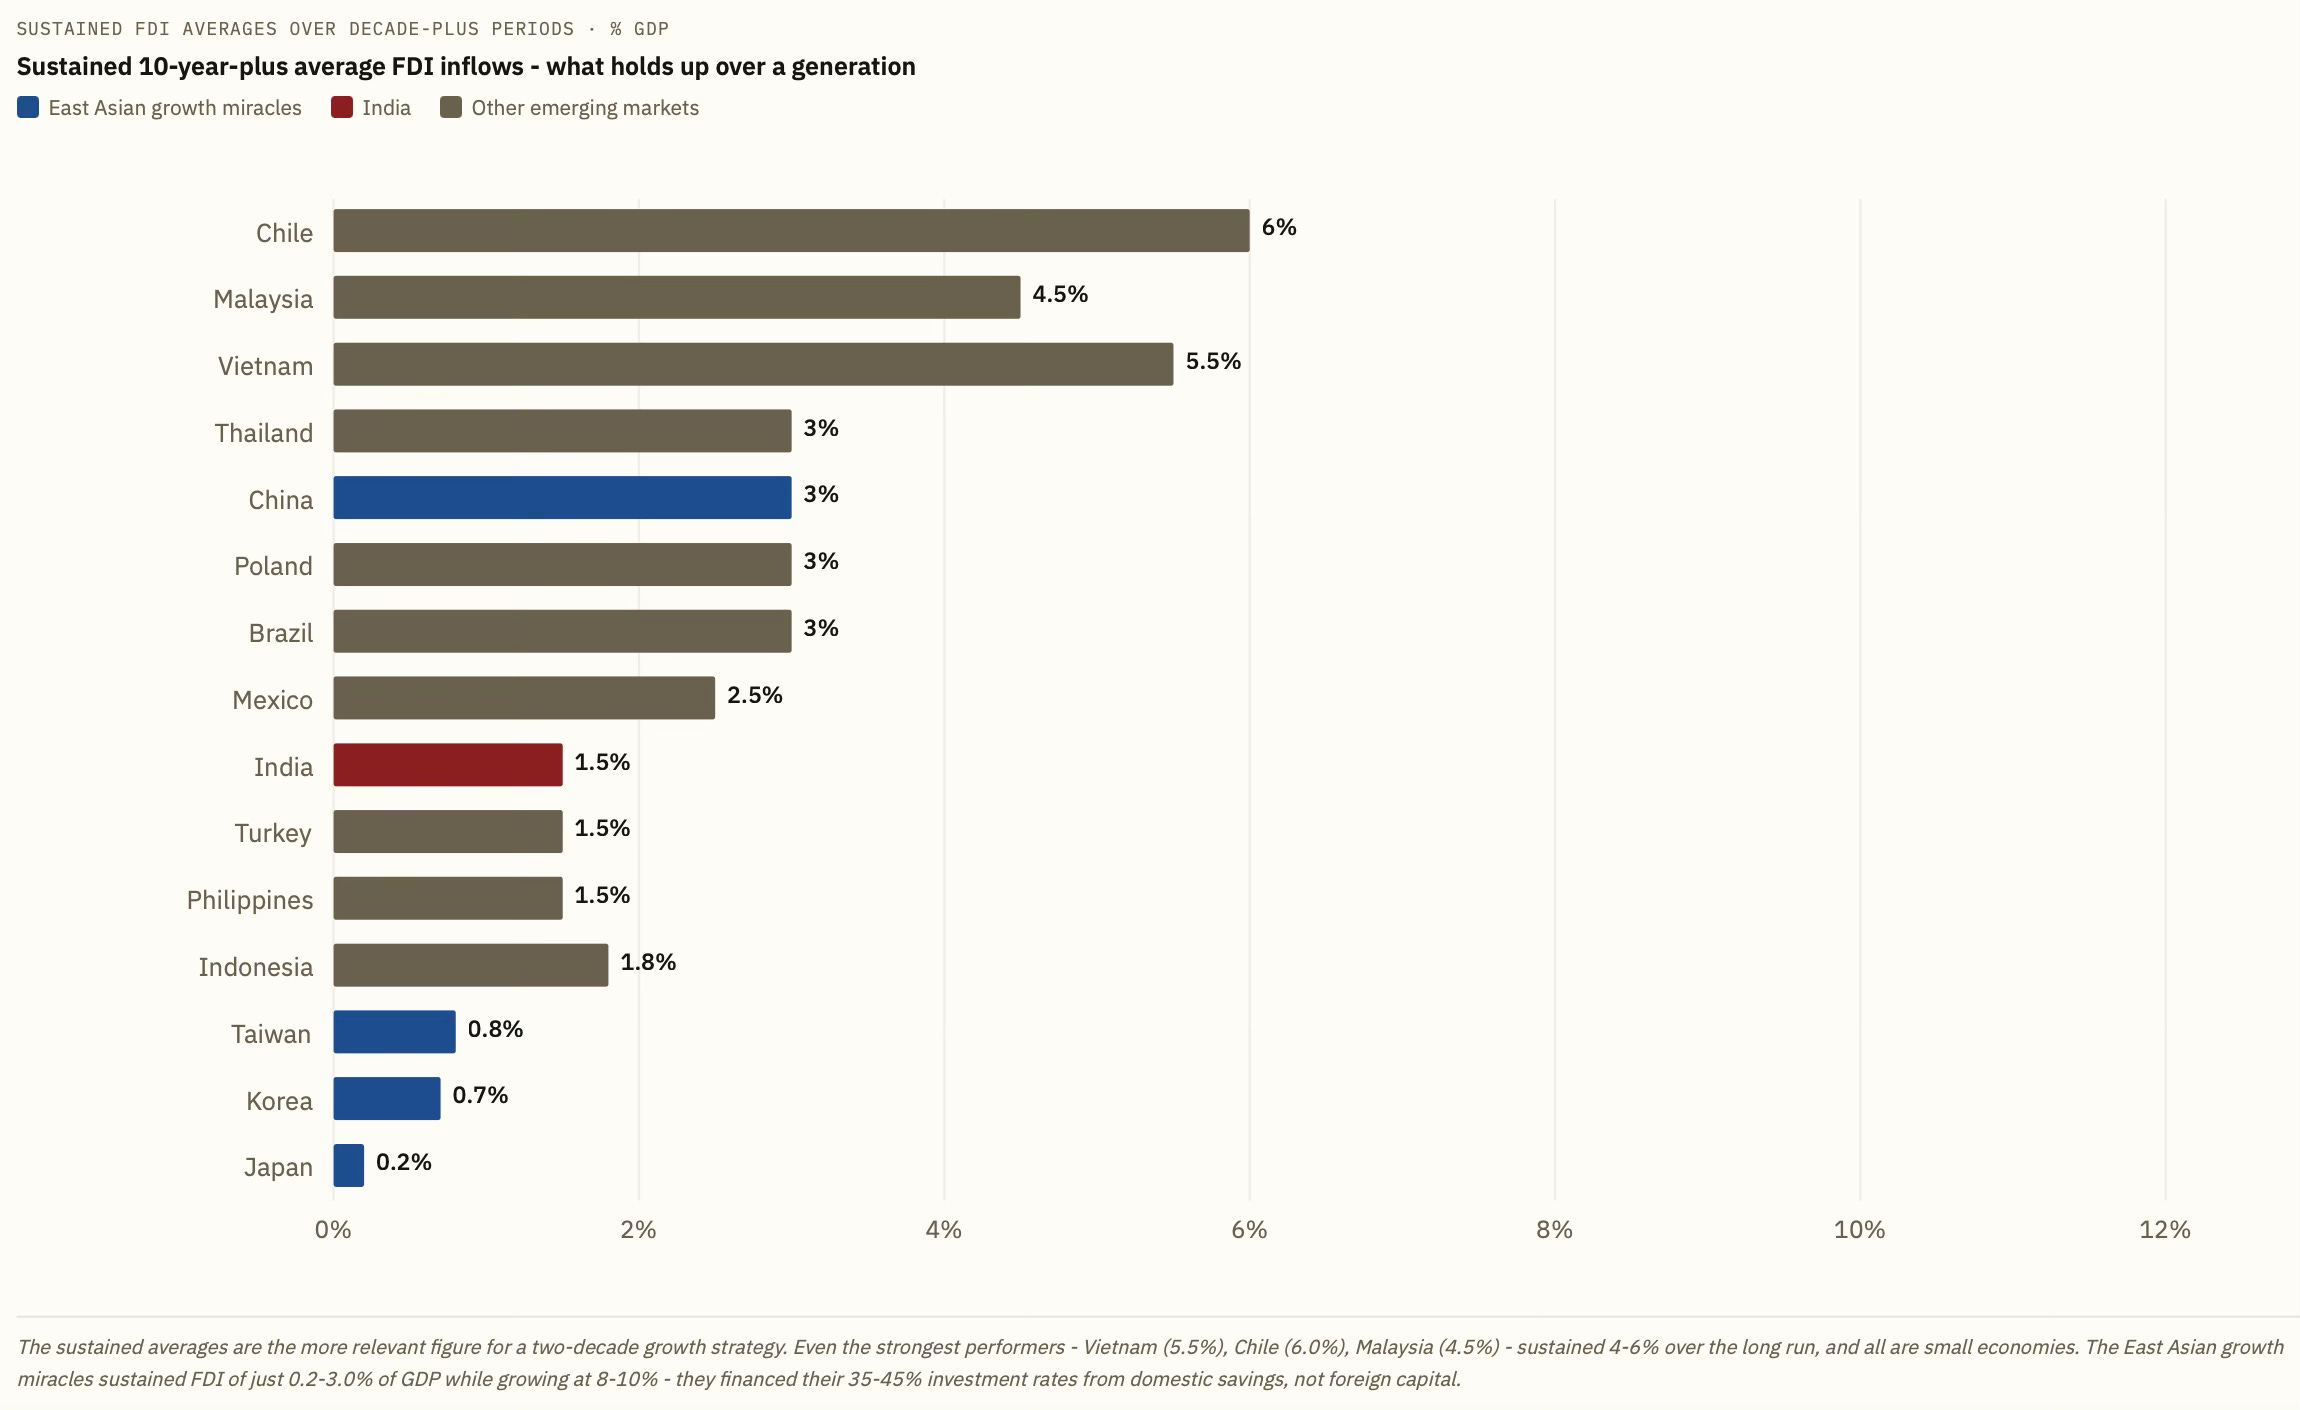
It is to be noted that the northeast Asian economies did not grow by importing foreign capital. South Korea grew at 8-9% for three decades with sustained FDI of about 0.7% of GDP; Taiwan, with 0.8%; Japan, with 0.2%; China, in its 1990-2010 peak-growth period, averaged ~3%. All four built investment rates of 35-50% of GDP through extraordinarily high domestic savings. The important takeaway is that, for sustained growth in a large economy, foreign capital has historically been a marginal supplement, and high growth has been delivered by domestic savings. Another important factor, which we shall discuss in detail later, has been their high investment efficiency.
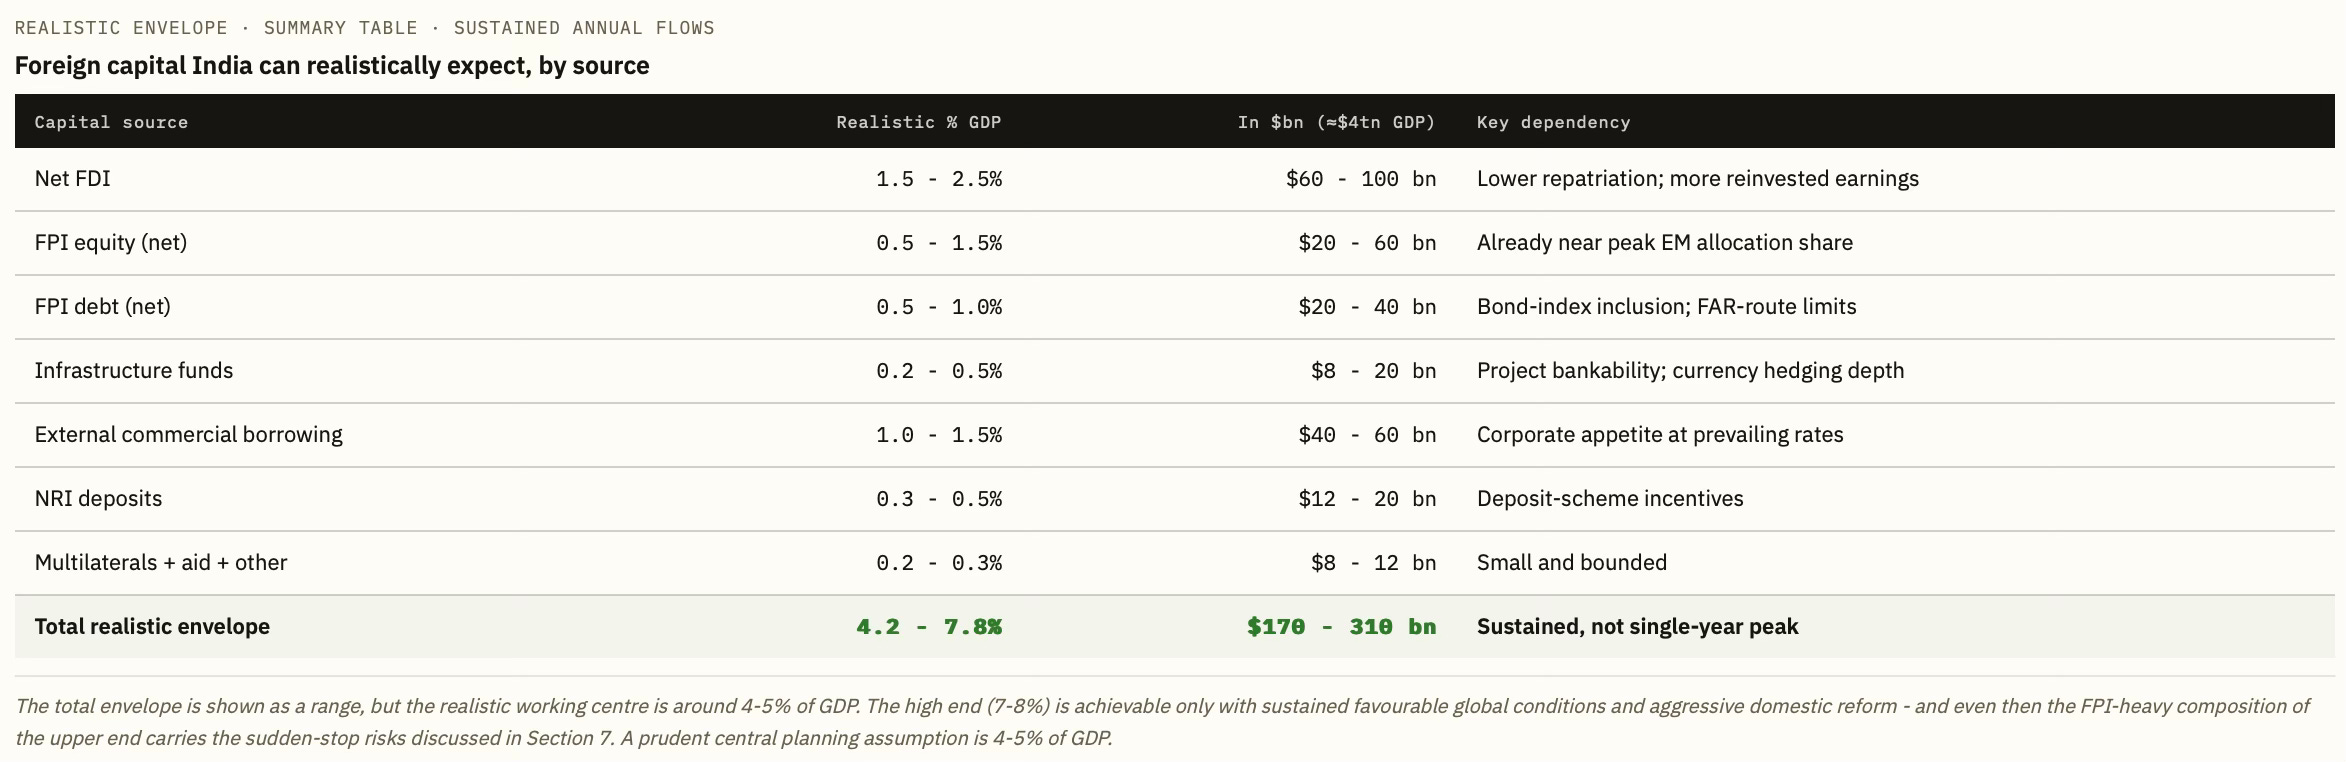
Bringing together all types of foreign capital, the graphic below shows a realistic envelope of about 4.2% of GDP. Even this may be bordering on the optimistic, given India’s track record and global economic headwinds.
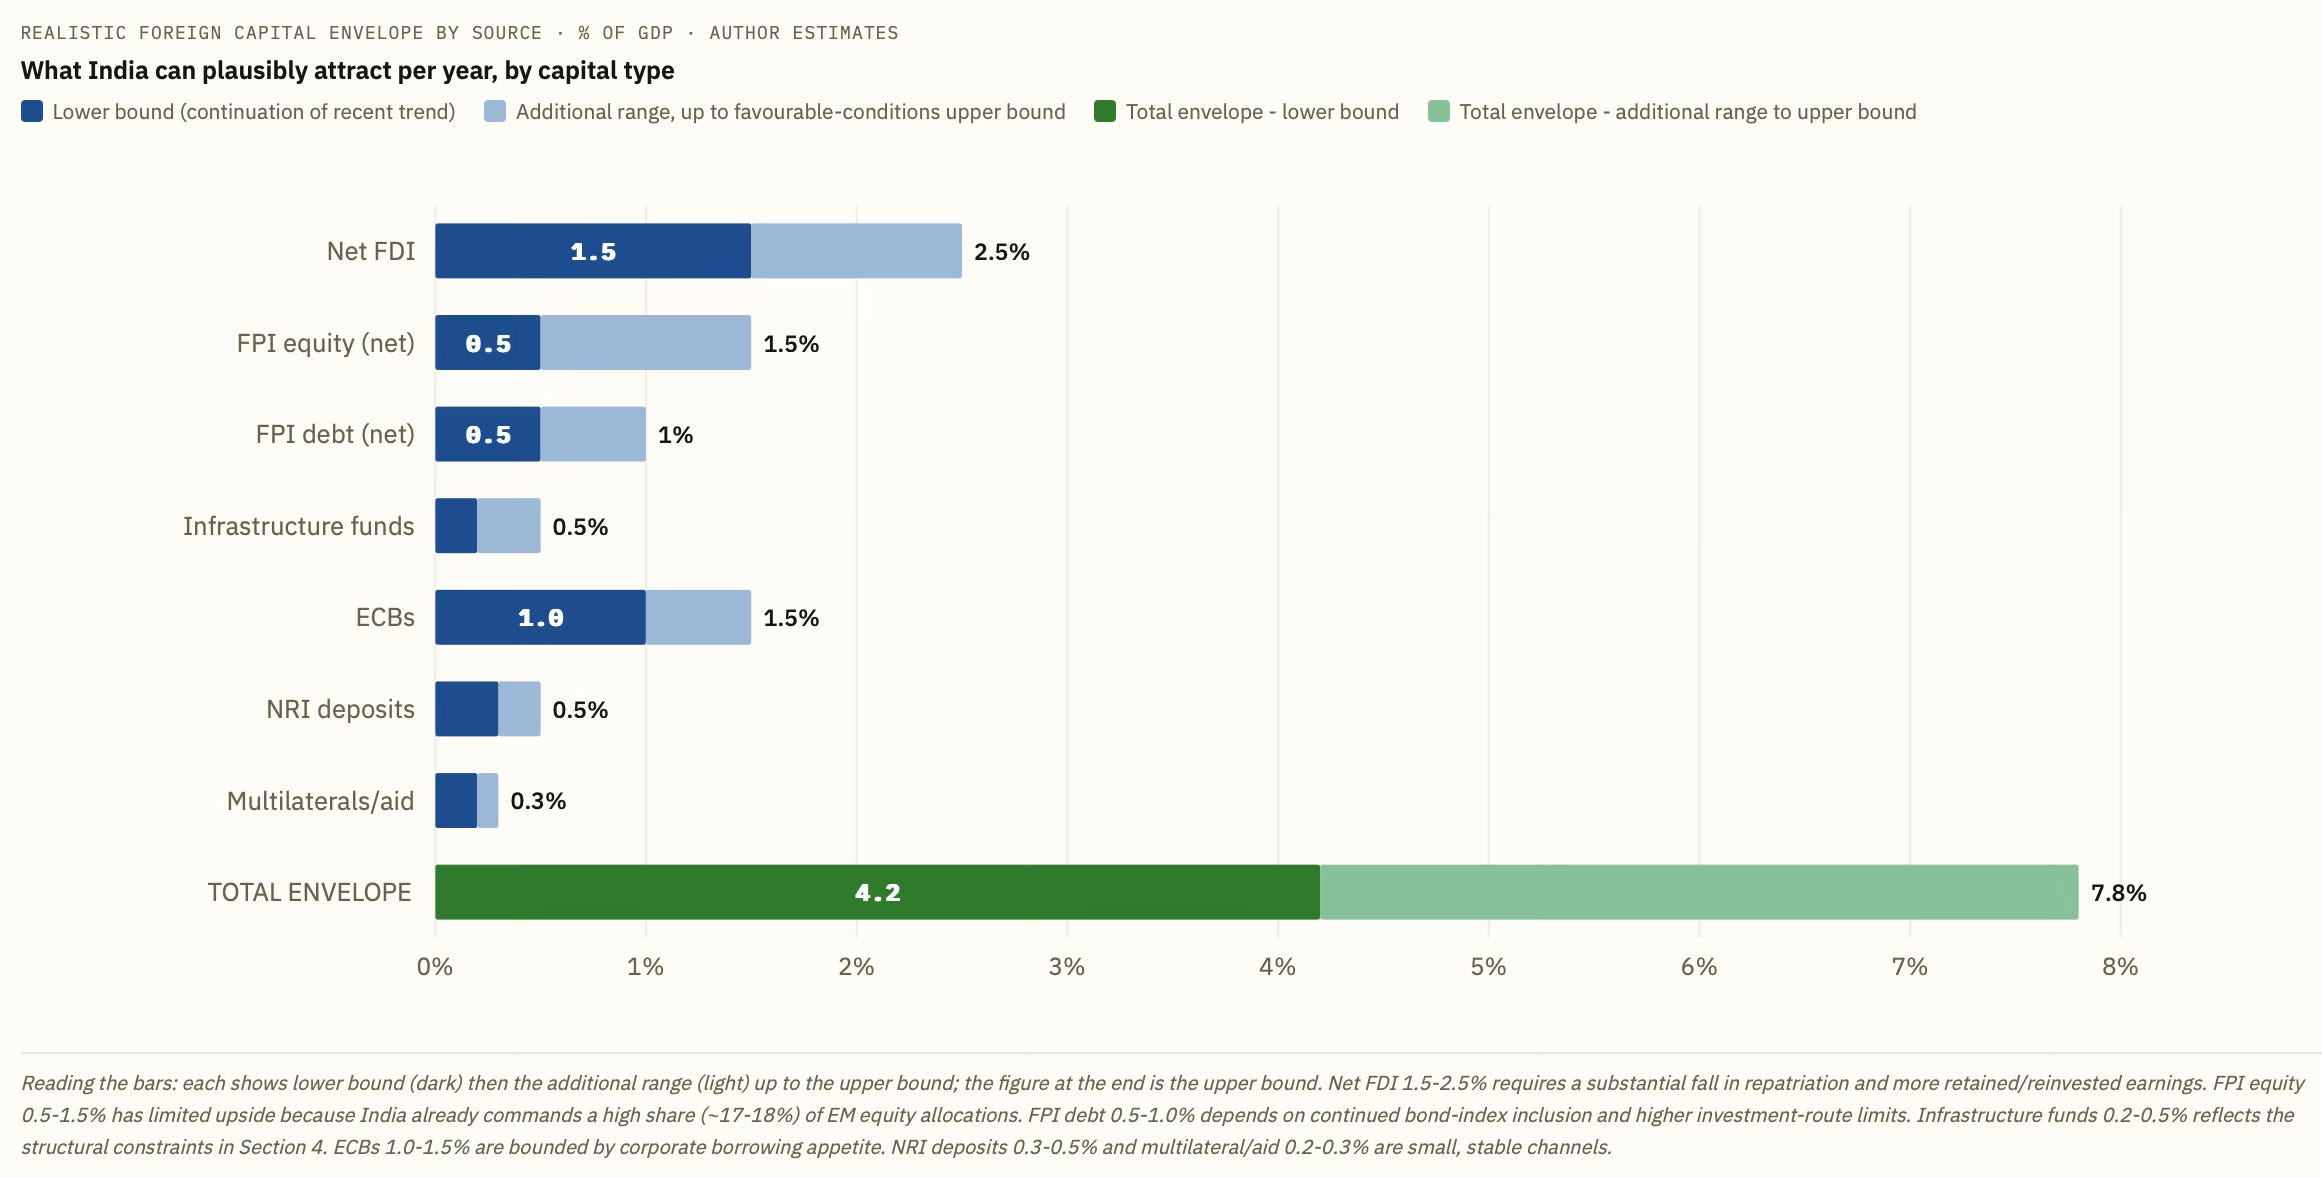
In fact, reversing the recent trend of declining net FDI and FPI, and reaching even a 2% of GDP target for foreign capital would also be challenging. In the circumstances, a 6.2% to 6.5% target for GDP growth rate on a sustainable basis would be an achievement. Anything beyond that will require substantial breakthroughs.
As a final word on foreign capital, it can be said that if India is to sustain high growth rates, it will surely have to attract foreign capital. But that will remain a marginal contributor. Instead, the heavy lifting will have to come by way of domestic capital, and especially by improving the efficiency of its utilisation. India must significantly increase domestic savings and also improve its capital allocation efficiency.
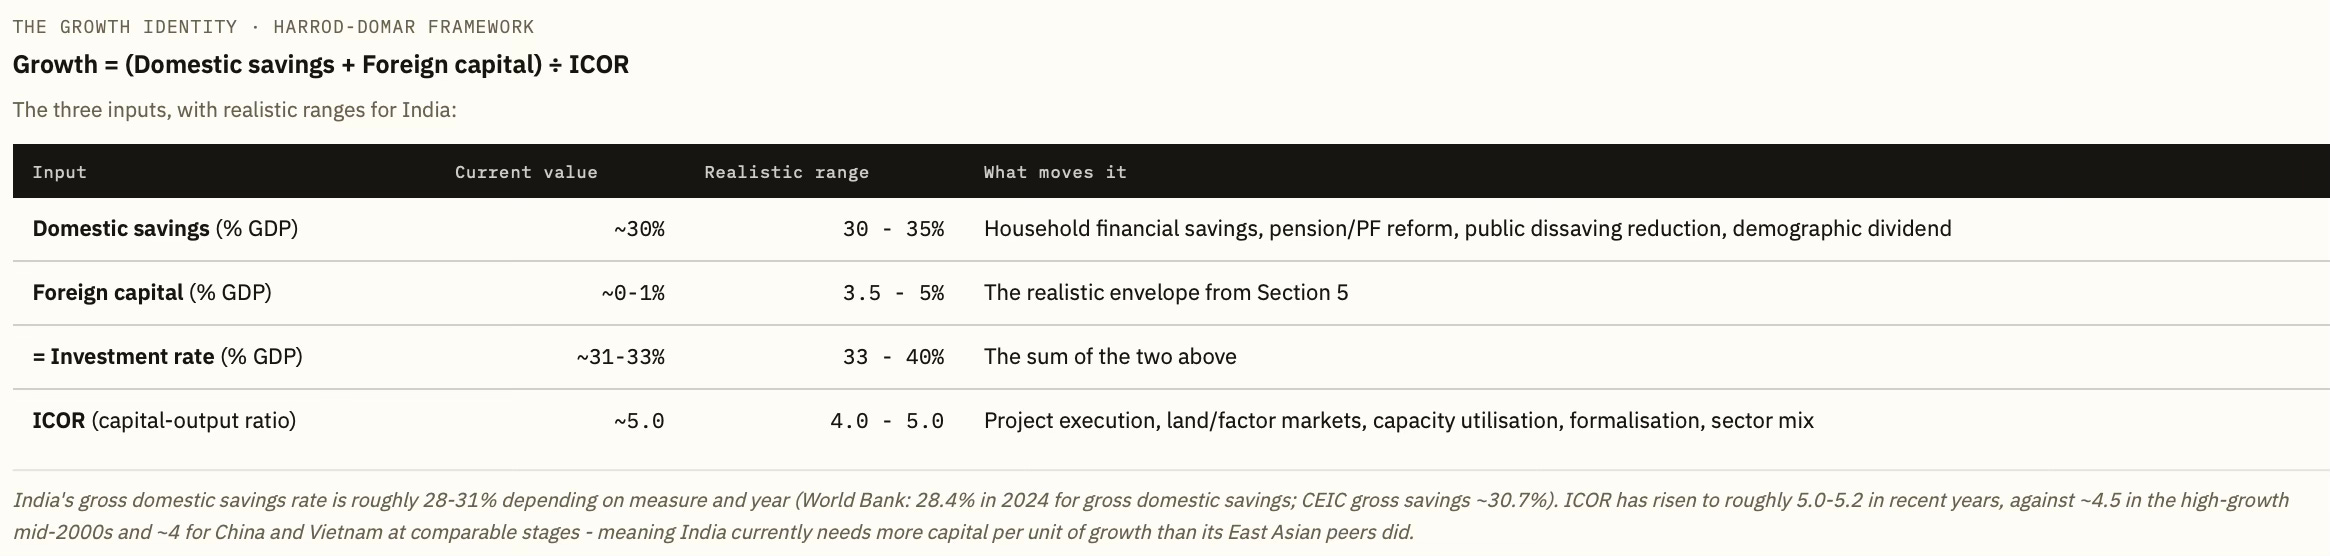
Since increasing domestic savings is itself a measure of broadbased economic growth and therefore endogenous (a point I have raised on several blog posts), capital allocation efficiency for any given investment rate becomes an important lever for sustaining high economic growth. The Incremental Capital Output Ratio (ICOR) measures the investment required to generate an additional unit of output, with a lower number indicating higher capital allocation efficiency.
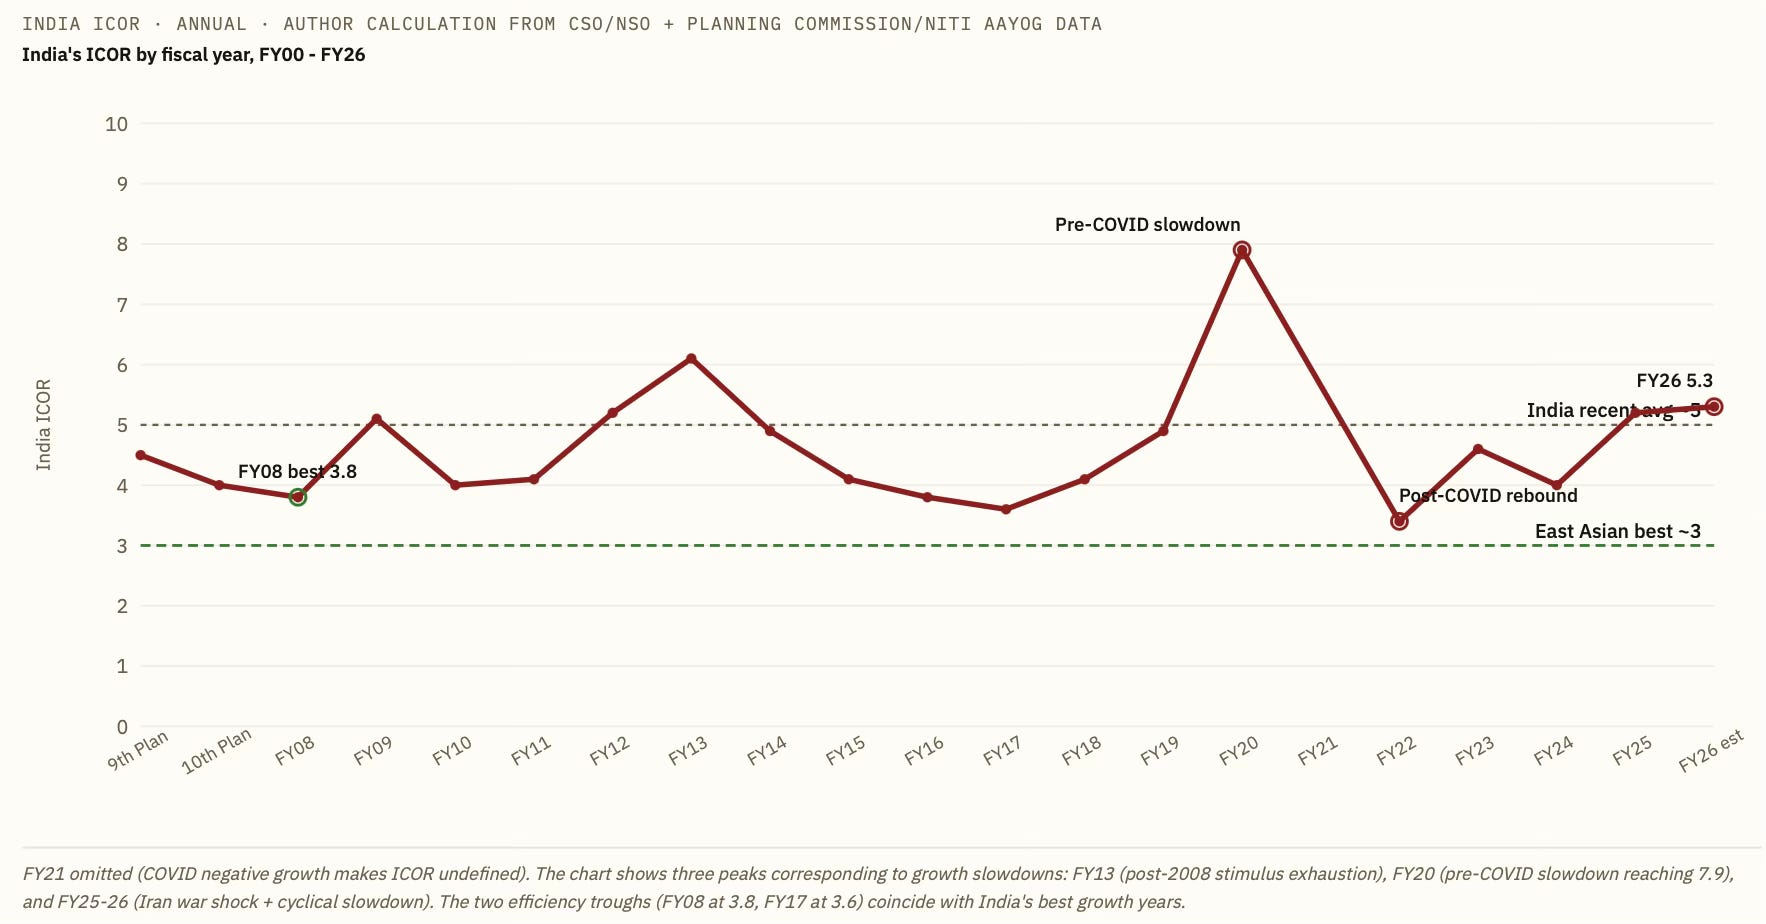
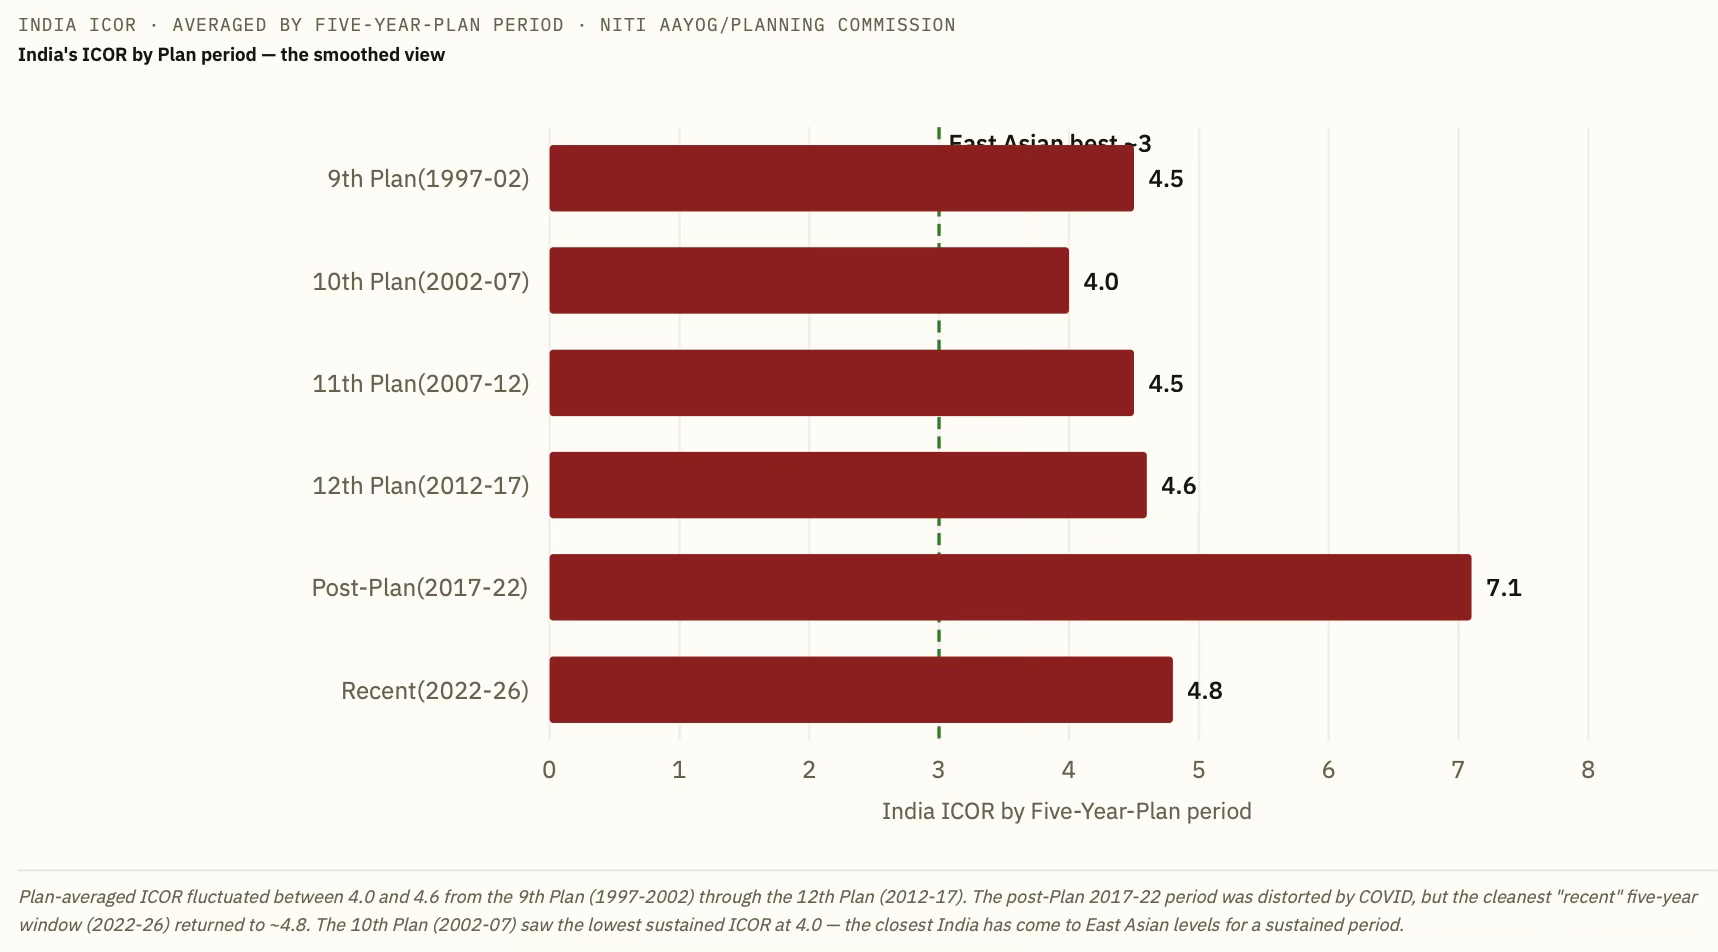
India's ICOR has been in the 4 to 5 range since the late nineties, and has never gone below 4 on a sustained five-year period. It briefly fell below 4 during the high-growth phase of mid-2000s. Further, in recent years, it has risen to 5-5.3.
How does this compare with the East Asian economies in their high growth phases?
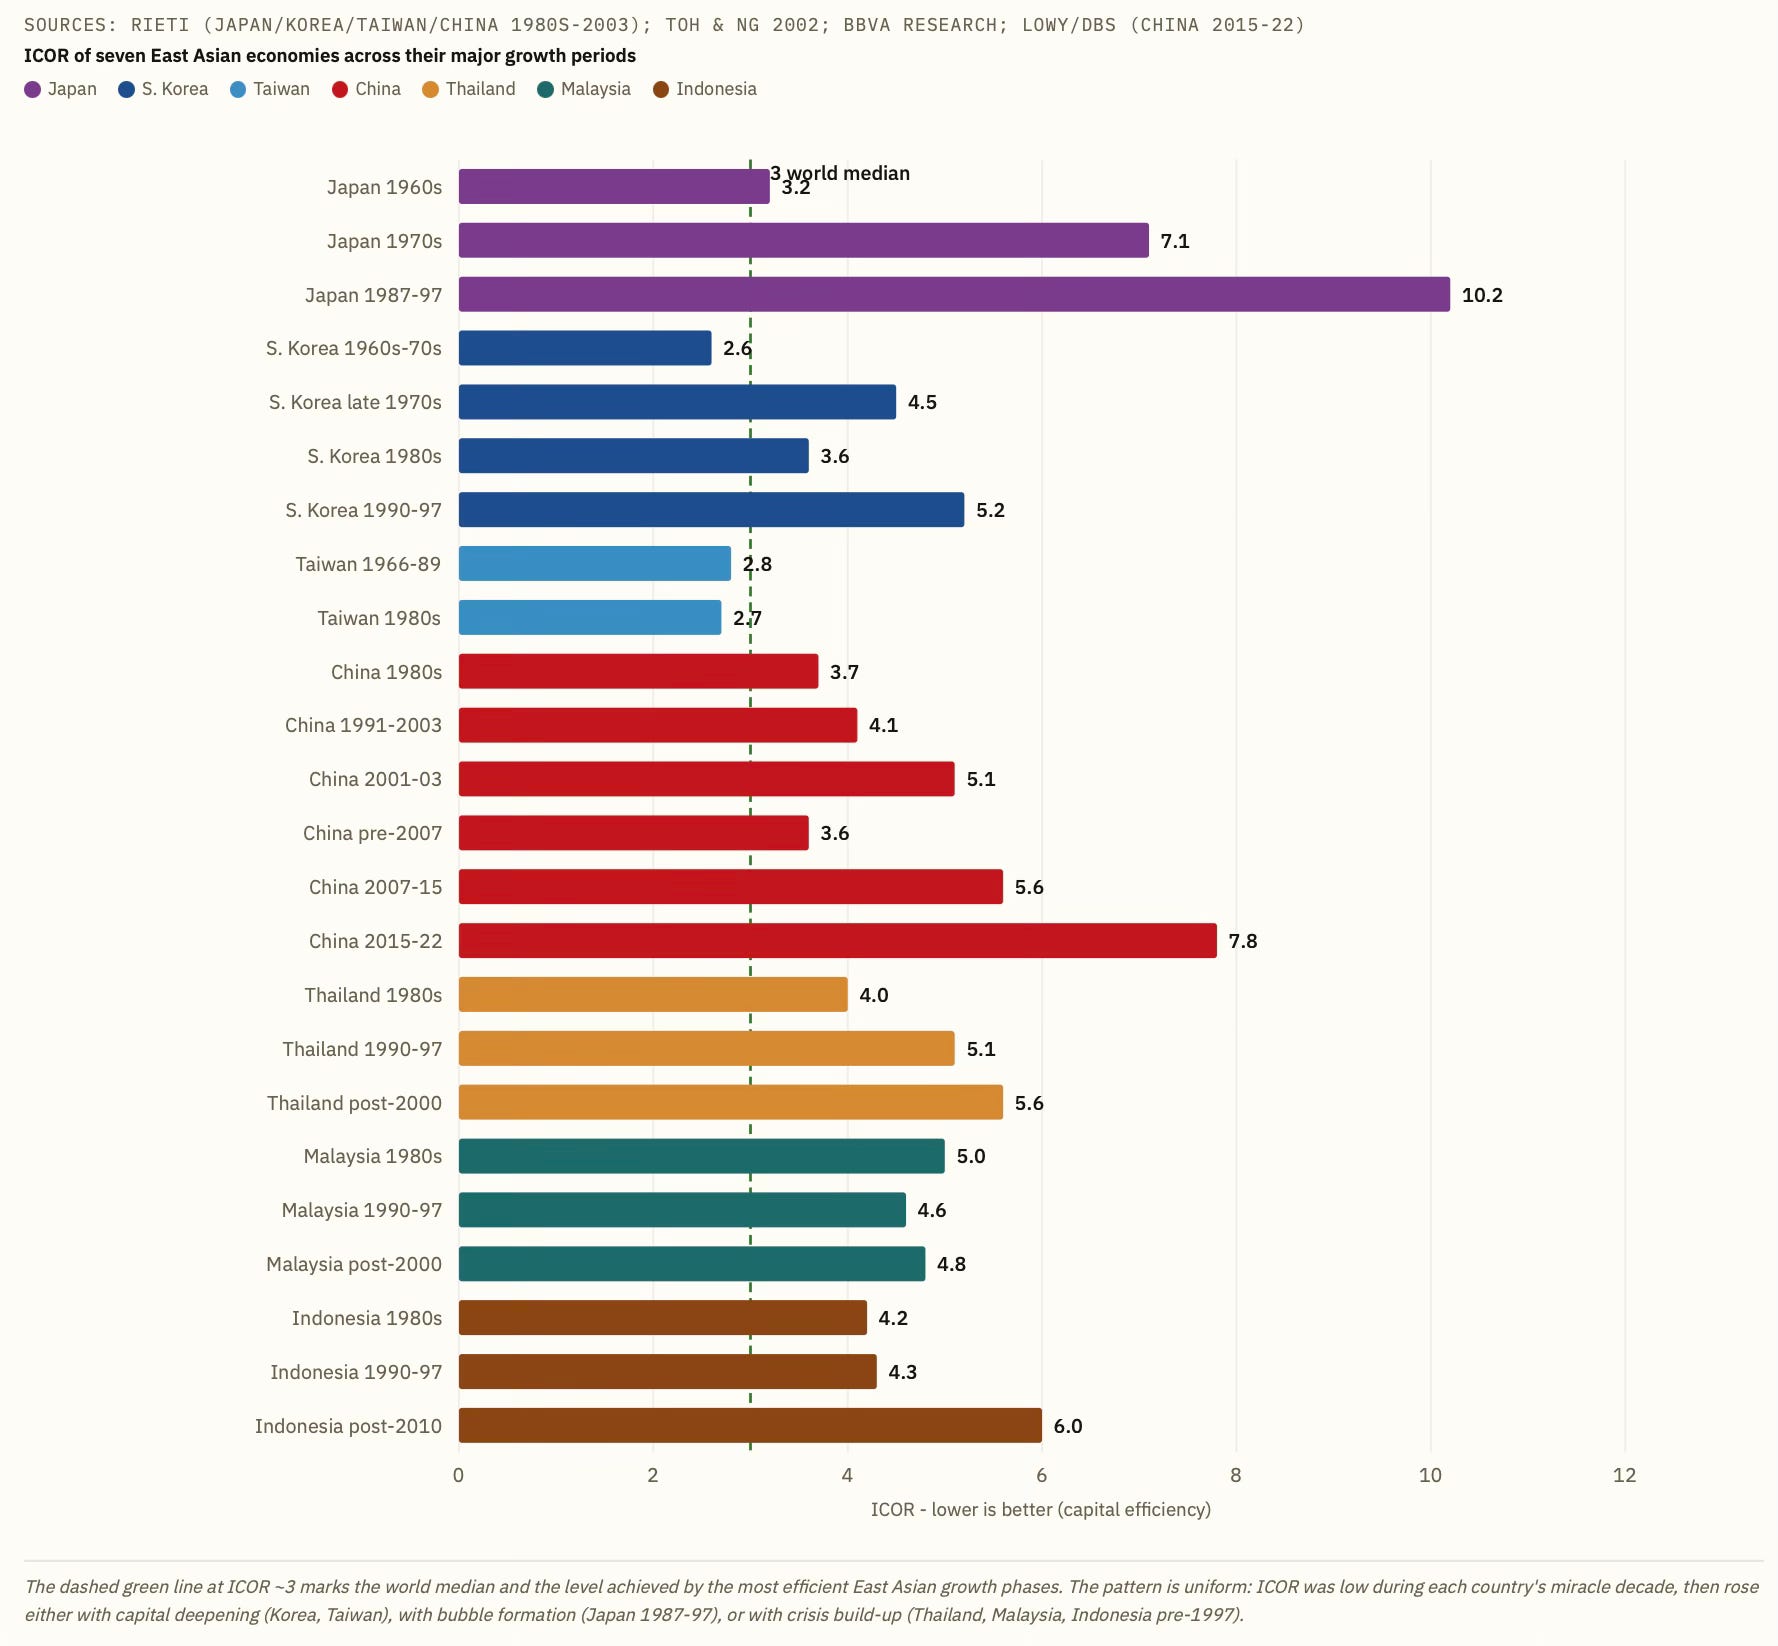
Each of these countries went through three to four distinct ICOR phases as it transitioned from labour-intensive take-off, through capital deepening, to maturity (or crisis). The lowest ICORs occurred during the take-off phase in Taiwan, Korea and Japan — and during China's pre-2007 reform years. The northeast Asian growth miracles (Korea, Taiwan, and Japan in the 1960s-80s) sustained ICORs of 2.6 to 3.7 through their fastest decades. China repeated the feat in the 1980s and 1990s with ICORs of 3.6-4.1, but its capital efficiency has deteriorated sharply since 2007, with ICOR roughly tripling from 3 to nearly 8. Investment efficiency deteriorated in every country either in the run-up to the 1997 Asian Financial Crisis or, in China's case, after the 2008 global stimulus.
The scatter plot below maps every economy-period in the dataset onto a single chart. The the dashed green diagonals are ICOR isoclines - every point on a given diagonal has the same ICOR. The main finding is important - the Northeast Asian growth miracles operated in a narrow corridor of moderate investment rates and very high efficiency. India operates in a corridor of similar investment rates but lower efficiency. China sits at the extreme right - very high investment rates, with efficiency that was once strong but has badly deteriorated.
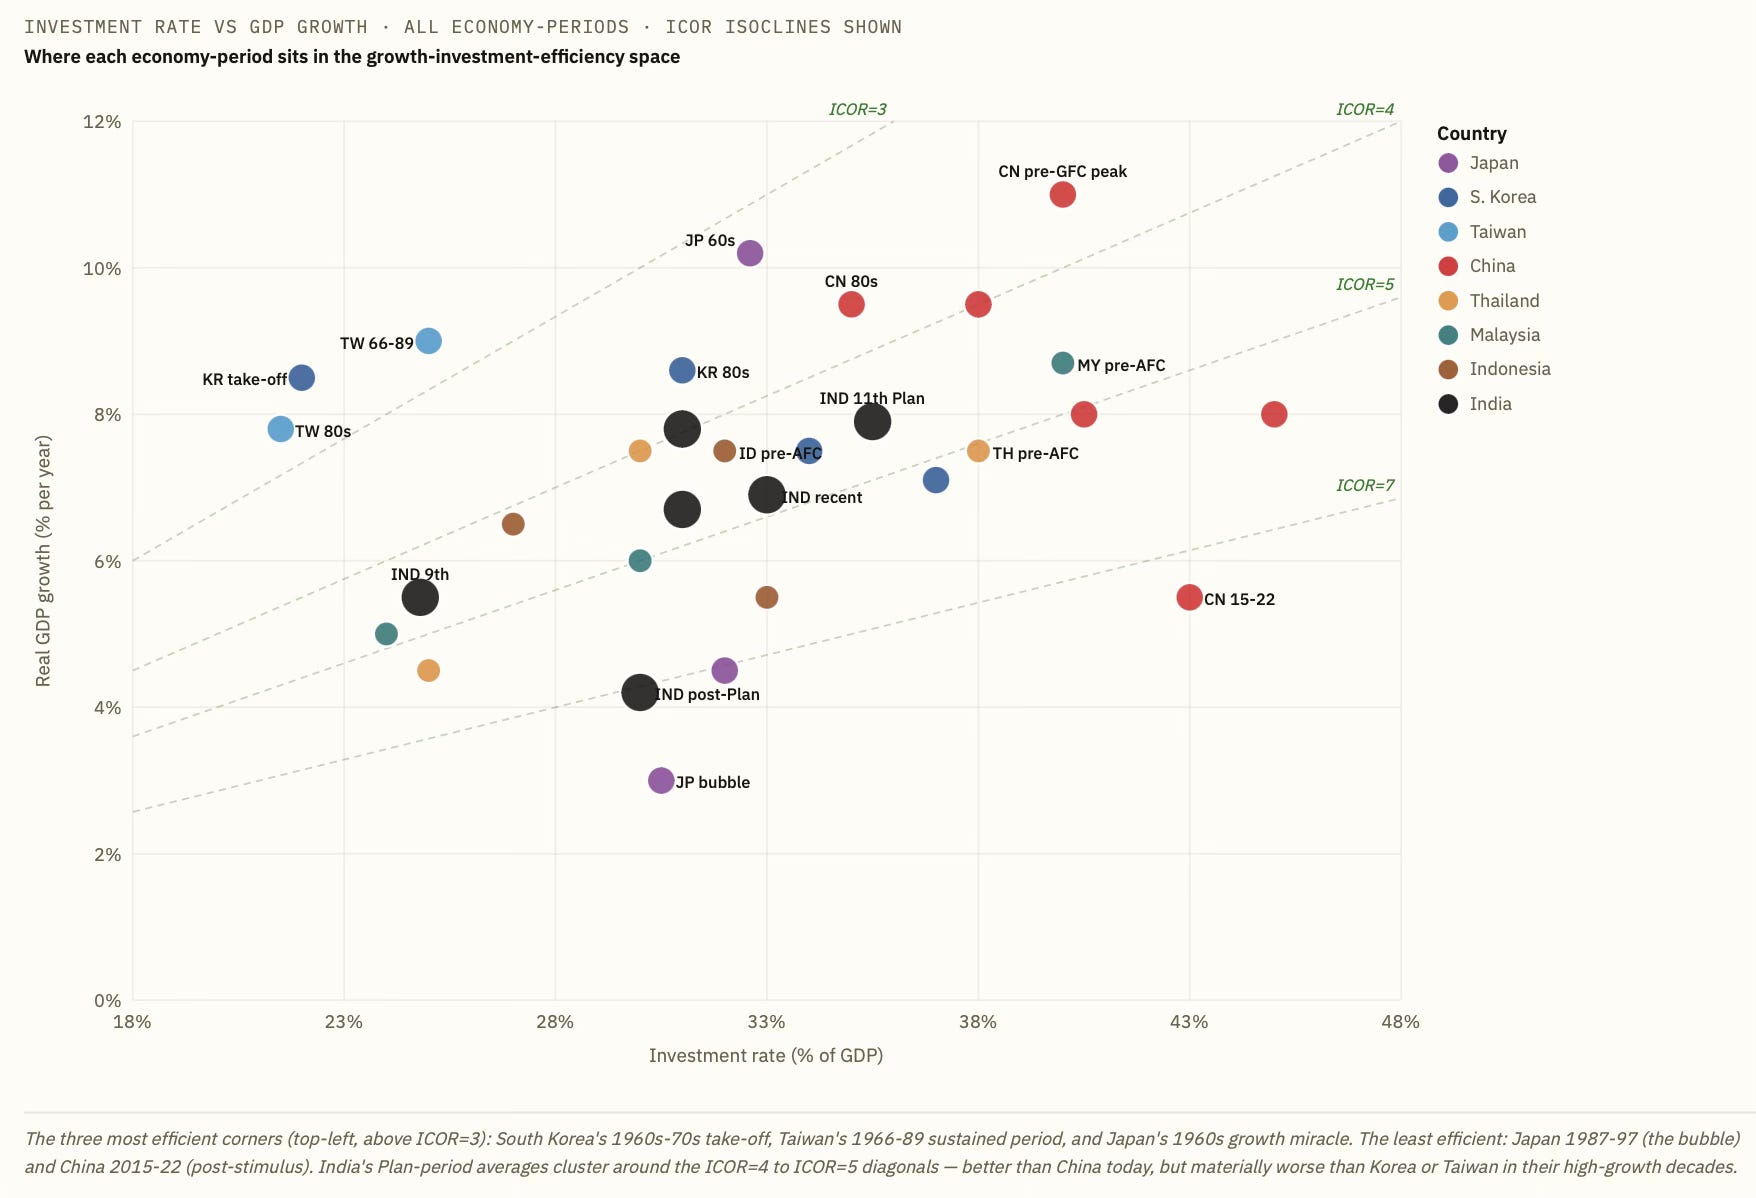
India has never matched the East Asian miracle benchmark of ~3, and capital efficiency may well be the single largest constraint on its high growth ambitions. To put this in perspective, at India’s current ICOR of ~5, achieving 8% growth requires a 40% investment rate, well above India’s current ~33%, whereas at ICOR 3.5, the same growth would need only 28%.
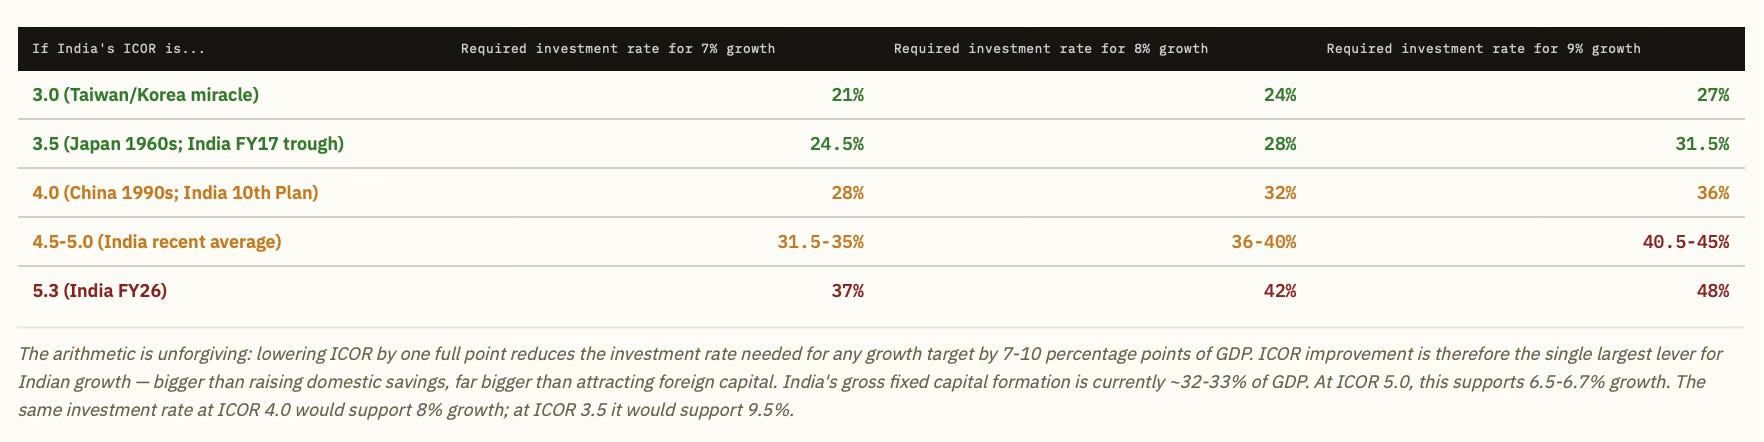
In other words, lowering the ICOR by one full point reduces the investment requirement for any growth target by 7-10 percentage points of GDP, a larger lever than raising domestic savings, and far larger than attracting foreign capital. Therefore, the path to faster Indian growth runs through pulling the cluster of Indian dots upward and leftward, i.e., raising growth without raising the investment rate. Unfortunately, it appears to be going in the opposite direction for now.
So what drives lower ICOR?
In simple terms, it is about growth, which comes with lower investment and higher efficiency of capital conversion.
For a start, on the inputs side, services and labour-intensive manufacturing have a lower ICOR than capital-intensive manufacturing and real estate-driven development. Also, higher human resource quality brings greater bang for buck from an incremental unit of investment. On the efficiency side, higher capacity utilisation, expeditious project completion, and factor market reforms - land acquisition, labour mobility, and credit allocation - contribute to lowering ICOR. Finally, institutional quality, involving predictable regulation, contract enforcement, and competitive product markets, all raise the marginal productivity of capital.
These are also the main areas of reform that have been discussed ad infinitum.
An important observation here is that we cannot overlook the reality that while it is essential to move up the value chain to high value manufacturing, it is virtually impossible to generate high growth from it without far higher investment rates. It underscores the criticality of labour intensive sectors like textiles and footwear in the sustainable economic growth of a country, especially a large one like India. This is also underscored by the importance of labour-intensive manufacturing in the high growth periods of the northeast Asian economies.
It is also important to note that China’s ICOR tripled in 15 years (from 3 to 9) as it shifted from labour-intensive manufacturing to capital-intensive infrastructure, property, and state-directed lending. Growth fell from 10% to 5% during the same period, exactly what the ICOR deterioration predicts.
The relevance of capital allocation efficiency also highlights the importance of human resource quality. This is even more so of if the services sector is to increase its role in sustaining high growth rates.
No comments:
Post a Comment