As Patrick McGee has shown in a brilliant new book, the partnership between Apple and Foxconn to make the iPhone may have been a primary contributor to the emergence of China as the factory of the world. It may be no hyperbole to say that China made the iPhone, and the iPhone made China!
This post will highlight some aspects of the domestic value addition of the iPhone in China.
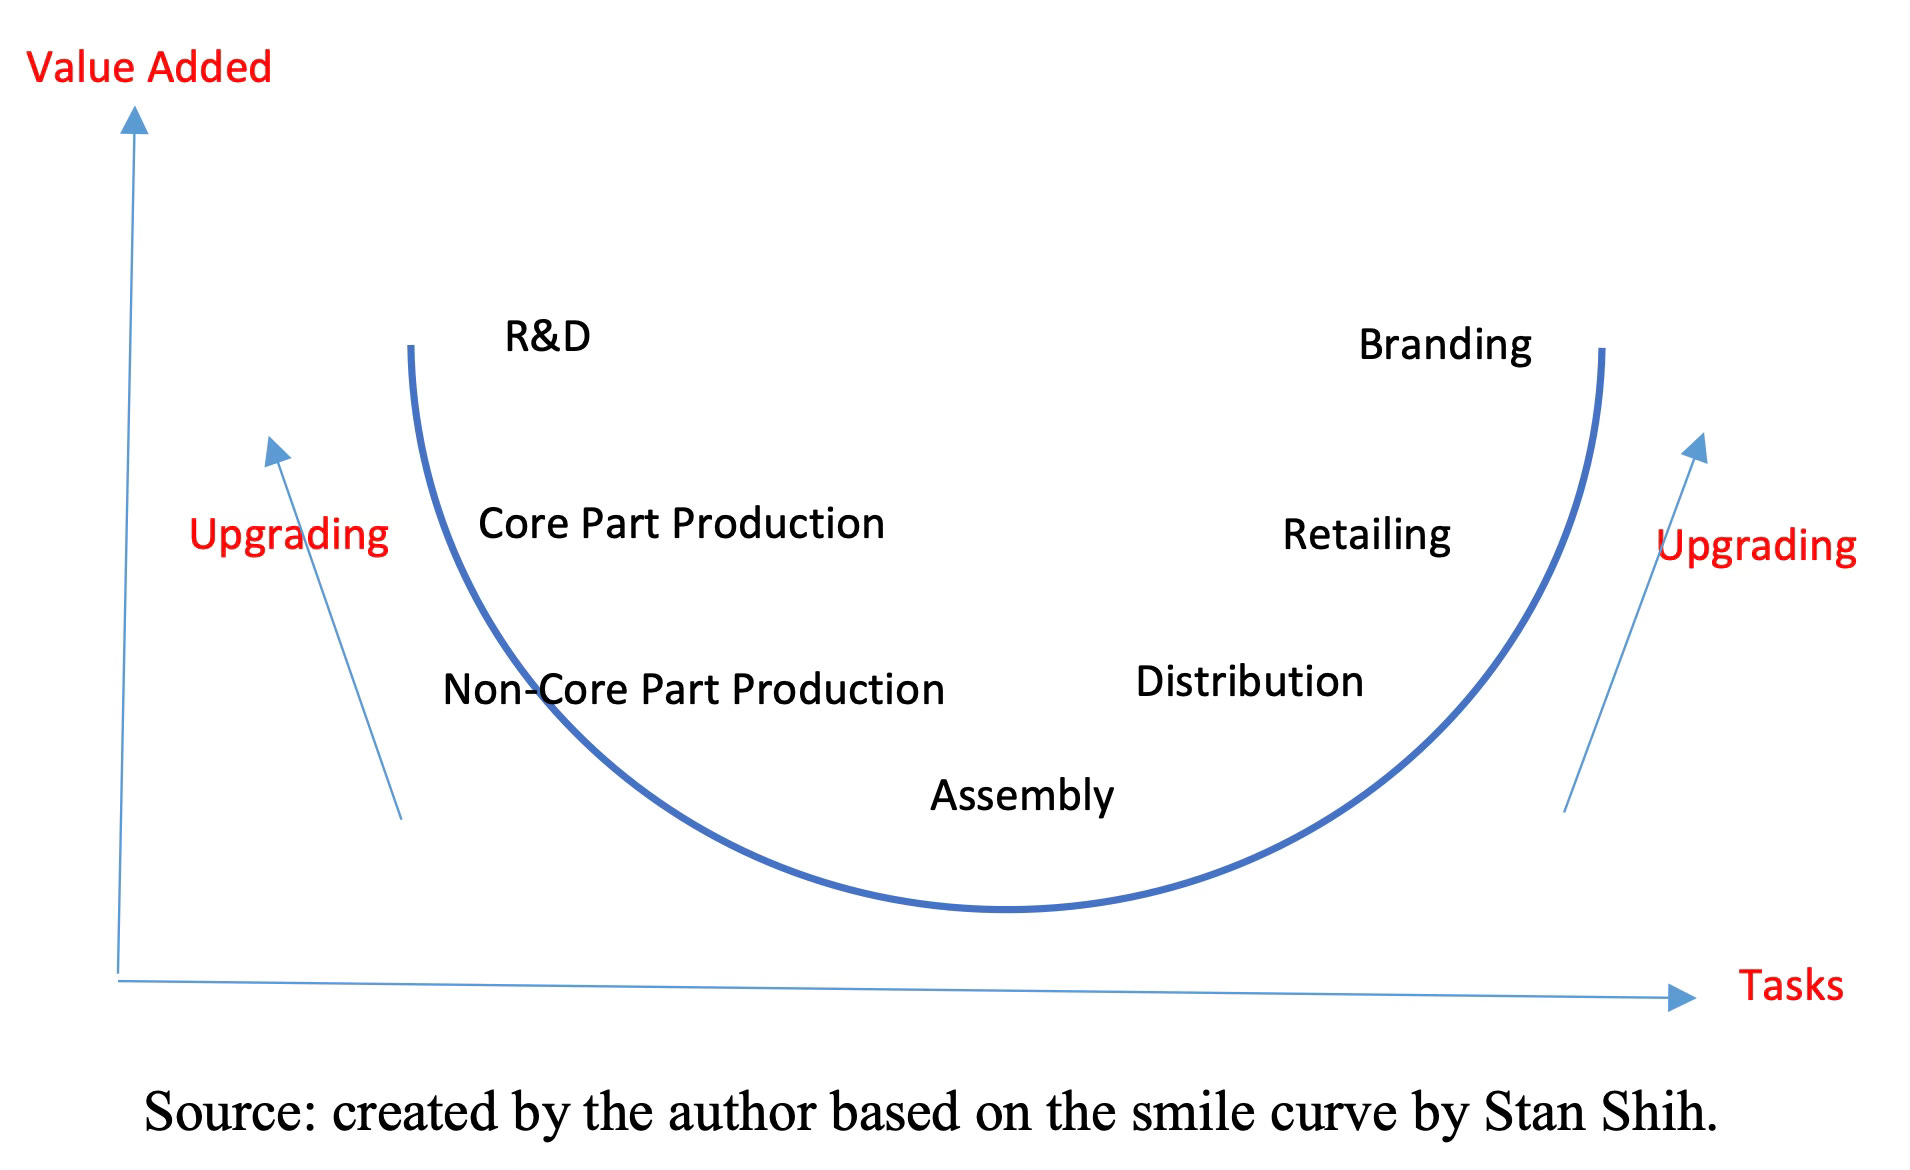
The value addition chain for any product was described by the founder of Acer Stan Shih in terms of the smile curve. It says that the highest value is at the beginning and end of the value chain, while manufacturing, the middle stage, contributes less value. Yuqing Xing has a very good description of the manufacturing value addition smile curve. Outsourcing starts with the lowest-value assembly and moves to the manufacturing of non-core components, and then to more complex electronic components. The highest value-added activities like design, R&D, and branding remain with the original equipment manufacturers (OEMs).
Yuqing Xing and Shaopeng Huang tore down and analysed the value-added by country for three mobile handsets assembled in China - Apple iPhone X, Xiaomi MIX 2, and OPPO R11s. They write
We adopt two baselines: production costs and retail prices. In terms of the production costs, it is found that the shares of domestic value-added for the three handsets are 25.4%, 15.5% and 16.7% respectively. For the iPhone X, Chinese firms collectively captured more value-added than the first generation iPhone 3G and performed relatively sophisticated tasks beyond simply assembly. For MIX 2 and OPPO R11s, the teardown analyses further reveal that no indigenous Chinese firms are involved in the manufacturing of components mounted on printed circuit board assembly. In terms of retails prices, the shares of domestic value-added for Xiaomi MIX 2 and OPPO R11s are 41.7% and 45.3% respectively, higher than the corresponding figures for production costs, suggesting that developing indigenous brands before overcoming technology deficiency is an alternative strategy to move up the value ladder along the value chains.
This graphic captures the respective domestic value addition for the three phones.
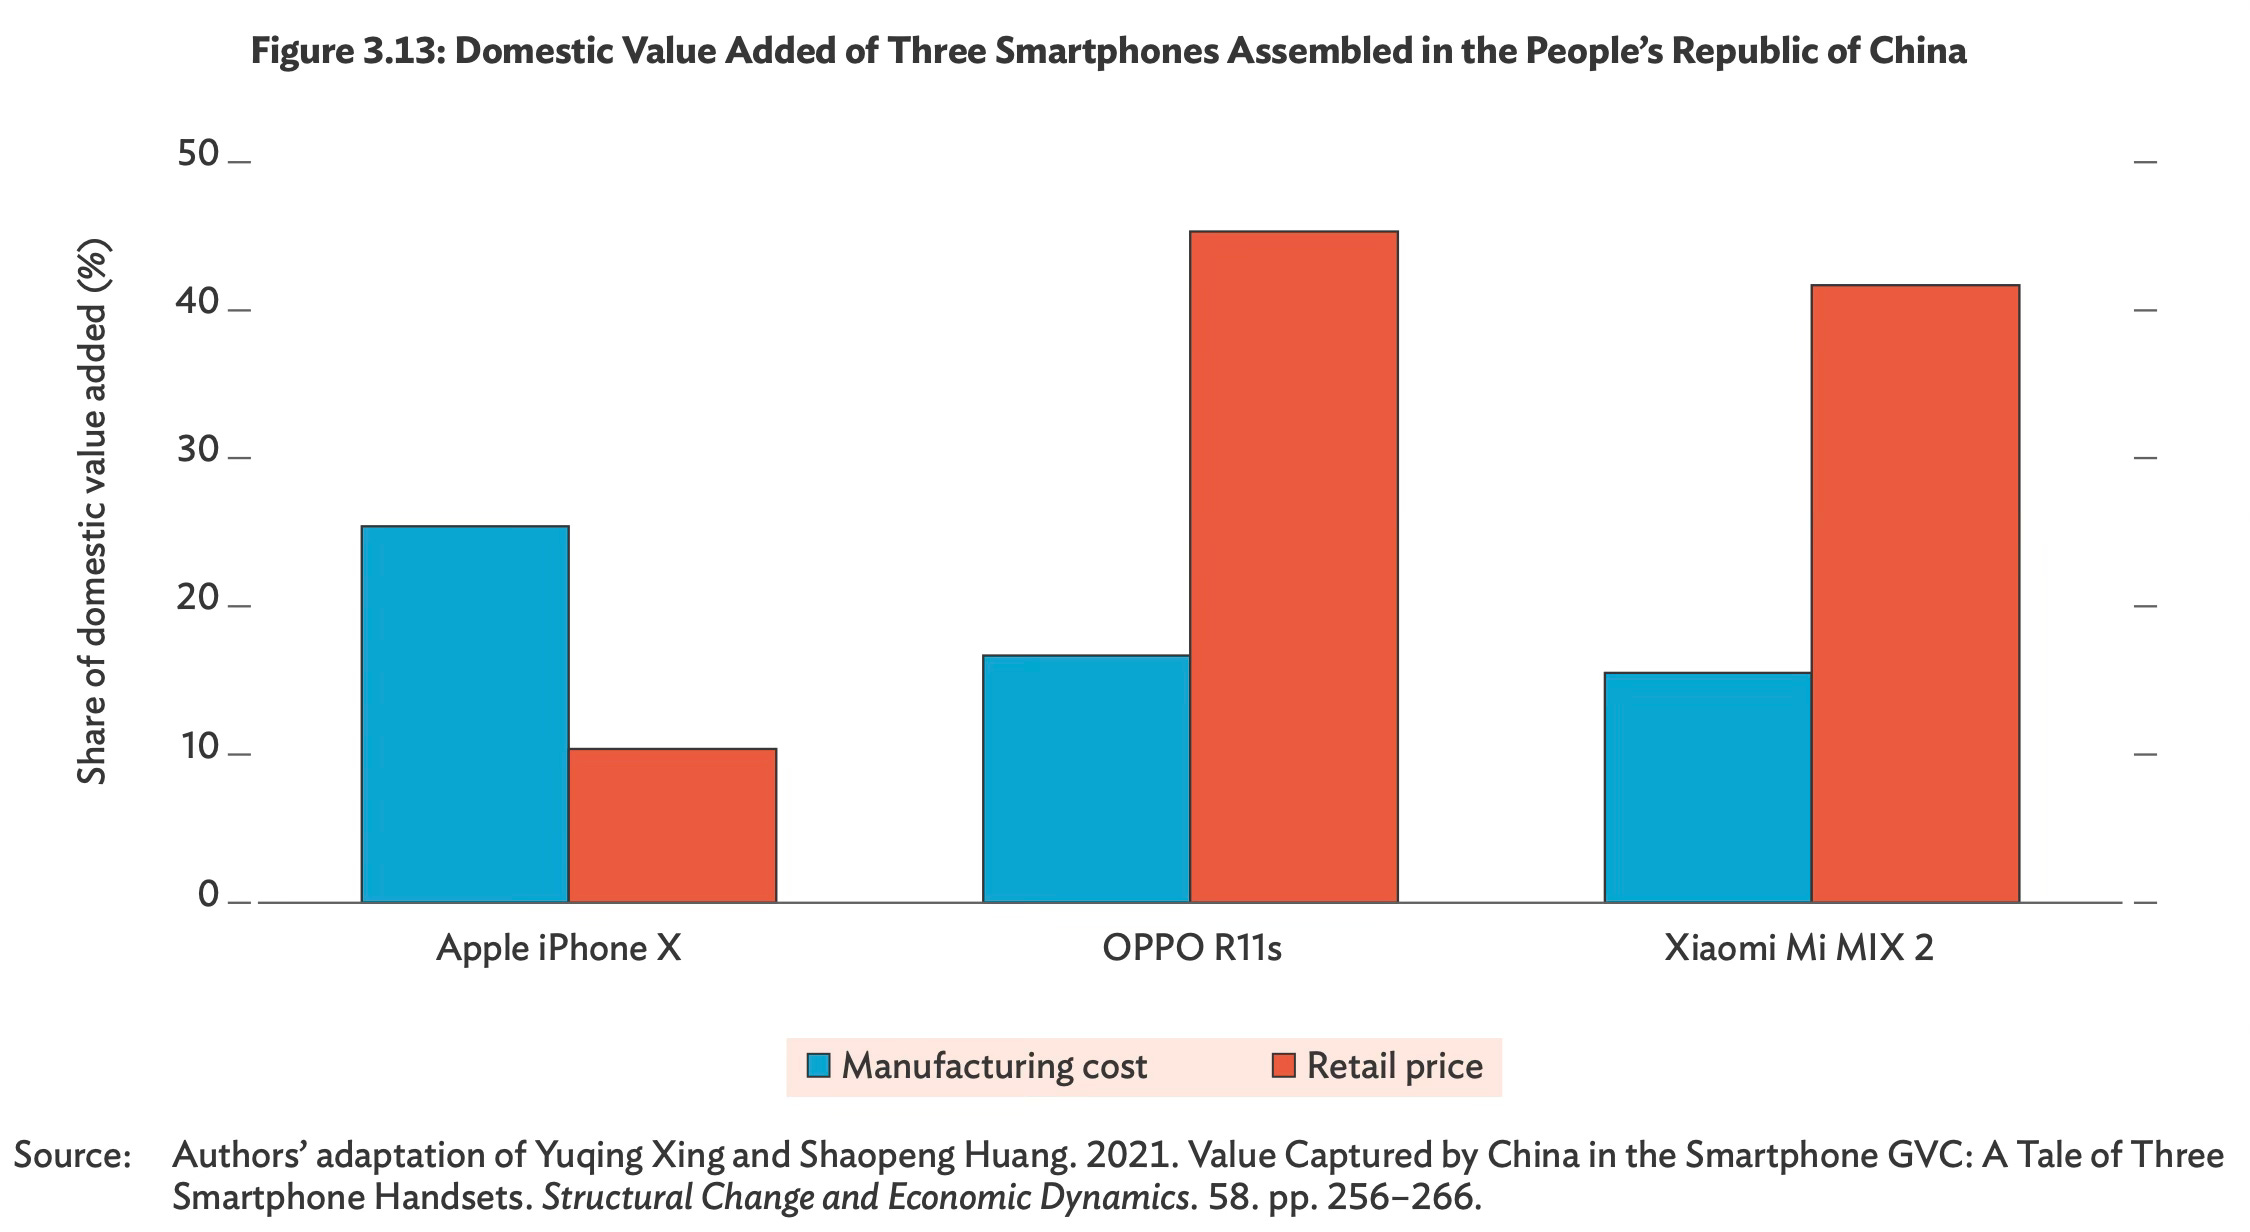
The high level of value added as a share of retail price in the case of OPPO and Xiaomi arises from branding.
However, using retail price as the benchmark, it is showed that there is strong evidence that Chinese firms have climbed up the ladder of value chains in the smile curve, more by building a strong brand name rather than developing advanced technological capabilities. More specifically, by taking advantage of (1) the size of the Chinese market; (2) their familiarity with the preferences of low- to mid-income customers; (3) the availability of modular production system and technological platforms, Chinese smartphone vendors have pursued a less conventional locus of upgrading, jumping directly to brand development before acquiring sufficient technology capacity. Such a strategy enabled them to overcome technological disadvantage and take a short-cut to catch-up with their foreign rivals.
But even for the Chinese brands, the major components are almost completely sourced from foreign firms.
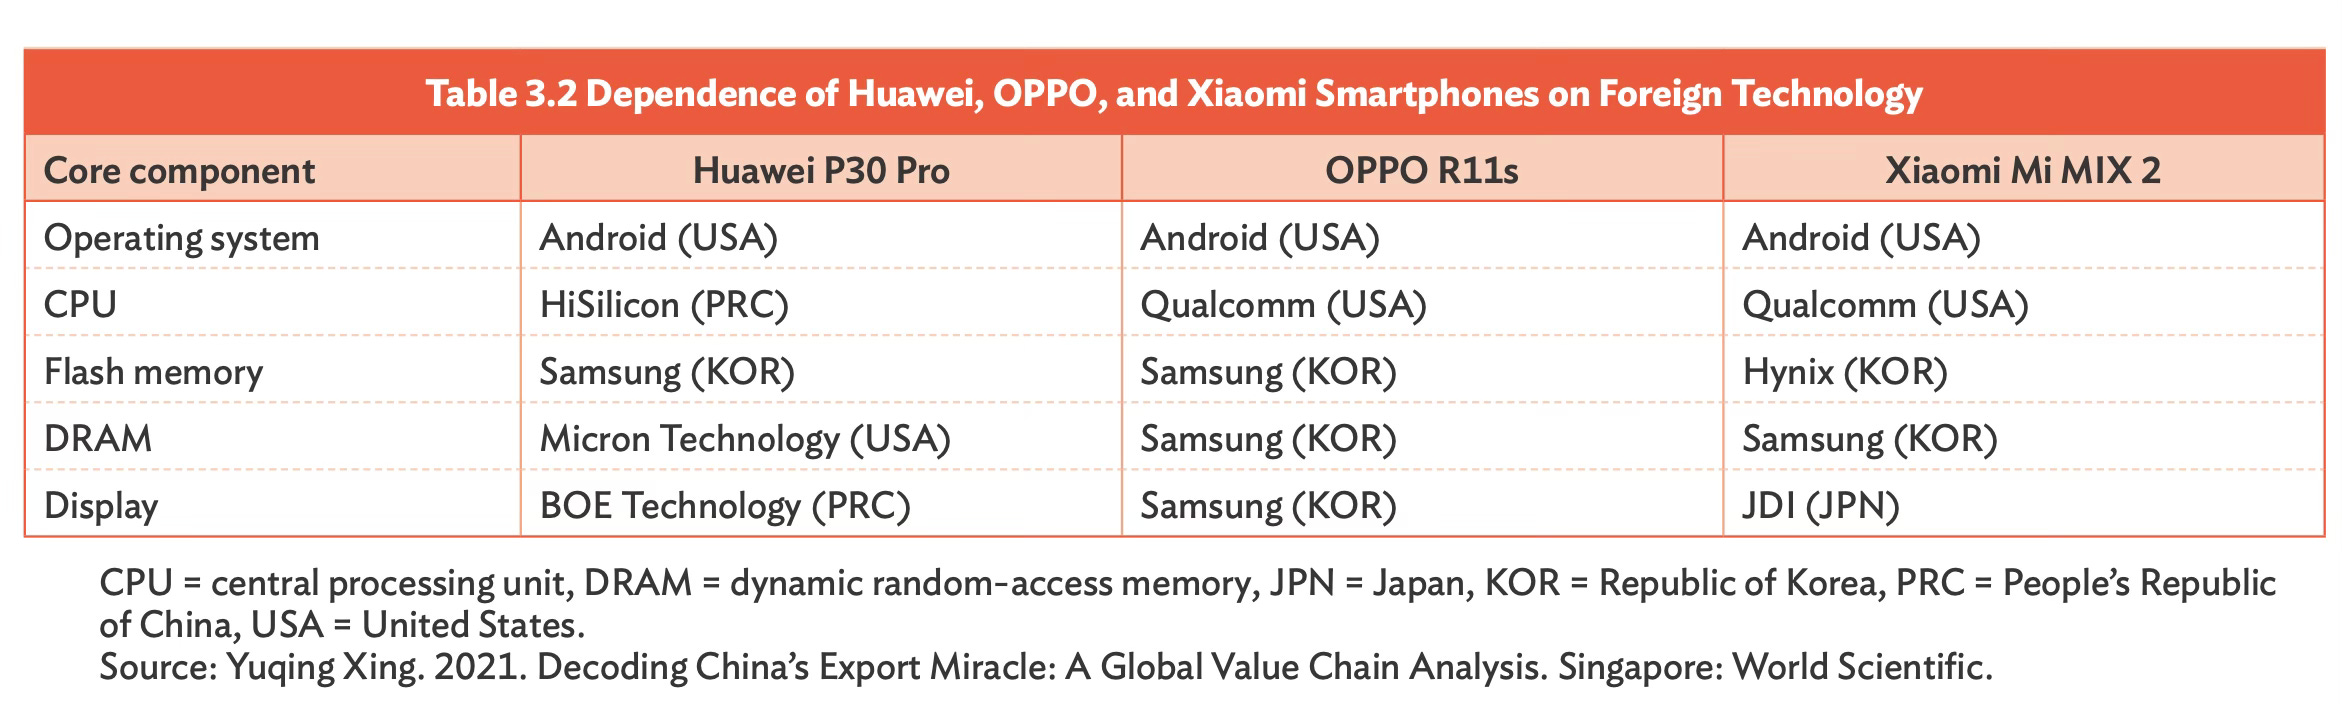
The domestic value added as a share of manufacturing cost is 15.5% for Xiaomi (total manufacturing cost of $293.18) and 16.7% for OPPO ($335.98). Even for Huawei, with its in-house chip, the domestic value added is only 38.1%, mainly due to the Kirin processor of HiSilicon, a Huawei subsidiary, and the OLED display made by BOE Technology.
Xing traces the change in value addition as a share of manufacturing cost and retail price across iPhone 3G (2009) and iPhone X (2010). The table captures the tasks done by Chinese firms for the two models.
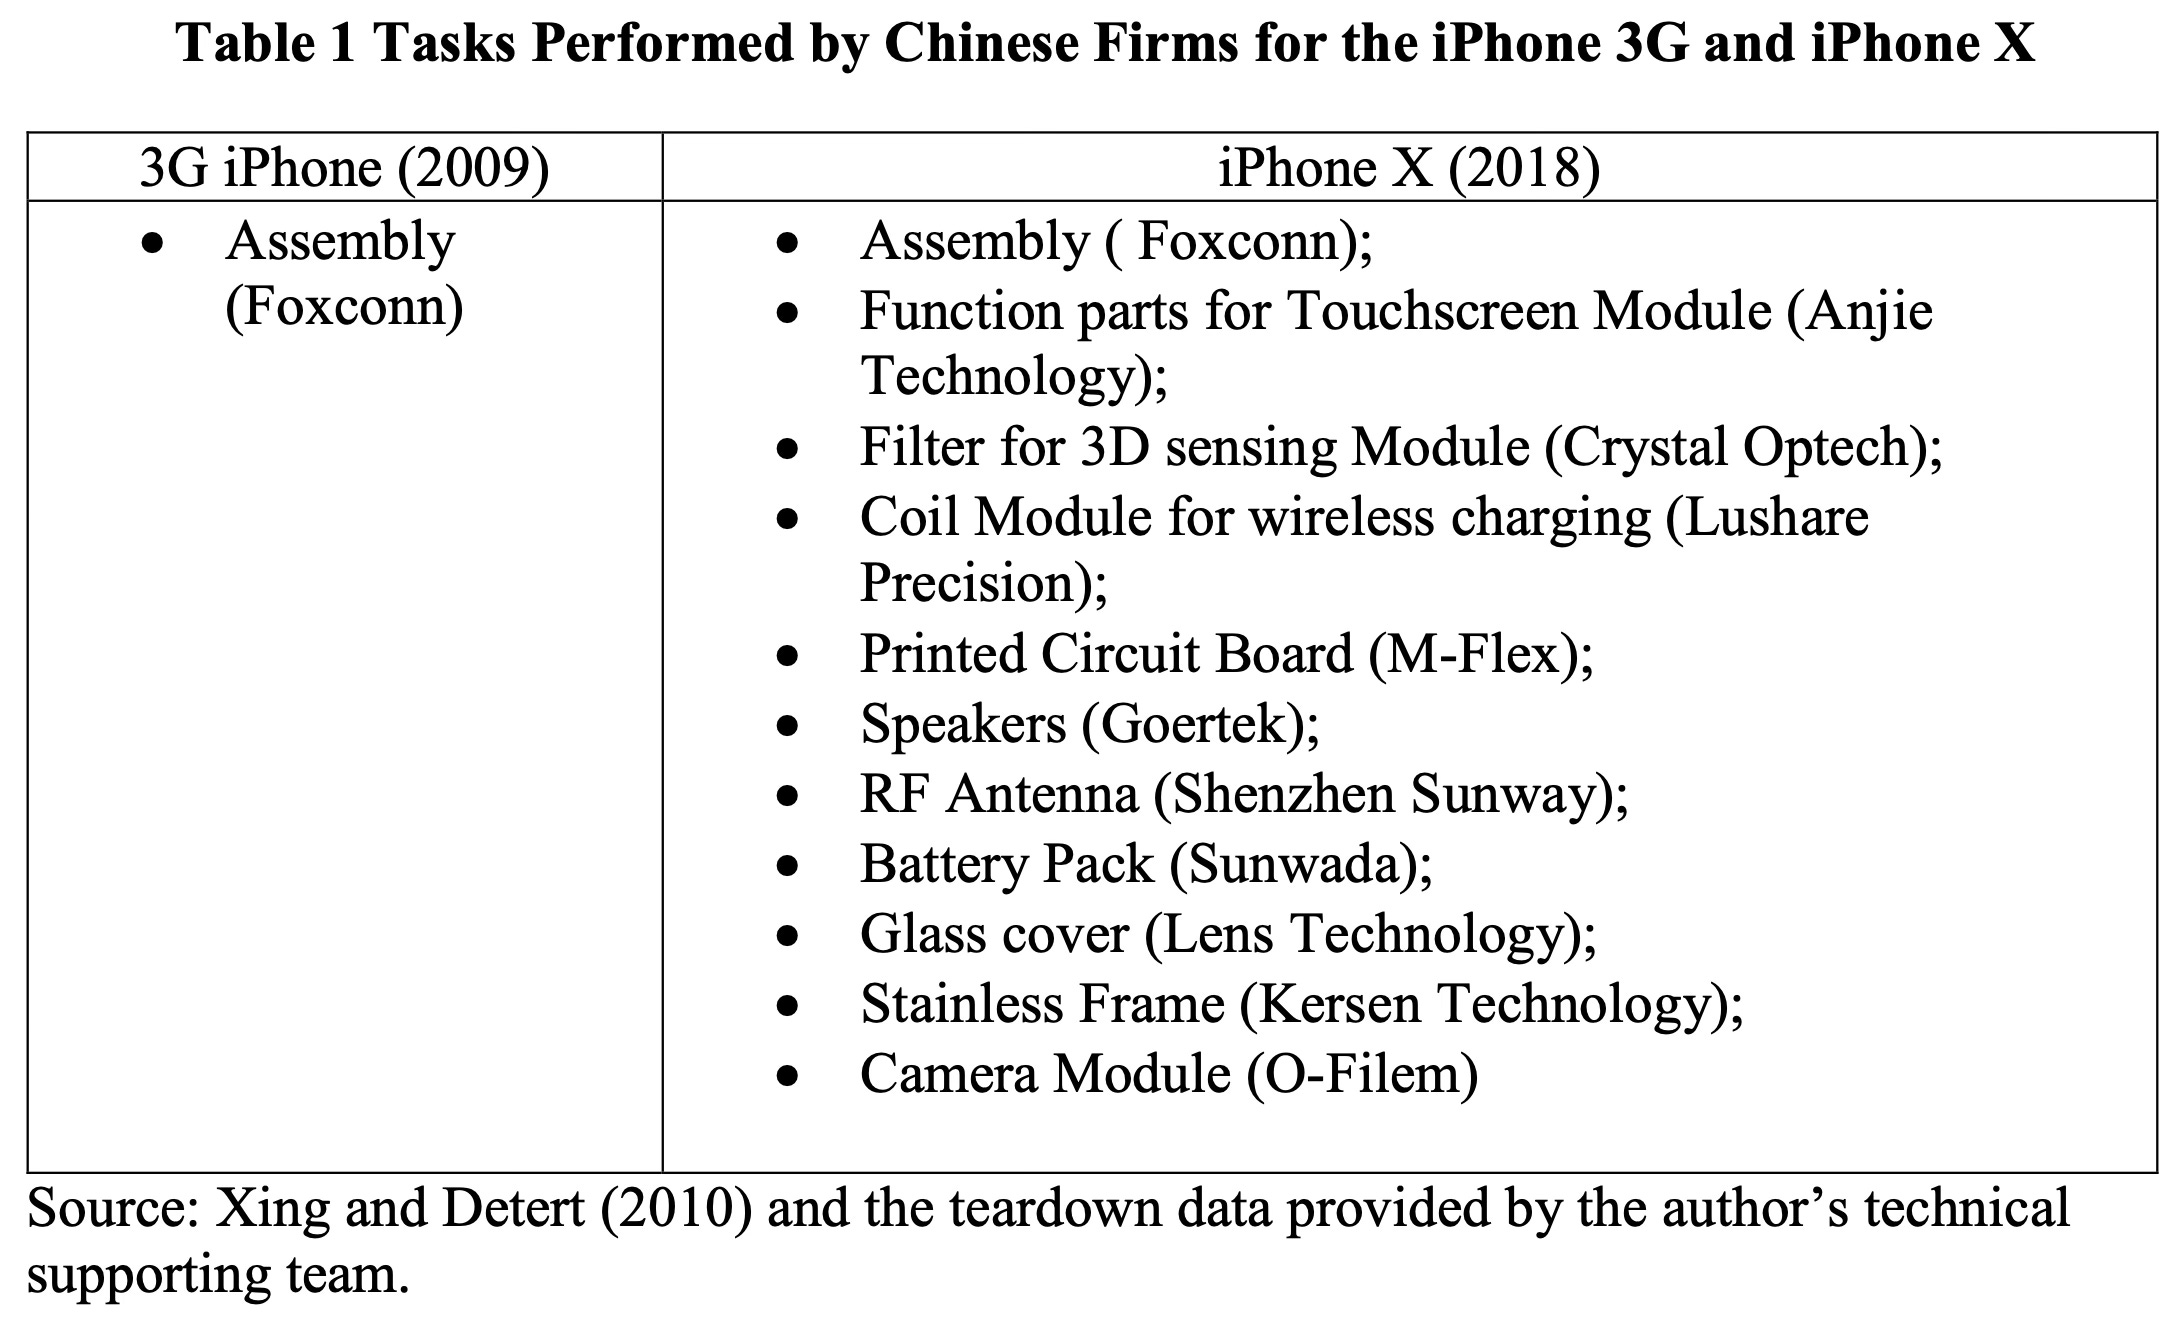
And the graphic below captures the respective value added in the two models.
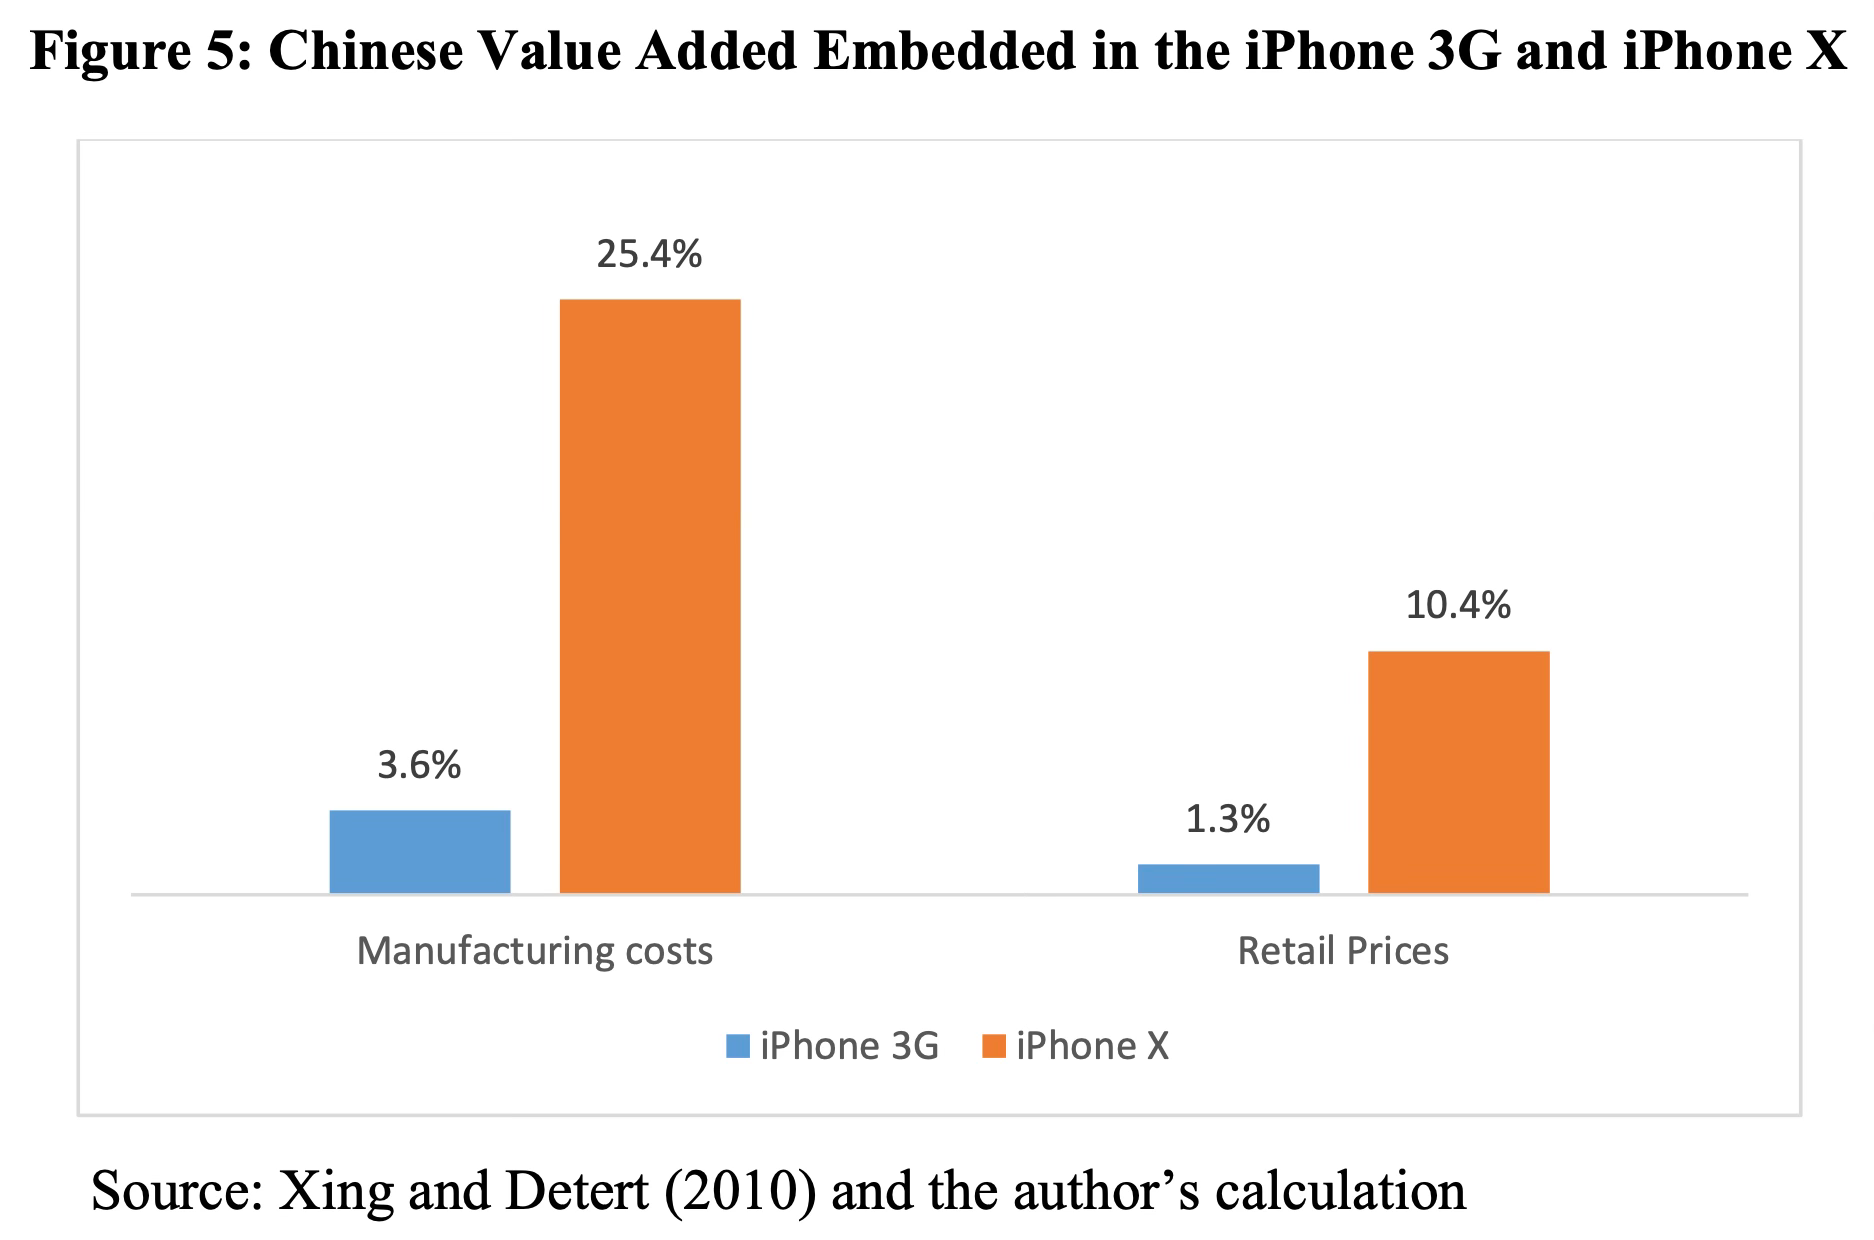
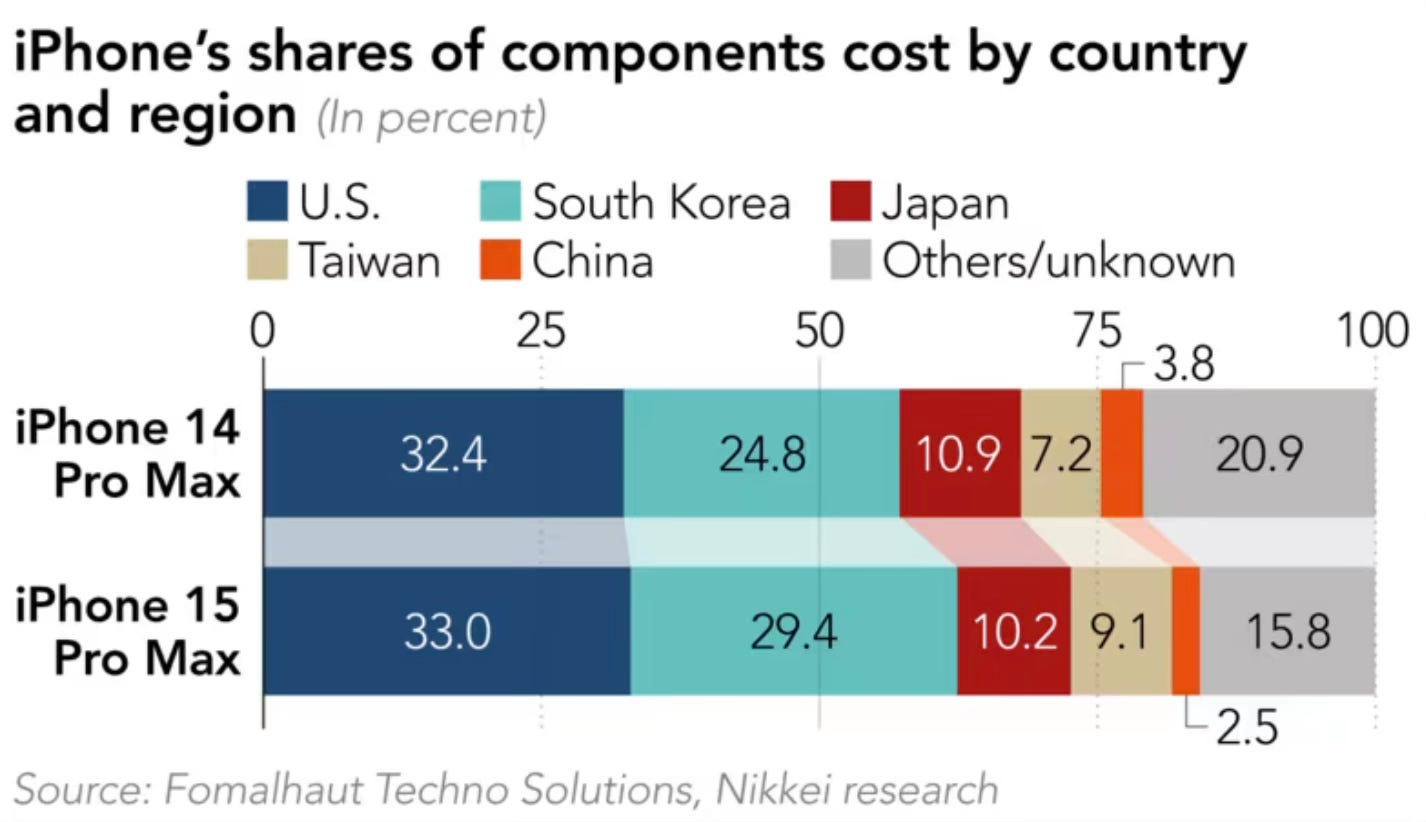
However, it’s interesting that while manufacturing value added in China has increased, the share of the iPhone’s total cost coming from Chinese firms has remained tiny, even for the latest models. Just 2.5% of the total cost came from Chinese firms, whereas over 80% came from US, Korean, Japanese, and Taiwanese firms.
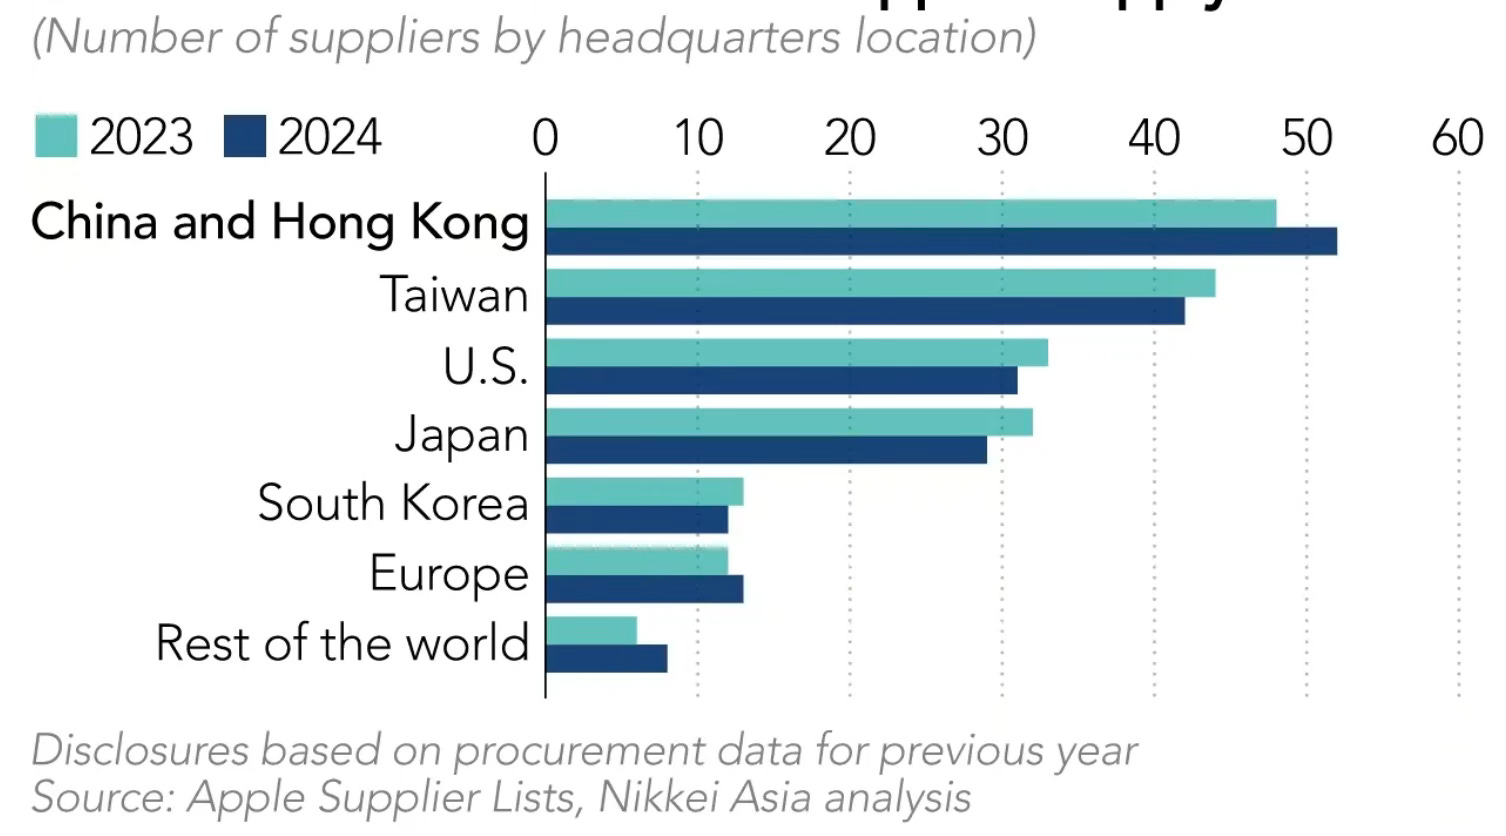
This graphic captures the country-wise headquarters of the suppliers of iPhone.
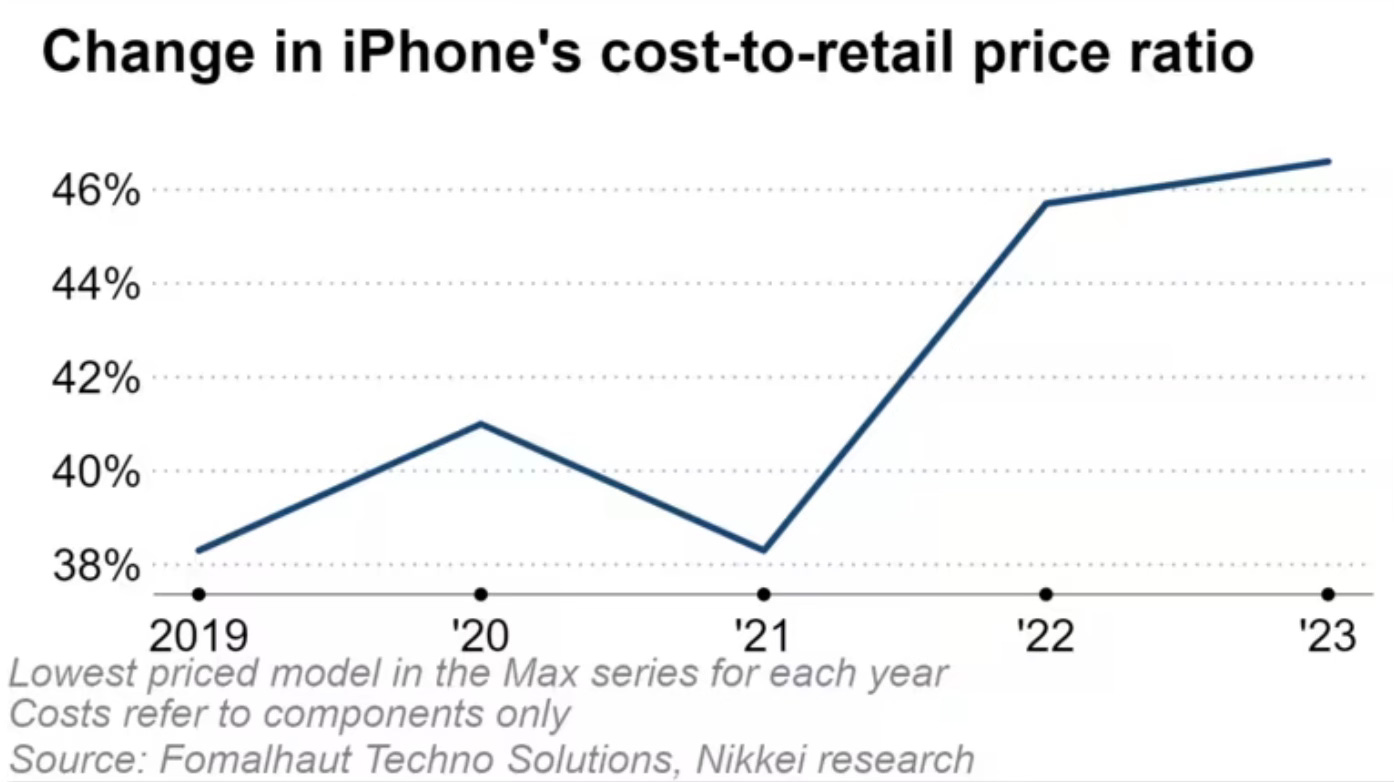
Though the cost-to-retail price ratio for iPhone models has been rising, it was still only 49% and 52% for the 15 Plus and 15 Pro models. This points to the dominant share of value added going to R&D and branding.
In another paper, using the data for value-added for iPhone X, Xing shows (also this) that the standard trade statistics, which use the gross value of exports, overestimate the US trade deficit with China by attributing all gross value generated to the exporting nation.
According to that principle, whenever China ships one iPhone X to the US, the current system of trade statistics calculates it as a $409.25 export to the US. The teardown data reveals that the total value of the parts imported from the US for assembly of the iPhone X is $76.5. Hence, importing one iPhone X from China generates a $332.75 ($409.25–$76.5) trade deficit for the US… However, Korea, Japan, and other countries are also involved in the production of the iPhone X and supply more than 45% of the parts and components. In other words, the $332.75 consists of not only value-added originating in China but also that contributed by Korea, Japan, and other non-US countries. It should be considered as a trade deficit between the US and all other countries involved in manufacturing the iPhone X, not just China.
In terms of value-added, the US deficit with China for the import of one iPhone X is only $104, less than one-third of the figure based on gross value. For every iPhone X imported by the US, current trade statistics mistakenly add $228.75 to its trade deficit with China. In 2017, American consumers bought 42.2 million iPhone units. Using that figure as a reference, the iPhone trade alone exaggerated US trade deficit with China in 2018 by $9.65 billion, about 2.3% of its total deficit with China.
He also shows that, given the high share of foreign value added, China would need to depreciate its currency by a large percentage to offset tariffs by the US.
The large portion of the foreign value-added embedded in the iPhone X greatly weakens the effectiveness of yuan depreciation in counterbalancing Trump’s tariffs. When the Chinese yuan depreciates against the US dollar, only the $104 Chinese value-added of the iPhone X will be affected. The rest of the iPhone X’s production cost—$305.25, the sum of all parts and components imported for assembling the iPhone X—will remain constant and not be affected whatsoever. However, if President Trump decides to levy a 25% tariff on the iPhone X, the tax base will be $409.25, i.e. the sum of both Chinese and foreign value-added. To offset the tariff burden due to the foreign value-added, the yuan should depreciate much more than 25%.
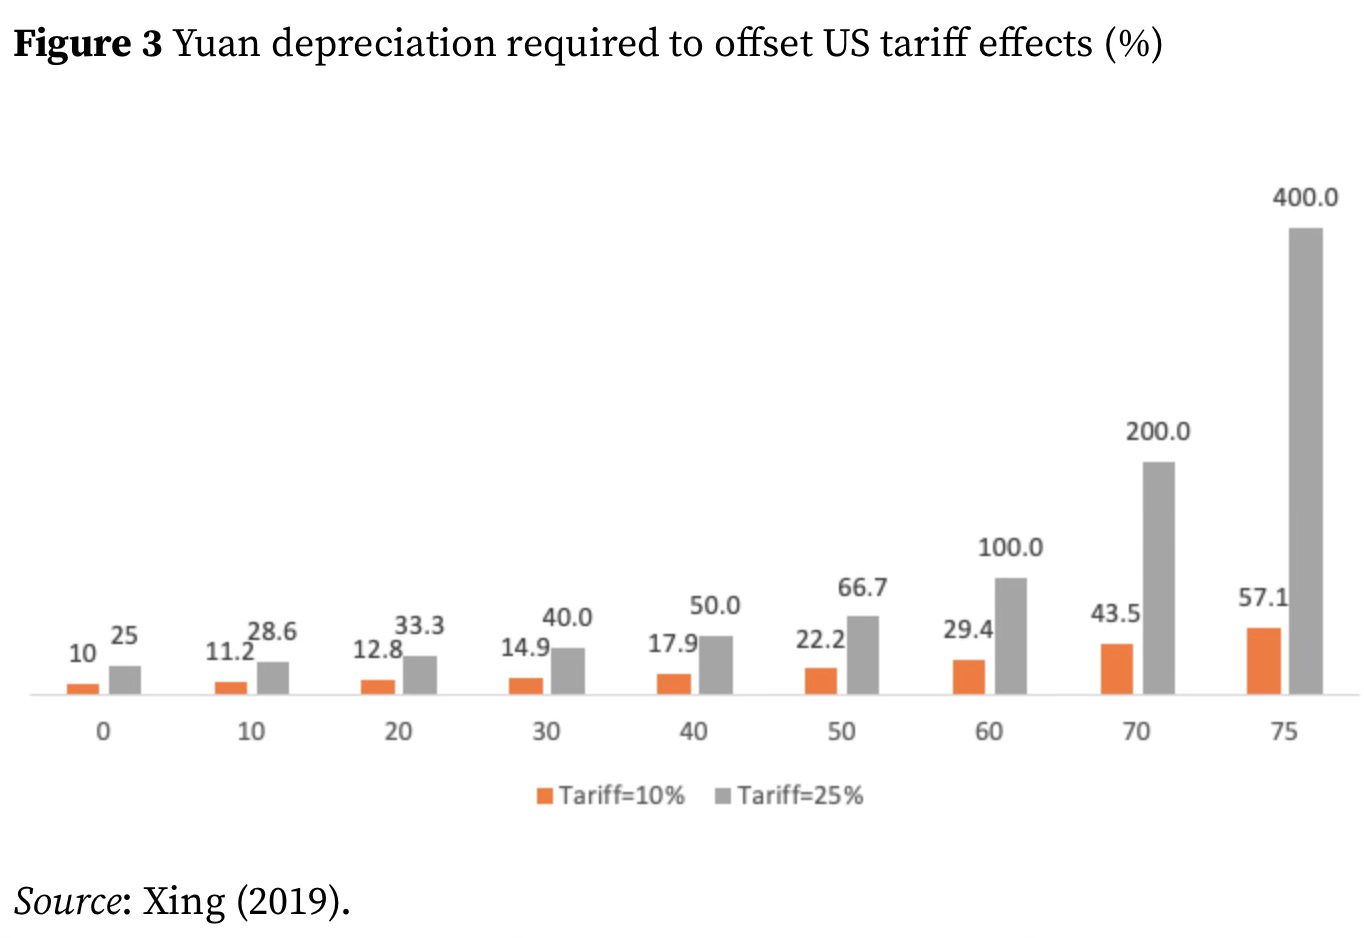
The horizontal axis denotes the percentage of foreign value-added embedded in Chinese exports.
Farok J Contractor of Rutgers Business School has updates on this analysis of the trade deficit arising purely from value-addition. His value-added numbers are much smaller than those of Xing.
For a start, he writes that the components of the iPhone 16 may be sourced from as many as 43 countries, and Foxconn receives just $14 for the final assembly.
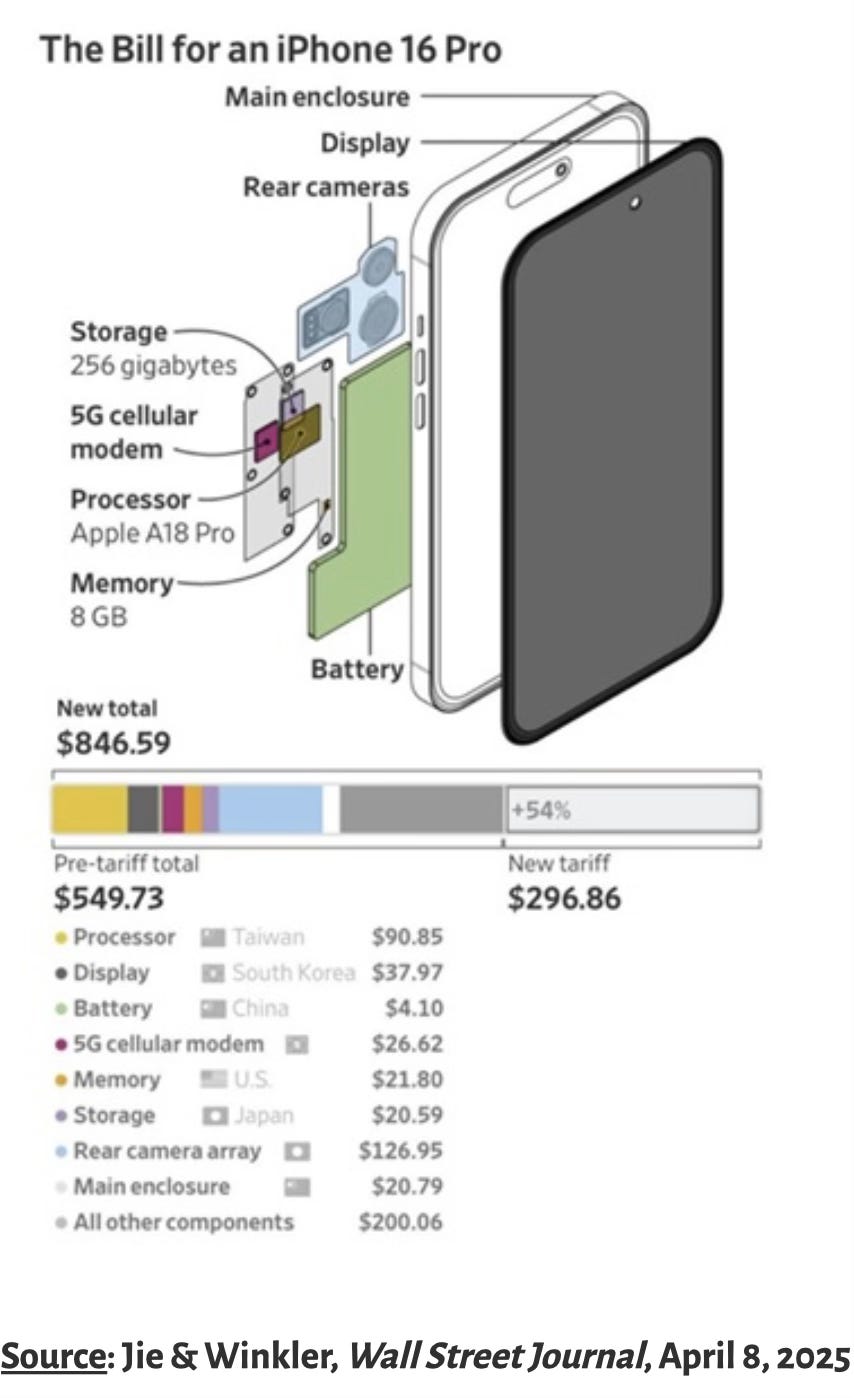
He estimates the Chinese value added in the total cost of a finished and assembled iPhone 16 of $563.73 to be just $38.89. Taking the 62 million iPhone 16 imported to the US from China, the US-China trade deficit caused by iPhone comes to $33.6 bn.
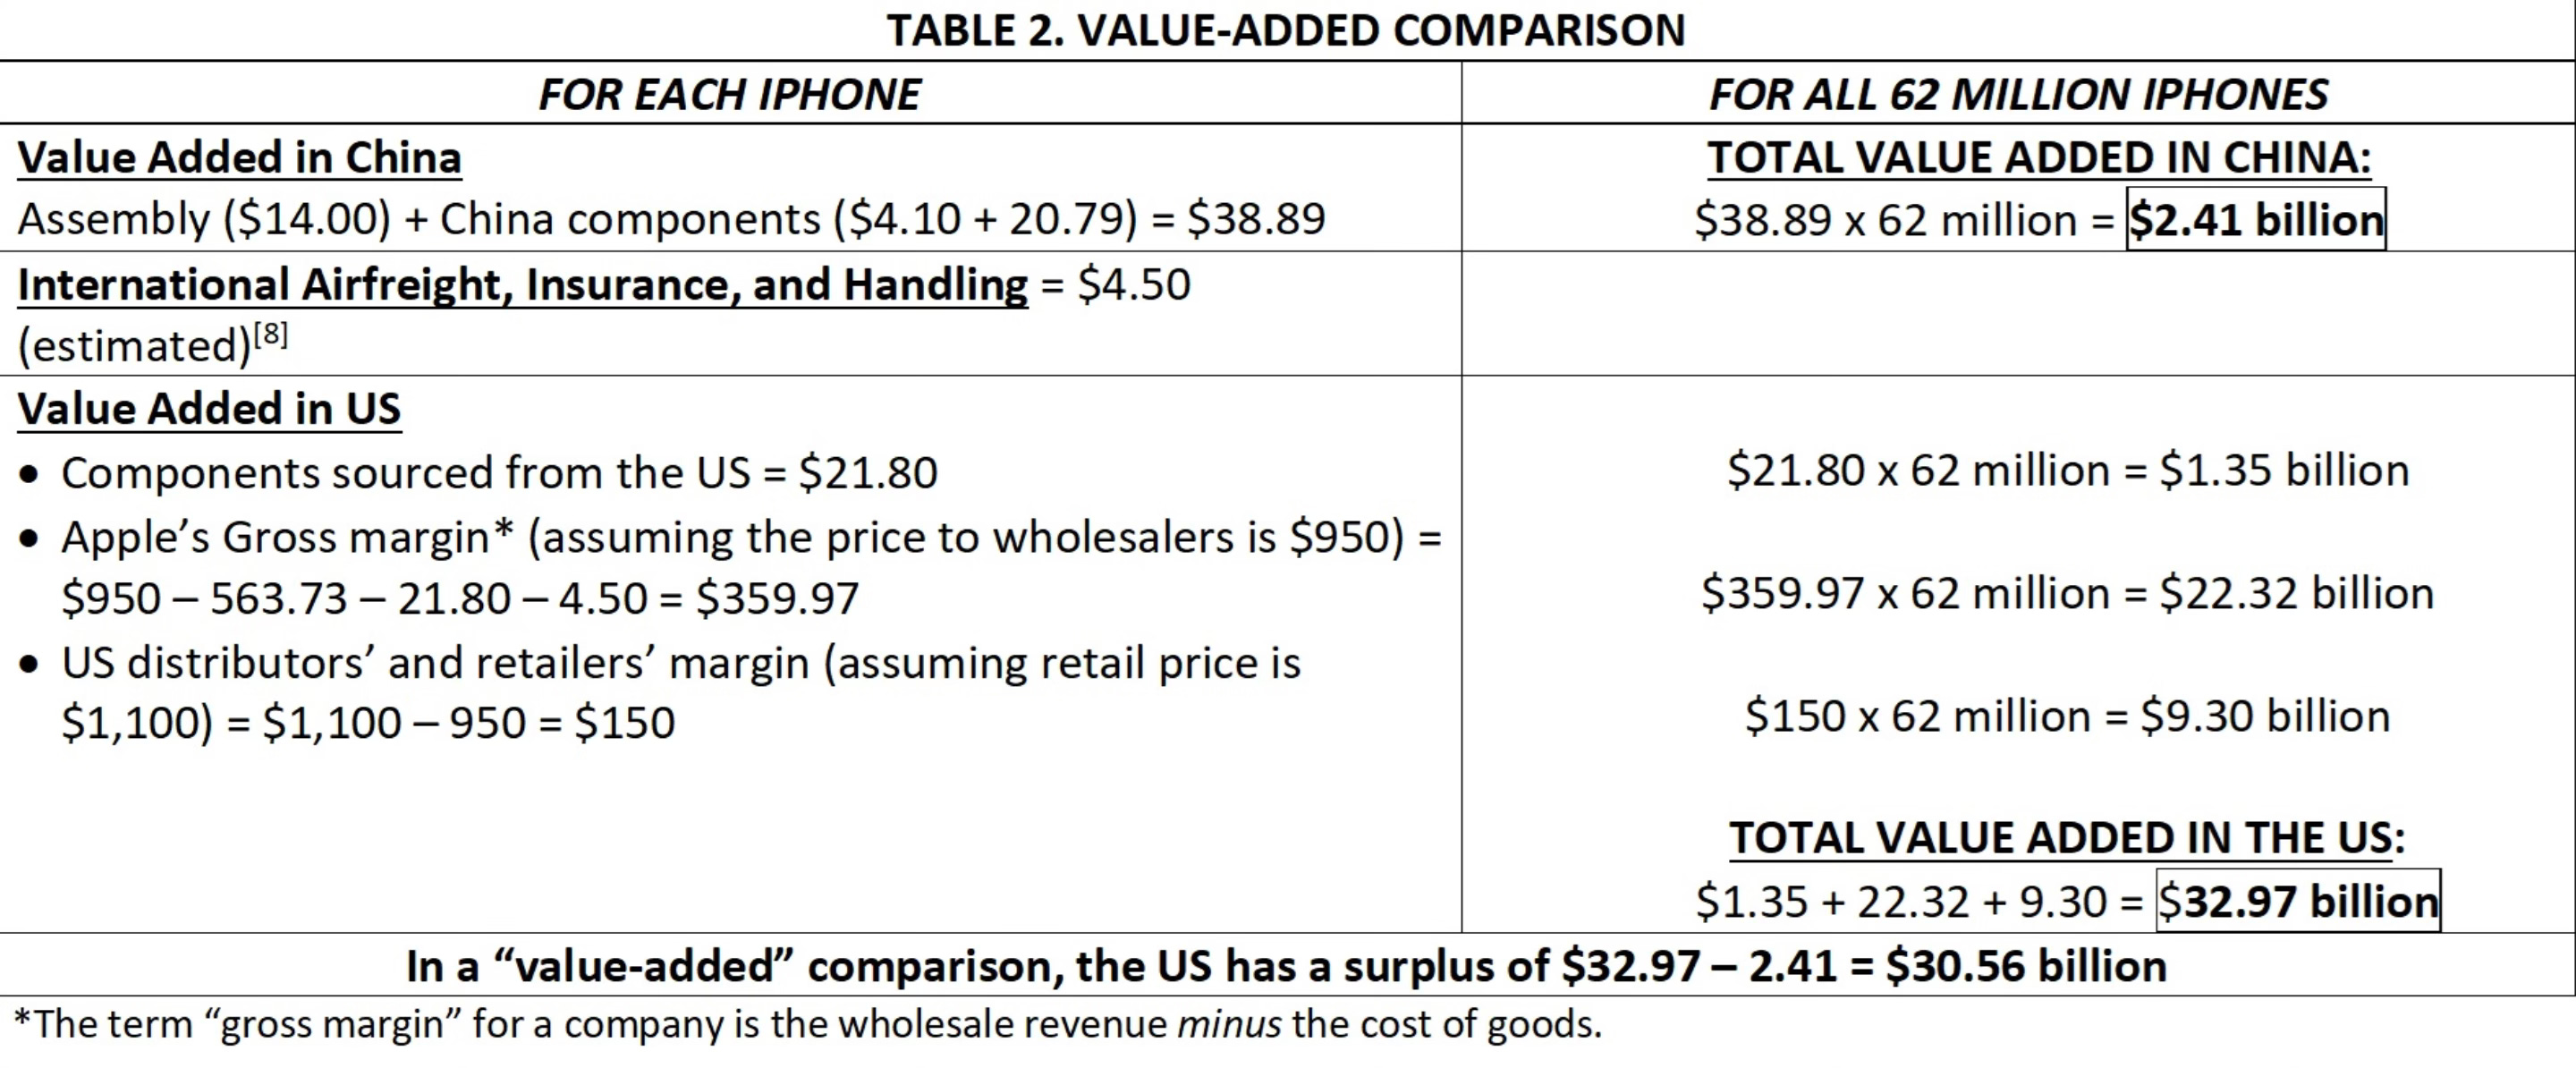
The estimates show that the value being added in China is only $2.41 billion annually (for the battery, case, and assembly of each phone). The value added in the US is for the US-sourced components ($1.35 billion), plus the gross margin of Apple Inc. ($22.32 billion) and its distributors and retailers ($9.30 billion), totalling $32.97 billion.
He points to how tariffs on the finished import is deeply distortionary.
We can see in the Apple example how the value added in China amounts to only $38.89 in an iPhone 16. But the US customs department may assess a punitive tariff on the entire $563.73 FOB import value of the phone because all the components were finally assembled in China and shipped to the US from there.
Contractor also draws attention to an important point about how much value is captured by non-manufacturing activities, raising the question of whether the iPhone is predominantly a product or a service.
Is this gross margin of $359.97 the profit per iPhone? No. The gross margin totaling $22.32 billion is used to pay for Apple’s 80,000 American employees – brilliant R&D scientists, technicians, designers, IT specialists, managers, marketers, supply chain personnel, etc. – who are talented enough to earn a median $127,000 salary annually. Only after paying for its US employees, US domestic transportation, distribution costs, marketing, and other overheads can what is left over be called “profit.” True, the great majority of Apple’s value added in the US is in high-end, valuable services – such as research, design, clever management, and orchestration of international supply chains and marketing – and not manufacturing or production, which is done abroad. Hence the earlier rhetorical question: Is the iPhone a product or a service?
Kun Cai, Zhi Wang, and Shang-Jin Wei have a new paper where they examine the trajectory of domestic value addition (DVA) in Chinese exports disaggregated on several dimensions and finds that industrial policies helped with the increase in DVA. This graphic shows the evolution of DVA of processing exports (those involving the export of goods with imported intermediate inputs, of the kind involving the iPhone) of manufactured goods.
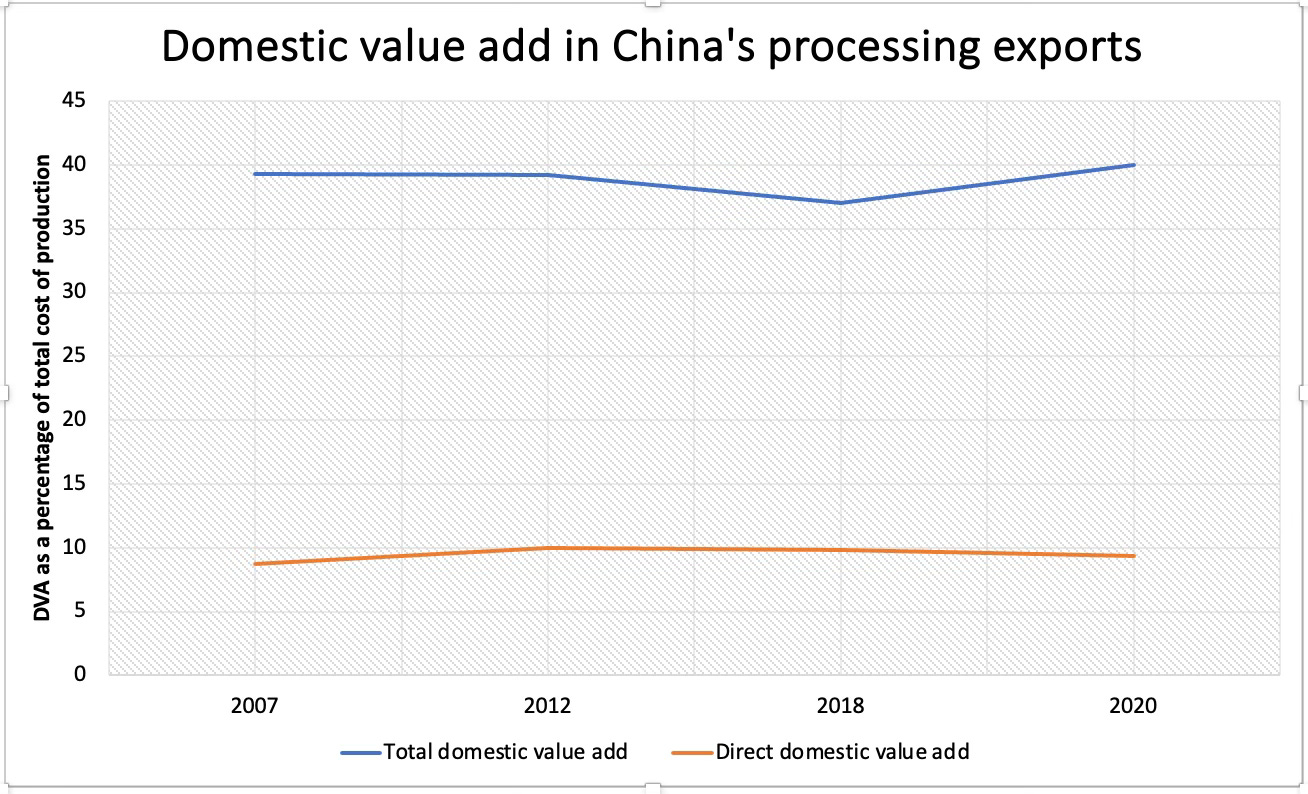
Direct value addition is that coming from the industry itself and not from other industries. The paper shows that the share of DVA did not increase sharply even over the 13 years of peak Chinese manufacturing growth.
But the biggest story in value addition is how it has helped in the emergence of Chinese component makers, contract manufacturers, and branded OEMs in the mobile phones industry and beyond. Kyle Chan writes,
Apple’s Chinese suppliers are moving up the value chain. YMTC is the most striking case. State-backed semiconductor firm Yangtze Memory Technologies Co. (YMTC) is China’s most advanced NAND flash memory maker. In 2022, Apple was planning to use YMTC’s NAND chips for its iPhones, which are reportedly 20% cheaper than its competitors’ chips… Sunny Optical… became China’s leading optical parts manufacturers… Apple started using Sunny Optical in recent years to make the main camera lens for its iPhones, which had previously come from Taiwanese companies like Largan Precision and GSEO. Interestingly, one of Sunny Optical’s rising competitors is another Chinese company, AAC Technologies, which already makes acoustic and haptic components for the iPhone… Then there are Chinese companies like Lens Technology that have grown up with Apple over time… The company got its big break making the cover glass for the first iPhones in 2007. Over time, Apple has shared manufacturing technology from foreign firms with Lens Technology, like a new scratch-resistant screen material, to help the Chinese company improve its products. Today, Lens Technology is the world’s largest supplier of touchscreens, not only for most Apple products but also for Samsung, Huawei, Xiaomi, Oppo, and Vivo…
Historically, Apple relied on the big three Taiwanese contract manufacturers to make its products in China: Foxconn, Pegatron, and Wistron. But the past few years have witnessed the rise of homegrown Chinese contract manufacturers, such as Luxshare and Wingtech, which have been taking on a growing share of Apple’s manufacturing… This supplier base, which Apple and Foxconn helped to develop, later empowered China’s own smartphone companies like Huawei, Xiaomi, and Oppo. Apple’s suppliers in China—like Samsung, SK hynix, Sunny Optical, and Lens Technology—supply similar components to its Chinese smartphone competitors. The kicker is that even as companies like Apple try to move away from China, China’s manufacturing ecosystem will continue to be supported and pushed forward by its own homegrown smartphone companies. And now these same Chinese suppliers are already supporting China’s expansion into other industries, like semiconductors and EVs.
This is a good presentation by Yuqing Xing on how China’s role in the Global Value Chains emerged over time and the role of processing exports (those mainly made of imported intermediate inputs) in Chinese exports.
The short lesson for India is this. Since its launch in 2021, the Production Linked Incentive (PLI) scheme helped create a large ecosystem of surface mount technology-based assembly in India, the starting point in the manufacturing race. But all the electronic components and PCBs, and the vast majority of electromechanical, mechanical, and other components are being imported and then assembled here. The natural next stage is to focus on the domestic manufacture of the purely mechanical non-core and then the other non-electronic components. This will require a PLI 2.0 that focuses exclusively on domestic value addition by targeting a few products and following a realistic pathway as mentioned above. I blogged about it here.
No comments:
Post a Comment