Thursday, October 31, 2024

Corporate power and elite capture - Jeff Bezos and Amazon edition

I have blogged on multiple occasions (this and this) that the biggest challenge to the social contract from widening inequality comes from the consequent inevitable capture of the political processes and the rules-making institutions.  

Jeff Bezos and Amazon are only the latest examples of how this capture plays out. Here are two illustrations from recent newspaper reports.

It has just been reported that as the owner of the Washington Post, Jeff Bezos, has intervened to prevent the paper from endorsing any candidate in the US elections for the first time in 36 years. 

The newspaper’s editorial page staff had written an endorsement of Kamala Harris for US president, but it was not published following a decision by Bezos, the Post’s owner, to change its policy on endorsements, according to an article in the paper... Sir Will Lewis, The Washington Post chief executive, outlined the reasoning behind the policy change in an opinion article in which he acknowledged that it could be read as “an abdication of responsibility” but added: “We don’t see it that way.” However, the newspaper’s guild said the decision raised concerns that “management interfered with the world of our members in editorial”... This will be the first time that the Post has not endorsed a president since 1988... Lewis, a former executive at News Corp and The Telegraph, was appointed by Bezos last year to try to arrest mounting losses and a decline in readership. People close to Lewis have said in the past that he is in regular contact with Bezos, and would not make big decisions without his input... This summer, Lewis angered Washington Post journalists after replacing the executive editor and other staff with his former colleagues from The Wall Street Journal and The Telegraph. He faced investigations from rival newspapers — as well as his own publication — into his role in a phone hacking scandal in the UK while he was a senior executive at Rupert Murdoch’s media empire. The turmoil at the Post came as Murdoch’s New York Post endorsed Trump for president, with a front-page headline declaring that the “choice was clear”... The Post’s reversal on endorsements follows a decision by Patrick Soon-Shiong, owner of the Los Angeles Times, to block an endorsement of Harris. Mariel Garza, the editorials editor, resigned in protest.

At a time of deep social polarisation, digital media-induced perversions of public debates, and the rise of populist politics, corporate takeover of media is a matter of big concern. Apart from the disturbing political consequences of such interferences, there are the motivations that drive such decisions. Sample this.

The Associated Press reported that hours after the Post announced its endorsement decision, Trump greeted executives from Blue Origin, the space company owned by Bezos that has a $3.4bn contract with Nasa to build a spacecraft to carry astronauts to the moon and back.

There would be a temptation to weigh in on the issue by arguing that the media should stay neutral and not endorse any candidate, and to that extent, Bezos is right. While that would be a logical (and correct) argument in many political contexts, it would be a disingenuous abstraction from the context in this case. 

In the US, it's common to see even people like academicians flaunting their political affiliations. In this milieu, newspapers have been ideologically aligned to political parties and, therefore, have historically endorsed Presidential candidates. The increasing flock of corporate media outlet owners like Jeff Bezos are using their ownership position to interfere in editorial decisions to favour their corporate and financial interests. 

And since the interests of corporate owners on a few issues (taxation, anti-trust, widening inequality etc.) are divergent from the wider public interest, such capture of the Fourth Estate has the potential to erode an already fraying social contract further.

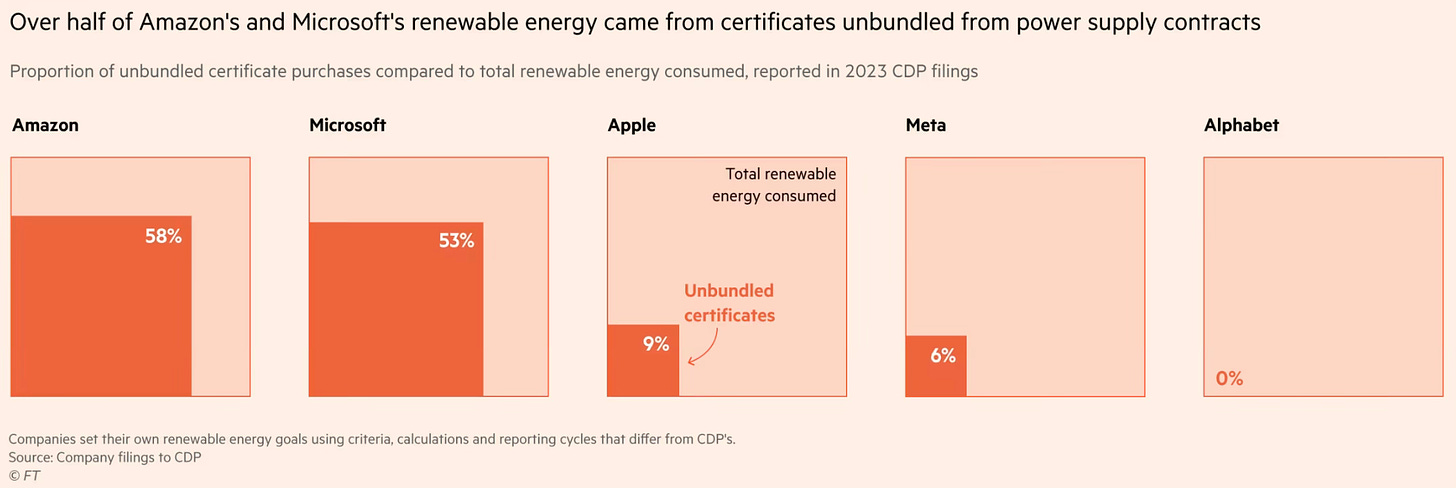
The second exhibit concerns carbon emission reduction. Being very large consumers of energy through their data centres and AI algorithms, Amazon and the Big Tech companies are keen to burnish their green credentials by hitting their net zero targets quickly and cheaply. An alternative to actually hitting the target is to manipulate the target itself and the means of hitting the target. This would involve lowering the standards and providing flexibility in measurements. The way emission reduction is calculated offers an opportunity to indulge in greenwashing. 

Consider this

Social media group Meta, for instance, says it has already hit “net zero” emissions in its energy usage. But FT analysis of its 2023 sustainability report shows that its real-world CO₂ emissions from power consumption the prior year were 3.9mn tonnes, compared to the 273 net tonnes cited in the report… Companies including Amazon, Meta and Google have funded and lobbied the Greenhouse Gas Protocol, the carbon accounting oversight body, and financed research that helps back up their positions…A coalition that includes Amazon and Meta is pushing a plan that critics fear will allow companies to report emissions numbers that bear little relation to their real-world pollution and not fully compensate for those emissions. One person familiar with the reform discussions describes the proposal as “a way to rig the rules so the whole ecosystem can obfuscate what they are up to”… A rival proposal by Google, which would require companies to offset their emissions using power generated by more closely comparable means, has been criticised by the Amazon coalition and others for being expensive and too difficult…

Tech companies invest in renewable energy but they cannot fully control how polluting the power their data centres draw from their local grid is. So under current accounting rules, the power used by a data centre during the night in a coal and gas heavy region such as Virginia can be cancelled out by buying a certificate tied to solar energy produced during the day in a region with a cleaner grid, such as Nevada… Each time a wind, solar or hydroelectric facility generates a unit of clean power, its owner can issue an energy attribute certificate, typically known in the US as a renewable energy certificate, or REC. These can either come “bundled” into a contract for clean power, or can be bought individually from a generator or market intermediaries. Companies can purchase RECs “to buy-down their environmental impact”… 

But Matthew Brander, a professor at the University of Edinburgh, says the system is akin to buying the right from a fitter colleague to say you have cycled to work, even though you arrived by a car that runs on petrol. Other experts have raised concerns about how RECs are being used to offset real-world emissions. At present, the certificates must come from the same defined geographic region as the pollution they are offsetting, such as Europe and North America, but not the same grid and not at the same time. That means the clean energy that offsets the emissions could be generated in a different country, at a different time of day — or even in the past…

But both timing and location matter in terms of real-world emissions. For example, one potential buyer hooked up to a coal-dependent grid and another on a much cleaner grid could buy the same certificate to offset one megawatt hour of power use — even though the emissions stemming from that usage will differ in each grid. The certificates are also very cheap. The average forward price of a single US renewable energy certificate to be bought in the next calendar year has been under $5 since at least 2022, commodity trader STX Group estimates… Academics and experts at Princeton, Harvard and the Greenhouse Gas Management Institute have shown that buying certificates typically did not drive either a new supply of renewables or a fall in emissions… Google’s proposed solution is to only match energy consumption with clean energy and certificates from the grids where power is consumed, and to take the time of day of its electricity use into account. Using certificates from one area while operating in another could allow buyers to understate their reliance on fossil-based electricity without addressing the emissions for which they’re physically responsible.

In this context, it’s disturbing that Jeff Bezos’ $10 bn charitable group, Bezos Earth Fund is trying to influence the operations of the carbon credit market to allow Amazon to dilute its emission reduction obligations. Amazon is lobbying to not only continue recognising carbon credits purchased from a different geography and time, but also get a higher credit for those purchased from a dirtier developing country grid than from a cleaner developed country grid. 

The Bezos Earth Fund is among the largest funders of the Science Based Targets initiative, a globally-renowned body relied upon by groups such as Apple and H&M to set voluntary standards and strict limits on the use of carbon credits to offset emissions… The SBTi is also in the middle of a process of rethinking its approach to offsets, a decision that could prove crucial to Big Tech groups at a time when artificial intelligence is resulting in a leap in emissions caused by the greater use of data centres. Experts and campaigners have grown concerned about the potential of Amazon and the Bezos fund… to influence SBTi, which holds sway over whether many corporate groups can achieve a credible “net zero” label… a former SBTi staff member raised fears about perceived influence of the Bezos fund on climate standards in a July complaint to the UK charity commission. The fund has also financed the organisations that employ three SBTi board members…

Grant-making organisations with current or historic ties to big business, such as Bloomberg Philanthropies, the Ikea Foundation or the Rockefeller Foundation are the financial bedrock of the climate standard setting and campaigning space. Google and its philanthropic arm have also funded bodies in this space. But the battle over the future of the SBTi could prove crucial to corporate efforts to achieve climate goals. Some companies have become frustrated at SBTi’s restrictions on the use of credits to just 10 per cent of emissions… The Bezos fund is also a backer of the top standard setter in carbon accounting: the Greenhouse Gas Protocol, which is also in the process of reconsidering its approach to offsets… Amazon is also seen as promoting alternatives to the SBTi’s standards… Amazon last year also contributed to the creation of a market label, Abacus, to test the quality of carbon credits… Buying credits is typically much cheaper than cutting supply chain emissions, making them a tool of choice for some chief executives in the face of pressure to keep climate promises made to shareholders.

There’s a real danger of green-washing here, to fake net zero. 

Here’s the problem. The two examples are only the latest to show that wealth brings outsized influence in the political and rules-setting process, thereby eroding democracy and the social contract itself. It’s Jeff Bezos’ outsized wealth that gives him the power to exercise such influence on a terrain that goes far beyond his business or even industry. It’s not possible through any institutional restraint or safeguards short of outright prohibitions (against, say, corporate ownership of media outlets) to insulate from elite capture. 

But, even such measures are likely to be blunt given the staggering magnitude of wealth concentration and the availability of instruments to exercise influence (electoral funding, ownership of media outlets, philanthropic foundations etc.) that allow the likes of Bezos to manipulate the political process from behind the scenes (though the likes of Elon Musk no longer make have even these pretensions) to suit their interests. 

The final word on the issue should go to this quote from Justice Louis Brandeis (HT: Matt Stoller), who famously said, "We may have democracy, or we may have wealth concentrated in the hands of a few, but we cannot have both." Just as business concentration and competition cannot co-exist, democracy and wealth concentration too cannot go together!

Monday, October 28, 2024

Revisiting India's PLI scheme

The Government of India launched the Production Linked Incentives (PLI) scheme to incentivize domestic manufacturing. Its current version seeks to incentivize firms with 6% to 2% of incremental sales over five years, on meeting certain pre-defined investment and sales thresholds. It has become the default instrument of India’s industrial policy. 

I have blogged earlier on the PLI scheme here. There’s a risk of the PLI scheme becoming a one-size-fits-all solution to a very complex problem. Let’s start with the problem India’s industrial policy is trying to solve. 

If it’s to incentivise domestic manufacturing, it immediately begs the question, how? In theory, a domestic manufacturing base could emerge from a large cohort of Small and Medium Enterprises (SMEs) or a few big firms. In the former, industrial policy would target support for SMEs and try to ensure that a few grow into large firms. In the latter, industrial policy would explicitly support a handful of big firms to grow into bigger sizes.

In reality, given the unbundled and globalised value chains across manufacturing and the importance of economies of scale in achieving global competitiveness, large firms must be given primacy in any theory of change on domestic manufacturing. Only large firms can justify making the investments required to operate at the productivity frontier in their respective industries. The large firms, in turn, encourage the emergence of networks of suppliers, who are more likely an ecosystem of SMEs. This also results in technology diffusion and industry-wide productivity improvements. 

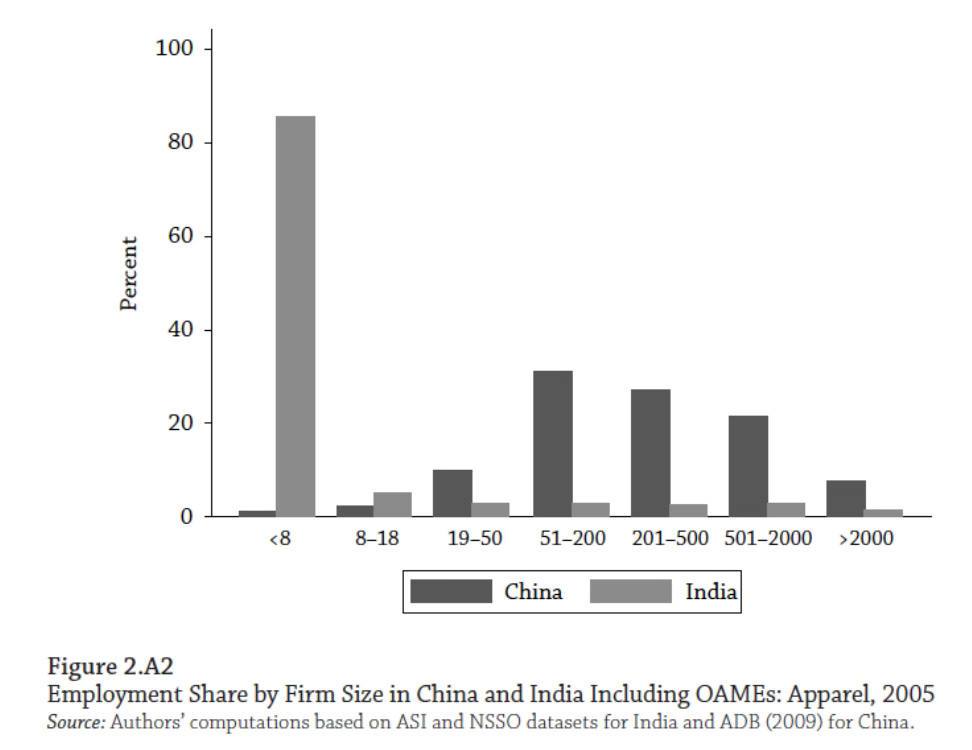
This is especially important given India’s chronic deficit of scale manufacturing and excessive concentration of small firmsThis graphic from a tweet is especially relevant, in so far as it points to the stark contrast in firm-size distribution between China and India in the Apparel industry. 

If we accept this argument, the objective of India’s industrial policy should be to facilitate the emergence of a few large and globally competitive manufacturers in important industries. I had blogged here making the case for supporting large investments. This should then become the primary objective of the PLI scheme. 

North East Asia’s economic success, which Joe Studwell has so brilliantly articulated, was built on a few globally competitive large firms and their cohort of SME supplier networks in each industry conquering export markets. There are some important features of their economic successes that could serve as insights for India as it strives to expand the base of its domestic manufacturing:

1. Industrial policy revolved around export competition. Firms were incentivized to produce for exports.

2. Industrial policy was dynamic in so far as it allowed competition to play out, and confined support to the succeeding firms and allowed the weaker firms to fail. As the Chinese saying goes, “grasp the successful, and let go of the weak”.

3. Instead of spreading scarce resources thin and supporting all firms, this also meant that industrial policy doubled down on supporting successful firms, letting them grow into large firms with massive manufacturing capabilities. The theory of change was that only large manufacturing facilities can create the component ecosystems, maximize productivity, and result in technology and learning spillovers. Big, and not small, was beautiful.

4. A complementary policy focus was to identify a few important and large import volume and value product categories and prioritize support to boost their domestic manufacturing. This too helped avoid spreading the butter thinly.

5. Another aspect of the dynamic nature of the industrial policy was to continually tweak policy to incentivize firms to move up the value chain. Start with assembly and packaging, but then shift upstream to component manufacturing (e.g., in electronic products start with other components and only then move into the semiconductor chips), and then the complete manufacturing cycle.

6. In an acknowledgement of the globalized nature of the supply chain and the gradual nature of the shift up the value chain, import duties were kept low on components to ensure the competitiveness of final export products.

Studwell’s excellent book is only just one source that articulates the centrality of these principles in the region’s spectacular export-led economic success.

India could emulate the East Asian model and orient its PLI scheme in that direction. A few suggestions in this regard:

1. Promote export competition by making in India for the world. In particular, avoid being entrapped in the sub-competitive world of making in India for India. Either mandate a minimum export threshold or provide a differentiated higher level of incentive for exporters.

2. Instead of spreading the butter thin, limit fiscal incentives to only the high value/volume or strategically important product imports in a few sectors.

3. Identify a few firms (say, the succeeding firms from the first round of PLI) in an objective enough manner, and double down on incentives and facilitation for a long enough time to help them grow big. As a corollary, it’s equally important to be explicit about letting go of the support for the weaker firms. This means PLI should be aimed at large companies to facilitate scale manufacturing (including their component manufacturers).

4. Shift away from incentivizing sales to incentivizing domestic value addition, and also increase the magnitude of incentives provided for higher shares of domestic value addition.

5. Lower the customs duties on components of those products prioritized for PLI support.  The duties can be raised gradually as a complementary lever to proportionate increases in the domestic value addition thresholds of the corresponding products.

The support for large firms should be complemented with efforts (another scheme) to support SMEs in component manufacturing for the anchor firms. The level of support required for component manufacturers might be higher and is perhaps best achieved through investment subsidies. 

Two cross-cutting requirements should accompany these principles.

a. Create a rich database with details of the market trends on production, sales, exports, imports, etc., in each market segment identified for PLI. It can be invaluable decision support in identifying winners, letting go of the weak, tweaking policy, fixing incentive rates, and generally monitoring for the realisation of scheme objectives.

b. Announcing the intent and policy pathway, captured in the aforesaid principles, in a policy document is necessary to signal predictability and shape long-term market expectations. 

Saturday, October 26, 2024

Weekend reading links

1. Interesting snippet about the investments and profits of car companies and Apple.
Ford and Apple each maintain $40bn or so in fixed assets and spend $8bn-10bn a year on capital investments. Yet in 2023 the iPhone-maker raked in more than twice Ford’s revenue and 23 times its net profit. Even if you add its $30bn in research and development (R&D) costs to its capital expenditure, Apple is matched by Volkswagen and Toyota, the world’s two biggest carmakers, neither of which sells as much. As a share of revenue, Apple’s combined R&D and capital spending, at 10%, is dwarfed by that of BYD, China’s EV champion, which last year spent 27%.

This about HP's outsourcing strategy

In 1993 Hewlett-Packard, then one of the world’s biggest makers of computer hardware, began outsourcing the production of its pcs, printers and servers. By 2000 virtually all its computers were made by third parties. In that period HP increased its revenues from $20bn to $49bn. It pulled this off while barely growing its fixed-asset base and nearly halving the share of sales going on R&D and capital expenditure, from 16-18% in 1988-92 to 9% by the end of the decade. Its global workforce shrank from 96,000 to 88,500. Net profit more than trebled. Return on equity improved from 12% in the early 1990s to an average of 19% between 1994 and 2000.

2. Johanna Deeksha has an excellent story that describes how SC/ST students who are awarded National Overseas Scholarships to pursue master's education abroad struggle with inadequate funding, procedural obstacles and delays in disbursements, and unreasonable conditionalities. 

The article is symptomatic of design problems with government schemes. One, in order to maximise coverage with a small pot of money, departments tend to spread the butter thin, thereby skimping on the unit allocation (in this case scholarship amount and the specific things to which it can be used). Second, the implementation is designed to primarily minimise the likelihood of fraud and wastage, even if it trades off against ease of access and service quality. Three, programs try to achieve multiple objectives, in the process struggling and failing with all objectives.

This is true of any program that provides government financing to individuals, companies, and organisations. The funding is inadequate at the unit-level, access is very difficult, and conditionalities are onerous. 

3. The Economist has a long read on the Space X phenomenon. Last week Space X's booster rocket, Starship, returned back to the launchpad after delivering several satellites. Space X already offers satellite-based internet services, Starlink, using over 6400 satellites located at low earth orbits (three-fourth of all satellites currently active) and is valued at $180 bn. Starship is an advanced version of Starlink's Falcon rockets that have already disrupted satellite launches by making space flight much cheaper and the rockets partially reusable. Unlike Falcon, Starship is almost fully reusable, have low turn-around times, and can put almost 150 tonnes into orbit far more than the 18 tonnes of Falcon 9. 

In the first quarter of this year the firm shot almost seven times as much into orbit as all its rivals put together, be they private firms or national space programmes.
Despite Starship’s enormous size, it is intended to be cheaper than a Falcon, too. SpaceX charges $70m to launch a Falcon 9. It hopes to drive down the cost of a Starship launch to $10m. The eventual goal is to transform the rocket business into something more like the aircraft one, via the mass production of a vehicle that is designed to be refuelled quickly and flown again and again. Mr Musk’s aspiration is that the “Starfactory” that SpaceX is building at its headquarters in Texas will churn out a new Starship every day, and that the firm’s fleet of them will fly hundreds or even thousands of times a year.
Space X threatens to upend the telecommunications market.
Its distinctive white antennae have popped up everywhere from remote schools in the Amazon to the bunkers and trenches on the front lines of the war in Ukraine... Traffic through its networks has more than doubled in the past year, as SpaceX has signed deals with cruise lines, shipping firms and airlines. Modelling by Quilty Space, another firm of analysts, suggests that Starlink’s revenue will hit $6.6bn this year, up from $1.4bn in 2022. That is already 50% more than the combined revenue of ses and IntelSat, two big satellite-internet firms that announced a merger in April...

Using satellites to provide internet access is not a new idea. Such firms as Hughes, ses and ViaSat already offer exactly this service, bouncing signals from subscribers back down to ground stations and on to the wider internet. But they rely on small numbers of satellites mostly in high orbit. That allows a single satellite to see a large portion of Earth’s surface and thus to serve many customers at once. Unfortunately, flying so high also means that signals take a noticeable amount of time to get up to the satellite and back down to Earth. That makes remote working, video calls and online gaming a pain. And having lots of people share one satellite risks congestion. For that reason... satellite internet has been seen as a last-resort option, useful only when nothing better is available. 

Starlink’s satellites fly in very low orbits, around 500km up. That slashes transmission delays, allowing Starlink to offer a connection similar to ground-based broadband. The trade-off is that each satellite can serve only a small area of Earth. To achieve worldwide coverage you therefore need an awful lot of satellites... SpaceX has firm plans to deploy 12,000 satellites, and has applied to launch as many as 42,000... One consequence of the satellites’ low orbits is that each has a lifetime of only around five years, before the tenuous atmosphere at that altitude drags it below orbital velocity. To maintain a constellation of 40,000-odd satellites would require replacing about 8,000 of them a year. Cheap launch costs are not the only secret of Starlink’s success. 

Vertical integration helps, too. SpaceX makes its own satellites and the high-tech antennas it sells to its customers... by making so many satellites and antennas, the firm can drive unit costs down... each antenna cost the firm around $3,000 to make in the early days... Last year SpaceX said it had managed to drive the cost of production below $599, the price at the time... A system made of thousands of comparatively small satellites rather than a handful of big ones can also be more easily tweaked and upgraded. Starlink’s newer satellites, for instance, sport laser links that allow them to talk to each other directly. That allows traffic to be routed between satellites before it is sent back down to Earth. That should limit the number of ground stations that Starlink needs to build—an important saving.

People living in remote areas, unconnected by terrestrial networks, governments for security purposes, shipping and cruise lines, airlines, and mines in remote areas, are among the likely customers for Space X's services. It currently charges a household $120 per month, clearly unaffordable for the vast majority of unconnected people across developing countries. 

4.  US Big Pharma tax avoidance fact of the day

In 2023, seven of America’s largest pharmaceutical companies reported losing a combined $14 billion on their US operations while earning $60 billion abroad. The absence of reported profits in the US translates directly into a loss of federal tax revenues.
5. Good read in Scroll.in on how DBT for school uniforms and textbooks introduced in Bihar in 2017 and withdrawn in 2021 not only struggled to make an impact but left students worse off.

6. Andy Mukherjee writes about the Hyundai Motor Company's IPO, India's largest ever,
Hyundai’s parent offered to sell as much as 17.5 per cent of its local unit not because anyone twisted its arm. The Korean firm did it to take advantage of India’s sizzling valuations. Suzuki Motor Corp. is worth $20 billion on the Tokyo stock exchange. Its Indian unit, in which the Japanese automaker owns a little over 58 per cent, has a market capitalization of $45 billion in Mumbai. Hyundai’s compatriot LG Electronics Inc. is also reported to be preparing for a potential IPO of its Indian unit. Whirlpool Corp., the American home-appliances giant, has already offloaded 24 per cent of its unit headquartered in Gurgaon, near New Delhi... Family-controlled enterprises account for 75 per cent of India’s GDP. But while a few of them have created enormous shareholder value, many more have destroyed wealth with impunity. Multinationals, generally more conservative with their investments, do reward investors: Hindustan Unilever Ltd. paid out 96 per cent of its last full-year profit. ITC Ltd., formerly Imperial Tobacco Co., distributed 84 per cent of its earnings as dividends.

7. Debashis Basu points to some trends about the Indian economy.

Growth in collection from goods and services tax (GST) fell to 6.5 per cent, its lowest level in 40 months. At 6.5 per cent, GST collection barely tracked inflation, which means there was no volume growth. The trade deficit widened to $29.7 billion in August from $24.2 billion a year earlier. India’s merchandise exports, its weakest spot and a tell-tale sign of India’s poor competitiveness, declined to $34.7 billion in August from $38.3 billion in the same month last year. The annual gross domestic product (GDP) growth rate is down from 7.8 per cent to 6.7 per cent. The index of industrial production (IIP), which tracks the output of eight core industries, such as coal, oil, and electricity, was negative in August for the first time in three years. In September, car sales fell by 19 per cent over the same period last year...

The PMI hit an eight-month low at 56.5 in September from 57.5 in August. The services PMI fell to 57.7 points in September to hit a 10-month low; it was 60.9 points in August 2024. Home loan disbursement was down 9 per cent in the first quarter, auto loans were up 2 per cent, and personal loans increased just 3 per cent. Credit disbursement by fintechs is stagnant. In April-August, diesel sales rose just 1 per cent year-on-year (Y-o-Y). A slowdown seems to have set in.

8. The Great Latin American Stagnation.

Income in the pink tide nations of Mexico, Brazil, Colombia, Chile and Peru is on average around a quarter that of the US, having gained no ground over the past 10, 50 or even 150 years.

9. The US VC industry facts of the day

New VC investments rising from $100 billion in 2014 to a peak of $700 billion in 2021. Today, new investments are around $350 billion — while this is half of the peak, it still represents a historically healthy level of investment. The issue is more with exits, which have collapsed to less than $75 billion per year in the US after peaking at over $700 billion 2021. Exits are down as private equity interest has been subdued due to higher rates, and the tougher regulatory regime in both the US and the EU makes it difficult for large technology behemoths to buy smaller startups. The initial public offering (IPO) market for new technology listings has also collapsed. Amazingly, since calendar 2022 onwards, there have been only 14 technology listings in the US, averaging fewer than six per year... Founders today can execute large secondary sales of their private stock to VCs and growth equity firms, ensuring liquidity not only for themselves but also for seed investors and employees... 
Many funds are still stuck with high-flying IPOs they bought in the last few years, which are still trading below issue price. If we look at the record of all technology IPO listings in the US since 2020, they have, on net, destroyed $140 billion in market value, with the median IPO down 40 per cent from its offer price. Thus, we have today almost 1,500 unicorns (unlisted companies with valuation over $1 billion), there are more unlisted technology companies with a valuation of greater than $1 billion than listed tech companies! This is an IPO backlog of over 25 years! Obviously, many of these companies will never list, nor are they actually worth billions. Due to the continued high rate of VC investment and very poor exits, the industry is today running a record cash negative, with the lowest distributions back to their investors on record. This has not always been the case; from 2010 to 2021, cash flows were positive every year except one, meaning the industry paid back to investors more than it invested. These record low distributions are creating a cash flow squeeze for many of the endowments, foundations, and pension plans that have historically been the largest investors into VC.

10. AK Bhattacharya has some useful datapoints on India's laudable tax revenues trajectory over the last quarter century.

According to an analysis by the Central Board of Direct Taxes (CBDT), the share of direct taxes in gross domestic product (GDP) in 2023-24 rose to a 24-year high of 6.64 per cent. In 2000-01, this number was about half, at 3.25 per cent... the decline in the share of indirect taxes in GDP... from 5.62 per cent of GDP in 2000-01, the share of indirect taxes fell to 5.11 per cent in 2023-24. The Union government’s gross tax collection efforts, therefore, rose from 8.8 per cent of GDP in 2000-01 to 11.7 per cent in 2023-24. Not only did gross tax collections maintain a steady growth rate in this period, but their composition also got better, with direct taxes accounting for 57 per cent of gross collections last year, up from about 36 per cent in 2000-01... The Centre’s annual expenditure at over 18 per cent of GDP was quite substantial in 1990-91. Over the last 34 years, this share has declined to about 15 per cent of GDP. The ability to have squeezed government expenditure even as the size of the economy kept rising has not received adequate appreciation... In 1990-91, the share of capital expenditure was relatively high at over 5.5 per cent of GDP and revenue expenditure accounted for 12.8 per cent of GDP. Worryingly, capital expenditure saw a steady fall over the next three decades and by 2019-20, its share in GDP fell to as low as 1.67 per cent of GDP... Barring the Covid year of 2020-21, when subsidy expenditure rose to a record level of 3.8 per cent of GDP, the outgo on subsidies has seen a southward turn, reaching a level of 1.5 per cent of GDP in 2023-24... The Centre’s efforts at collecting non-tax revenues have been sub-optimal. Last year, they were estimated at 1.36 per cent of GDP, down from a record high of 2.93 per cent in 2001-02.

11. It's reported that TSMC has achieved four percentage points higher production yield in its 4 nm chip production facility at Arizona, marking a major achievement for the chip maker in its efforts to establish chip manufacturing in the US. 

The latest yield advancement is notable for TSMC because it has historically kept the most advanced and efficient plants in its home island of Taiwan. Its Arizona site got off to a rocky start, as the company couldn’t find enough skilled staff to install advanced equipment and workers struggled with safety and management issues. TSMC reached an accord with construction labor unions late last year. The chipmaker originally planned to have its first Arizona plant start full production in 2024, but pushed back the target to 2025 over the labor issues. It later delayed the start date for its second fab to 2027 or 2028, from an initial target of 2026. That fueled concerns that the company might not be able to make chips in the US as efficiently as in Taiwan.

12. Business Standard points to a troubling trend with corporate income in India. 

For the corporate sector, the share of passive income has increased from 16.6 per cent in AY 2016-17 to 30.7 per cent in AY 2023-24. This sharp rise is primarily driven by increases in long-term capital gains and other incomes. Between AY 2016-17 and AY 2023-24, income from business for companies has increased at an average rate of 14 per cent per annum, significantly lower than 35 per cent growth reported for long-term capital gains. The surge in capital gains and in incomes from other sources for corporations could indicate a shift in corporate preferences in favour of financial investments, rather than physical or what are often referred to as productive investments. The sharp increase in stock market valuations during this period — average annual growth of over 12 per cent — alongside muted demand for goods and services attributable to economic shocks could induce such a shift. Poor recovery in private capex in the post-Covid period seems to reflect the challenges of this new evolving scenario. An issue of concern in this emerging context is whether a sustained bull run in the capital markets could act as a hurdle to encouraging real sector investments in the economy.
13. Finally, Yuval Noah Harari has a good oped in FT about AI algorithms ruling the world. The article has a nice description of how writing was transformative.
Consider, for example, the impact that written documents and the bureaucrats who wield them have had on the meaning of ownership. Before the invention of written documents, ownership relied on communal consensus. If you “owned” a field, it meant that your neighbours agreed it was your field, through both their words and actions. They didn’t construct a residence on that field, and didn’t harvest its produce, unless you allowed them to. The communal nature of ownership limited individual property rights. For example, your neighbours might have agreed that you had the sole right to cultivate a particular field, but they did not acknowledge your right to sell it to foreigners. At the same time, as long as ownership was a matter of communal consensus, it also hampered the ability of distant central authorities to control the land. In the absence of written records and elaborate bureaucracies, no king could remember who owned which field in hundreds of remote villages. Kings therefore found it difficult to raise taxes, which in turn prevented them from maintaining armies and police forces. 

Then writing was invented, followed by the creation of archives and bureaucracies... Ancient Mesopotamian bureaucrats used little sticks to imprint signs on clay tablets — which were basically just chunks of mud. But in the context of the new bureaucratic systems, these chunks of mud revolutionised the meaning of ownership. Suddenly, to own a field came to mean that it was written on some clay tablet that you owned that field. If your neighbours had been picking fruit there for years, and none of them ever said that piece of land was yours, but you nevertheless managed to produce an official chunk of mud that said you owned it, you could enforce your claim in court. Conversely, if the local community acknowledged that you owned a field, but no document gave it an official stamp of approval — then you didn’t own it. The same is still true today, except that our crucial documents are written on pieces of paper or silicon chips instead of on clay. Once ownership became a matter of written documents rather than communal consent, people could begin selling their fields without asking permission from the neighbours. To sell a field, you just transferred the crucial clay tablet to someone else. But it also meant that ownership could now be determined by the distant bureaucracy that produced the relevant documents, and perhaps held them in a central archive. The path was opened for levying taxes, paying armies and establishing large centralised states. The written document changed how power flowed in the world, and gave enormous clout to bureaucrats such as tax-collectors, paymasters, accountants, archivists and lawyers.

He points to the prospects of this world

In the coming years, millions of AI bureaucrats will increasingly make decisions about the lives not just of lions, but also of humans. AI bankers will decide whether to give you a loan. AIs in the education system will decide whether to accept you to university. AIs in companies will decide whether to give you a job. AIs in the court system will decide whether to send you to jail. Military AIs will decide whether to bomb your home.

Thursday, October 24, 2024

Water privatisation in UK and the roles of Ofwat and investors

The UK water utilities are a great case study on the problems of privatising public facilities. I have blogged on multiple occasions (hereherehere, and here), and this post updates the numbers based on a recent NYT article

It has the latest balance sheet of water utilities privatisation in the UK 

When the British government, under Margaret Thatcher, privatized water utilities, it went further than many other countries had. The water and sewage assets were transferred to companies with limited liability and cleared of debt. Shares were floated on the stock exchange, but most of the companies are now privately held, a relatively rare ownership model, though some countries or cities have contracts with private companies for the management of the water systems…

Across England and Wales, insufficient investment in the sewage infrastructure and the water supply has led to a crisis that has been brewing for years. Now, more people are putting the blame on the ownership of the water utilities, which are regional monopolies, predominantly owned by multinational conglomerates and asset managers, including sovereign wealth funds and pension funds. Critics argue that shareholders in the water companies have received billions of pounds in dividends since privatization but failed to put enough money back into the water system while piling up debt…

Thames Water, which has debt of about £15 billion, or $20 billion, said it would run out of cash by May if it was unable to raise more equity. Its shareholders, who own the company through Kemble Water Holdings, include a Canadian pension fund, Abu Dhabi’s sovereign wealth fund and a British pension plan for university staff, and they have been reluctant to inject fresh cash amid clashes with regulators over how much to raise customers’ bills... The average utility bill in England and Wales is £441 a year, higher than some of their European neighbors, like France, but lower than others, such as Norway. Ofwat has proposed increasing consumers’ bills by more than a fifth on average over the next five years.

And the public reaction to this state of affairs has swung towards nationalisation.

The 10 water utilities in England and Wales, which were privatized in 1989 during a wave of deregulation and free-market liberalization, have become a target of public ire over polluted waterways and rising household bills. The number of people getting sick from the water is growing… In June, the Henley Town Council called for the nationalization of Thames Water, which serves about 16 million people, saying the company’s track record has been “beyond concerning.”.. More than 80 percent of Britons said water companies should be run in the public sector, according to a poll in July. In Scotland and Northern Ireland, the water companies are owned by their governments. In 2001, one of Wales’s water companies became a nonprofit organization.

The market is a good mechanism for efficiently allocating general goods and services. But when the goods and services are essentials for human survival and especially when monopolists provide them, the market has been consistently found to fail the allocation test. This is why utilities are tightly regulated and outright privatisation is rare in sectors like water, sewerage, mass transit, and electricity distribution. In fact, the water and sewerage sector is publicly owned in most of the world. There’s a comparator in the UK itself

The Scottish system has remained under public ownership and Scottish Water has invested nearly 35% more per household in the system since 2002 than counterparts south of the border, while it charges 14% less for water. It is reported that the highest paid director of Scottish Water took home less than £400 000 in pay and benefits in 2021—a fraction of what his English counterparts receive.

The UK water utilities are also a good case study on foreign investments in infrastructure sectors like water

Famous investors in Thames Water included Australian Macquarie Capital Funds, until 2017 when they sold their share. Estimates at the time said the fund made between 15.5-19% in annual rate of returns, however, it also faced criminal fines of up to £20m in 2017 for leakages affecting the Thames. In September 2021 Macquarie re-entered the UK private water infrastructure market by investing £1.1bn in equity into Southwestern Water group committing to delivering reliable services and protecting and improving health of rivers and sea… Other well-known financial service companies include Blackrock, Lazard and Vanguard (Severn Trent, United Utilities and South West Water), Germany’s Deutsche Asset Management an US based Corsair Capital (Yorkshire Water). JP Morgan Asset Management owns 40% in Southern Water, and Australian Colonial First State Global Asset Management owns stakes in Anglian Water, Severn Trent, United Utilities and South West Water. Apart from these companies there are numerous other foreign investors from the Arab Emirates, Kuwait, China and Australia (Thames Water), a Malaysian company (Wessex Water), and Cheung Kong Group (Northumbrian Water), an in the Cayman Islands registered fund associated with Hong Kong’s richest person, involved.

The role and influence of foreign investors can be understood best when looking at the Thames Water external shareholders. Canada’s largest shareholder pension fund, Ontario Municipal Employees Retirement System (OMERS), holds over 30% in the water and sewage systems company. The fund had net assets of $129bn at the end of 2023 and invested in Thames Water in 2017. The investment was made using several investment vehicles based in different locations, such as among others Singapore. Close to 10% in the company is held by Infinity Investments SA, a subsidiary of the Abu Dhabi Investment Authority who invested in 2011. The fund also has done an $800m investment into Statoil, a Norwegian natural gas transport company. In 2012, China Investment Corporation, one of the biggest sovereign wealth funds in the world has acquired a 9% share in Thames Water. Further foreign institutional investments include Queensland Investment Corporation, a government owned Australian investment firm (5.3%), and Stichting Pensioenfonds Zorg en Welzijn, the second largest pension fund in the Netherlands… more than 70% of the privatised water industry in the UK is owned by foreign investment firms, private equity, pension funds and, in some cases, businesses based in tax havens, which raises concerns about the public utilities companies acting in the interest of shareholders rather than general population.

While foreign investments, in general, are not bad, as I shall discuss later, the nature of those investors might be a problem in essential public utilities. This is especially since their interests are unlikely to be aligned with the sustainability of the business and would be seeking to maximise their returns. 

Apart from the general consumer welfare decreasing dynamics of monopoly markets, some important reasons for the market failure are the propensity of utility operators to skimp on investments and maximise returns. All these get amplified with private equity ownership, besides engendering other perverse trends like asset stripping by using leverage to pay dividends. Further, their relatively short investment horizons mean that their primary objective as owners is not to build enduring companies but to maximise the returns during their investment tenures and then pass the parcel to the next investors.

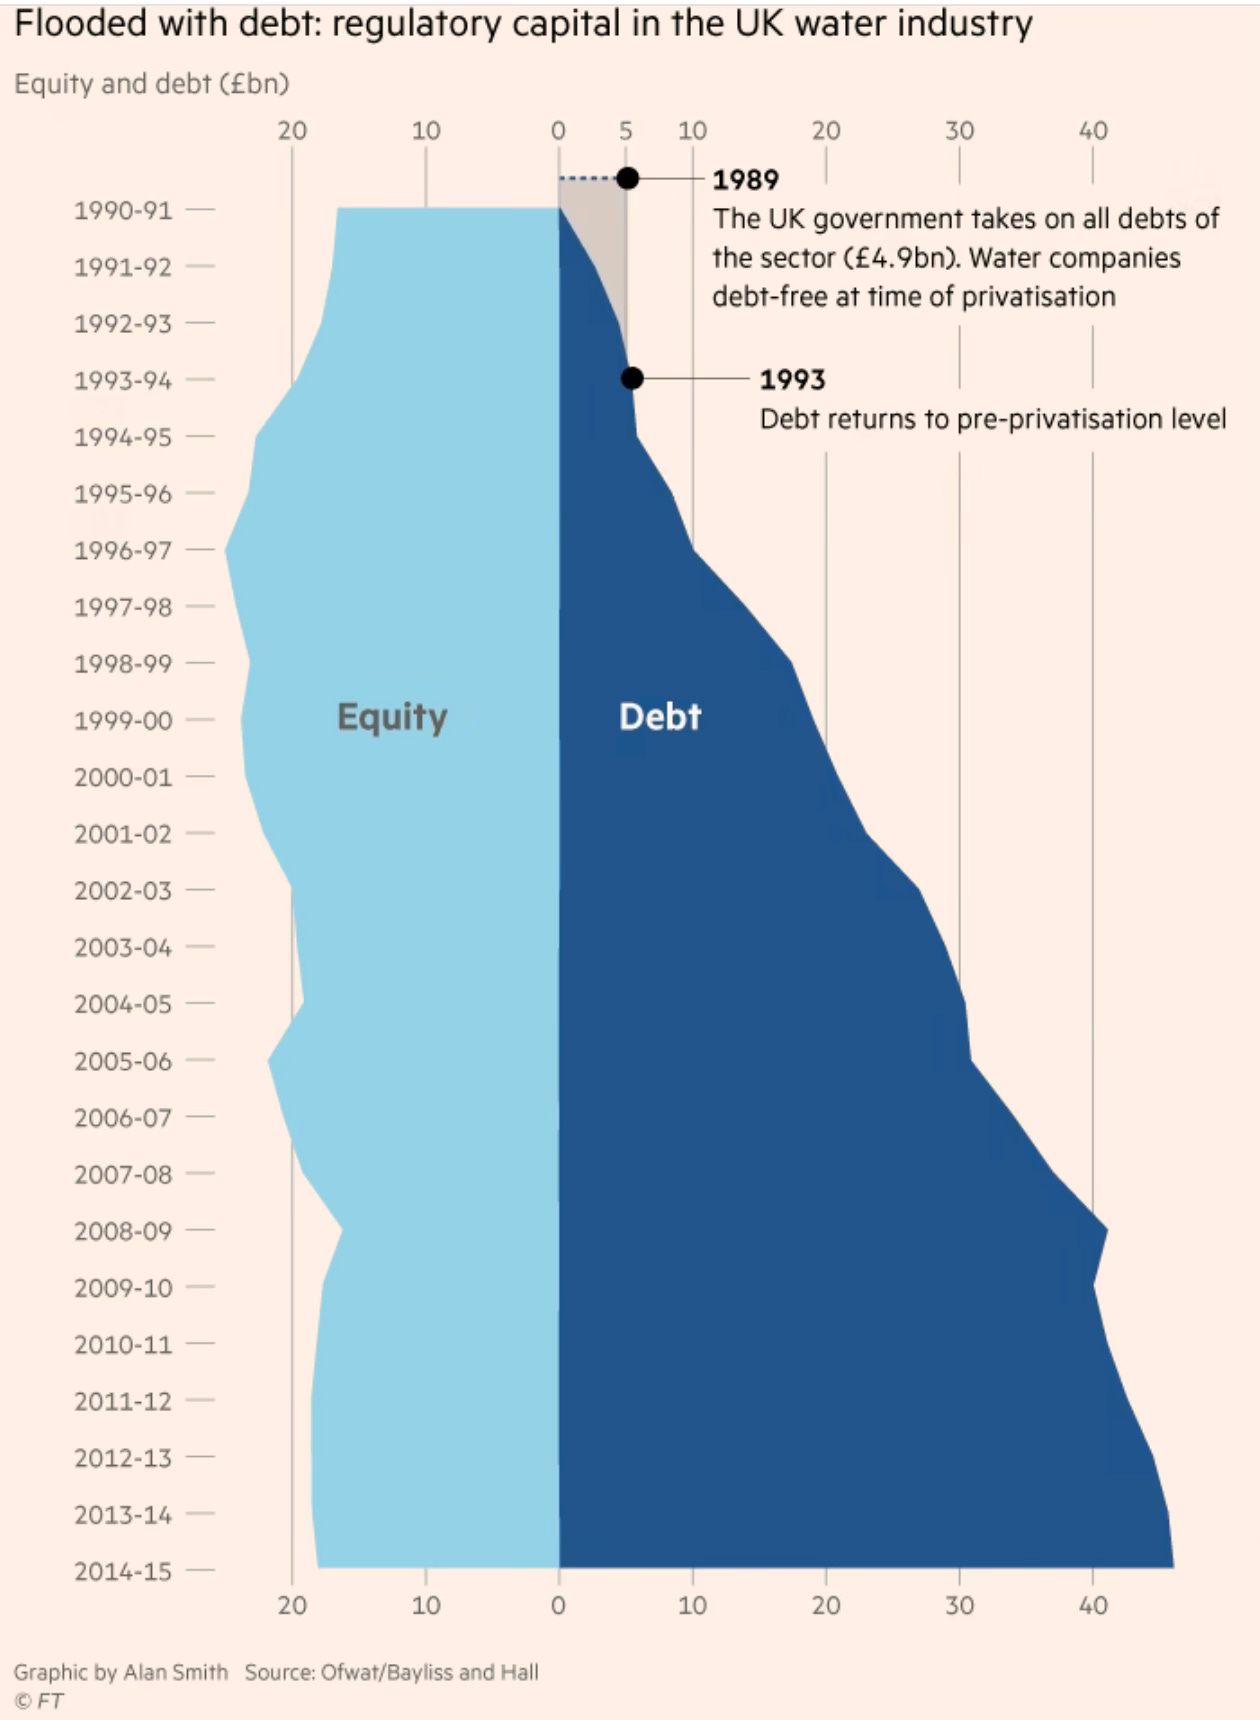
Consider the accounts of the water utilities. When the 16 water companies were privatised, the government wrote off all their debts of £4.9 bn and injected a green dowry of £1.5 bn to meet investment requirements. Since being handed over debt-free and till March 2023, they assumed £64 bn in debt, paid out £78 bn in dividends, and invested £190 bn

In other words, in the 32 years since privatisation, the owners of the UK water companies took out or created obligations to the tune of £142 bn while investing only £190bn. Alternatively, for every pound invested from internal accruals, 62 pence was returned to owners, or nearly two-fifth of internal accurals was paid out as dividends. 

A study in 2018 by Karol Yearwood of Greenwich University has this picture of Thames Water.

The company is now owned by a consortium of Private Equity and financial investors, having previously been in the hands of the infamous Macquarie Group since 2006. Shockingly, Macquarie borrowed more than £2.8bn to finance purchase, and later supposedly repaid £2bn of the debt through new loans raised by Thames Water through a subsidiary in Cayman Islands, effectively transferring the purchase costs to customers. Furthermore, in those 10 years, debt increased 2.3x times (from £4bn to £10bn), dividends averaged 270m per year, yet between 2011 and 2015 they paid no tax.

This article examines the Thames Water case in detail. 

There are two defining graphics about how the UK water privatisation went wrong. The first shows how the utilities kept piling up debts even as their equity base remained the same (or even depleted). 

The second shows that even as they were accumulating all the debt, the private companies were generating sufficient cash to meet their investment needs without taking on debt. In fact, they could have paid out an average of £1.5bn in annual dividends without taking any debt at all. Instead they raised debt and paid out more, thereby causing the current debt pile. It’s no coincidence that £1.5bn of customers’ money is spent yearly by paying interest on these loans.

The two graphs beg the question as to what was Ofwat doing all along. The trends were hard to miss. But Ofwat choose not to act. It is hard not to feel that Ofwat’s monitoring systems failed abjectly in raising red flags to rein in such practices. British water privatisation is as much a story of regulatory capture as it is of the avariciousness of private capital. 

Ofwat’s role in the general failure of supervision and regulation has been a matter of debate for some time now. The British government has just constituted a commission to carry out a “root and branch” assessment of Ofwat and consider all options for the regulation of the industry. The Environment Secretary has blamed the regulator and lack of proper oversight for the failure of the water sector. The Commission, headed by former BoE Deputy Governor Jon Cunliffe, will “will look at strategic planning, protecting consumer interests, and how to come up with rules that hold companies to account without putting off potential investors.” 

Ofwat is undertaking its latest five-year price reviews for the water utilities, on price determination for the period till 2030. The industry sought a 29% increase and got an interim direction for a 19% rise. 

The graphs also draw attention to the point that I have repeatedly made in this blog on the importance of the nature of investors in regulated sectors like utilities. These are low but stable return sectors, appropriate for investors satisfied with low returns but seeking to diversify their returns. 

It’s difficult to believe that private equity firms meet this requirement. PE firms are not known for their commitment to stakeholder responsibilities and for building enduring companies. They have a single-minded focus on maximising returns, which leads them into questionable practices like asset-stripping and loading up their portfolio companies with excessive debt. Their emerging track record across sectors point to a consistent practice of pass-the-parcel after squeezing out all possible returns from their investees. Monopoly public utilities like water and sewerage cannot be left exposed to such practices. 

Instead of targeting specific categories of investors like PE or foreign funds in general, it may be useful for policy makers to put in place conditions that align the incentives of investors and also safeguards against asset stripping by private investors in regulated infrastructure sectors. This is an important requirement given the pass-the-parcel nature of dispersed private ownership associated with those like the kind of investors in UK water utilities. 

The objective should be to ensure that investors be held accountable for the life-cycle of the infrastructure asset by mandating certain fiduciary responsibilities during their ownership of the asset. On the positive side, there should be adherence to clear investment responsibilities, service level standards, and maintenance of asset quality levels. On the negative side, there should be debt-equity ratio ceilings, caps on returns, and close watch on the finances of the asset holding company. 

It’s also for this reason that private participation in public infrastructure like utilities, roads, mass transit etc., should be confined to simple concession contracts of services with tight caps on returns, including all kinds of payouts. It should be made explicit that the investors in such investments are fiduciaries and their value proposition is only stability of returns and not high returns. 

Monday, October 21, 2024

China economy summary - October 2024

This is the latest in the series on the Chinese economy - hereherehere, and here. See also this and this

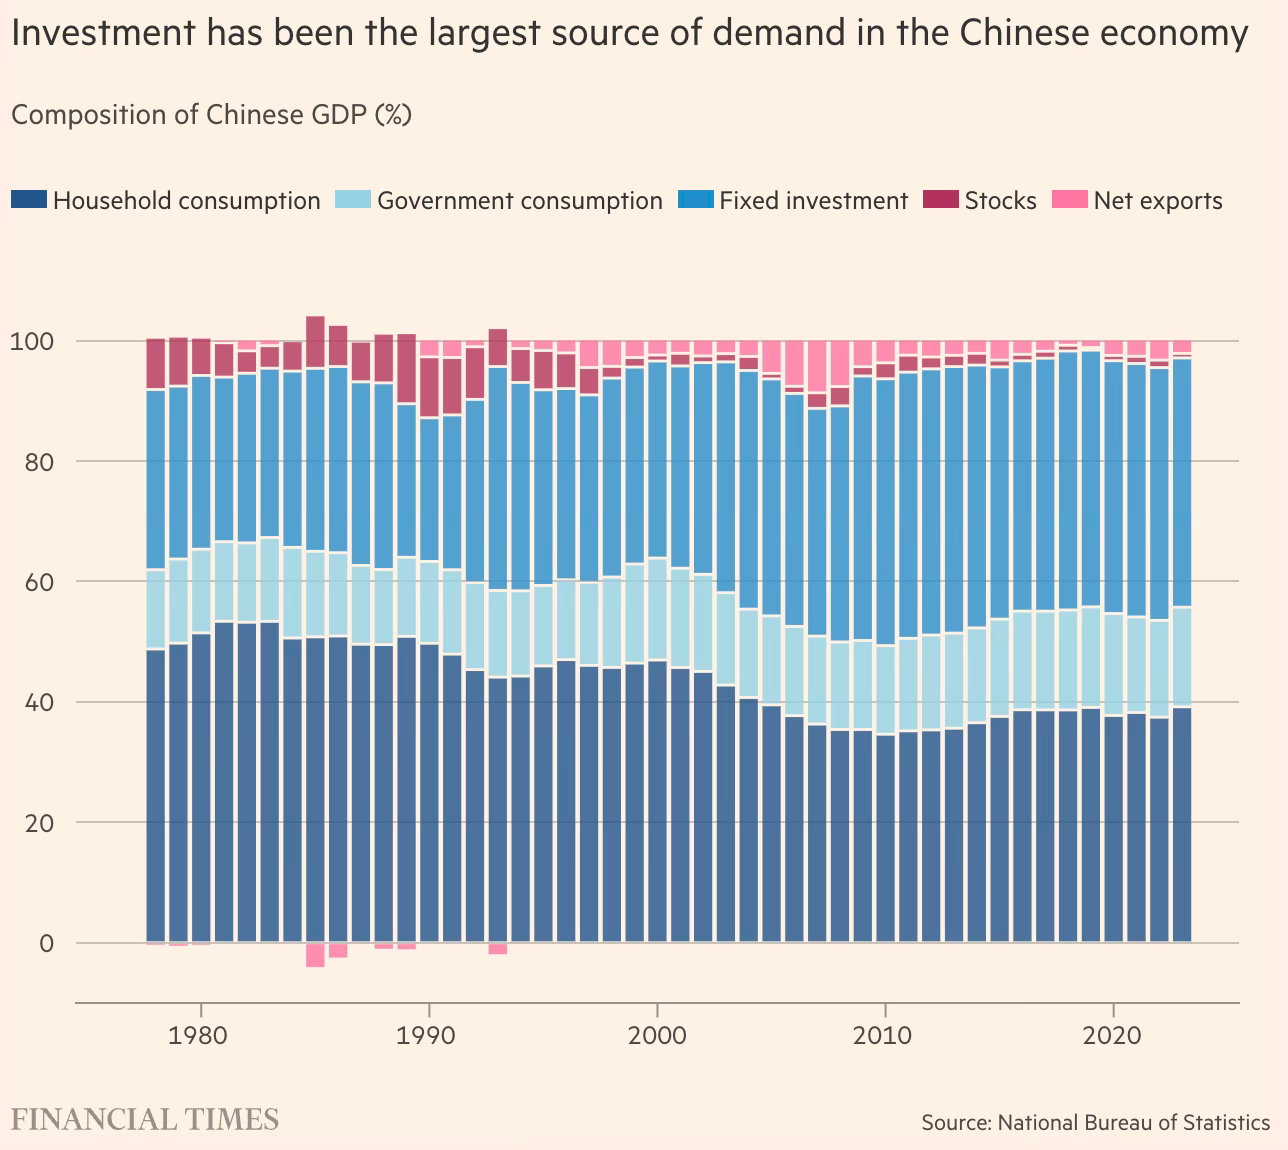
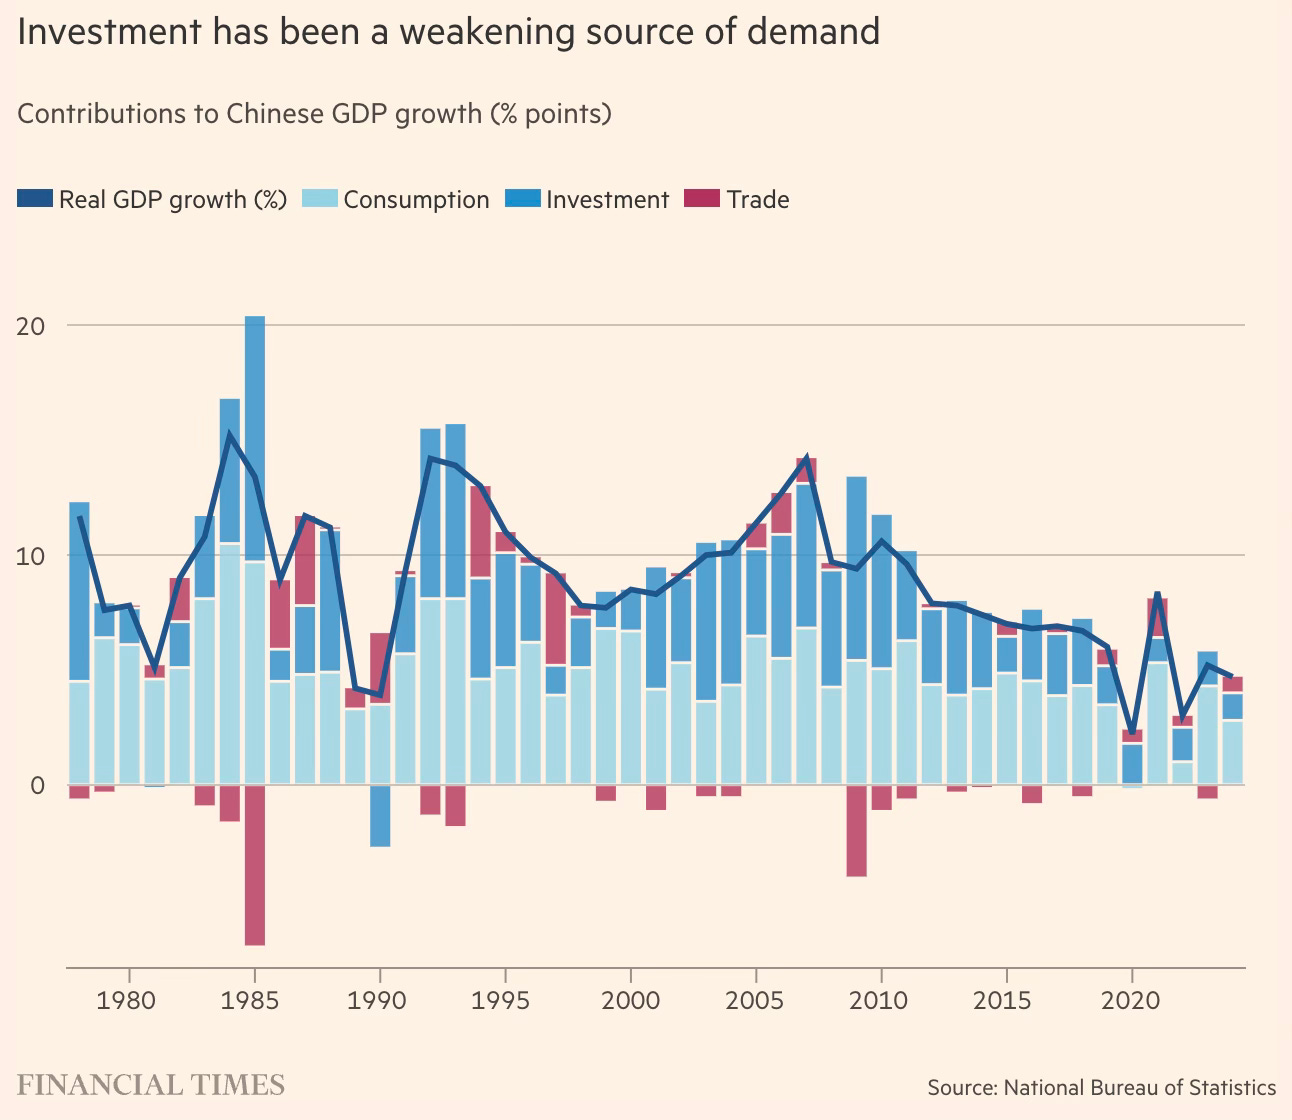
Four aspects of China’s economy should be of big concern—low household consumption expenditures co-existing with a high savings rate, excessive reliance on investments to drive growth, low bang for the buck from its high investment rate, and a debt overhang that threatens the finances of its subnational governments and corporations. While they have been concerns for some time, the combined effect of all three is now a binding constraint on economic growth. Addressing them is critical to the country’s long-term prospects. 

In an economy, aggregate demand reflected in consumption leads to investment and job creation, which fuels further demand in a self-reinforcing cycle. While government consumption too creates demand, household consumption is the primary driver of economic growth. China’s domestic consumption has remained unusually low even when compared to other developing countries and remarkably, has steadily fallen from 53.38% of GDP in 1984 to 46.96% in 2000 to 37.46% in 2022. Its share ranges from 60-70% for most countries, including India. 

This economic structural problem of low and declining base of household consumption has been the biggest challenge for the Chinese government in its pursuit of sustaining high growth rates. As we shall see, a confluence of other problems that have become more acute is making it a binding constraint.

For a government which has historically tightly managed the economy and shown a willingness to step in at the slightest sign of distress, Beijing, especially under Xi Jinping, has shown a surprising reluctance to support household consumption. To be fair, historically Chinese governments have preferred to intervene on the supply side. It has resisted demand-side interventions like expanding affordable access to services like healthcare and education (one reason for the propensity for large savings), leave aside any fiscal stimulus. 

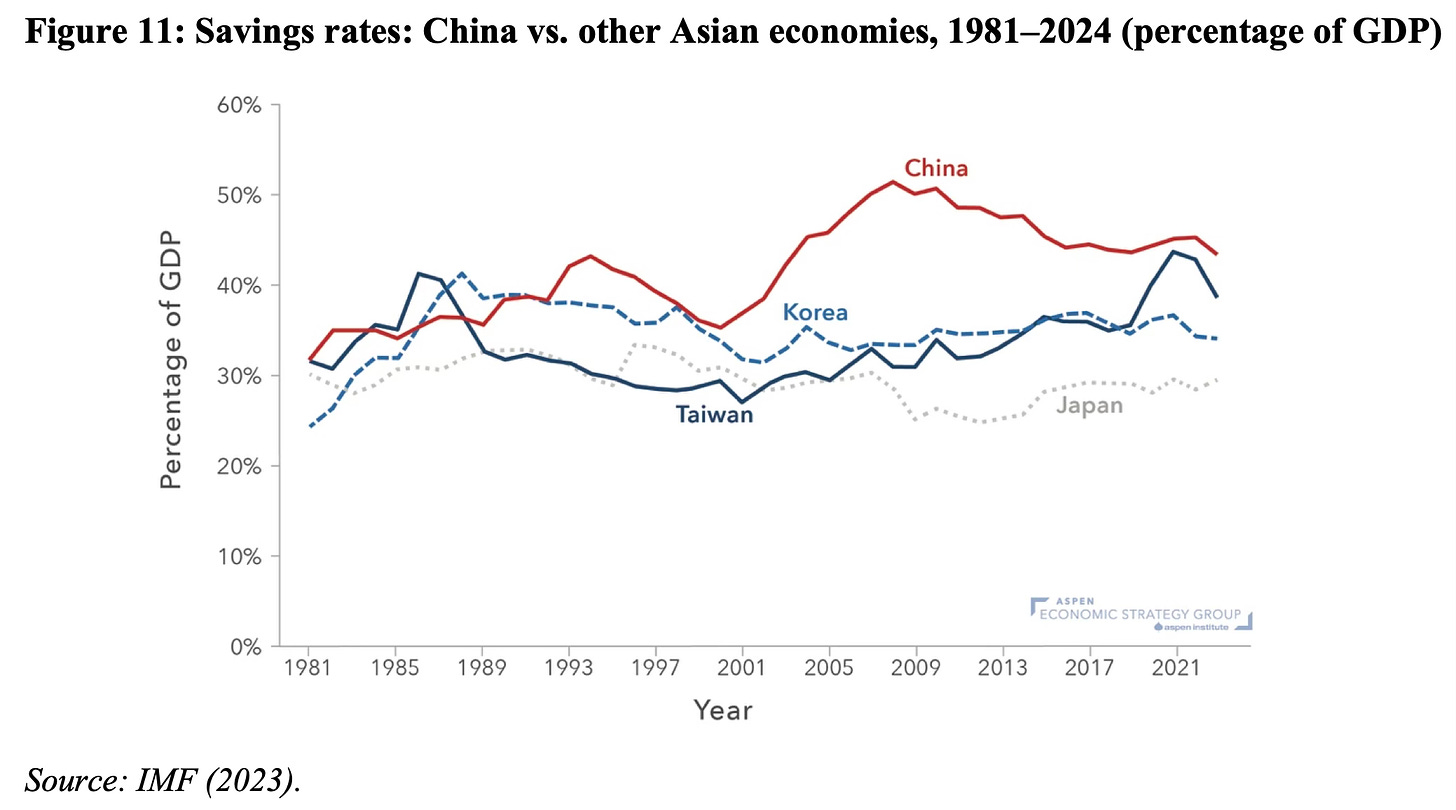
The low consumption has co-existed with very high household savings, which finds its way into supporting the country’s high investment rates. The persistent high savings must find an outlet within the economy or outside. 

It’s the source of at least two important distortions in the economy. One, for a long time, the real estate sector absorbed a significant part of the savings. But once it started floundering and with domestic consumption weak, it became inevitable that the surplus find its way out as external surpluses from the surge in exports. Two, the high level of savings fuels a repressive financial system, where it gets directed to the government’s prioritised sectors and sustains a distorted investment-driven economic growth model. 

It’s been remarkable that all through its high growth decades, especially since the turn of the millennium, Chinese households have preferred to increase their accumulation of savings and reduce their relative share of consumption. This propensity to double down on savings and avoid spending speaks of economic insecurity. 

With the standard driver of economic growth out of the equation, the government has no option but to rely on investments to drive economic growth. This creates the challenge of figuring out the sectors to funnel credit and drive investment. Here the Chinese industrial policy has consistently targeted sectors for government support. 

For long, perhaps the longest period of its high growth era, export-driven manufacturing and infrastructure investments have been the government’s primary drivers of economic growth. The former served the export markets and made China the factory of the world. Once domestic infrastructure demand plateaued, real estate, which was always an important source of growth, became the government’s preferred destination for credit. It was supplemented with the export of domestic excess capacity into building out the Belt and Road Initiative (BRI). But by about 2020, the authorities had come to realise the perils of the real estate bubble and had started introducing measures like the “three red lines” to cool the real estate market. The property market defaults were to duly follow. 

Beijing’s latest preferred investment destinations have been green technologies like solar panels, electric vehicles, and batteries, critical technologies like semiconductor chips, and critical minerals like lithium. It has channelled fiscal incentives and credit to these industries, and these investments have propped up economic growth. This focus is in line with President Xi’s stated objective of unleashing “new quality productive forces” and achieving self-sufficiency in frontier technologies. 

The problems with this investment-based economic growth strategy were papered over during the years of high growth. But once the economy began weakening after 2018, its limitations came to the fore. 

Thanks to the long years of investment-driven growth, the country is awash with massive overcapacity across sectors. In sectors like steel, solar, and internal combustion engine (ICE) vehicles, the Chinese production capacity is often comparable to or higher than the rest of the world put together. Worsening matters, domestic demand has plateaued or is declining. The excess capacity has no outlet except exports. Accordingly, Chinese firms compete to dump their produce in export markets, forcing the inevitable backlash and protectionism in those countries. 

This backlash is no longer confined to the US and Europe, but is rising even among China’s developing country partners. Factory closures and job losses due to cheap Chinese imports have become a uniform source of discontent and anger across countries. The cheap Chinese imports are one of the biggest problems facing the world economy today

The combination of weakening domestic demand, corporate indebtedness, and protectionism among trade partners is exposing the limits to such an investment-driven strategy. 

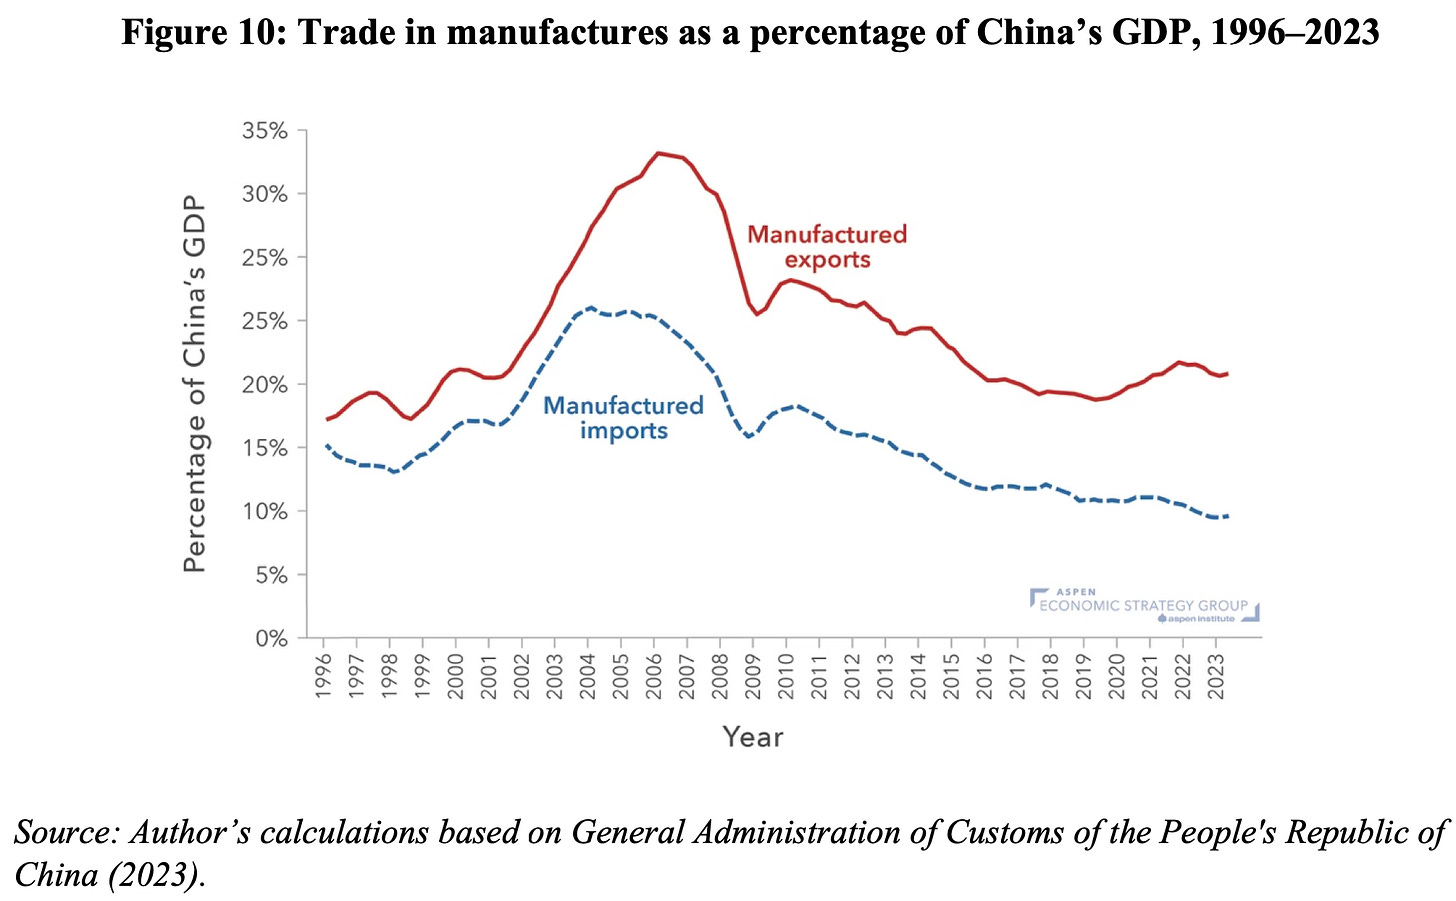
In this context, Brad Setser points to an important observation about the Chinese economy. He shows that for over a decade since the global financial crisis, Chinese exports and imports grew slower than its GDP growth rate, thereby driving down the share of exports to GDP. He argues that the de-globalisation observed in this period was driven by this trend. 

However, since 2019, there has been a surge in Chinese exports and its surplus in manufactured goods “has increased by about three-quarters of a percentage point of world GDP and is now at a record high.” In the last four years, its exports have surged by nearly a trillion dollars. This re-globalisation of the Chinese economy has coincided with its real estate troubles and plateauing of domestic demand. 

The surge in Chinese exports has been driven primarily by green technologies, critical minerals, and electric vehicles and their batteries. They have made entire supply chains critically dependent on China. Supply chain diversification by way of shifting of assembly to the likes of South East Asia, Mexico, and India, does not address the underlying exposure to component imports from China. The export focus to prop up a weakening economy also led to a sharp rise in exports to other developing countries. This more than offset the relative slowdown in exports to the advanced countries. 

It can be argued that the de-globalisation was driven by the demand generated by a fast-growing economy and associated domestic absorption of the country’s rising production capacity across sectors. On the same lines, the current re-globalisation has coincided with the weakening of economic growth and aggregate demand. It has created an imperative to backstop further declines by exporting the massive economy-wide excess capacity accumulated during the high growth years. 

Setser has a good summary

These data points highlight the surprising conclusion that, in years after the pandemic and after the imposition of Trump’s tariffs, China’s economy has become more integrated, not less integrated, into the structure of global trade. The recent surge in China’s exports and in its trade surplus stems primarily from China’s sharp domestic slowdown and its still-unresolved property market crisis. China’s internal demand growth has faltered, and it has instead relied again on exports and global demand to support its growth. This form of globalization is unhealthy to be sure, as it stems from unresolved imbalances inside China’s economy, but it is nonetheless globalization.

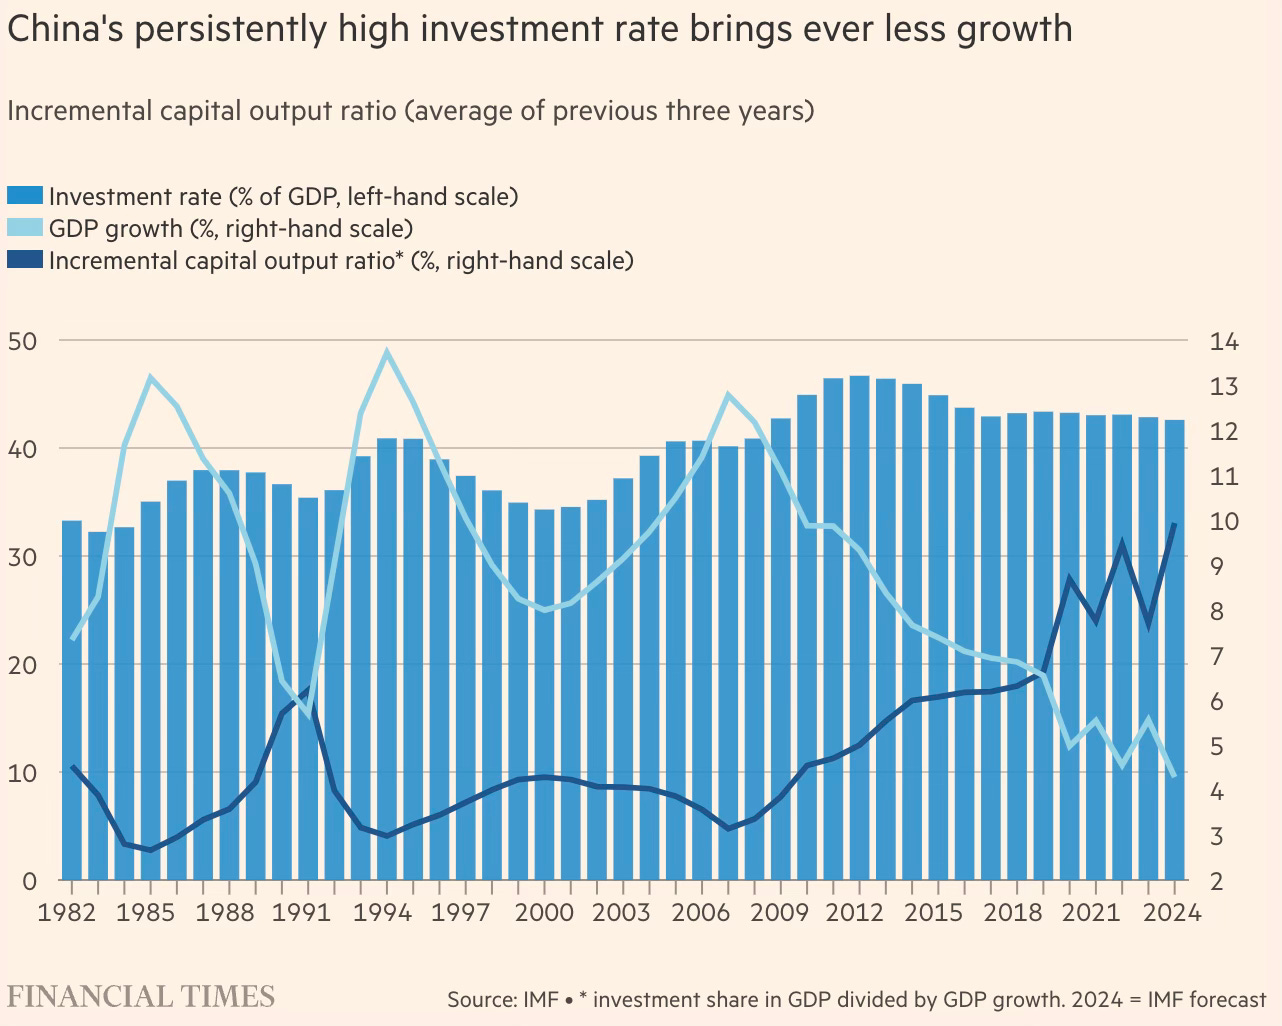
This brings us to the third problem. As the government has pursued a predominantly investment-driven growth model, the bang for the buck from every additional renminbi of investment has diminished considerably. This is reflected in the sharply rising incremental capital output ratio (ICOR). Even as investment has been range-bound at 43-45% of GDP since before the global financial crisis, the ICOR has nearly trebled from below 3.5 to touch 10. This period has also coincided with economic growth declining precipitously from above 12% to just 4%.

It’s likely to get worse with the ongoing investment spree in green and critical technologies, where as aforementioned, the limits to supply are becoming evident. 

As Setser and others have pointed out, a major source of competitiveness for Chinese manufacturers comes from their access to directed credit in the form of cheap equity and debt, provisioned by local governments and state-owned banks. But major fault-lines are now showing up there. As the real estate market flounders, the local government’s access to resources is drying up. And mounting defaults by real estate and manufacturing firms are starting to stress the financial system. 

With the deficient domestic demand and rising restrictions on export markets, the export-driven model appears to be at its last legs. Rebalancing towards domestic consumption is the only way to absorb the massive savings. 

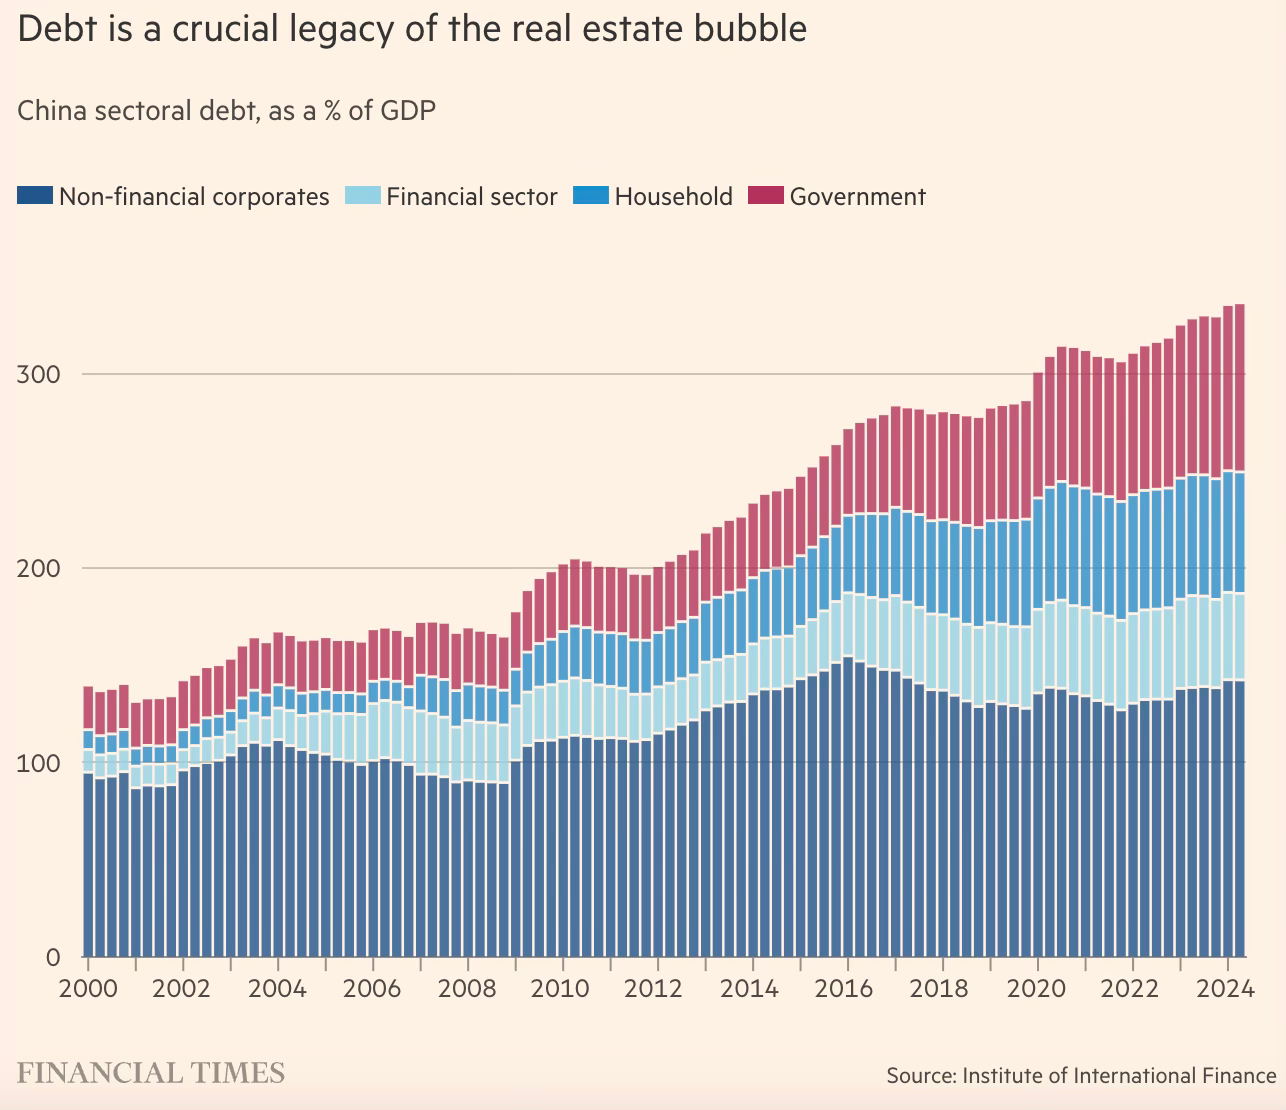
The final piece is the debt overhang facing local governments and financial institutions. Since 2010, government debt has risen from 34% of GDP to over 86% today, and this is most likely a gross underestimate given the large value of off-balance sheet debts of local governments in the form of local government financing vehicles (LGFVs). 

The biggest challenge for the central government is in the management of real estate prices, which are critical to local government revenues. It’s estimated that property made up 23-27% of GDP from 2011-21, absorbing nearly half the total domestic savings of around 45% of GDP. This degree of importance of real estate places Beijing in a catch-22 situation. 

Elevated real estate prices are central for not only future revenue mobilisation but also to ensure debt repayments. If the property bubble gets deflated abruptly, it can result in a cascade of local government defaults, failure of banks, investment cuts, and job losses. It’s hard to manage such downward spirals. 

The counterparties to real estate and other corporate debt are financial institutions. Logan Wright writes in a Rhodium Group report

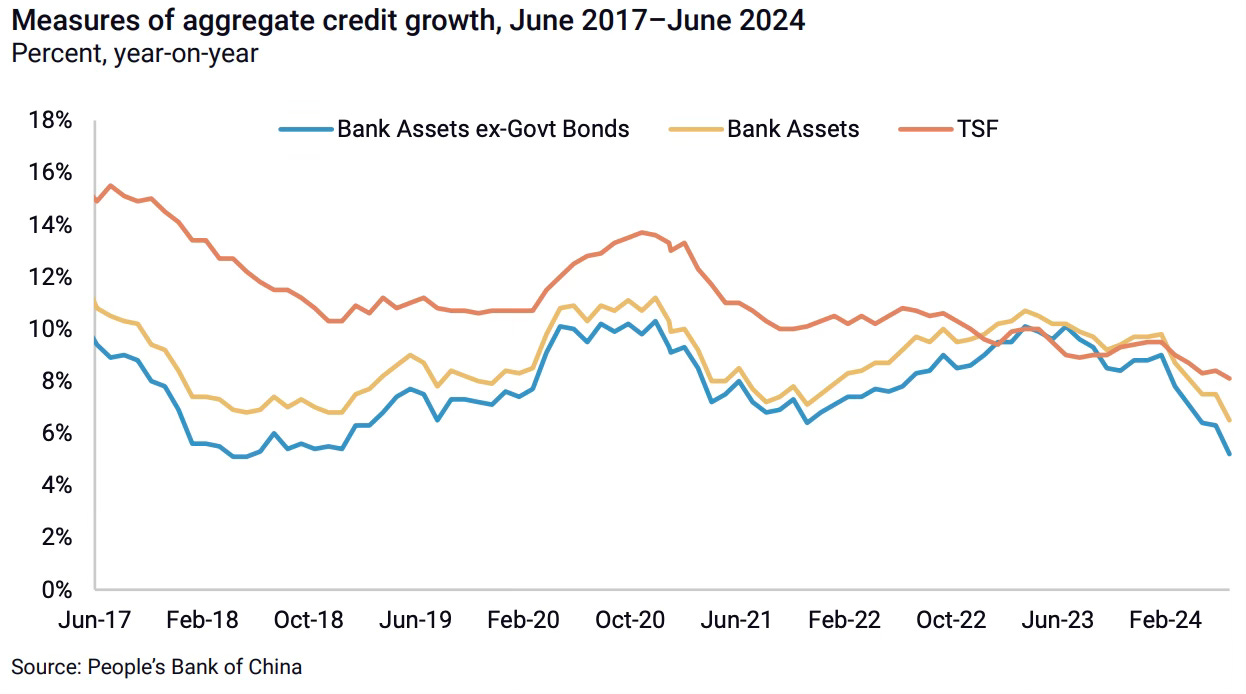
China saw the largest single-country credit expansion in over a century, adding $24 trillion in new assets over the eight years from 2008 to 2016, around one-third of global GDP. Banking system assets now total $59 trillion as of June 2024, over three times the size of China’s economy and around 56 percent of global GDP. In comparison, China’s real GDP grew by $6.1 trillion between 2008 and 2016, and a further $7.1 trillion between 2016 and 2023. China has by far the largest single-country banking system in the world in terms of assets. US banks hold around $23.4 trillion in assets, but the US has a far more diversified financial system than China. That volume of lending by Chinese banks was extended primarily on the basis of government guarantees rather than the potential financial returns of the underlying investments. As a result, this credit explosion generated significant numbers of loans that may have been made to “safe” state-owned companies, but they constantly require loan rollovers and extensions. A financial system this large and this impaired can no longer generate the same pace of credit and investment growth as it did in the past…

Bank profit margins and credit growth in China have already slowed significantly. China’s overall credit growth averaged 18 percent from 2007 to 2016. Its slowdown in credit growth began in earnest with the deleveraging campaign from 2016 to 2018, and since then credit growth has averaged just over 9 percent. Banks’ average net interest margins on lending have fallen from 2.77 percent in 2012 to 1.54 percent in the first quarter of 2024, according to data from China’s banking regulator.

The financial system too therefore has hit its limits in sustaining the government’s investment-driven economic growth strategy. This is showing up in “the collapse in property investment, a slowdown in local government investment, and rising local government fiscal pressures”. 

Beijing will be able to kick the can down the road with adhoc policy interventions like the recent monetary stimulus. Perhaps it’ll supplement with fiscal stimulus. It might reverse policy and prop up the real estate sector. Whatever the measures, there cannot be any substitute to rebalancing away from investment to household consumption for China to address its problems and achieve a sustainable growth path. This will be the biggest challenge yet for China in the last several decades and should become the top most priority for the government.