I had blogged here, arguing that the Indian economy faces a cost-competitiveness constraint. I had written that on many inputs, domestic firms face the cost structure of a developed country. This post will examine the empirical evidence in this regard.
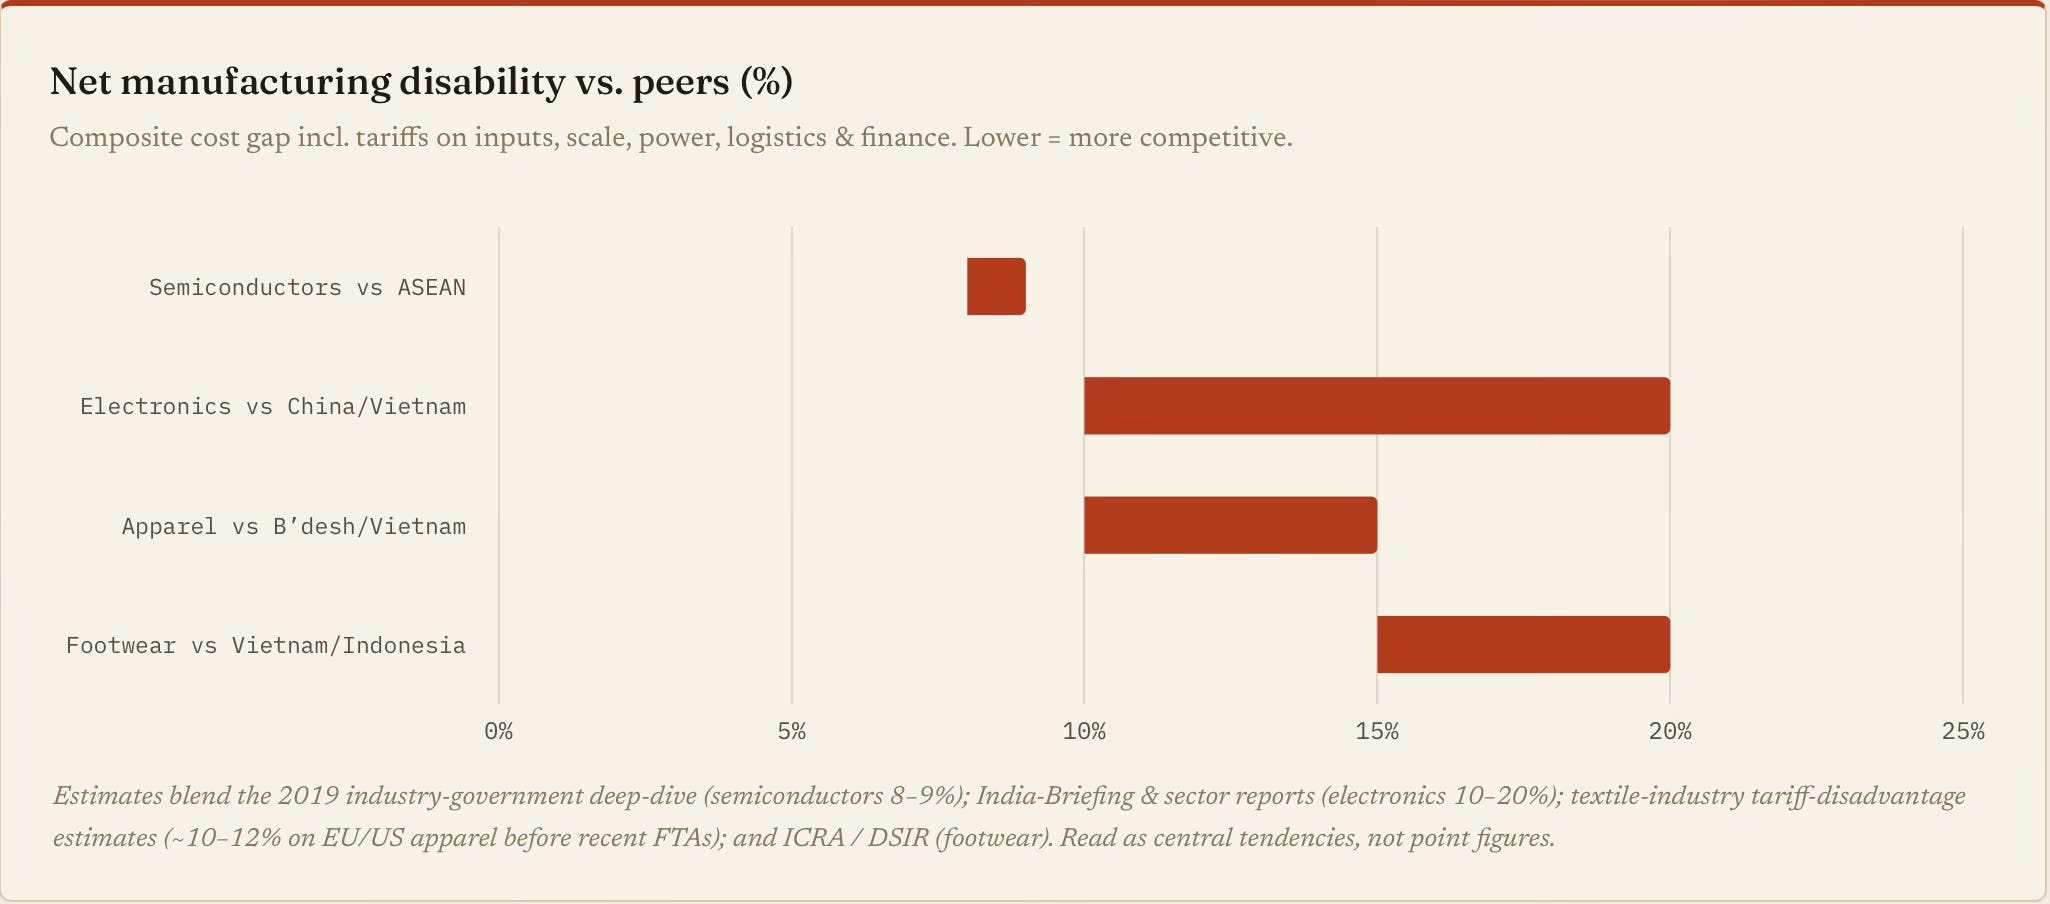
This cost structure reflects in the global competitiveness of the country’s manufacturers. India suffers from a persistent and high price disability compared to peers across manufacturing sectors.
What are the contributors to this competitiveness wedge?
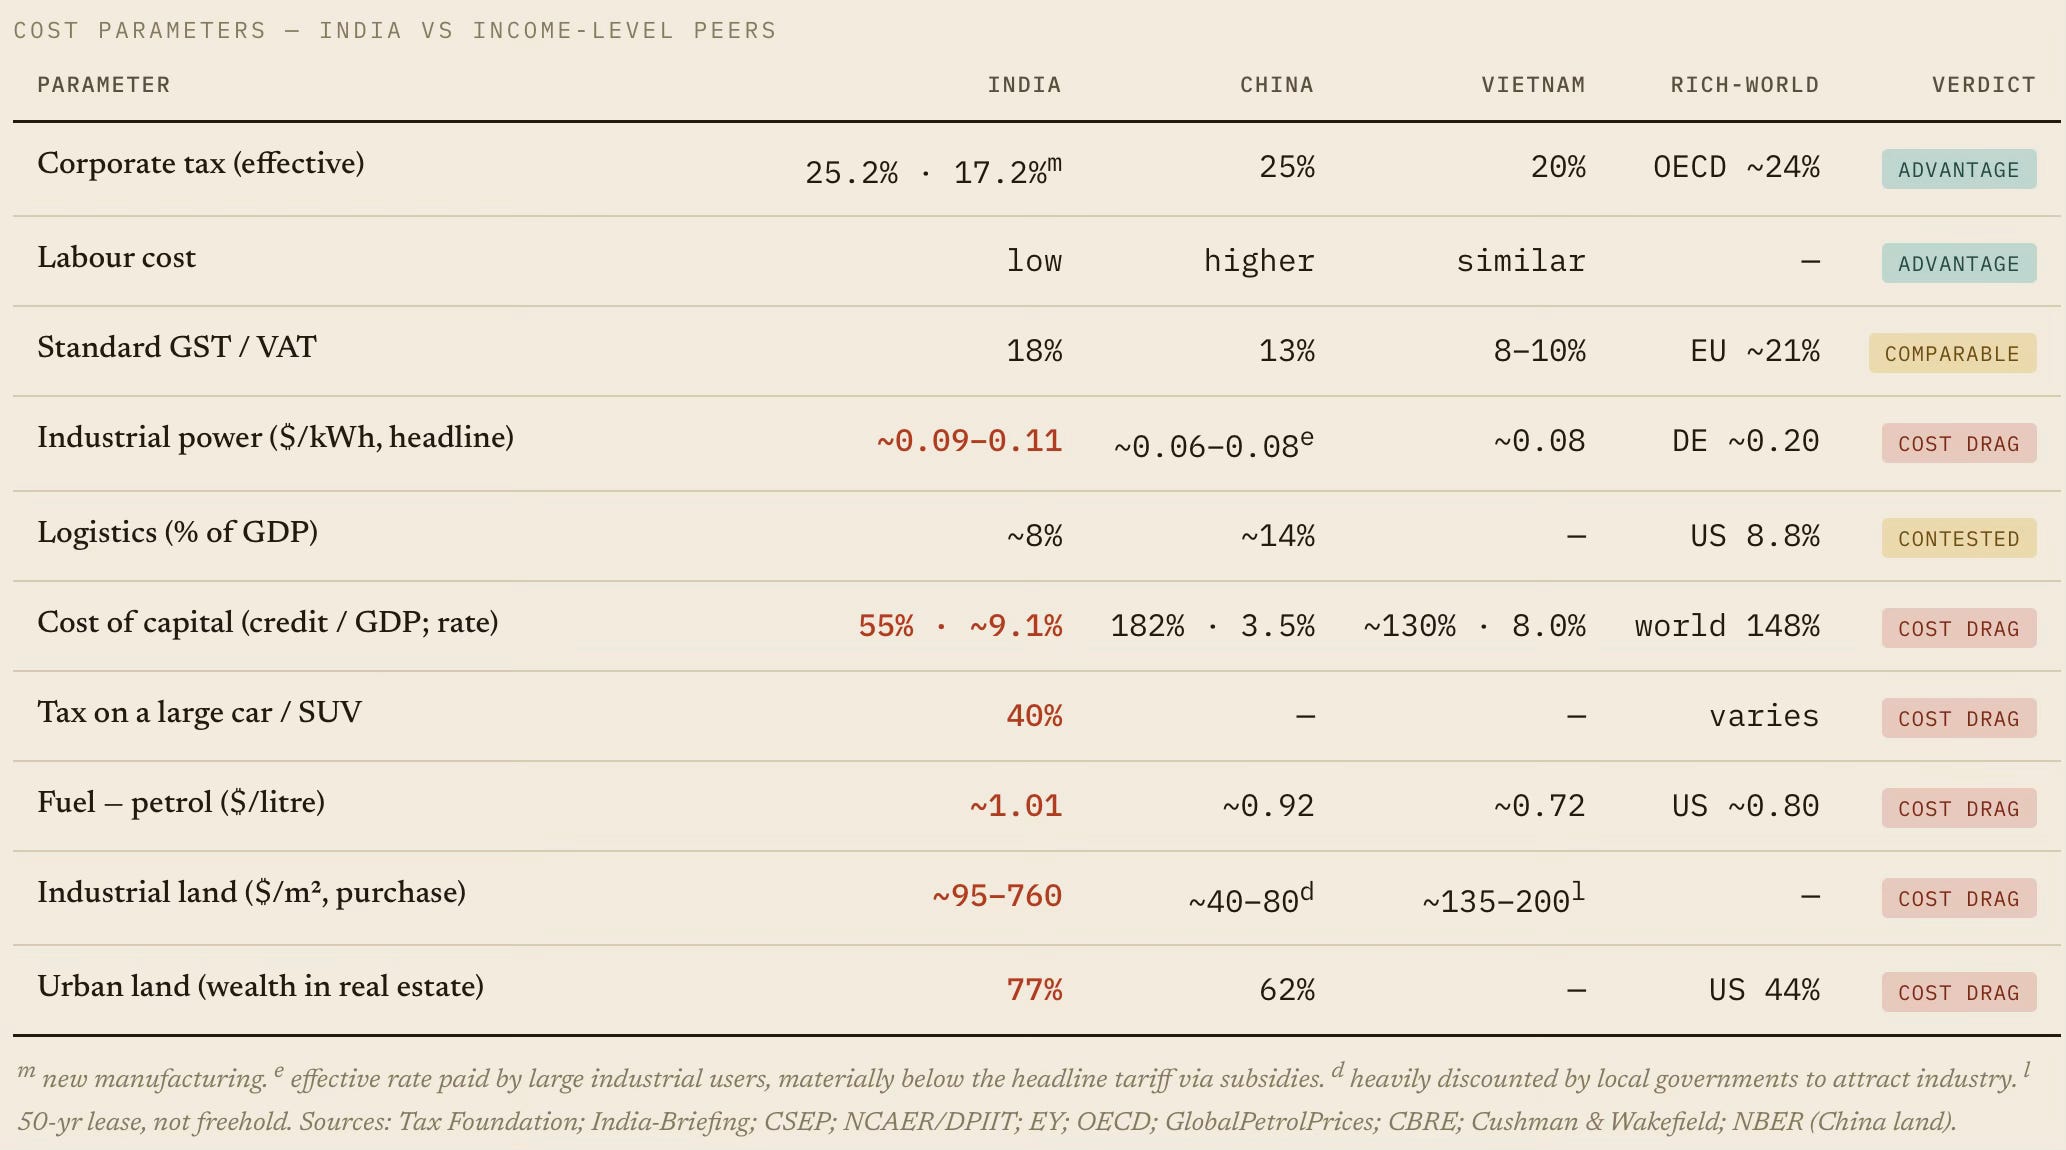
Indian factory wages (~$2.1/hour) are the lowest in Asia, about two-thirds of Vietnam's and a third of China's. Its effective corporate tax rate at 17.2% is among the lowest, its GST rates are comparable, and its logistics costs (while contested) are at least not much higher.
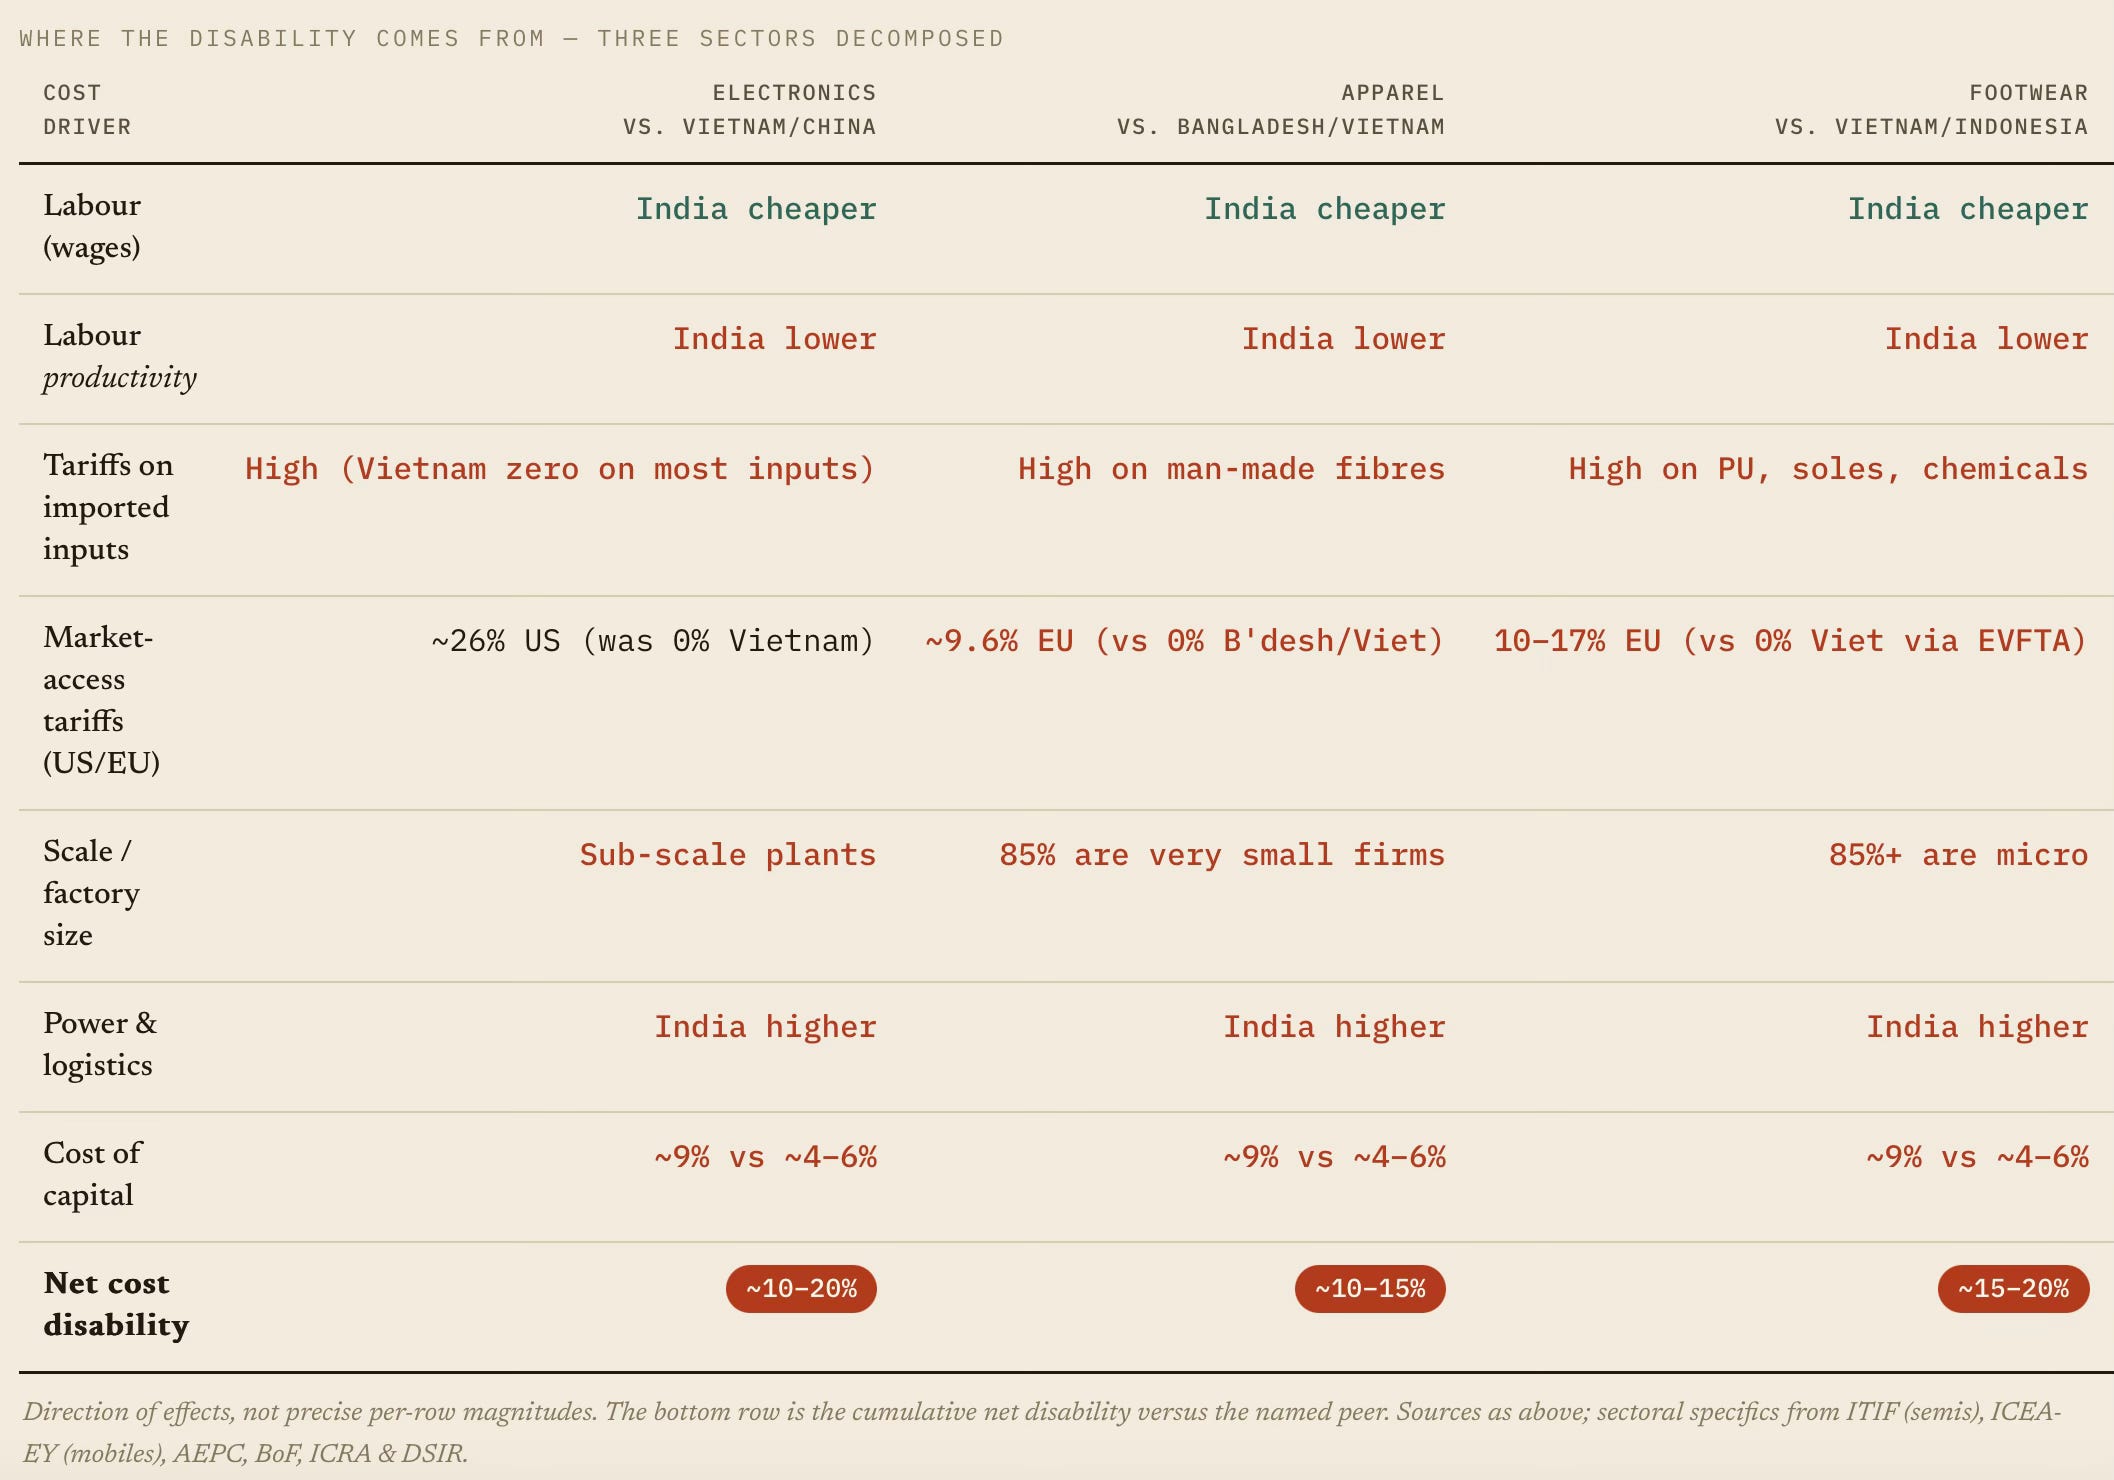
So if India loses on net cost, the disability is entirely in non-wage factors: land, capital, power, fuel, scale, tariffs on inputs, and labour productivity.
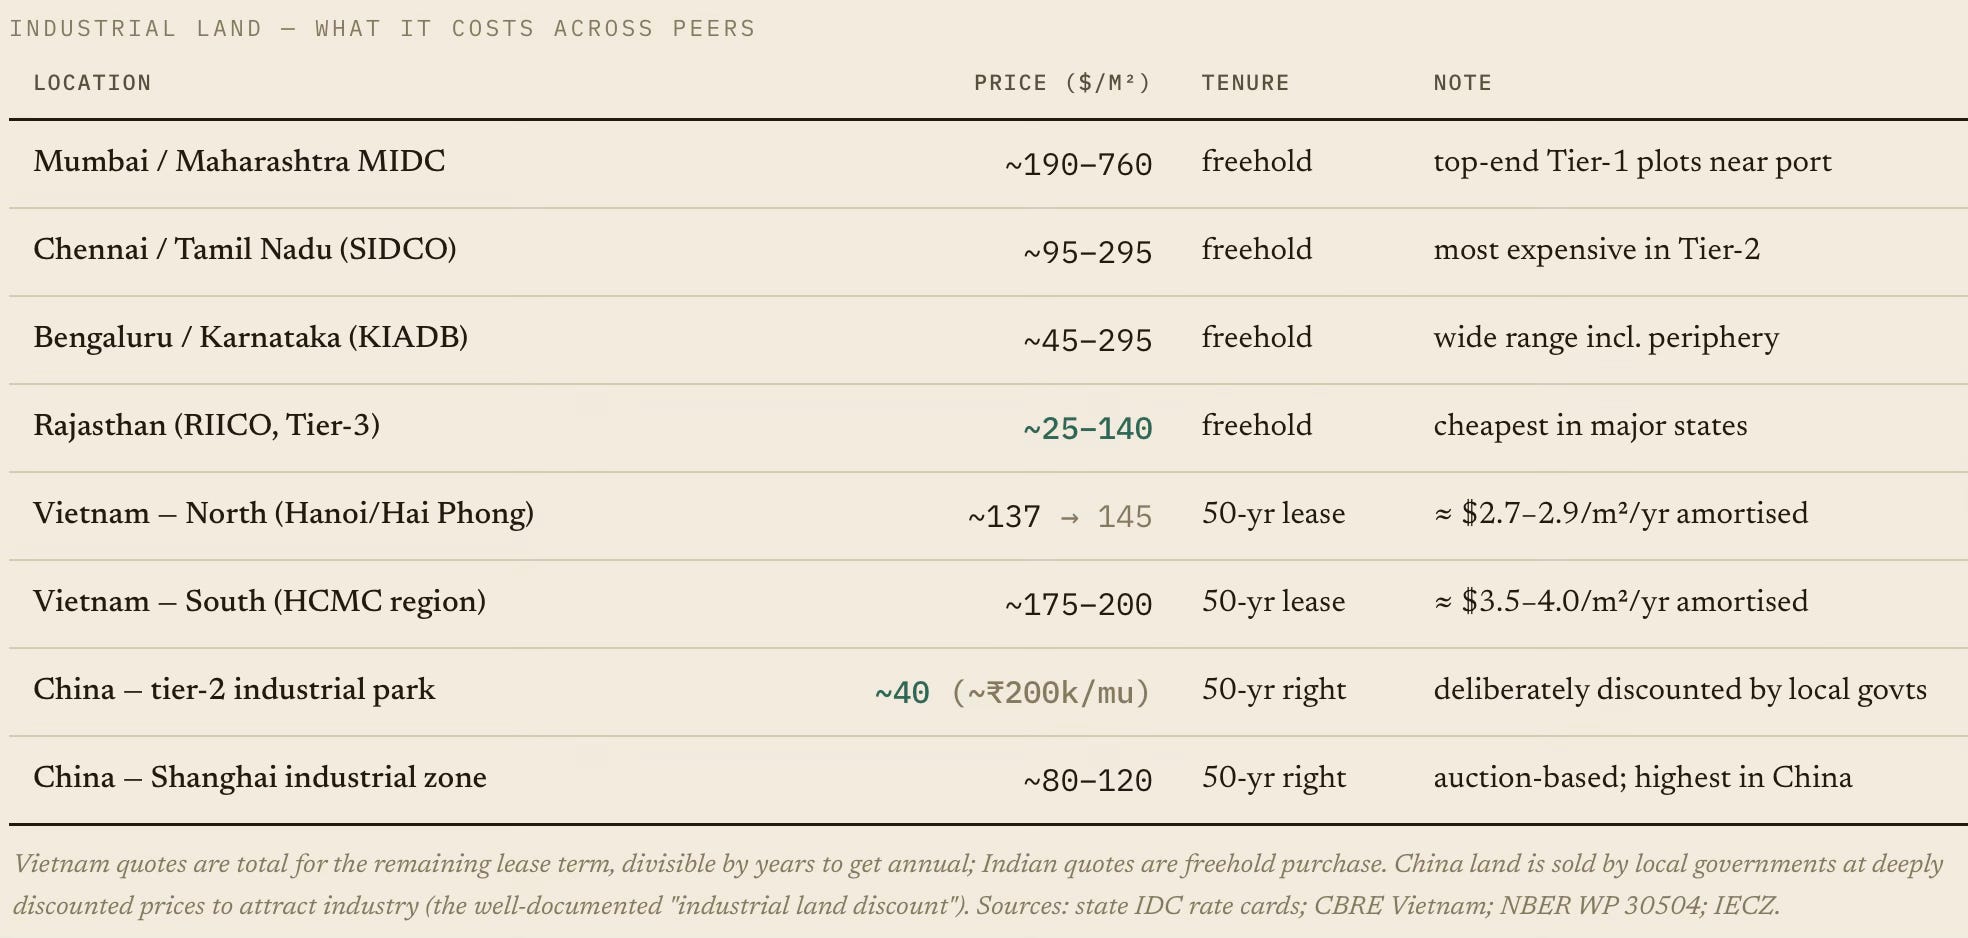
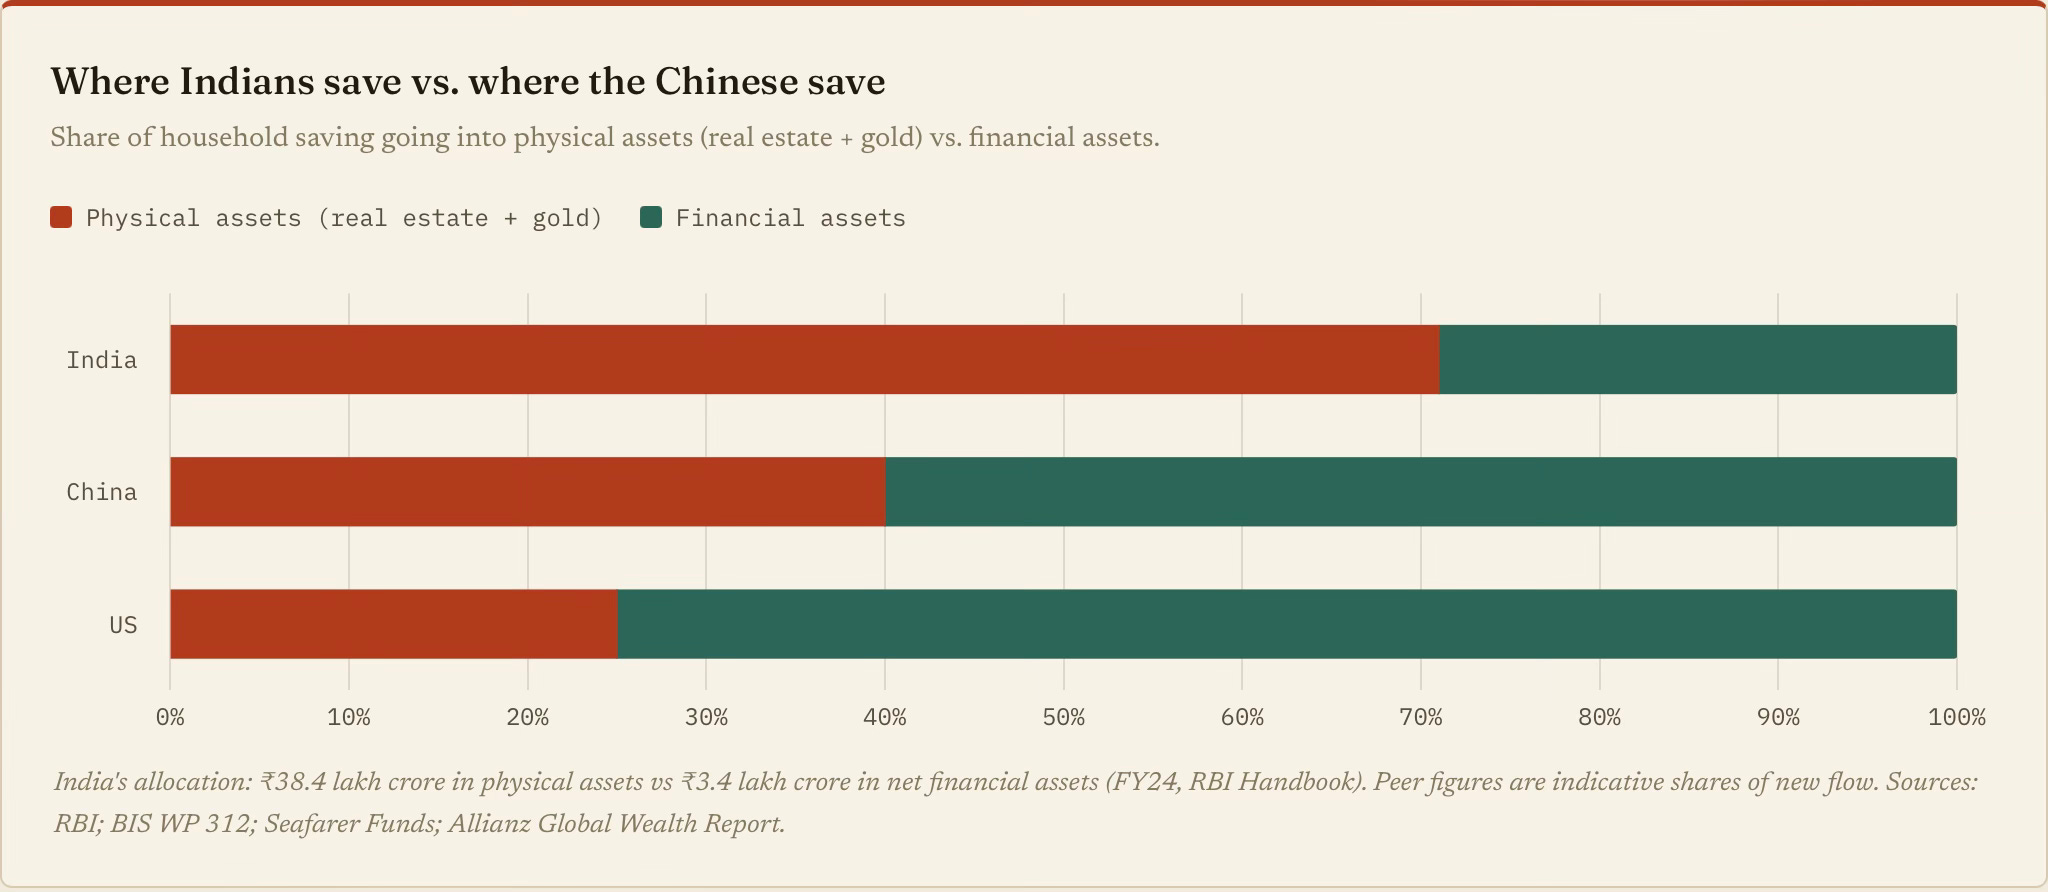
Start with land, the largest cost wedge. Urban land is priced like that of a rich country, and, most problematically, hoards the nation's savings. Mumbai ranks among the world's 20 most expensive prime markets, and Indians park ~77% of household wealth in real estate. The high land valuations result in capital misallocation and squeeze out the capital that would otherwise have resulted in investment.
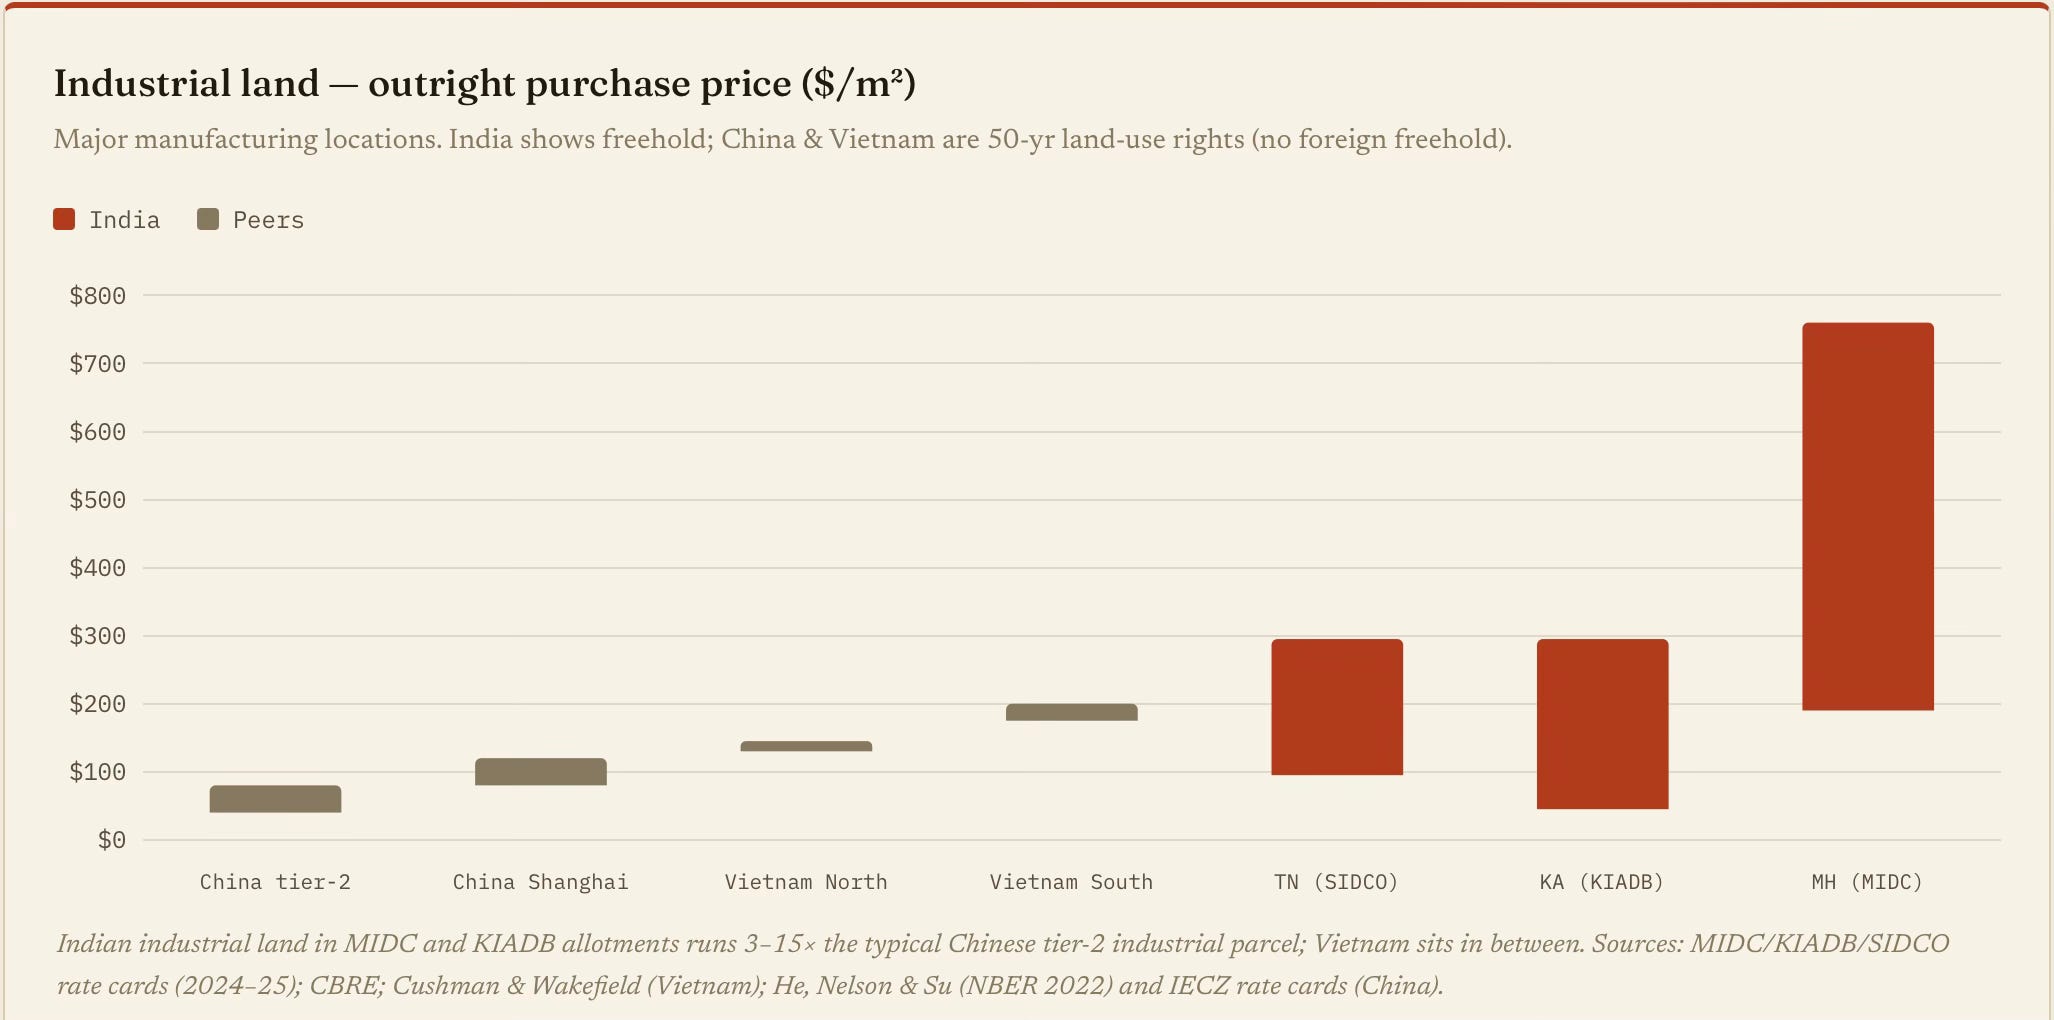
In fact, high land valuations, even in the smaller cities, appear to be a big entry barrier for businesses. An Indian manufacturer pays roughly 5–15 times more for industrial land than a Chinese counterpart in a comparable tier-2 city, and 1–4 times a Vietnamese peer. That gap is policy-made. China's local governments subsidise industrial land to attract production, whereas India's restrict supply (FSI, fragmented titles, slow acquisition) and treat land as a fiscal asset to maximise revenues.
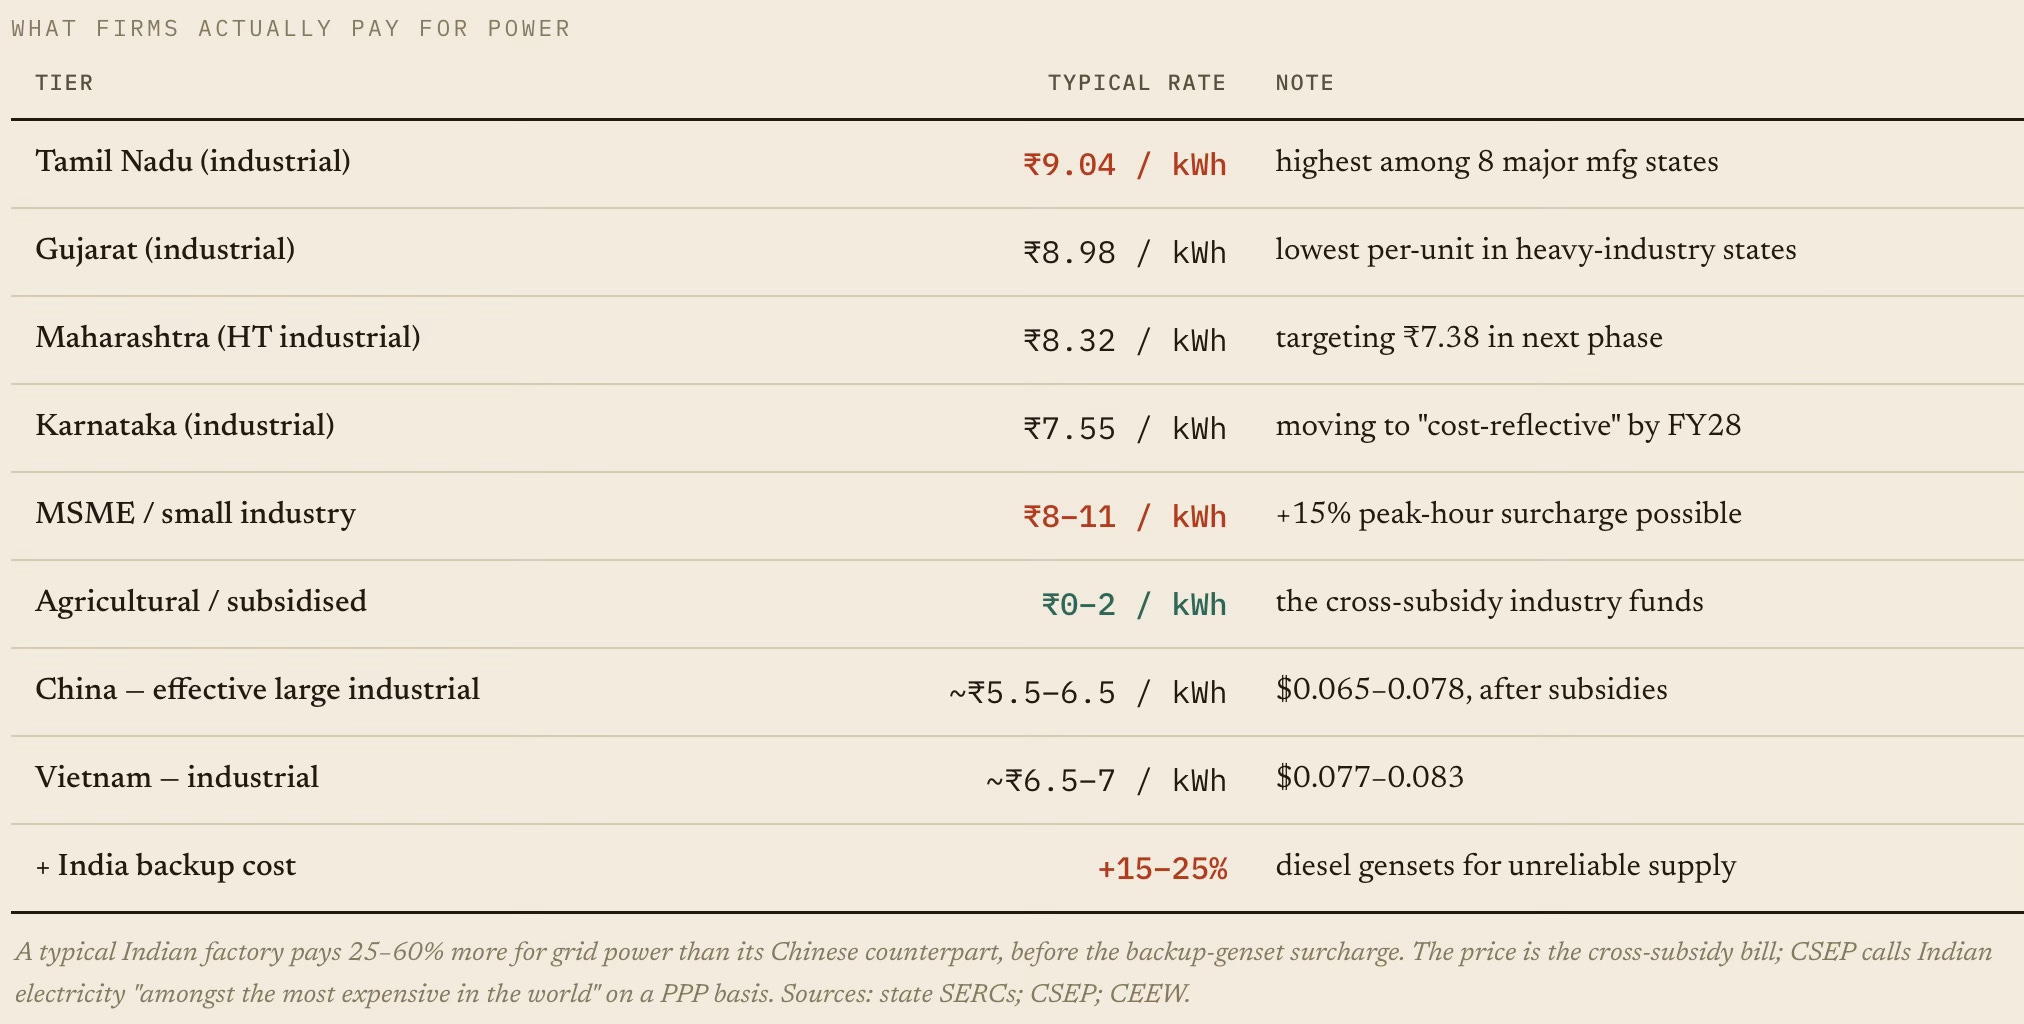
Now, come to power tariffs. Indian industrial users pay ~₹7.5–9/kWh ($0.09–0.11), materially above what comparable Asian peers' large industrial users effectively pay. Indian electricity is among the world's most expensive on a PPP basis, with one of the world's widest spreads across consumer types.
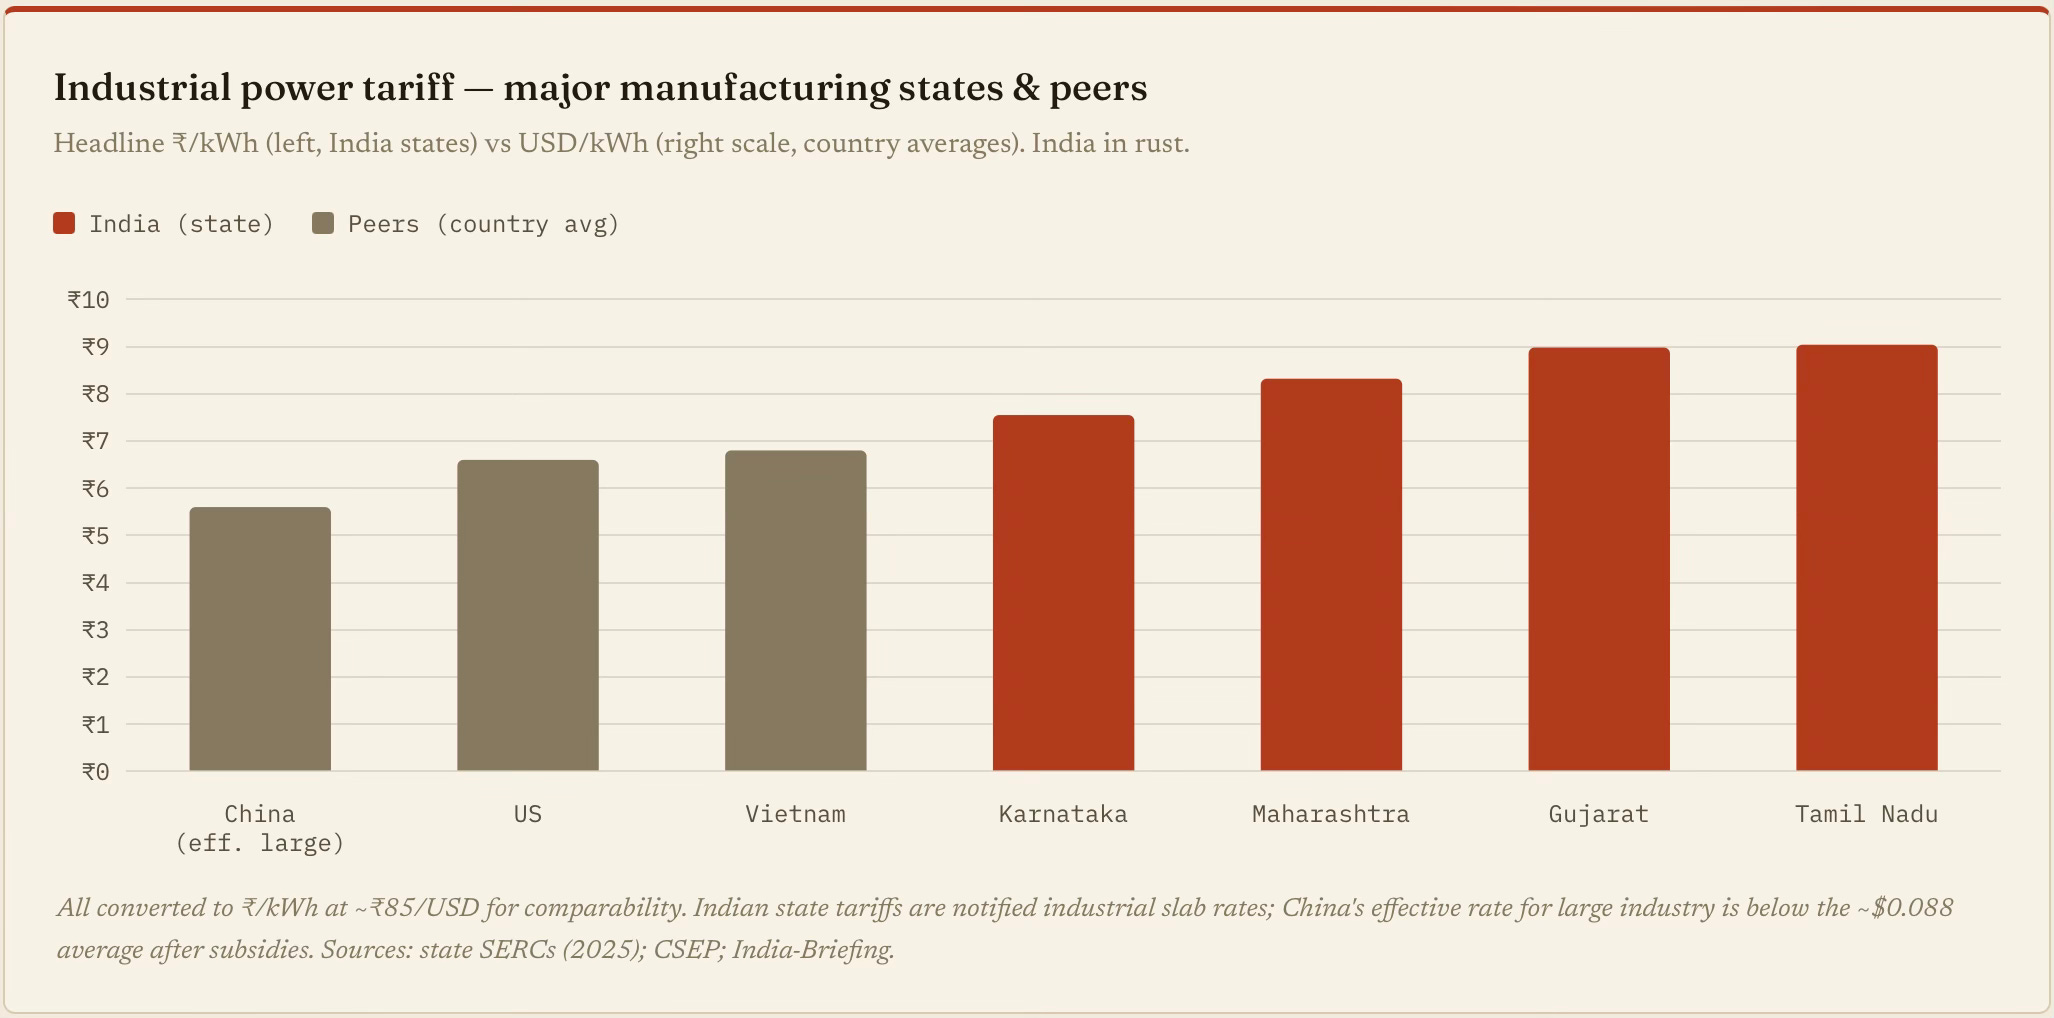
The comparisons of electricity prices based on averages are misleading. For example, India and China have similar average electricity tariffs at $0.08/kWh. It conceals that India has one of the world's widest cross-subsidy spreads (farms near zero, industry penalised). The rate that matters for competitiveness is the industrial slab, which is materially higher. Industry overpays to cross-subsidise farms and households, again, another policy choice. To this, we must add another 15–25% for diesel backup against unreliable supply.
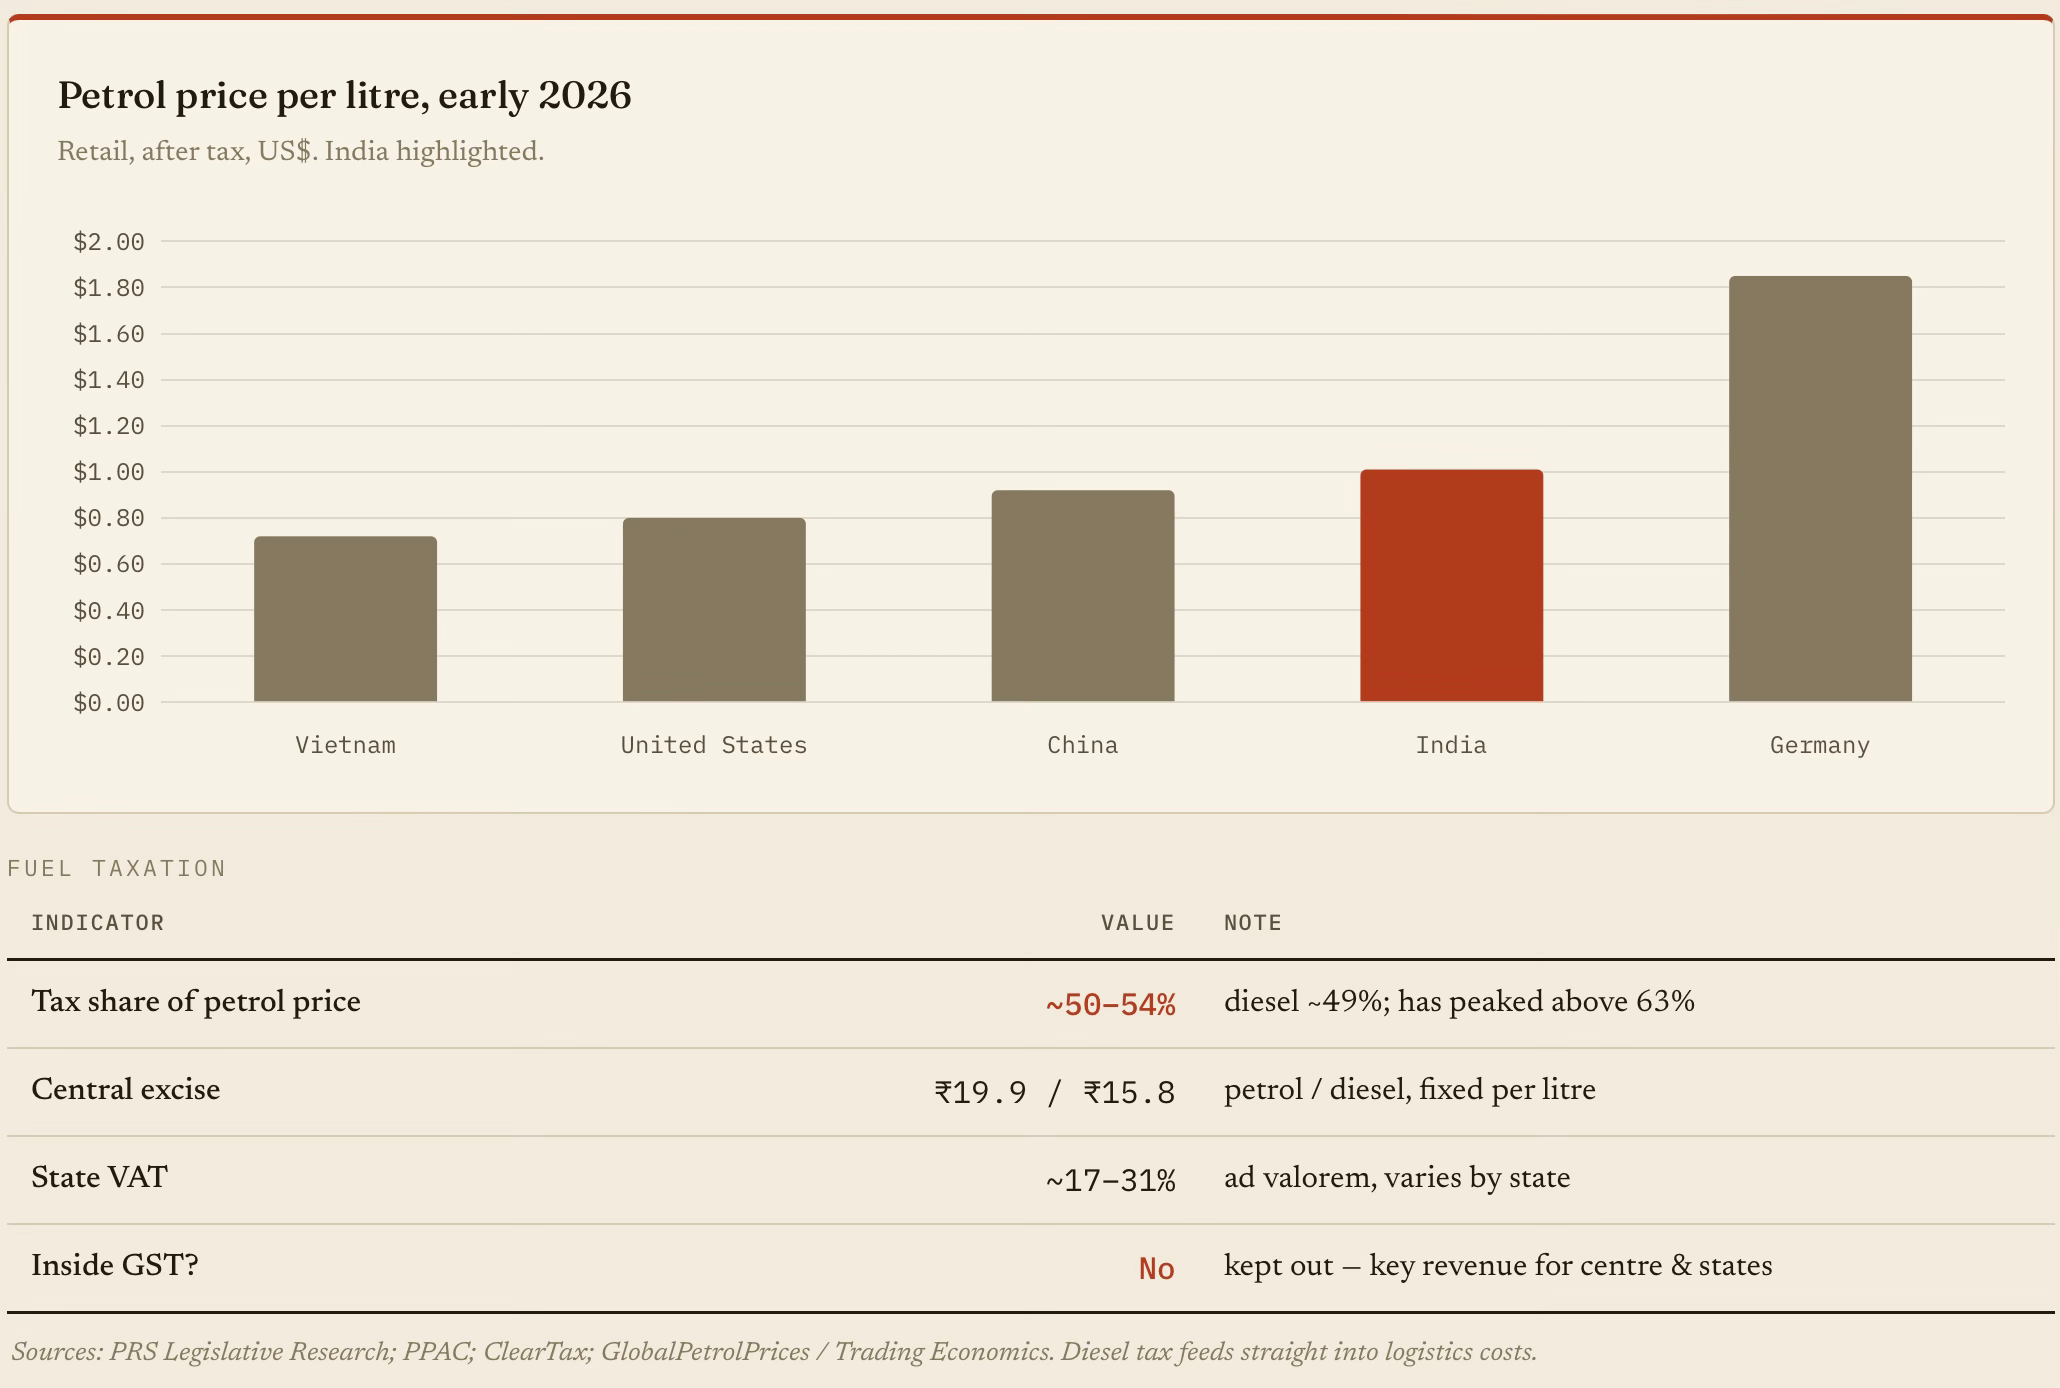
The same applies to gasoline prices. Kept outside GST as a revenue mainstay for state governments, petrol and diesel carry stacked central excise plus state VAT. Roughly half the pump price is tax. In raw dollars, India's fuel is dearer than China's, Vietnam's or America's, despite far lower incomes.
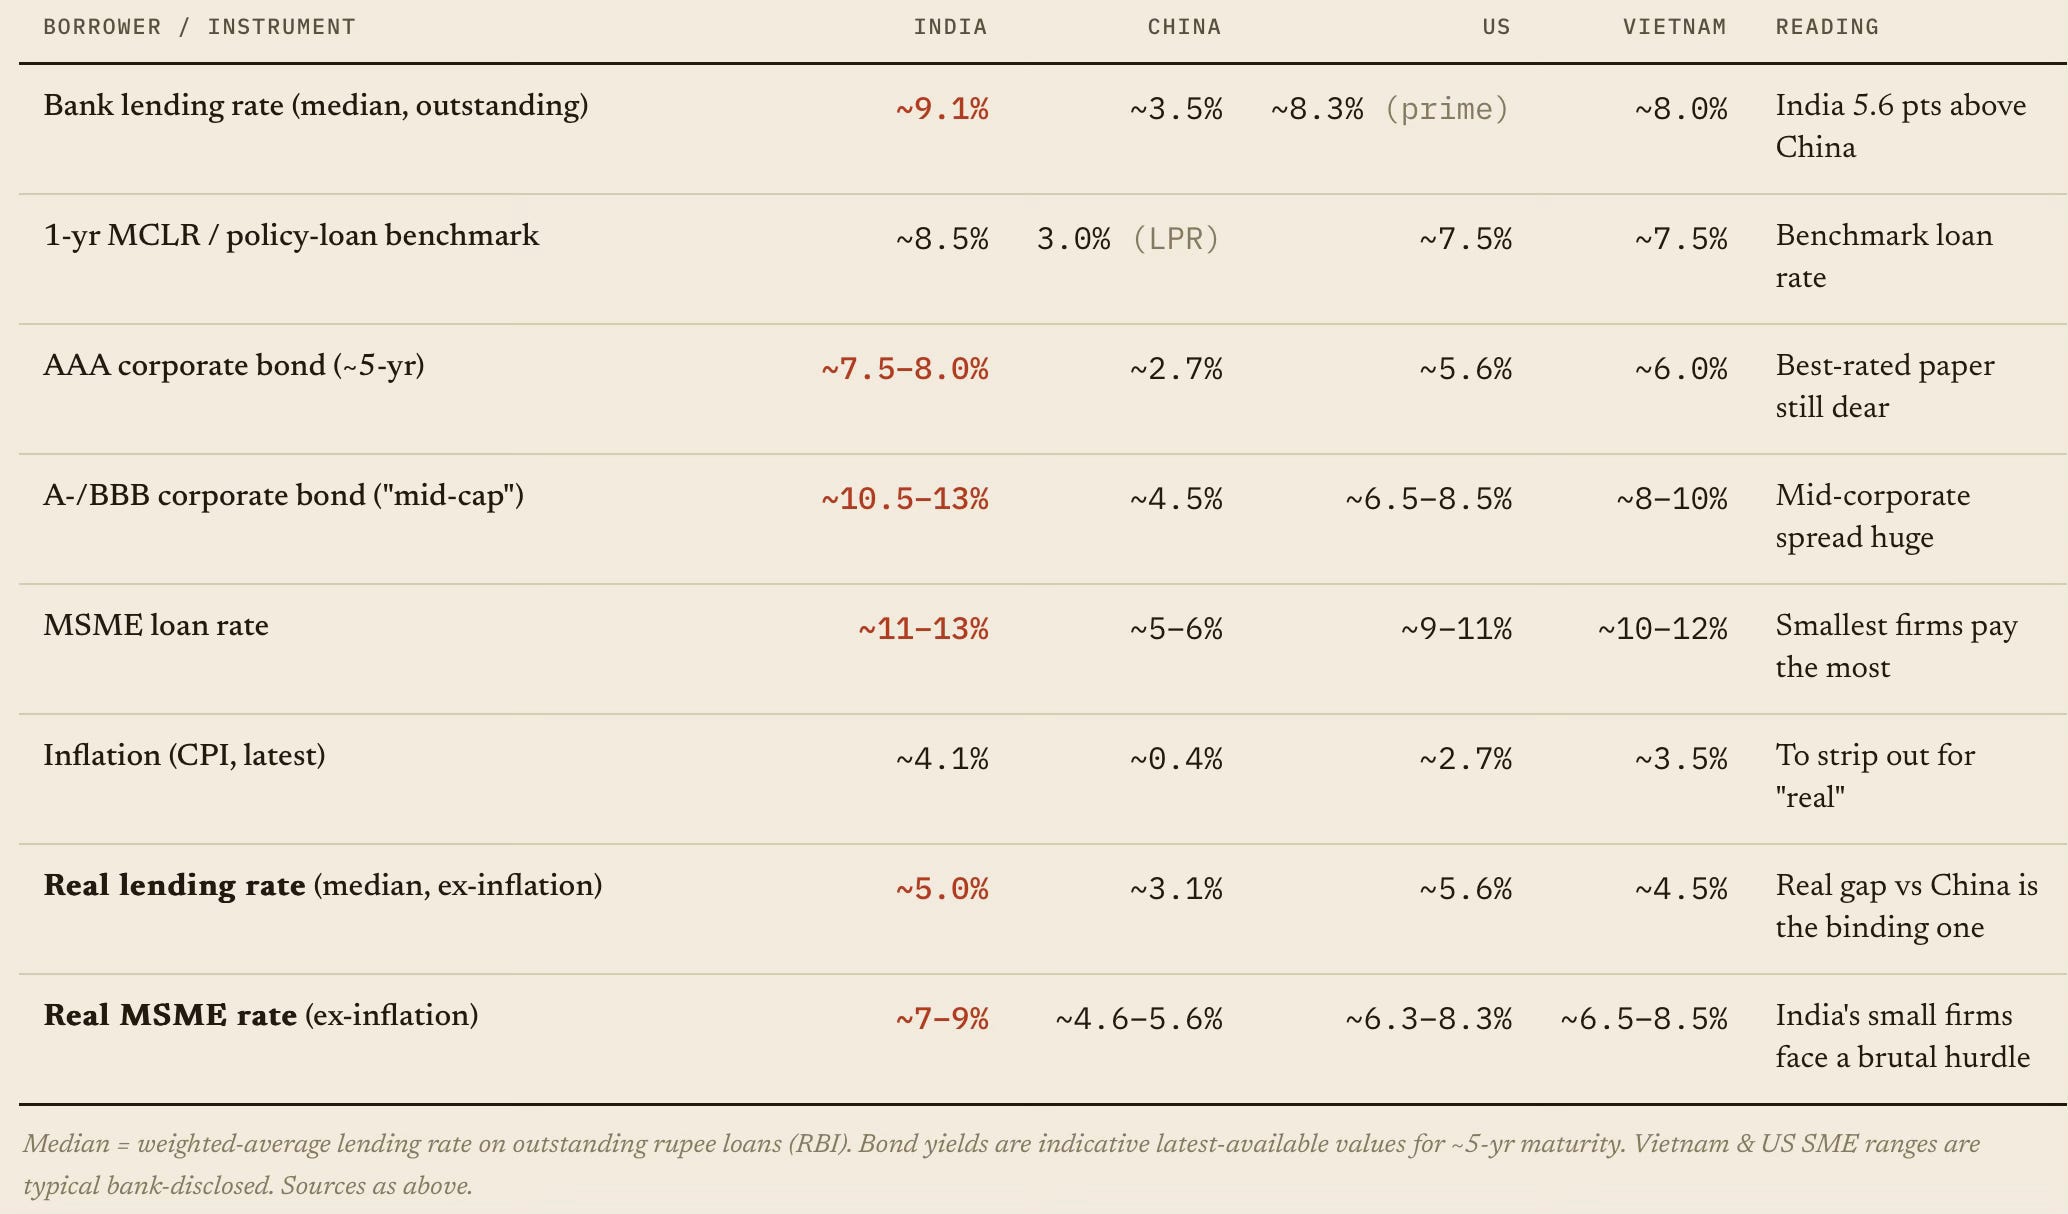
The cost of capital adds to the wedge. The credit-to-GDP ratio measures the availability of capital. The other half of the problem is the price. Indian firms pay materially more than peers - across banks, bonds and the SME segment. In fact, after stripping out inflation, the gap stays large, which is the more realistic measure of whether real investment can clear its hurdle rate.
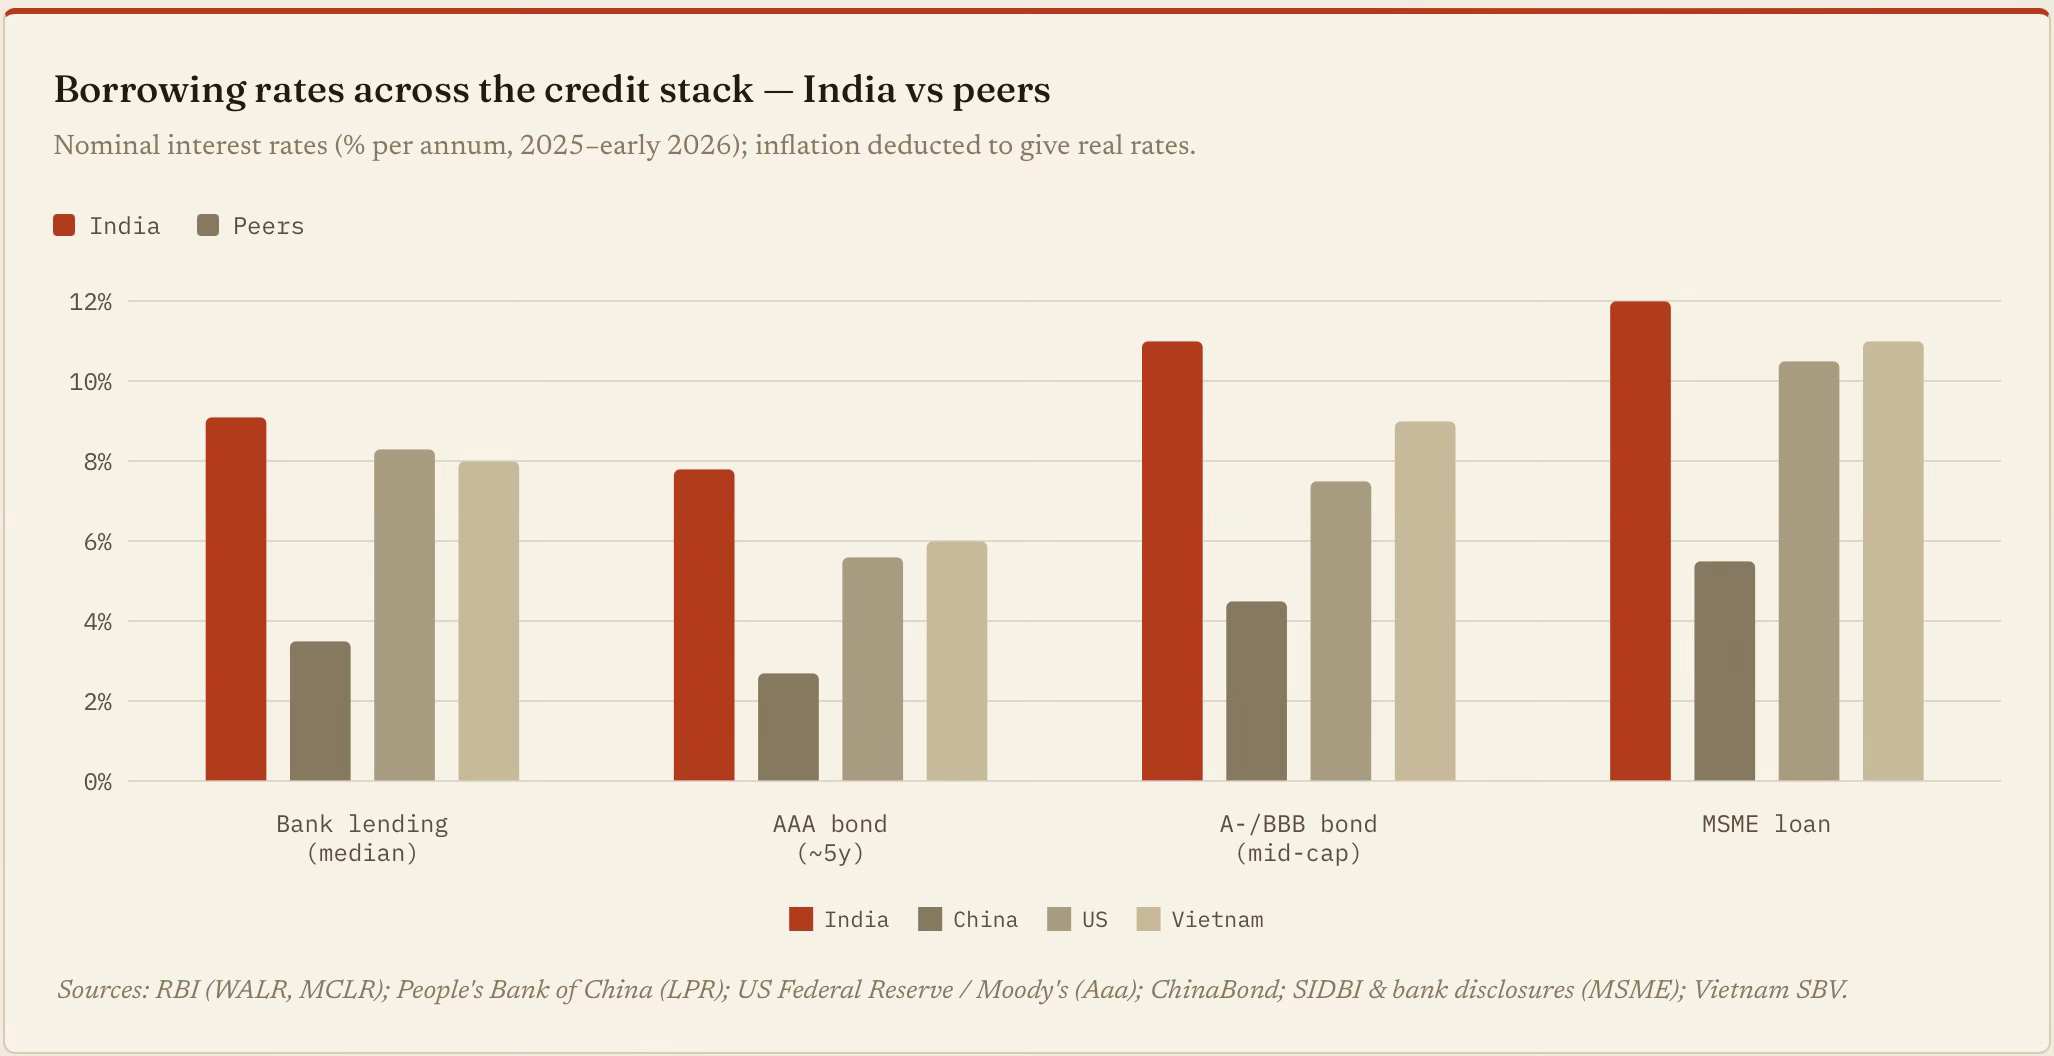
The capital markets are no different. An Indian mid-cap pays roughly 2–3 times the bond yield a Chinese mid-cap pays and ~50% more than a US one, in nominal terms. After inflation, the gap narrows but doesn't vanish. India's real lending rate (~5%) is ~2 percentage points above China's, and the real MSME rate is among the world's highest. Combined with credit availability stuck at 55% of GDP, this means Indian firms, and especially the missing middle, face the worst combination of dear and scarce capital among large economies.
Let’s dig a bit deeper into the capital cost wedge.
Econ 101 informed that the high cost of capital is a reflection of the demand-supply mismatch. On the demand side, as we have seen, the high land valuations are encouraging resource misallocation. What about the supply side?
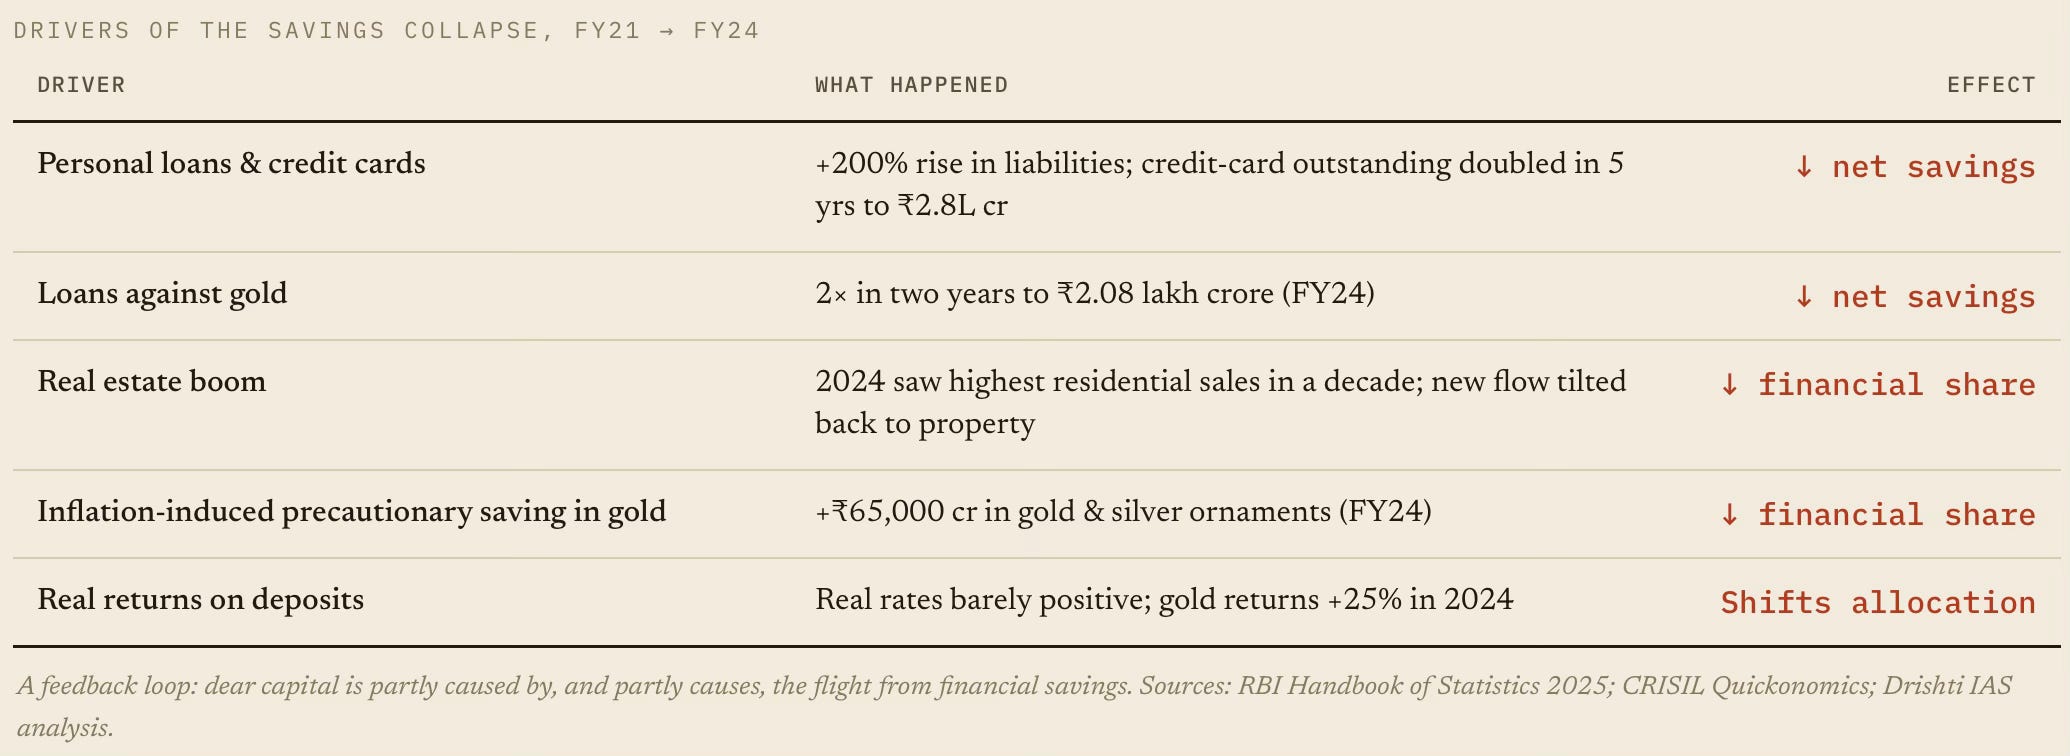
The country’s reasonable gross domestic savings rate (~30%) conceals a disproportionately high share of illiquid assets. When 77% of wealth sits in physical assets (land and gold), and only ₹40 for every ₹100 of household financial savings reaches the financial system, the banks have less to lend, the bond market stays thin, and the price of credit rises.
In other words, there’s a link between the land and capital problems facing the economy. The causal chain goes something like this - physical-asset preference (land + gold) → low household financial savings (5.3% of GDP) → shallow bank deposits & bond market → low credit-to-GDP (55%) → dear capital (~9% vs ~3.5% in China). The same wealth-allocation pattern that raises land prices also raises the cost of capital. It is one mechanism, not two.
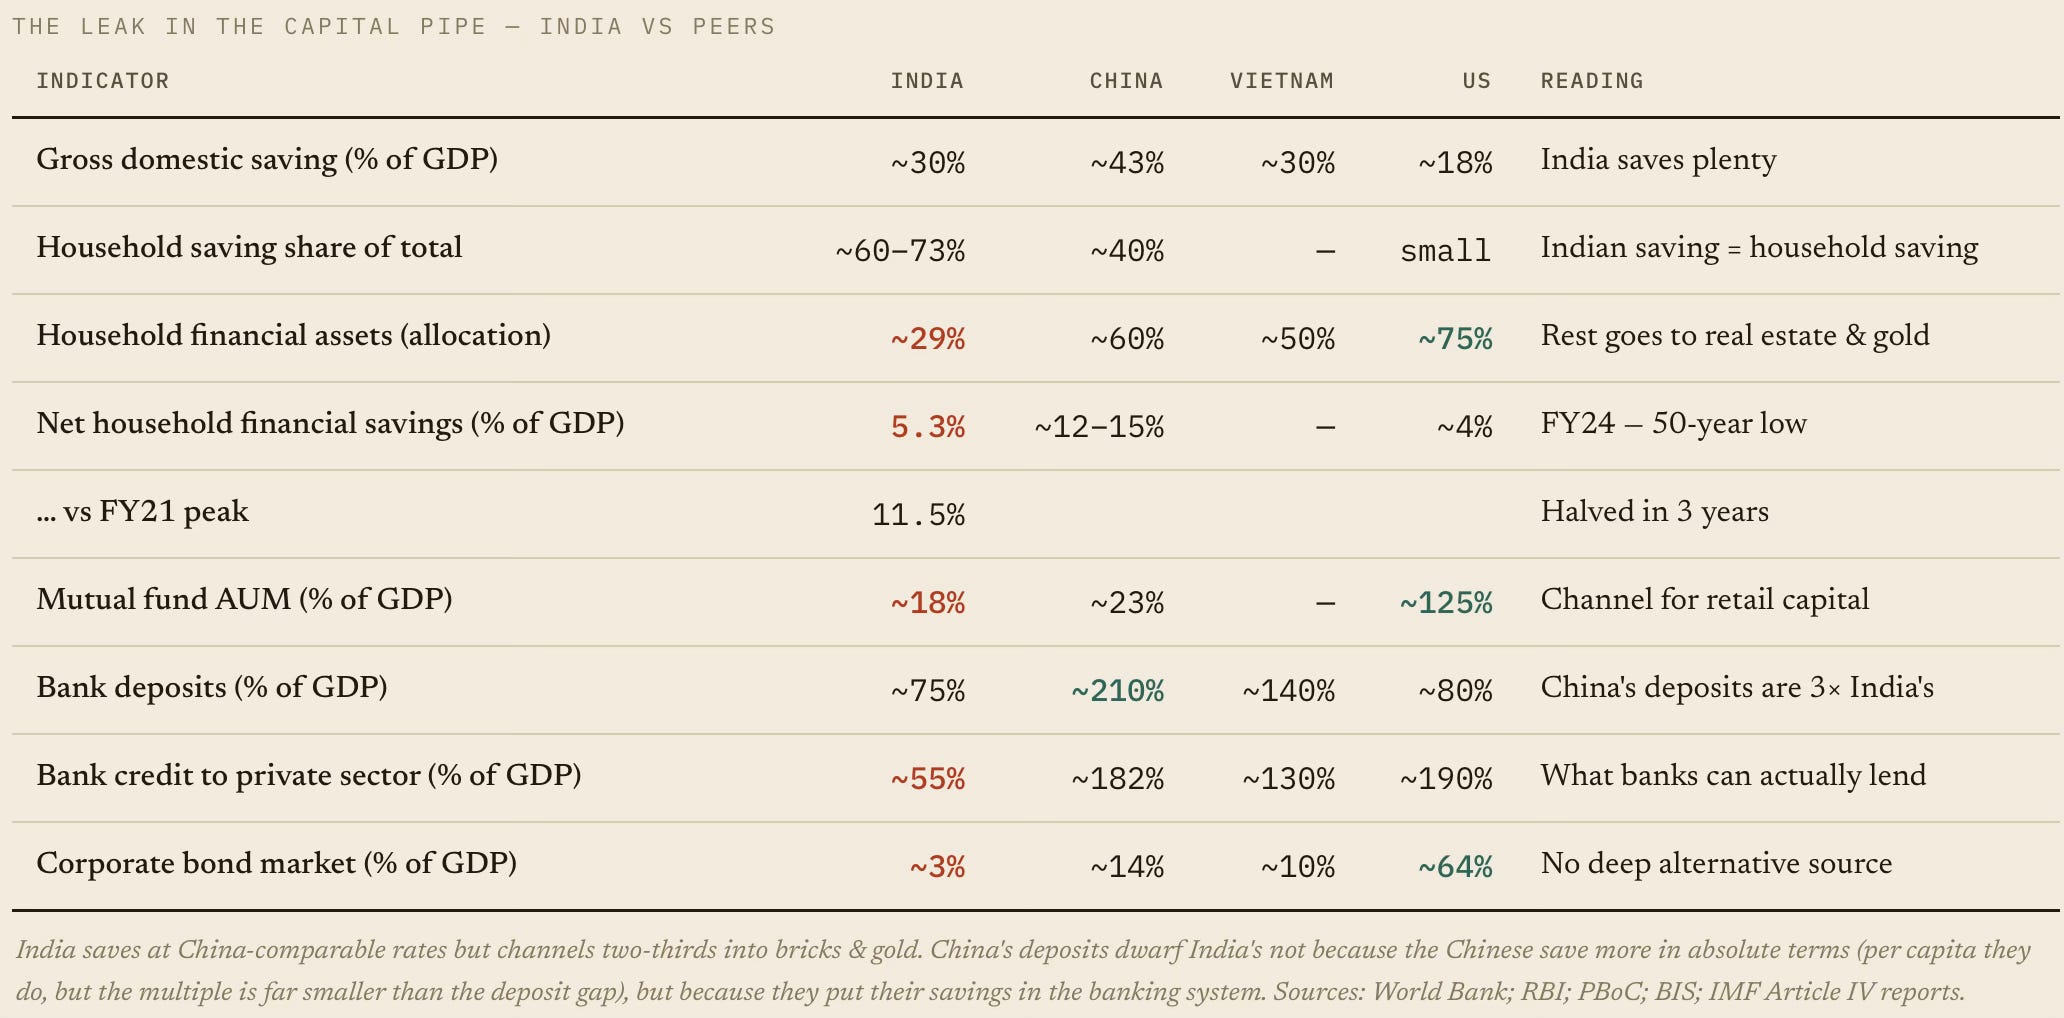
Worsening matters, the net household financial savings fell from ~11.5% of GDP in FY21 to 5.3% in FY24, a 50-year low. The table below breaks down how the cost wedge feeds itself. Households are borrowing more (against assets), and routing more new savings back into physical assets.
The cost constraints impact the economy in two ways. One, it restrains private investment. Second, it weakens global competitiveness and hurts exports.
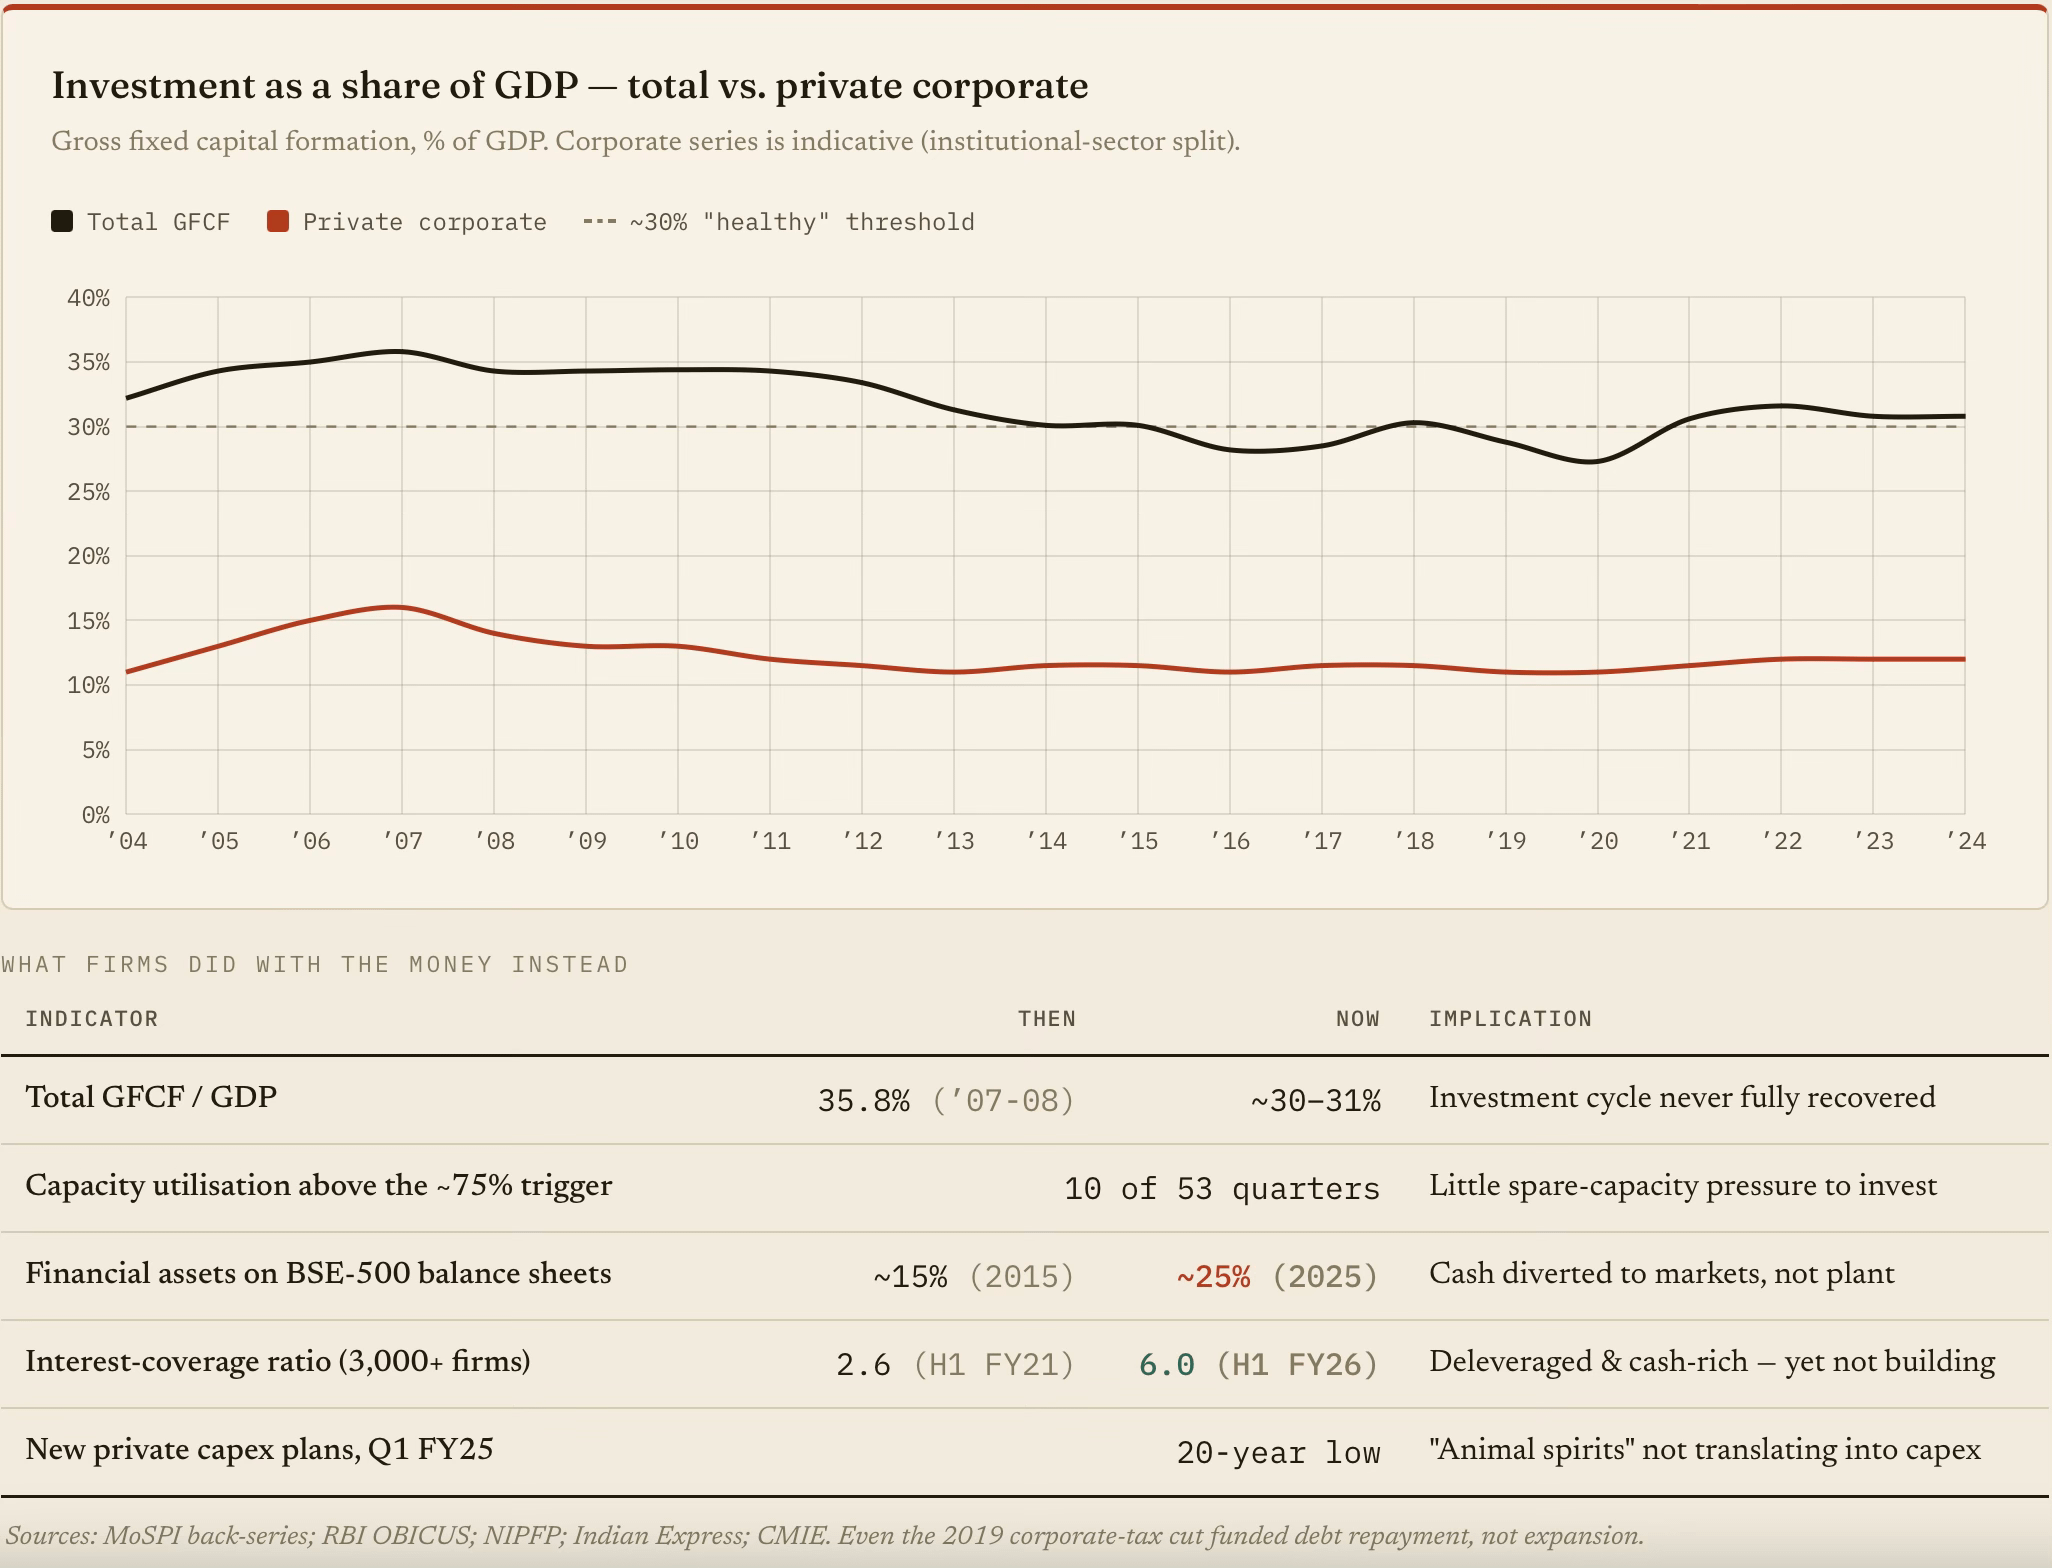
Take the first. Overall investment slid from a 35.8% peak in 2007-08. Public capex has since surged, but private corporate investment never recovered, flat near 11-12% of GDP. Flush with cash, firms deleveraged and bought financial assets instead of building capacity. I blogged here on this.
The East Asian economies found exports to rich countries as the outlet to overcome thin domestic demand and drive economic growth. Unfortunately, in India’s case, this is exactly the outlet that the cost wedge closes: dear capital, costly logistics, unreliable power and the world's highest tariff walls all erode competitiveness. The result is that India is losing its share of labour-intensive exports to Vietnam and Bangladesh , even as its overall merchandise share stalls near 1.8%.
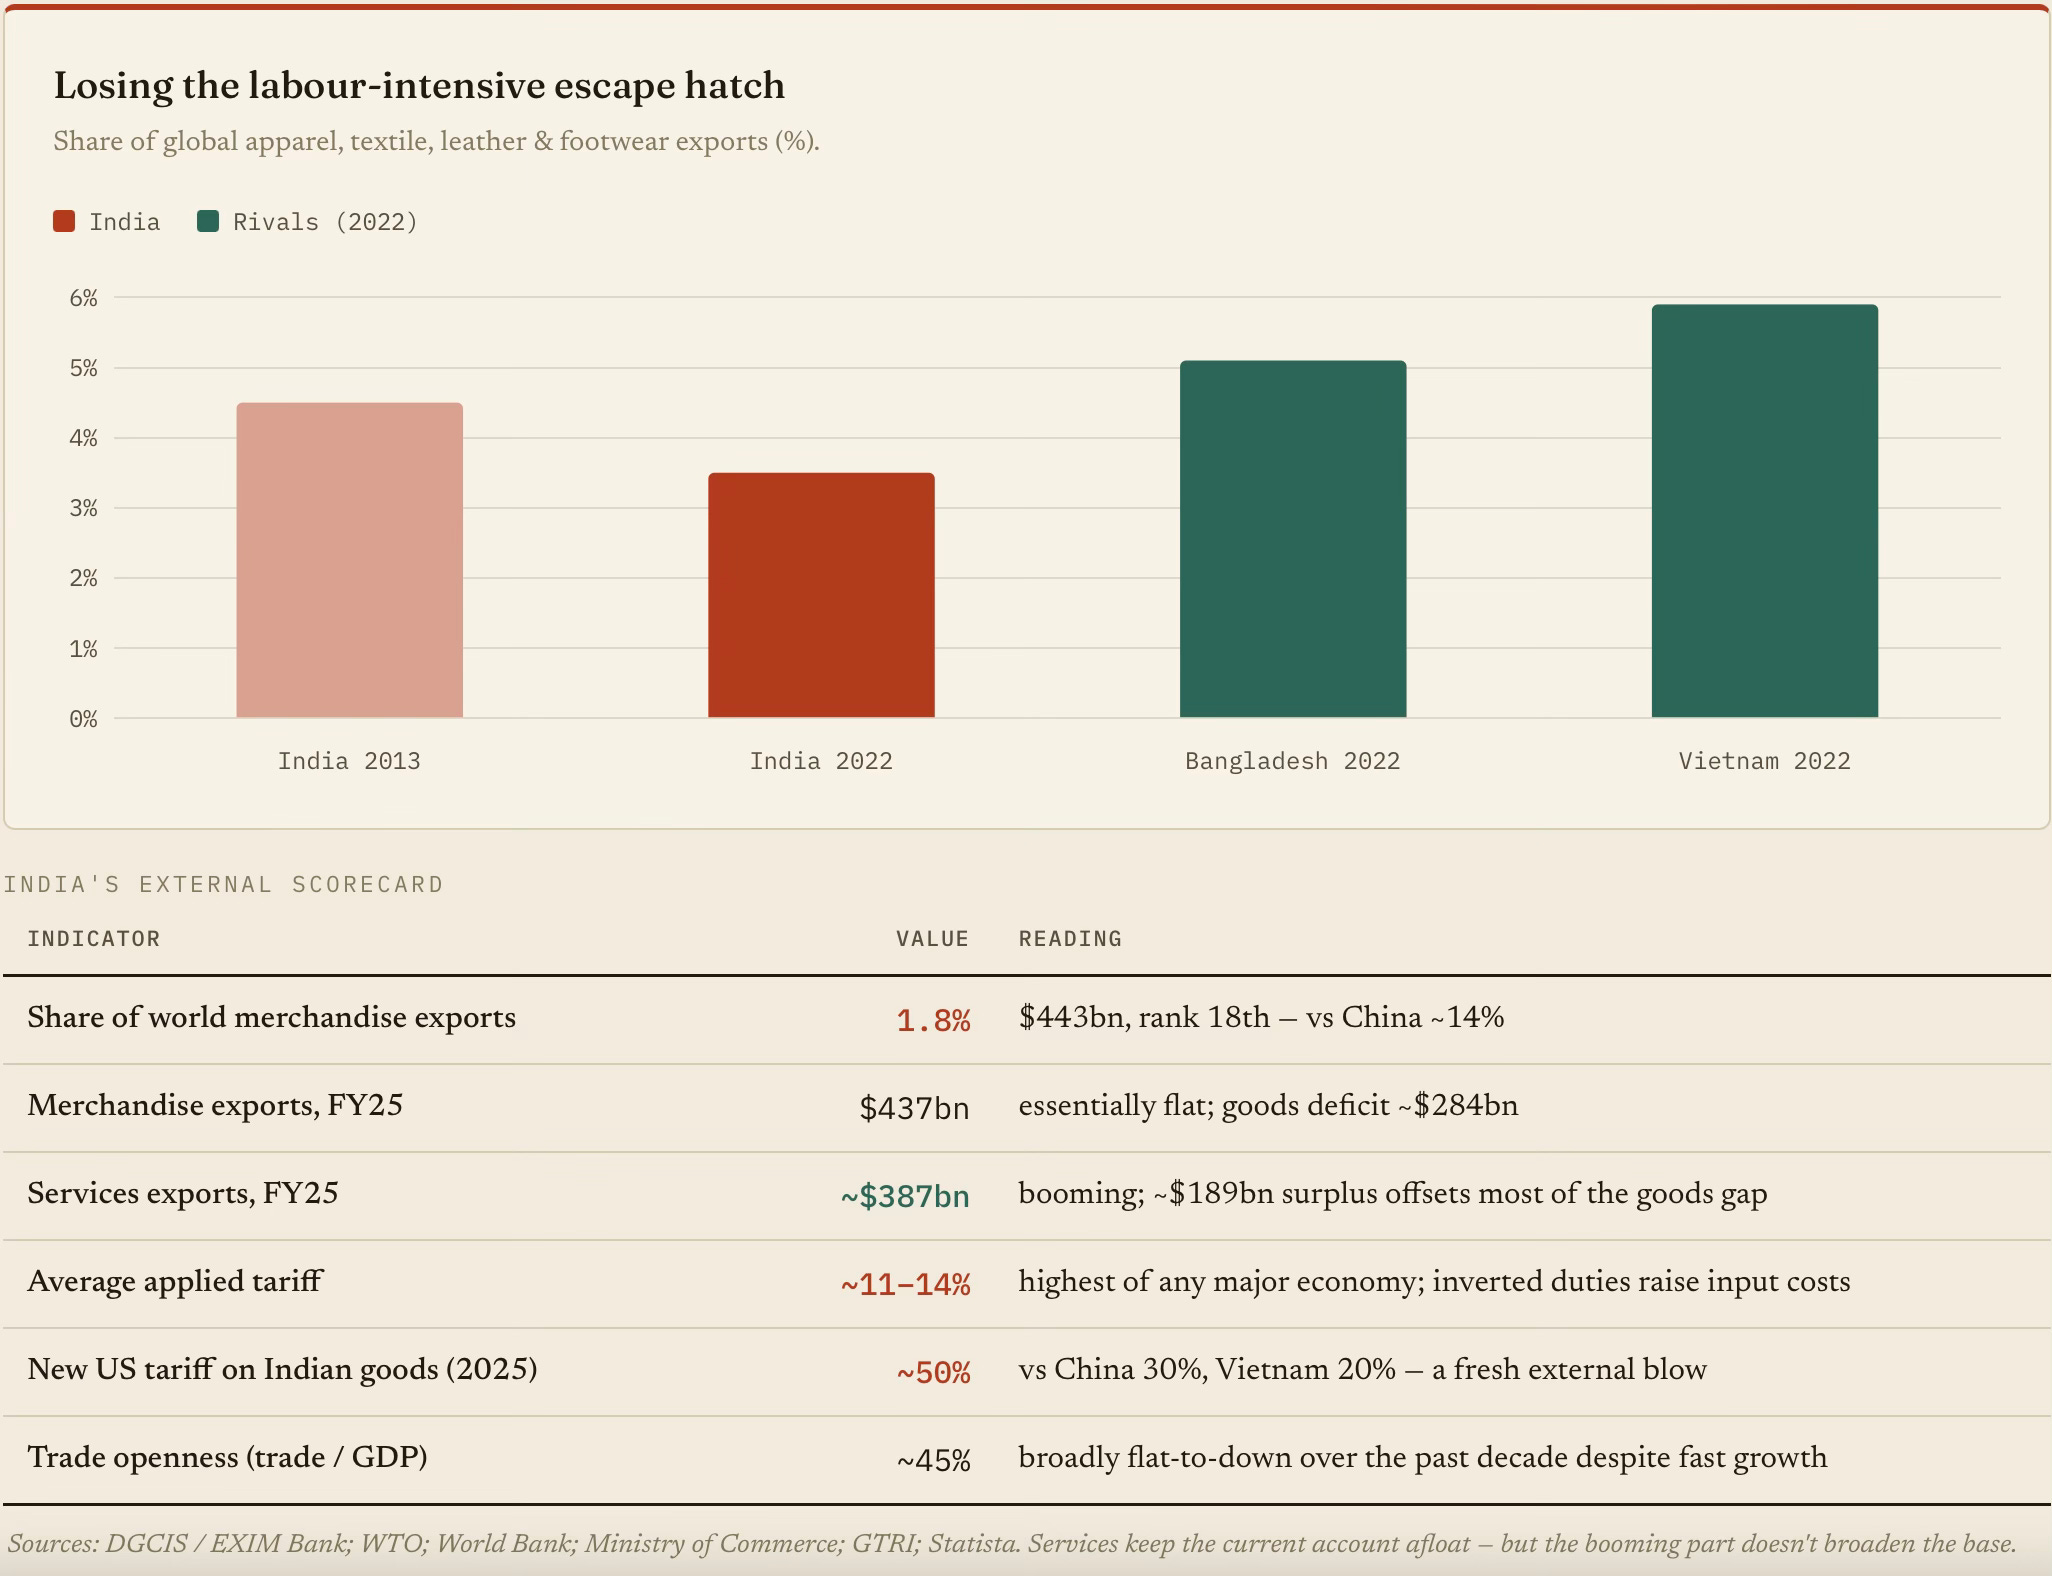
In fact, the Economic Survey 2016-17 chapter Clothes & Shoes: Can India Reclaim Low-Skill Manufacturing? warned that the space China vacated was being taken by Bangladesh and Vietnam in apparel, and Vietnam and Indonesia in leather and footwear. A decade later, the warning could not have been more prophetic.
In the net, India wins on wages (~$2.1/hour) but loses on net cost. So the disability is entirely from non-wage factors: capital, power, logistics, scale, tariffs on inputs, and productivity. India has a cost structure that is comparable to that of a developed country. That's the central analytical point.
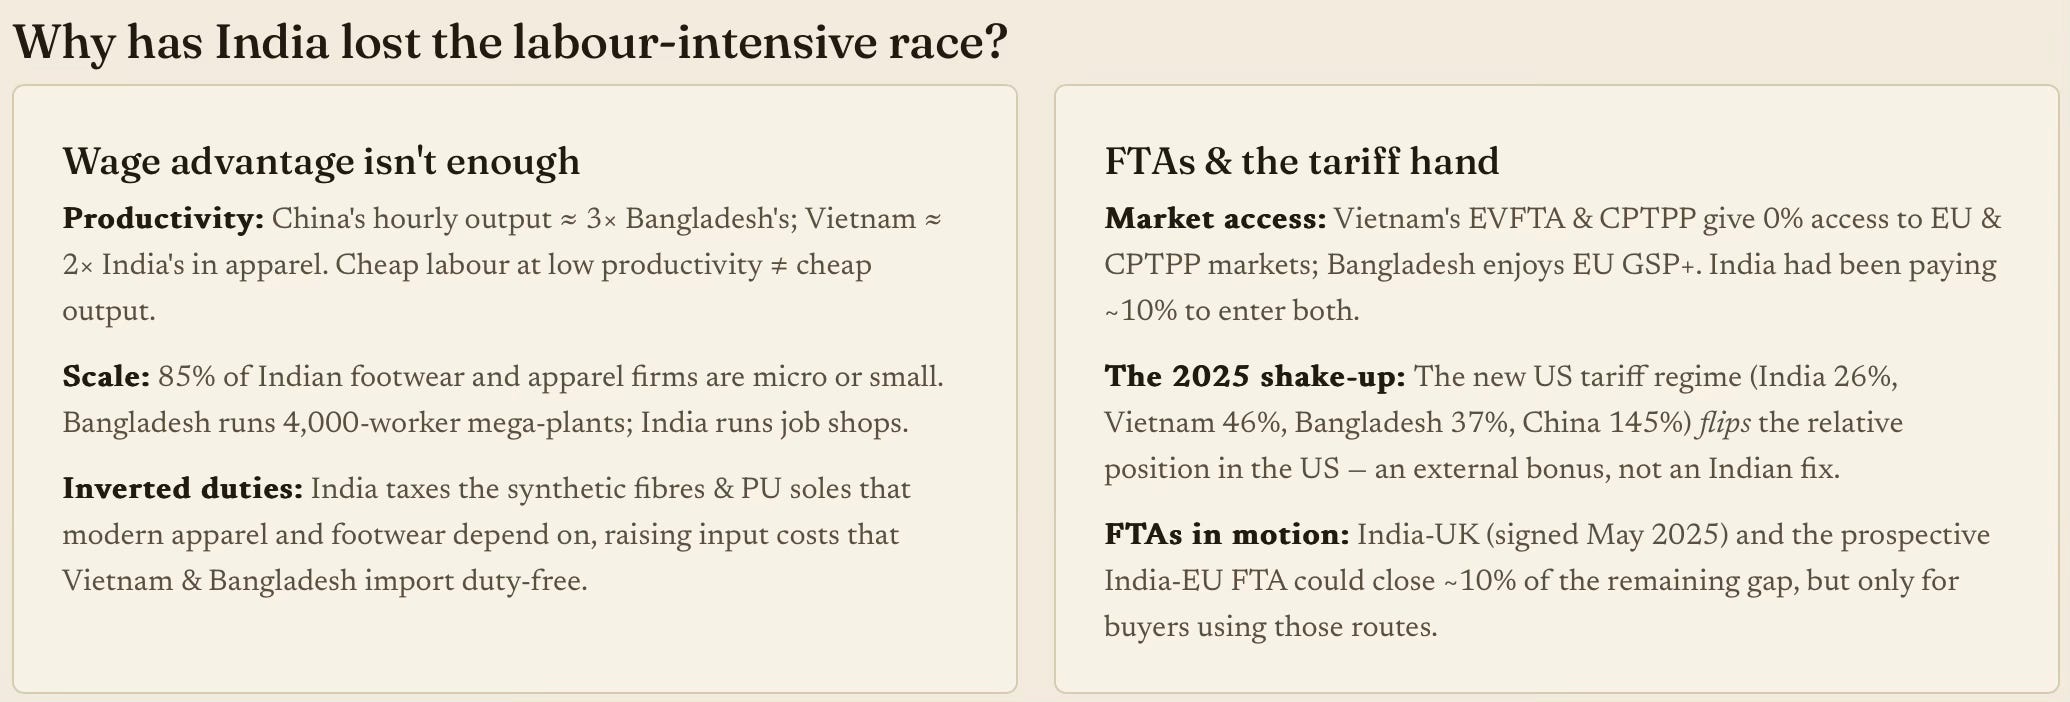
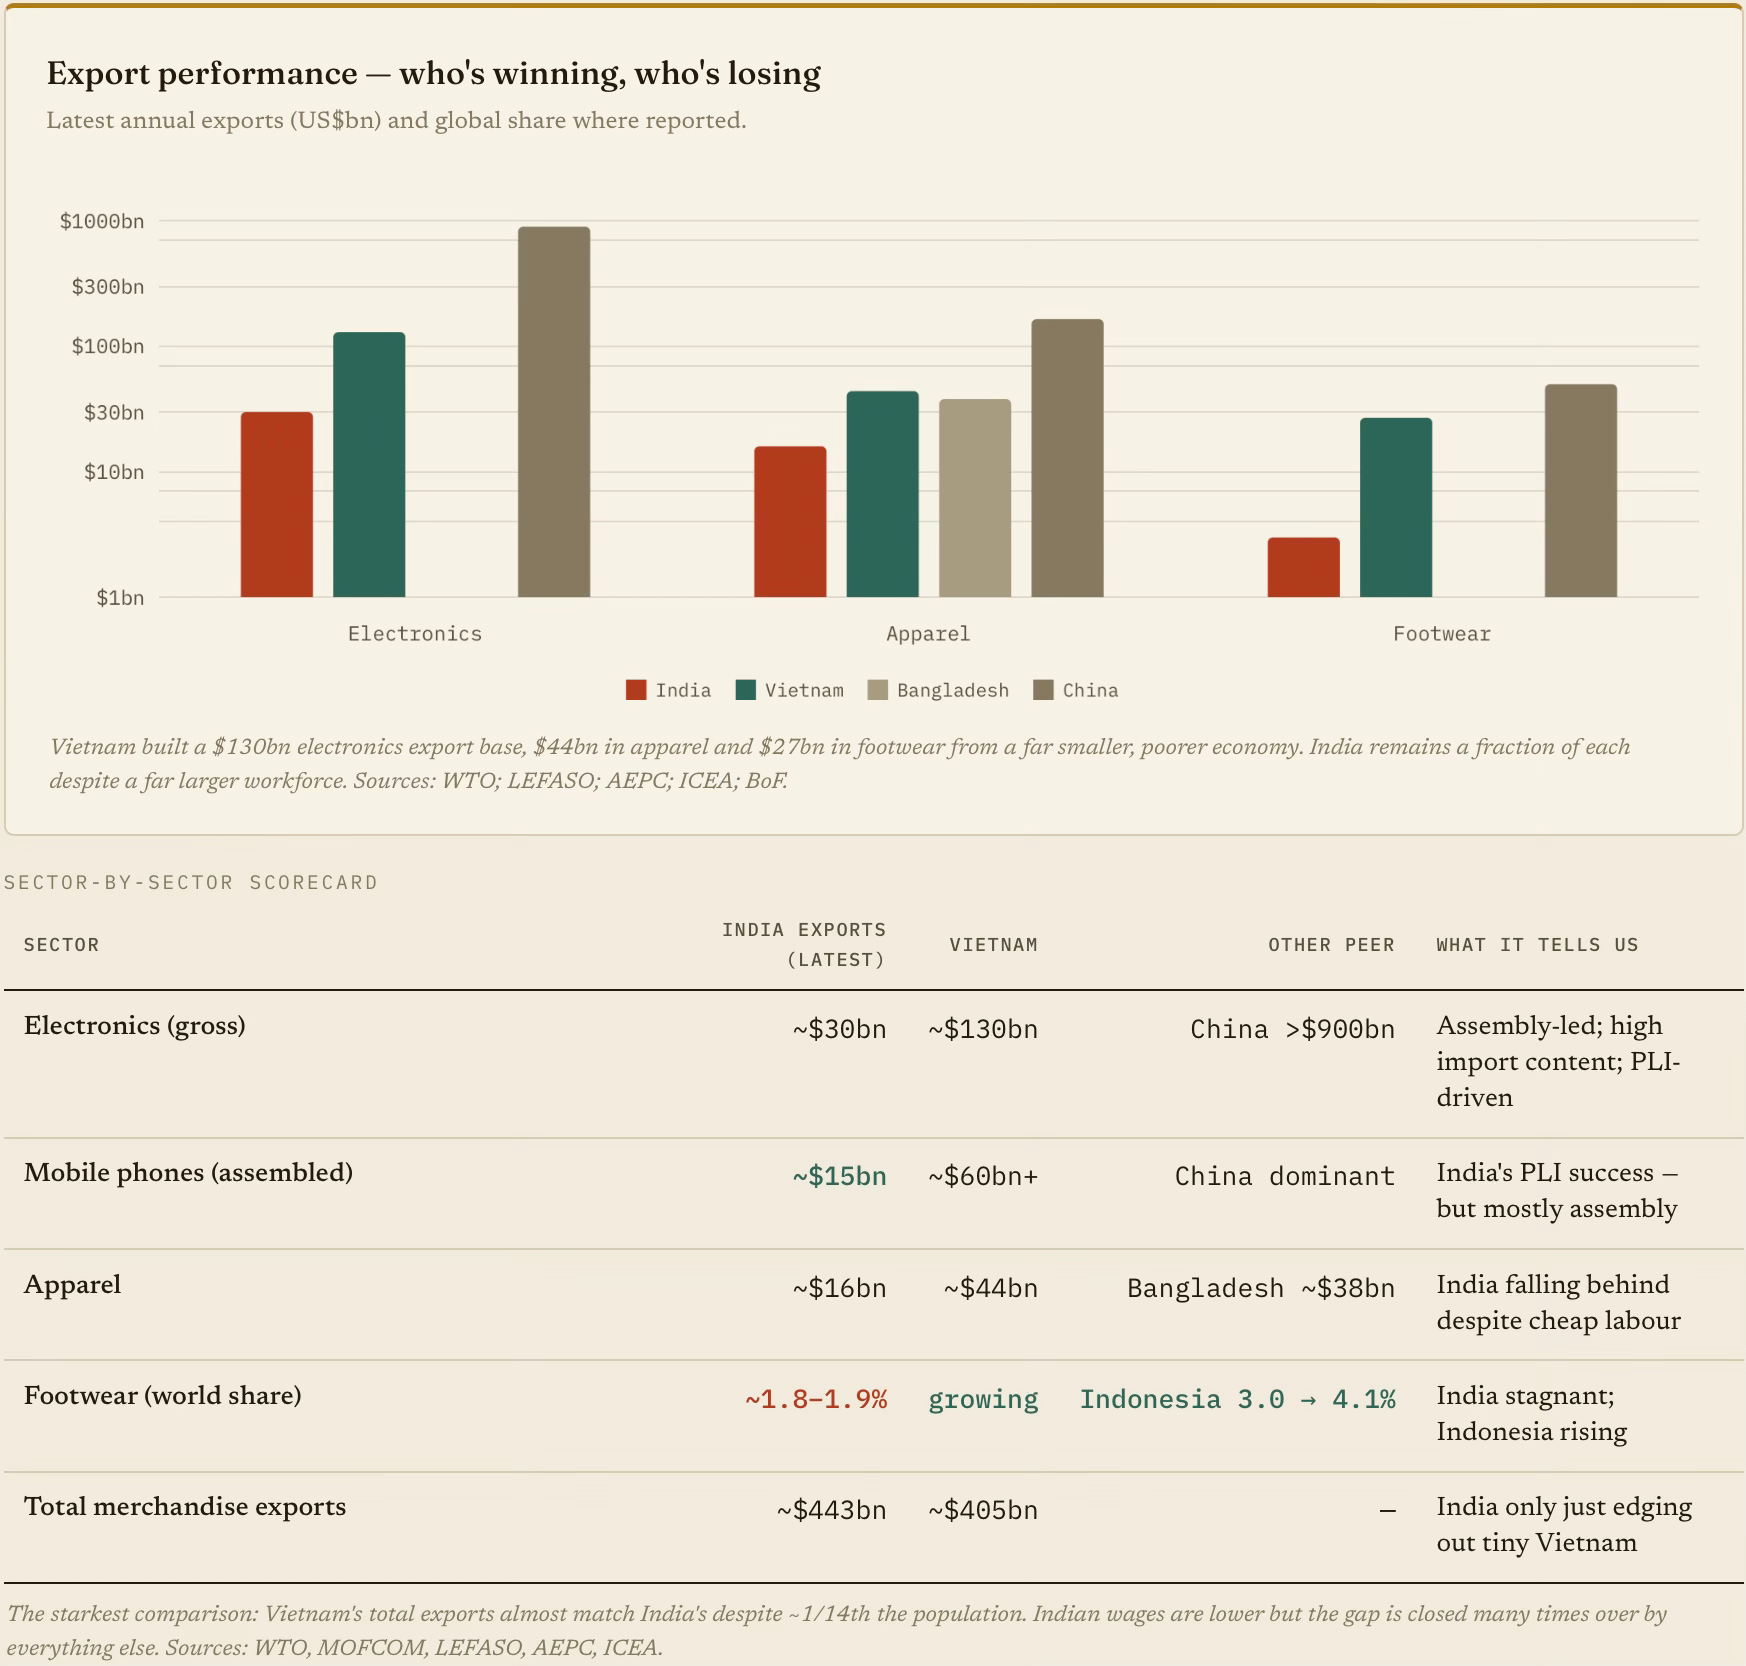
India enters every labour-intensive sector with the world's cheapest workers and exits with a 10–20% cost disability. This is proof that wages aren't the binding constraint. The wedge comes from the rest - scale, input tariffs, capital, power, logistics and productivity, in a market structure that punishes the firms that should be growing. This is why India hasn't replaced China, where Vietnam and Bangladesh have, despite the structural opportunity being identical for all three.
Indian businesses (and especially manufacturers) face a structural cost constraint. It does not have to do with taxation or wages, but with factors like land, power, fuel, cost of capital, input tariffs, labour productivity, and business size/scale. A disproportionate attention and effort go into taxation reforms instead of these more important structural limiting factors.
No comments:
Post a Comment