Adam Tooze points to a very good paper on the Chinese industrial policy in the shipbuilding sector by Panle Jia Barwick, Myrto Kalouptsidi, and Nahim Bin Zahur. See also this.
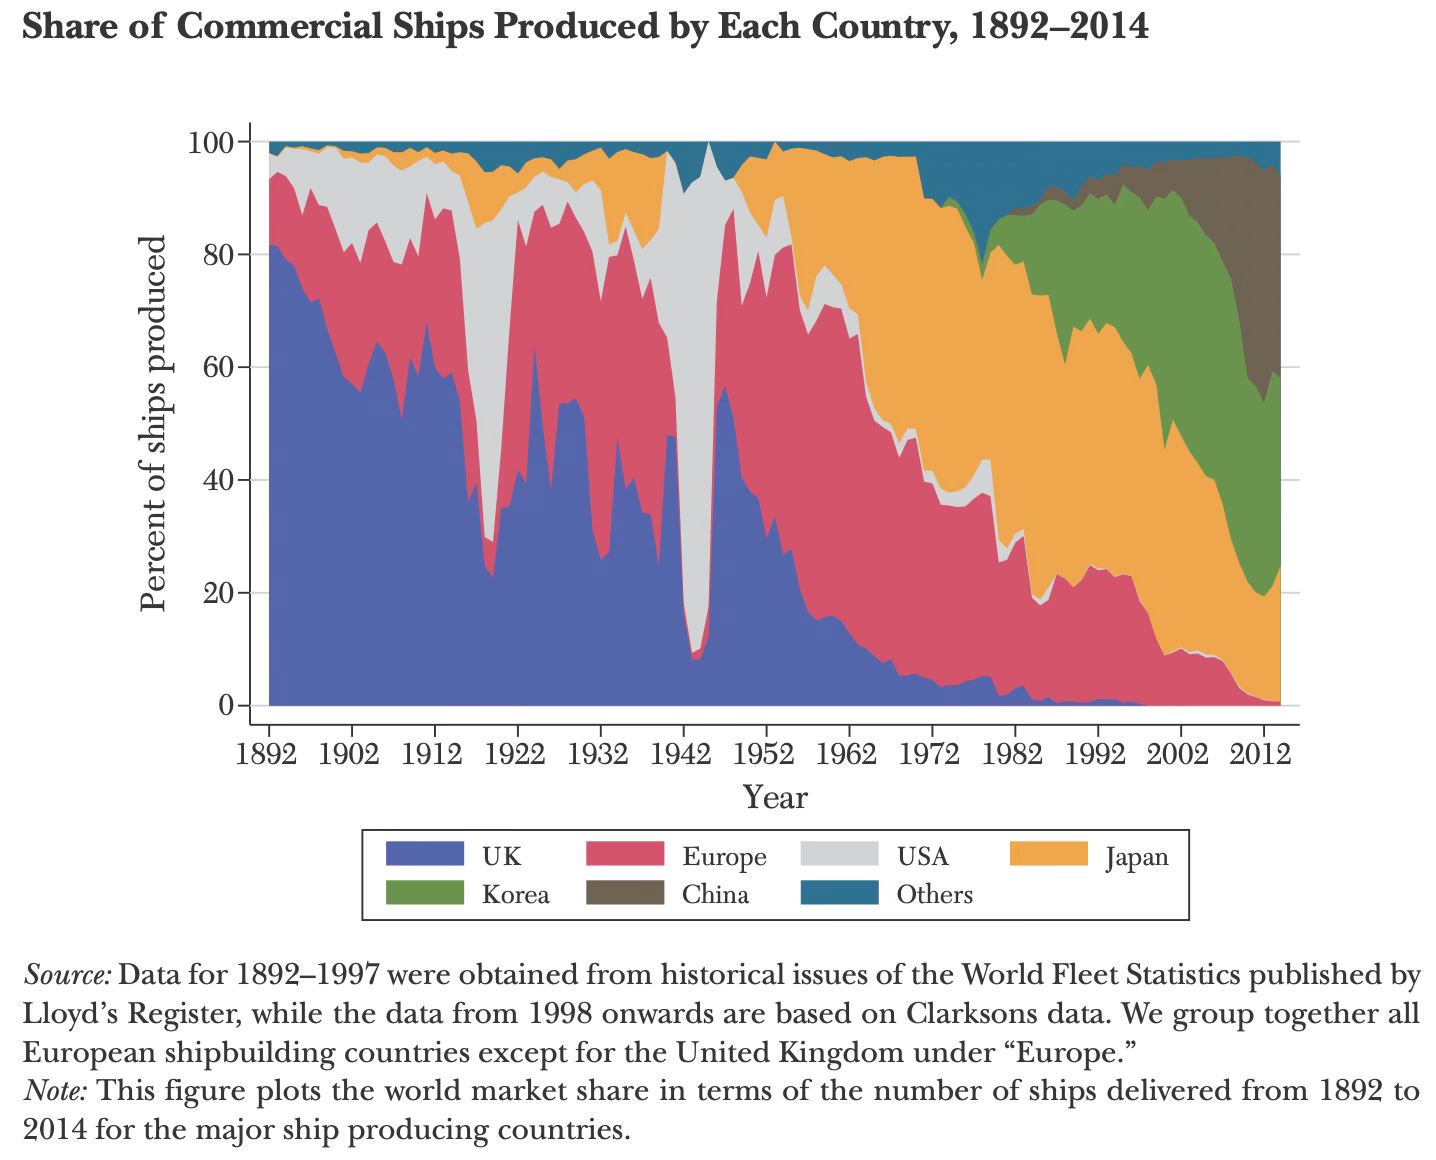
The shipbuilding industry has historically been dominated by industrial policy, including Europeans in the 1900s, Japan in the 1950s, South Korea in the 1980s, and China in the 2000s.
The shipbuilding industry is characterised by “shipbuilding cycles” of booms and busts. Since building large ships takes years, supply takes time to materialise when there are demand spikes, whence shipping rates surge, leading to spike in orders, and excess capacity which becomes evident when demand cools.
The paper points to the unique requirements of shipbuilding industry - a base on land, easy access to water (sea or rivers), materials such as steel and engines, (skilled) labor, integration between shipowners and shipbuilders - that favour some form of industrial policy.
The US is an interesting case study. It mobilised massive shipbuilding capacity during the duration of both the First and Second World Wars, though it did not survive the Wars. It has had the cabotage restrictions through the Jones Act, prohibiting foreign vessels from transporting goods between US ports and the “construction differential subsidies” provided to US shipbuilders until the 1980s were between 30-50% of the cost. However, it has never managed to sustain a large shipbuilding industry.
The Japanese and South Korean dominance coincided with the heavy industrialisation thrust of the respective governments. While Japan provided subsidised financing, export credits, and protectionism, South Korea gave low-interest loans and government debt guarantees, as well as direct investment in shipbuilding facilities. South Korea targeted shipbuilding as an export sector. While Japan dominated the production of bulk carriers, South Korea dominated the production of higher-end, specialised oil tankers and containerships.
The Japanese, Korean, and Chinese industrial policies could be counted as a success to the extent that they propelled each of them to start from virtually nothing to come to be the dominant global shipbuilding power. In contrast, the European and American examples show the limitations.
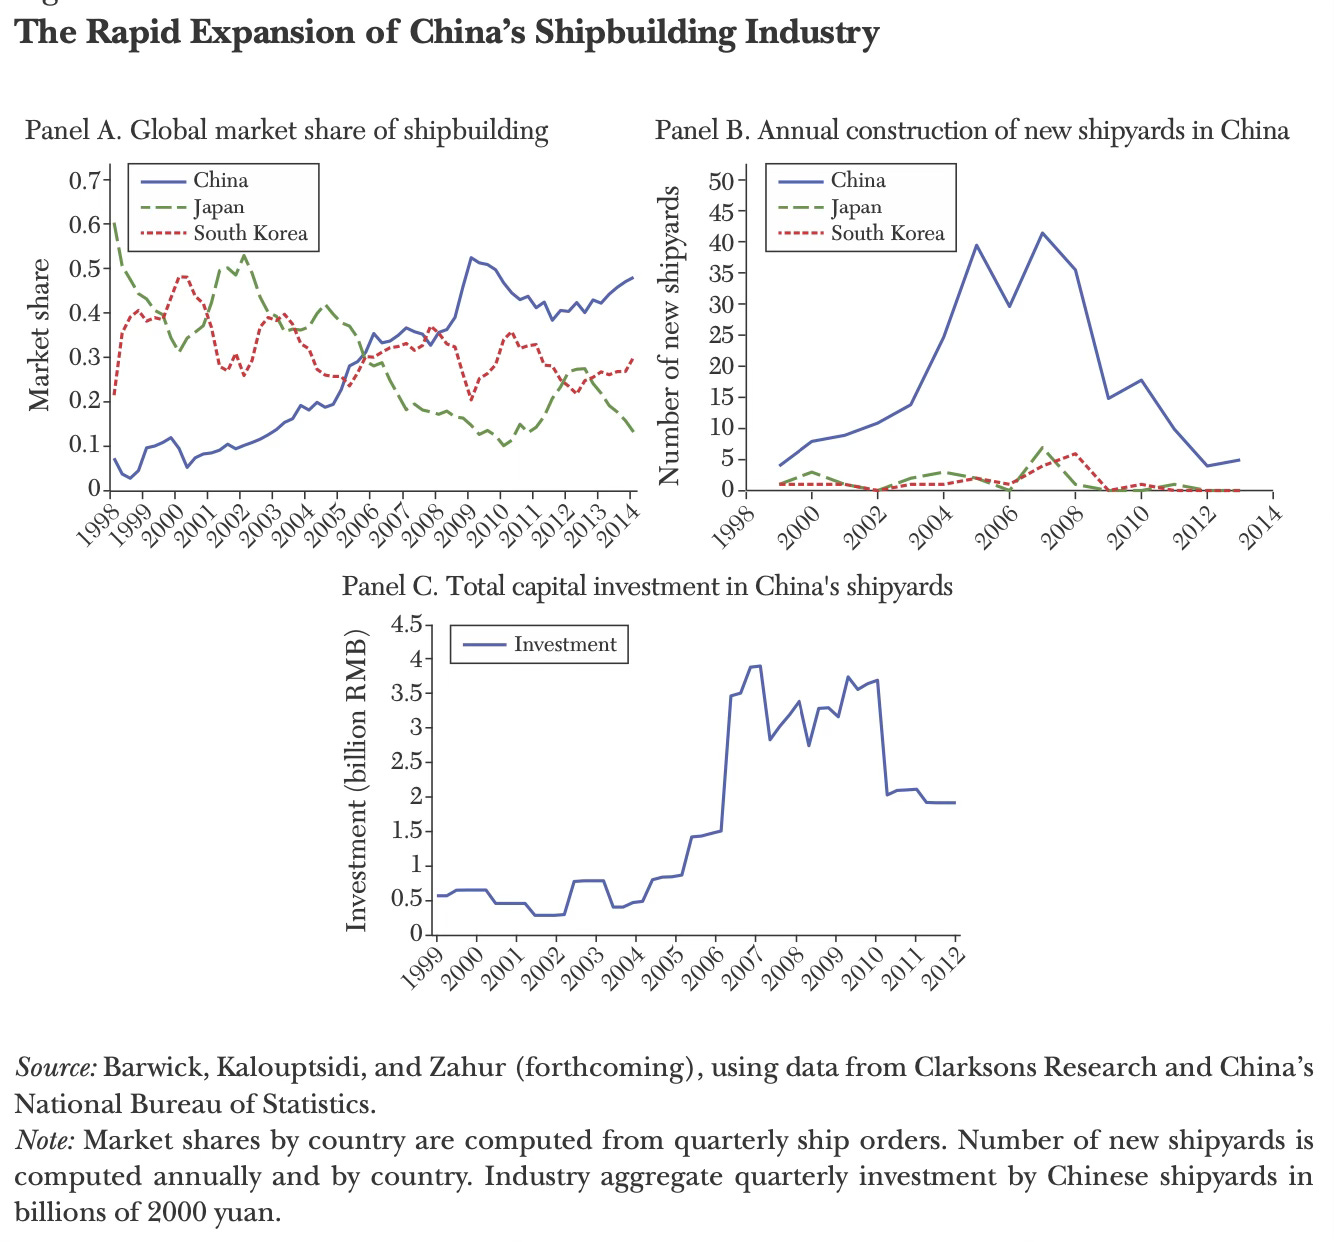
The rise of Chinese shipbuilding industry can be traced back to the 2003 decision to build three shipbuilding based in the Bohai Sea area and the East Sea area. The 11th Five Year Plan 2006-10 made shipbuilding a “strategic industry” in need for “special oversight and support”.
The authors categorise Chinese support for the industry into three groups. “Entry subsidies” like below-market-rate land prices along coastal regions and simplified licensing procedures encouraged new shipyards. Regional government owned banks provided shipyards with “investment subsidies” in the form of favorable financing like low-interest long-term loans and preferential tax policies. The government also gave “production subsidies” in the form of subsidized material inputs (cheap steel), export credits, and buyer financing (the last two made Chinese shipyards attractive to global buyers).
Between 2003-09, China’s shipbuilding market share rose from 14% to 53%, on the back of the entry of 173 new firms. At the peak of the boom, China had more than 250 shipyards. Unlike the large conglomerates who got industrial policy support in Japan and Korea, the Chinese policy led to several small firms who focused on the least high-tech ships bulk carriers of smaller sizes and avoided the more sophisticated containerships and oil tankers.
The shipbuilding boom in 2000s also coincided with the period of surge in Chinese imports (commodities) and exports (manufactures), whose transportation also provided a captive market for the shipyards. The trade surge led to scarcity and rise in prices, which made shipowners place large orders, which led to an investment boom in 2006-10. Then the Great Recession struck, leading to idling of shipping fleet and closure of many shipyards. In response, the government initiated the “2009 Plan on Adjusting and Revitalising the Shipbuilding Industry” which stopped all new entry, restricted support towards firms selected based on performance criteria in a “White List”, and encouraged industry consolidation.
Once consolidation started, the Chinese shipbuilders also started to move up the value chain into larger sized bulk carriers and smaller containerships. Since 2013, China has been the world’s leading shipbuilder accounting for 54% of tonnage delivered in 2022 to 28% for South Korea and 18% for Japan. It’s also the leader in containerships though they tend to be smaller sized.
The paper builds a structural model of the global market for ships using historic data from 1998-2014. They use the model to back out the extent of Chinese subsidies.
We know that China’s subsidies for shipbuilding started in 2006. We use data from all countries before 2006 to estimate a shipbuilding cost function. This cost function should then continue to predict shipbuilding outside of China after 2006; however, it can only match China’s shipbuilding after 2006 by including a measure of what subsidies must have been… We are particularly interested in whether this cost function exhibits an abrupt and otherwise inexplicable change around 2006 that makes Chinese ship- yards’ production costs all of a sudden lower. The idea is to essentially ask whether Chinese firms are “over”-producing, compared to our prediction from the earlier production function…
Our estimates suggest that China provided $23 billion in production subsidies between 2006 and 2013. This finding is driven by the cost function obtained from this analysis, which exhibits a significant drop for Chinese producers equal to about 13–20 percent of the cost per ship. Simply put, Chinese shipbuilding firms were “over”-producing after 2006 compared to our prediction of output without subsidies… there are no “breaks” in the estimated cost functions of Japanese or South Korean shipyards. In addition, the results are robust to many different specifications, as well as different ways of accounting for temporal changes.
They have a very good summary of the magnitude of Chinese subsidies
Our estimates suggest that China provided $91 billion in subsidies along all three margins—production, entry, and investment—between 2006 and 2013, averaging over $11 billion per year, which totaled nearly 50 percent of Chinese shipbuilding industry revenue over that period. This is considerably larger than the $23 billion that (according to our estimates) was provided in production subsidies alone. Thus, all firm decisions—entry, exit, and capacity investment in addition to production—matter in evaluating the impact and effectiveness of industrial policy. Indeed, entry subsidies were 69 percent of total subsidies, while production subsidies were 25 percent, and investment subsidies accounted for the remaining 6 percent. This empirical pattern reflects that shipbuilding firms “over-entered (recall the astonishing entry rates during the boom years of 2006–2008) and “over-invested” (recall the striking increase in investment during the bust)…
Our structural model suggests that China’s industrial policy in support of shipbuilding boosted China’s domestic investment in shipbuilding by 140 percent, and more than doubled the entry rate: 143 shipbuilding firms entered with subsi- dies versus 64 without subsidies from 2006 to 2013. It also depressed exit. Overall, industrial policy raised China’s world market share in shipbuilding by more than 40 percent.
Its welfare impacts and efficiency gains are nuanced.
First, 70 percent of China’s output expansion occurred via taking business from rival countries. From a global perspective, Chinese subsidies reduced South Korea’s world market share from 48 percent to 39 percent and Japan’s market share from 23 percent to 20 percent during 2006–2013, with profits earned by shipyards in these two countries falling by ¥144 billion (in US dollars, roughly $21 billion). There is evidence (backed by our cost estimates) that Chinese shipyards are less efficient than their Japanese and South Korean counterparts; thus, the transfer of shipbuilding to China that occurred constitutes a misallocation of global resources. Second, China’s industrial policy for shipbuilding led to considerable declines in ship prices. Lower ship prices benefited world ship-buyers somewhat, though only a modest amount accrues to Chinese ship-buyers, as they accounted for a small fraction of the world fleet.
Finally and most importantly, although China’s shipbuilding subsidies were highly effective at achieving output growth and market share expansion, we find that they were largely unsuccessful in terms of welfare measures. The program generated modest gains in domestic producers’ profit and domestic consumer surplus. In the long run, the gross return rate of the adopted policy mix, as measured by the increase in lifetime profits of domestic firms divided by total subsidies, is only 18 percent, meaning that for every $1 the government spends, it gets back 18 cents in profitability. In other words, the net return when incorporating the cost to the government was a negative 82 percent, with entry subsidies explaining a lion’s share of the negative return.
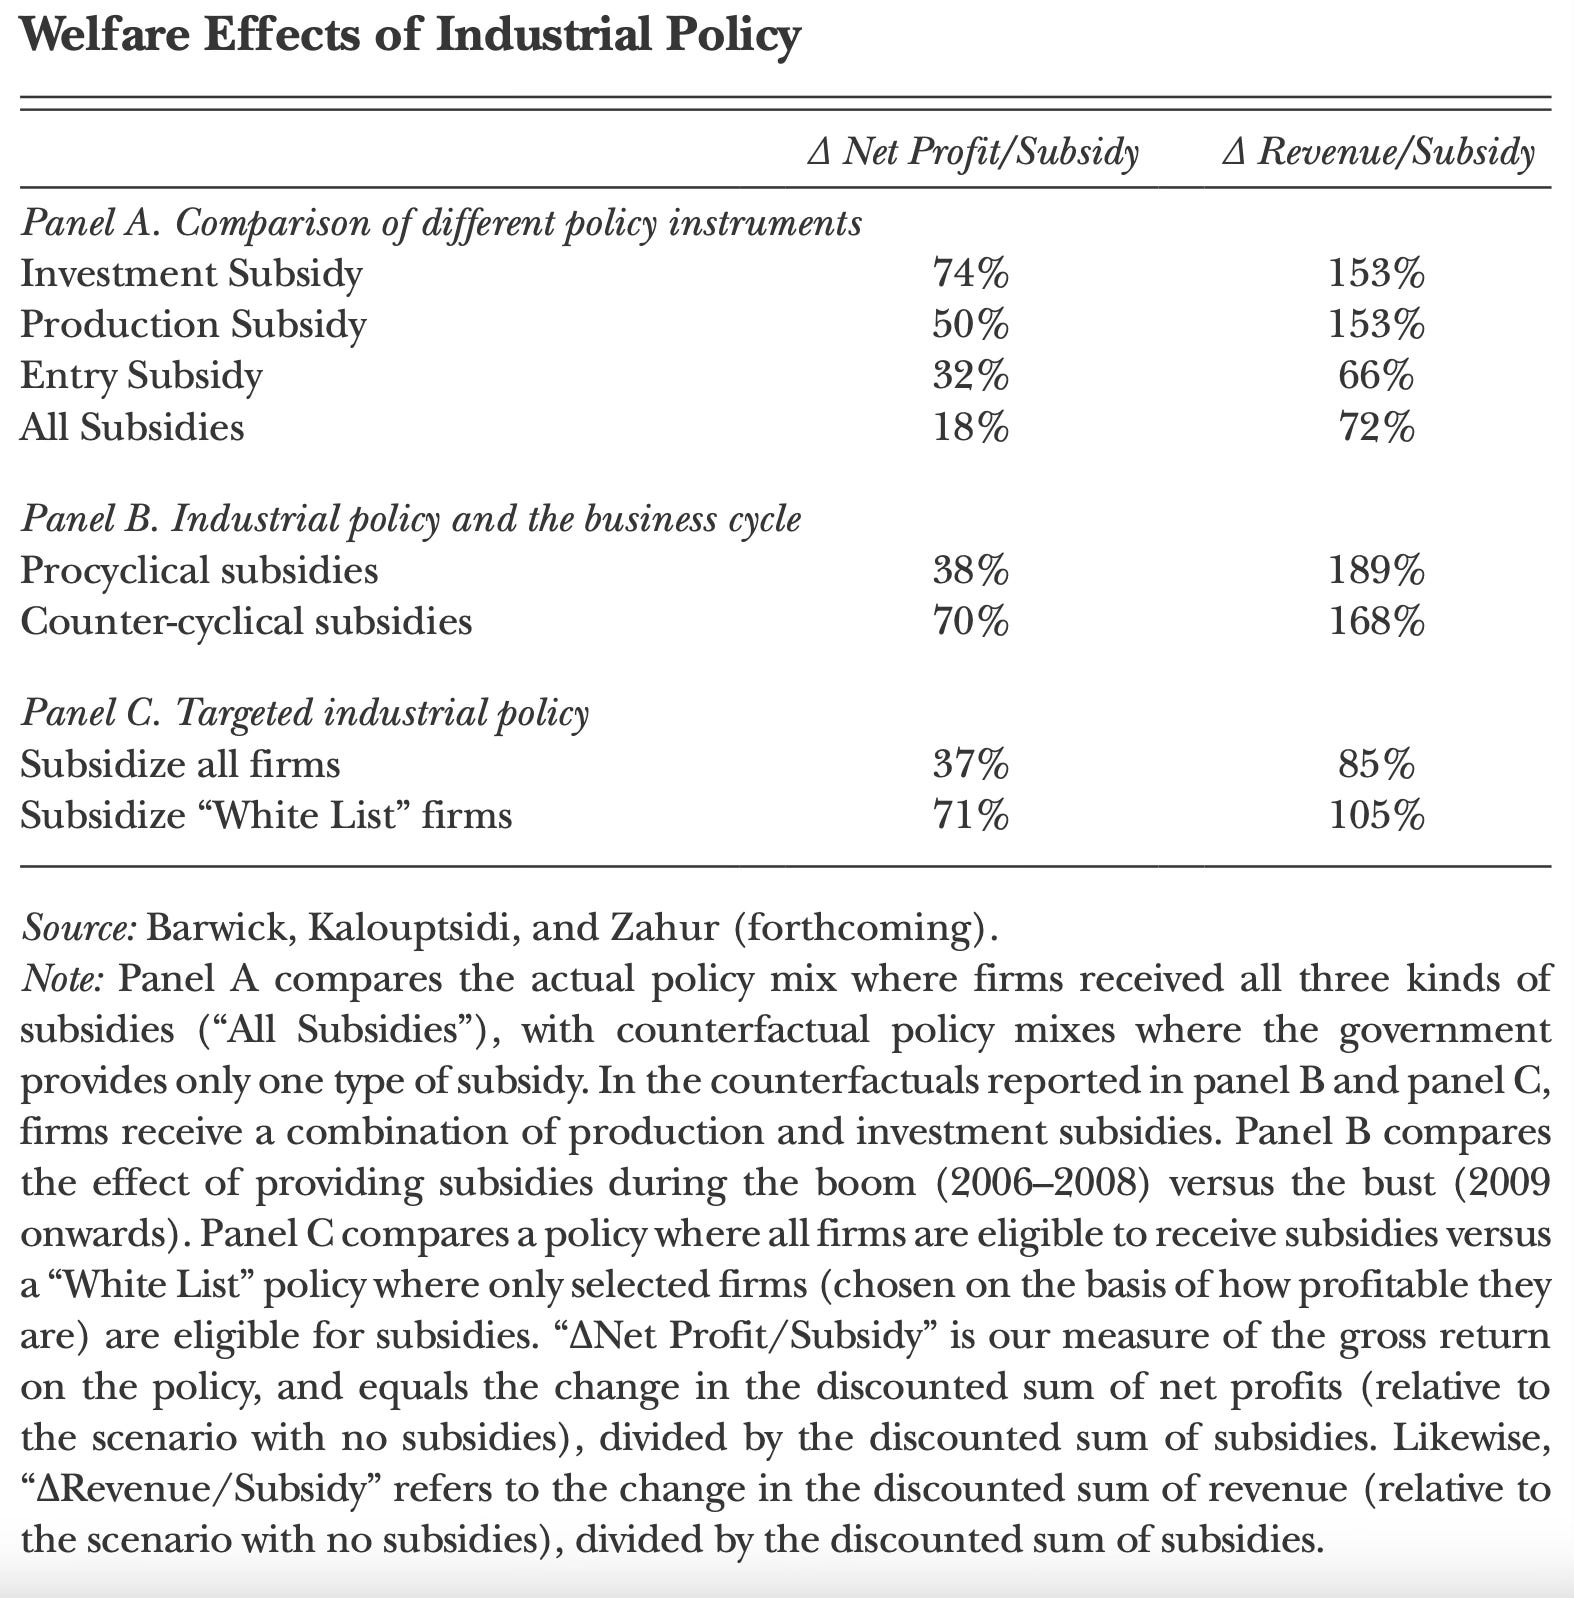
While none of the subsidies can be justified in terms of life-time profits, production and investment subsidies can be justified on revenues maximisation objective. They are also more common given the ease of setting and monitoring quantity and revenue targets. Entry subsidies are the most inefficient, also because it leads to the entry of small and weak firms, industry fragmentation, and over-capacity. In fact, while 82% of production subsidies and 68% of investment subsidies were allocated to more efficient firms (than the median firm), they got only 49% of entry subsidies. Further, since more than 80% of the ships produced were exported, most of the subsidies leaked out to benefit foreign buyers.
Furthermore, while counter-cyclical subsidies (subsidies given during downturns) were more beneficial, they formed a smaller share. As an example, 90% of the total subsidies were handed out between 2006-08, whereas just 10% went between 2009-13.
Interestingly, the consolidation policy adopted after the financial crisis was a success. The “white list” of prioritised firms for government support was in keeping with the standard Chinese industrial policy playbook - encourage and support large scale entry and intense competition, then step in to consolidate by allowing the weak to fail and supporting the strong to emerge as national champions who can compete globally. The “white list” firms generated gross rate of returns of 71% of subsidy, compared to 37% for all firms. However, since the “white list” was dominated by state-owned firms, inefficiencies persisted. But the “white list” approach of targeting is doubtless more efficient use of industrial policy.
The paper points to two possible externalities from China’s industrial policy support for shipbuilding.
China became the world’s biggest exporter and a close second largest importer during our sample period… Shipbuilding subsidies reduced bulk carrier freight rates by 6 percent and containership freight rates by 2 percent between 2006 and 2013. Using trade elasticities from the literature, the industrial policy raised China’s annual trade volume by 5 percent ($144 billion) between 2006 and 2013. This increase in trade was certainly large relative to the size of the subsidies (which averaged $11.3 billion annually between 2006 and 2013)…
Second, China’s military ship production might have benefited from industrial policy with regard to shipbuilding. Military ship production is concentrated at state-owned yards, especially at 13 subsidiaries of China State Shipbuilding Corporation (CSSC) and China Shipbuilding Industry Corporation (CSIC), the two largest conglomerate shipyards that are state-owned. These subsidiaries are typically dual-use, producing both commercial and military ships in the same complex… the annual deliveries of naval and commercial ships from 2006 to 2013… experienced a several-fold increase… providing suggestive evidence that China’s supportive policy might have benefited its military production as well.
On Chinese industrial policy, this and this are good articles on how China came to dominate the solar industry, this, thisand this on how China came to dominate the EV industry, how BYD came to dominate the EV and battery market, and this about its dominance in clean energy minerals production.
No comments:
Post a Comment