At a time when India’s manufacturing sector is buffeted by several headwinds that threaten a premature de-industrialisation, the services sector is predominantly informal and suffers from poor productivity, and also given India’s recent struggles with structural transformation (the latest PLFS data shows that the share of agriculture in India’s labour force has remained persistently high, even reversing course since 2018-19 to increase from 42.5% to 45.76% in 2022-23), it’s important that to achieve broad-based economic growth public debates should focus more on improving the productivity and incomes from agriculture.
But agriculture is one of the hardest areas for policy
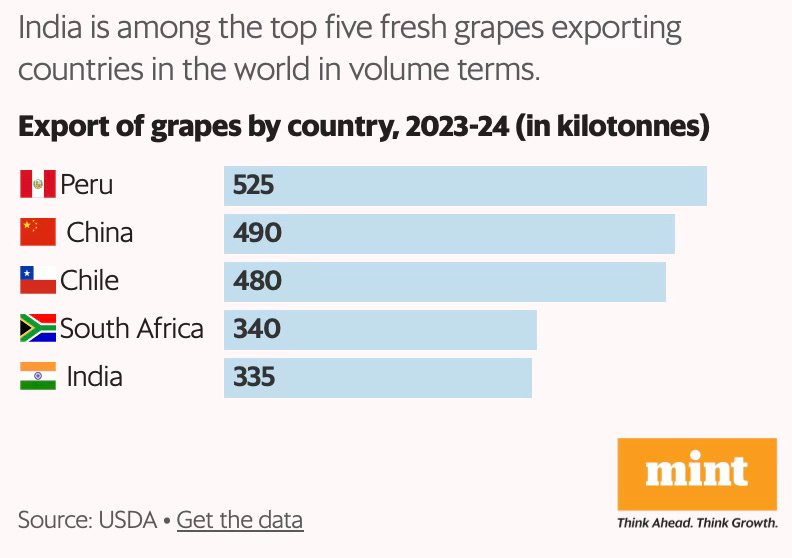
In this backdrop, the rapid rise of Ethiopia and Kenya as leaders in cut-flower exports and Peru as the runaway leader in blueberry exports are impressive success stories. This post will point to three similar successes of exports from India in a short time, table grapes (and wine) from the Nashik area of Maharashtra, inland shrimp farming in the Godavari and Krishna delta districts of Andhra Pradesh, and pomegranate in a few districts of Rajasthan.
A feature of these examples is the absence of any specific efforts by the government to promote the specific sectors, beyond the provisioning of irrigation and some inputs and enablers generally available for agriculture. Instead, all of them have built on the enterprise of local farmers, especially the dynamic entrepreneurs among them.
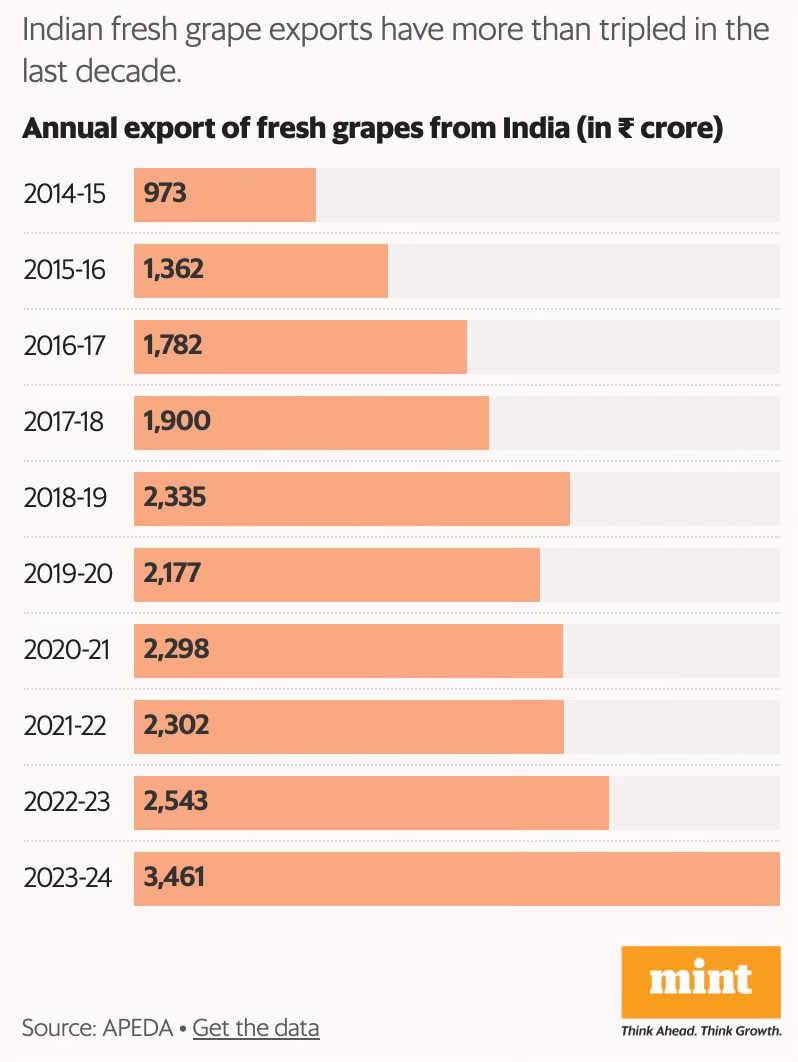
Sayantan Bera in Livemint has a great story about the remarkable success in a quick time of table grape production and exports centred around Nashik.
In 2023-24, India exported fresh grapes worth ₹3,461 crore, a 36% increase year-on-year, and a 3.5-fold jump over ten years. Close to half of the export volumes (45.8% in FY24) originated from just one district, Nashik, in northern Maharashtra, which has emerged as both India’s grape and wine capital. Riding on Nashik’s output, Maharashtra accounts for 67% of the country’s total production, with Karnataka (28%) and Tamil Nadu making up the rest… Grapes are a perennial crop and a plantation can be in production for up to 15 years. India primarily grows white (they are called white though they appear a vibrant shade of green) seedless varieties like Thompson, elongated varieties like Sonaka and black varieties like Crimson and Sharad… the vines require care and monitoring through the year… average production costs are around ₹2.5 lakh per acre.
You can spot Indian table grapes in global supermarkets, be it Tesco or Edeka in Europe or Choices Market in Canada, with farmers like Boraste catering to the exacting standards of fussy western buyers. The grapes supplied to Europe, for instance, have to be a certain size (berry size of 16-20 mm in diameter), be crisp and sweet (but not too sweet) besides meeting a long list of other quality parameters… a highly competitive export market for grapes has ensured lucrative prices for growers. For instance, in the 2024 harvest season (January to April) farmers received ₹65-70 for every kg of grapes they exported, much higher than the wholesale domestic price, which averaged between ₹25-30 per kg.
While there were general enablers from the government, the specific industrial success appears to have emerged from local initiatives.
First, they are highly perishable and would perish within ten days of harvest without a cold chain. But Indian farmers and traders have cracked the storage challenge and now export grapes to distant shores—to Europe and Canada and closer home to China and the Middle East, where the fruit travels for up to a month on the seas. This is done by precooling the harvest at zero degree Celsius and then maintaining a cold chain that extends shelf-life to 45-60 days, till it reaches the consumer. Secondly, in a wild domestic market with few quality checks, farmers upgraded themselves to meet the exacting standards of western markets. They now produce grapes that are traceable (meaning, a consumer knows which field it comes from), closely monitor the sugar and acidity levels (which determine how the grapes taste), and follow stringent chemical residue limits set by global buyers…
In 2004, Ganesh Kadam took charge of two acres of a family plot and now grows table grapes on 14 acres. In 2024, he supplied 880 quintals for export at a price of ₹70 per kg, fetching ₹61.6 lakh revenue. A smaller lot, worth ₹6 lakh, was sold in the domestic market. After spending close to ₹35 lakh on production costs, his net earnings for the season were more than ₹30 lakh (average production costs are around ₹2.5 lakh per acre). “As a visitor, one only sees the materialistic changes. How big one’s house is, how many cars a farmer owns… but it is important to understand how knowledge, technology and training drove this change," Kadam said.
The article documents the critical role played by a co-operative society.
Sahyadri Farms, a farmer-owned company in which Kadam is a shareholder, has become the largest exporter of table grapes today. Exports would not have reached where they are today without its intervention, he said. “How else can a small farmer have access to the best technology, package of practices and an assured marketing channel," he asks. “I have been to Europe, seen how farming is done there, and how the produce is sold in supermarkets. Sarkari subsidies cannot take you there."… Farmers in Maharashtra have been commercially cultivating grapes for generations but began supplying to export markets only in early 2000. In 2010, most of the grapes shipped to the European Union were rejected due to the presence of excess levels of a growth regulator sold under the tradename Lihocin. Nearly half of India’s exporters shut shop after the tragic episode, which led to an estimated loss of ₹250 crore. But it taught farmers the importance of staying on top of global regulations and quality parameters. They were soon back in the game.
Vilas Shinde, a farmer and exporter, was among those who went bust in 2010. But unlike most traders, he paid farmers their due by selling his land (he lost ₹6.5 crore that year). In 2011, Shinde set up Sahyadri Farmer Producer Company Ltd together with 110 shareholder farmers with the aim of exporting grapes. Farmer producer companies are like cooperatives but set up under the Companies Act to ensure little or no bureaucratic and political interference. Since 2012, when Sahyadri shipped its first containers, its grape export volumes have grown seven-fold to 21,000 tonnes (as of 2024). Because grapes are a seasonal business (peaking between January and March, during harvest and shipping) Sahyadri diversified into other crops such as tomato (it is currently the largest processor of tomatoes in India and a contract manufacturer for Hindustan Unilever’s Kissan ketchup brand), bananas, pomegranate, sweet corn, mangoes, and cashews. The company’s 120-acre campus in Mohadi, Nashik, is a post-harvest hub with packhouses, cold storages and processing lines for these crops. In FY24, Sahyadri clocked a turnover of ₹1,549 crore, a 55% increase year-on-year.
Sahyadri is now a collective of 26,000 farmers cultivating 40,000 acres. In a way, it is trying to do with perishable horticulture crops (where production and prices often fluctuate wildly) what the Amul cooperative did for small dairy farmers. What’s more, Sahyadri plans to go for a public listing by 2026—that would be a first for a farmer producer company, racing ahead of VC-funded agriculture startups… In 2022, Sahyadri purchased the exclusive rights from Grapa, a California-based breeder, to grow its patented Arra variety of table grapes for a sum of ₹35 crore. By all measures, it was a significant intervention, that too by a farmer-owned company, to get the latest global technology for its growers. In 2024, the first batch of Arra grapes sold for an eyepopping ₹250 per kg in an auction held on a Nashik farm. Growers associated with Sahyadri are gradually replacing their vines with Arra varieties, and expect farmgate price realization to double to ₹150 per kg.
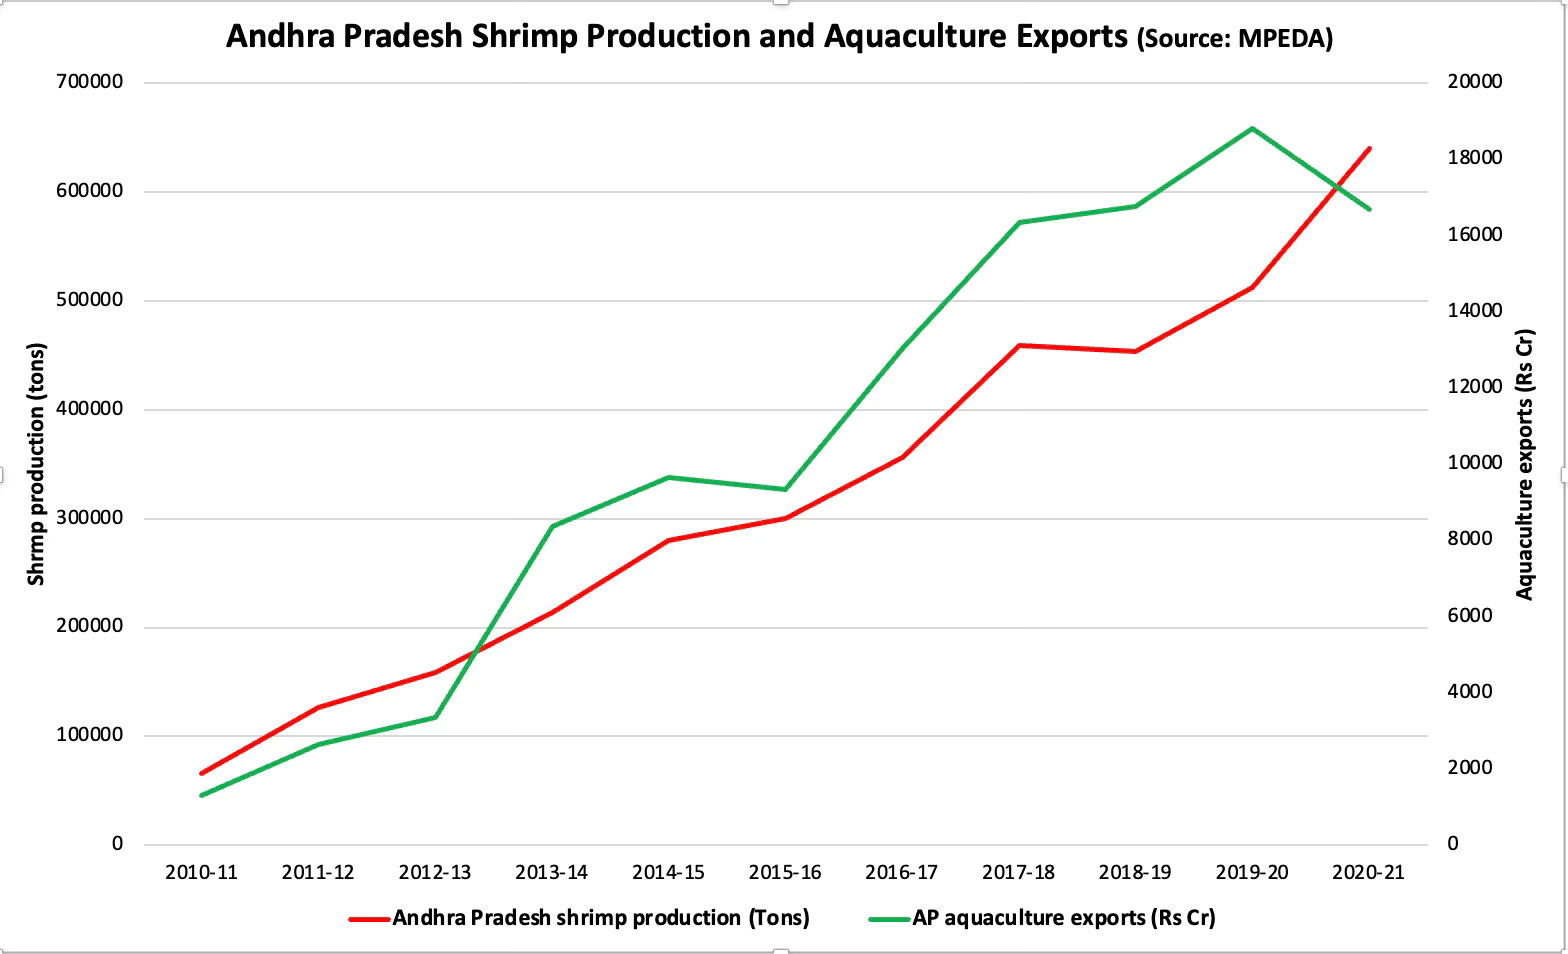
Another example of a successful breakout is inland aquaculture, specifically shrimp farming, in the delta districts of Andhra Pradesh. Following the introduction of the L. vannamei shrimp variety in 2009. the state has dramatically multiplied several-fold shrimp production and aquaculture exports (which are mainly shrimp in value).
Freshwater shrimps typically yield a profit of Rs 3-4 lakh per acre, after adjusting for risks. Interestingly, state government data reveals that of the 1.35 lakh farmers doing aquaculture on 4.5 lakh acres, just 6398 farmers with more than 10 Acres and an average extent of 28.63 acres used 41% of the land area.
While I have not come across a formal study explaining the contributors to this success, anecdotal snippets point to some important insights. One, there was no specific government scheme or focused initiative that contributed to the inland shrimp culture boom in Andhra Pradesh. In fact, shrimp production grew at a compounded annual rate of 17.9% till 2018 without any power subsidy. Incidentally, the growth rate declined to 11.7% till 2020-21 after the introduction of subsidised power at Rs 1.50.
Further, as this study shows, lack of government support was the least cited constraint facing shrimp farmers. It also shows that the major constraints were access to good quality seeds and other inputs, and better management practices. While governments can play a role in facilitating access and provision of good extension services, there are serious limits to the quality and effectiveness of such efforts.
Instead, conditional on the promise of the industry and a reasonable regulatory environment (shrimp culture in AP passed both these tests), these constraints are best relaxed by enterprising farmers. It’s therefore no surprise that anecdotal evidence from AP points to the same conclusion. The rapid rise of shrimp culture itself and the major contributors to steep rise in production and exports are the efforts of a handful of enterprising farmers in East and West Godavari and Nellore districts who seized the opportunity to access good quality seeds and cheaper inputs, and adopted productivity enhancing and cost optimising management practices. It helped that the region had a brief episode in the 1990s of boom in aquaculture that was disrupted by pest attacks.
Finally, Harish Damodaran writes about the recent emergence of pomegranate farmers in Rajasthan, covering an estimated 12,500 hectares in Barmer, Sanchore, Jalore, Sirohi, Jodhpur, and Phalodi districts. He chronicles the success of one farmer who generates an annual income of around Rs 1.5 Cr from his 32 Acre orchard where he has deployed drip irrigation facilities. This is a good summary of the transformational effects of such breakouts
The 30-km stretch from Dechu to Kalau is now a major anar cluster, with all the orchards having drip irrigation facility. Mali’s land value has shot up from a mere Rs 8,000 per bigha in 2004 to Rs 1 lakh in 2017 and Rs 5 lakh now — all thanks to anar. Till about 2004, Mali cultivated only bajra (pearl millet), guar (cluster bean), moth (dew bean) and moong (green gram) during a single kharif or post-monsoon crop season. With water-saving sprinklers, Mali could now plant rabi (winter-spring) season crops — raida (mustard), chana (chickpea), jeera (cumin) and isabgol (psyllium husk) — and also groundnut during kharif.
The article points to how access to high-quality seeds and exposure visits were important triggers for generating interest among farmers.
The turning point came in August 2017. That was when the state horticulture department supplied him 12,000 disease-free, tissue-cultured plants of Bhagwa Sinduri, a high-yielding pomegranate variety developed by the Mahatma Phule Krishi Vidyapeeth University at Rahuri in Maharashtra. “They charged Rs 40 per plant and credited back Rs 16 to my bank account after I bought it. Of the 12,000 plants, 3,000 were infected by nematodes and termites. The remaining 9,000, planted at 8 ft x 12 ft spacing, survived,” recalled Mali. He further spent Rs 8.5 lakh on laying 10,000 metres of drip irrigation pipes with emitters at 2 feet distance, and got back Rs 3 lakh as subsidy on this investment as well…
In early June, Jodhpur-based South Asia Biotechnology Centre (SABC), a non-profit, took 30 pomegranate farmers from western Rajasthan on an Anar Shodh Yatra. The 10-day field trip, supported by the NABARD’s Agri-Export Facilitation Centre in Jodhpur, involved visits to INI Farms’ integrated pack-house facility near Pune, the National Research Centre on Pomegranate at Solapur, and the Yara Crop Nutrition Centre at Pandharpur. The idea was to expose the farmers to the best cultivation and post-harvest management practices in Maharashtra, which accounts for 55 per cent of India’s annual pomegranate production of 3.2 million tonnes.
Note how enterprising farmers like Mali seized the opportunities presented to them and also the role of non-profits like SABC.
In light of these examples, what can the government do in agriculture?
I have blogged here pointing to the challenges faced by public policy in agriculture. Agriculture is one of the most challenging sectors for public policy. It engages with people who are generally poor and semi-literate. It is bedevilled with incentive distortions due to subsidies, and market failures arising from the nature of the sector. Finally, it must reconcile the interests of producers (who want high prices for their produce) and consumers (who want affordability).
Therefore, the government should continue to make investments in irrigation, provision of extension services, enable access to inputs and credit, finance downstream investments like storage, and support market enablers like certification. As all three examples illustrate, access to good quality seeds is a critical contributor to raising farm incomes substantially.
In addition, it would do well to demonstrate the possibilities and opportunities to local farmers in the belief that at least some among them will emerge as pioneers for new crops and practices. For example, there are similar opportunities for other fruits and vegetables like custard apple, guava, dragon fruit, avocado, pear, etc. There’s a need to create numerous clusters of high productivity and high incomes that have the potential for transformational local spillovers.
Once a farmer demonstrates some interest, government extension and other services should be channelled to support these self-selected farmers in pursuing their interests. Specifically, exposure to new opportunities and identification and encouragement of progressive or enterprising farmers should become an explicit priority of agriculture departments.
Public policy can also play a role in addressing coordination failures by connecting such progressive farmers with all the market actors, especially the agriculture sector non-profits and startups, in addition to companies, who are involved in pre- and post-harvest linkage activities. Given the expanding landscape of such non-government actors, governments should enlist them as close partners and even support them financially where possible to increase the effectiveness of their engagement with farmers.
The problem with such policy activities is that they lose their effectiveness when done in a commoditised programmatic manner. Their effectiveness lies in their organic emergence where the value proposition is made evident to all sides involved (instead of the standard approach of creating an IT platform to connect everyone, and leaving it at that).
Supporting enterprising farmers is perhaps the highest value for money investments in agriculture, and the activities of such farmers also have the highest multipliers on the local farmers and farming practices.
Finally, society must start to celebrate enterprising farmers in the same way as startup founders. In fact, unlike many startup founders who merely build companies with ephemeral valuations, enterprising farmers create genuine and lasting value. Their average economic multiplier or marginal value is perhaps higher than those of a tech startup founder, especially in the Indian context. Instead of being stigmatised, dynamic farminc entrepreneurship of the kind discussed here should become a livelihood that people should be encouraged and supported to pursue with interest.