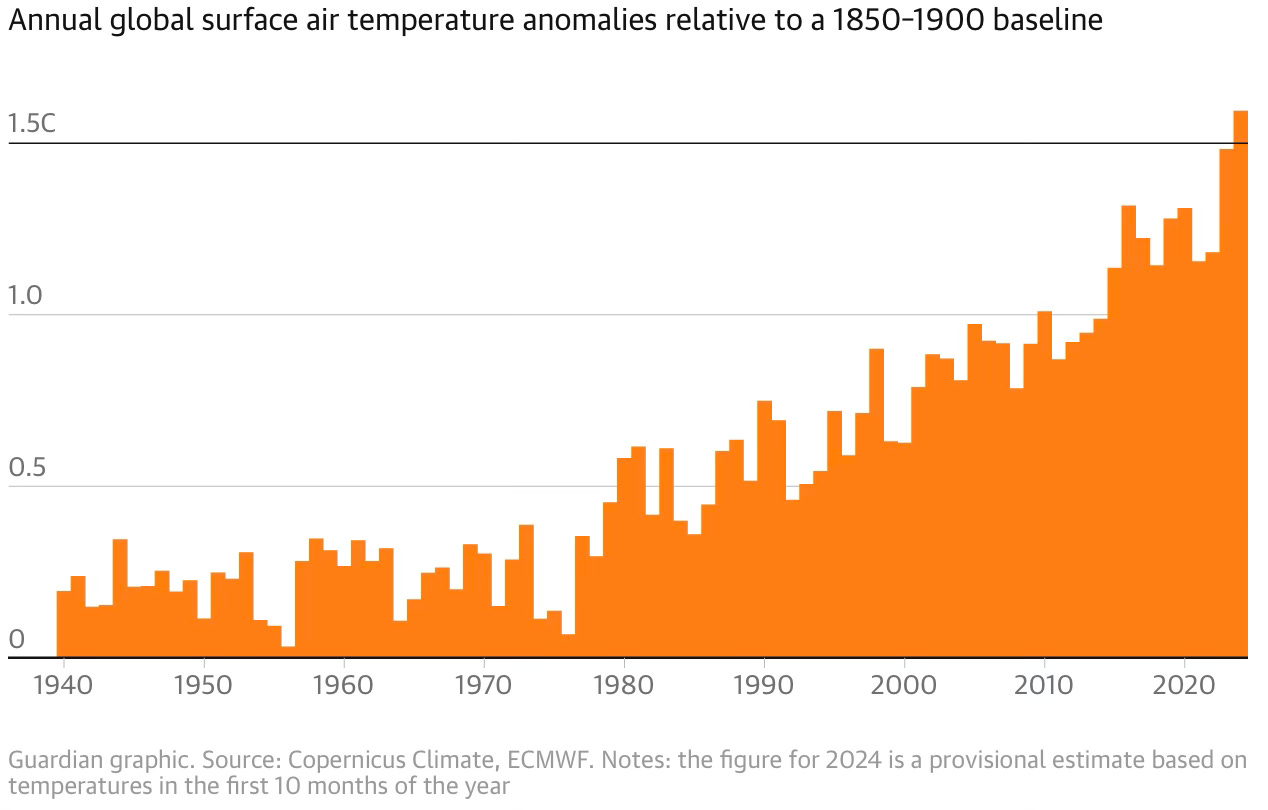
1. 2024 is the first year to surpass 1.5 degrees of warming above pre-industrial temperatures.
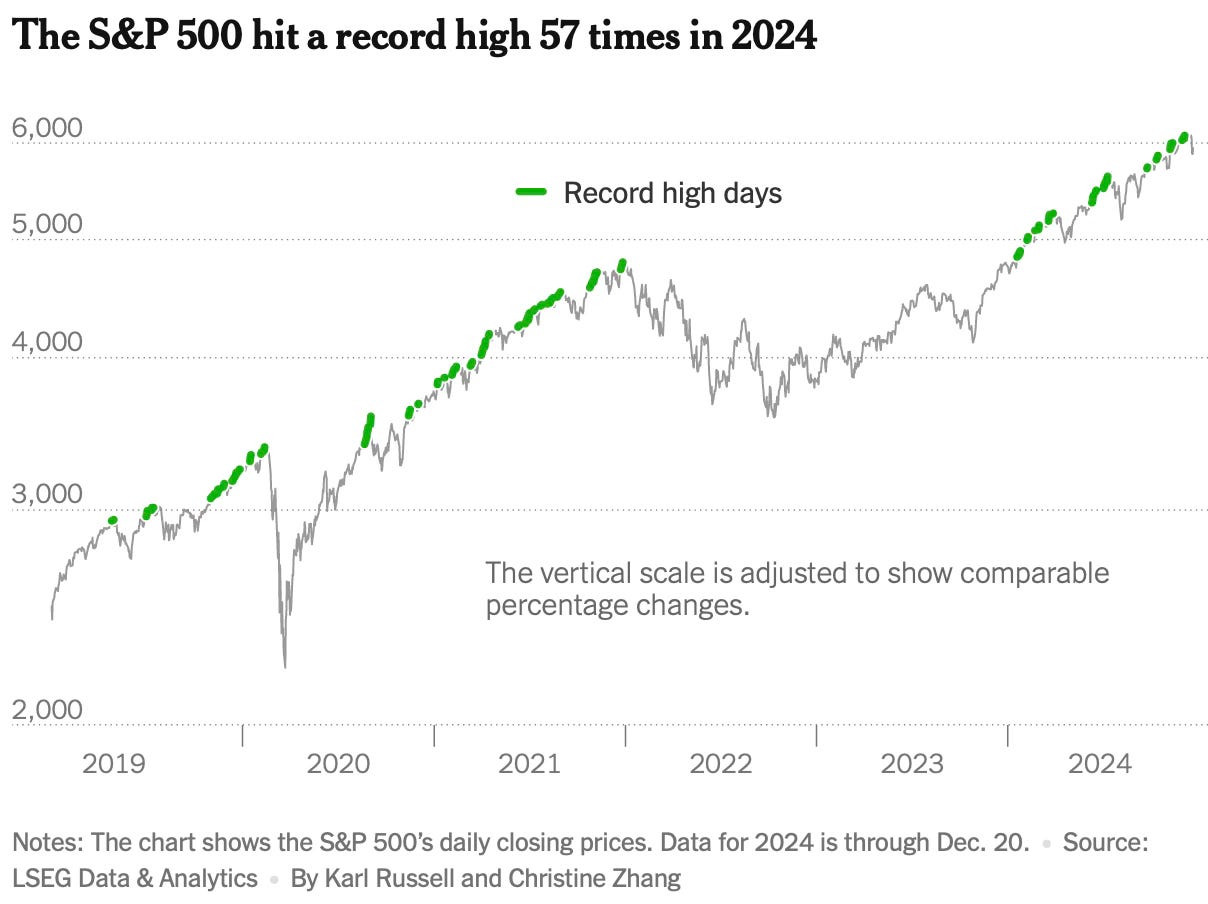
2. The S&P 500 hit record highs 57 times!
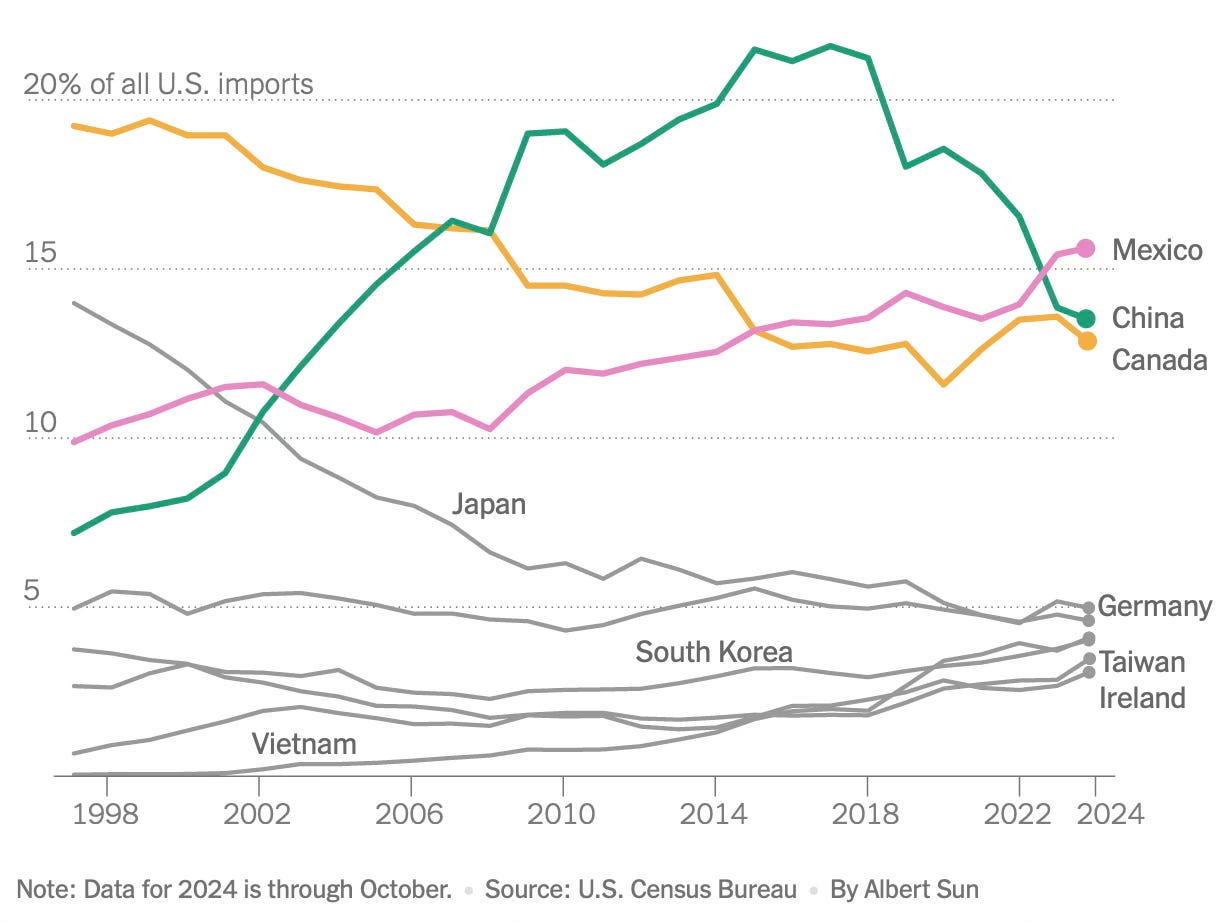
3. The most important graphic for 2025 regarding the pointers to any trade war.
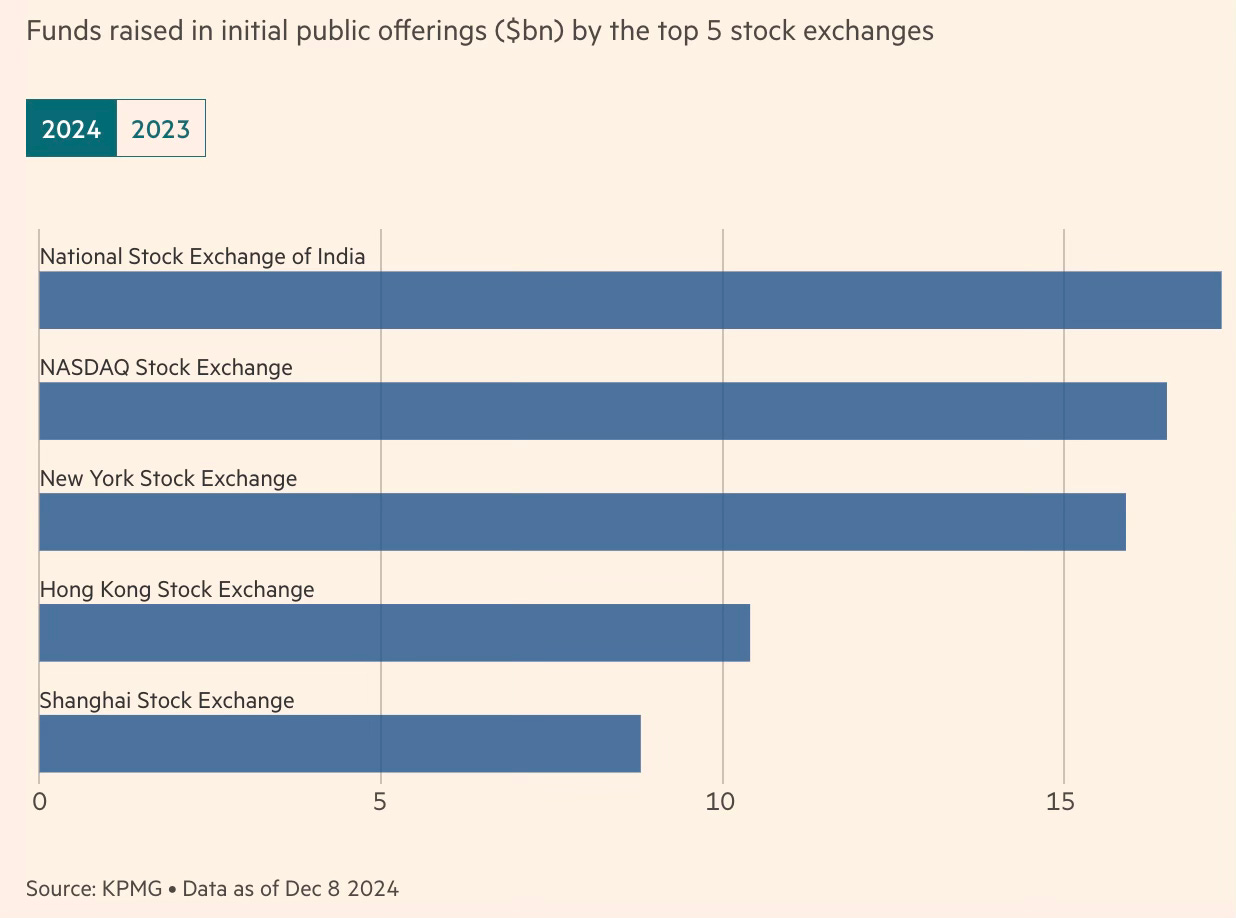
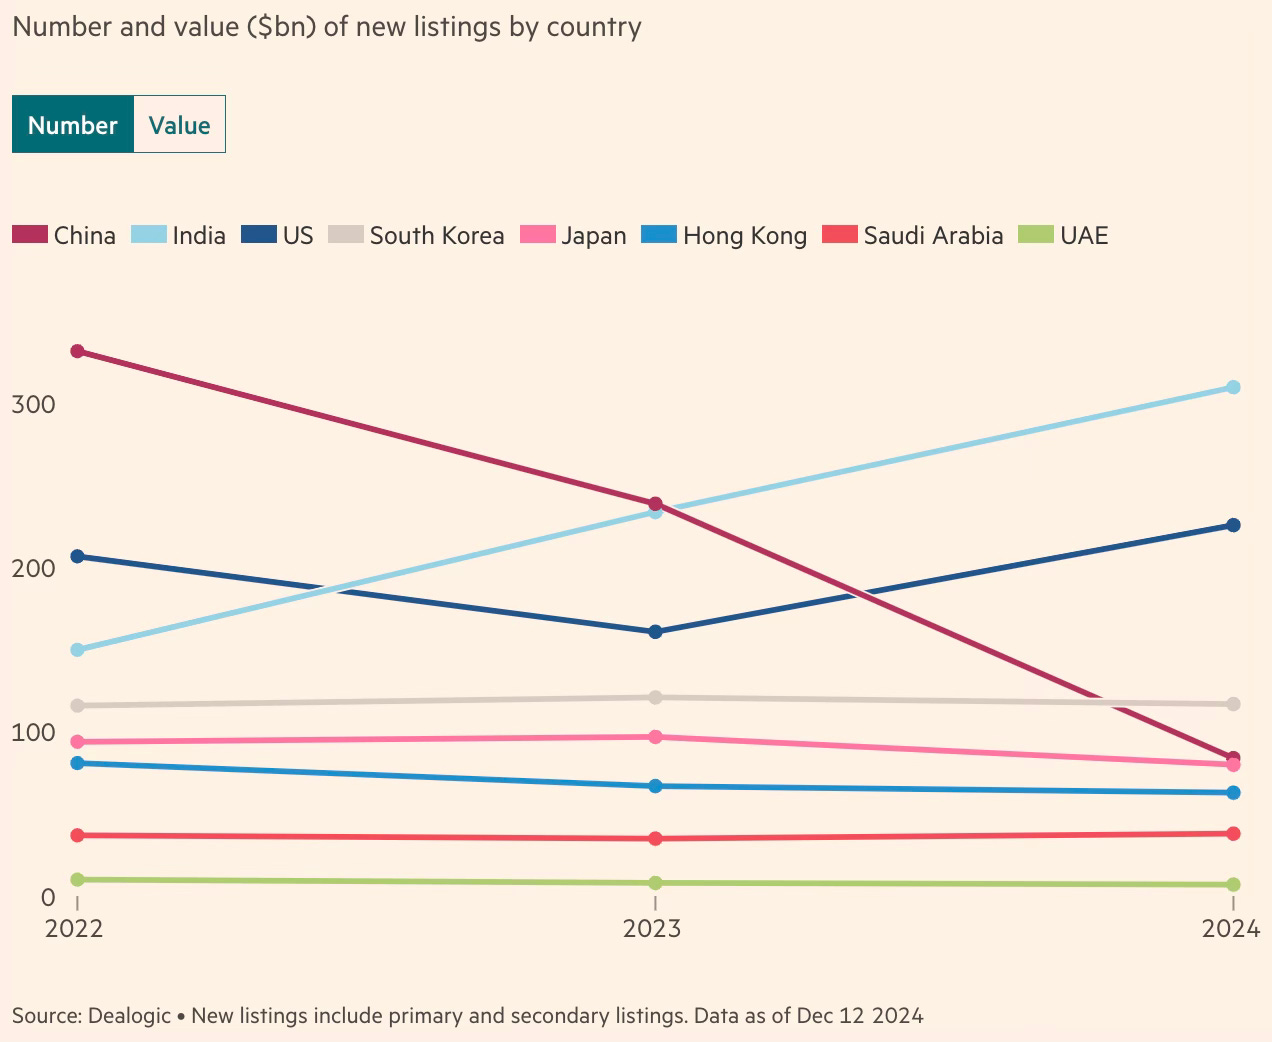
4. India’s NSE became the top global stock exchange by IPO proceeds in 2024.
India also emerged as the top market in the world for IPO listing by numbers and second (after the US) by value.
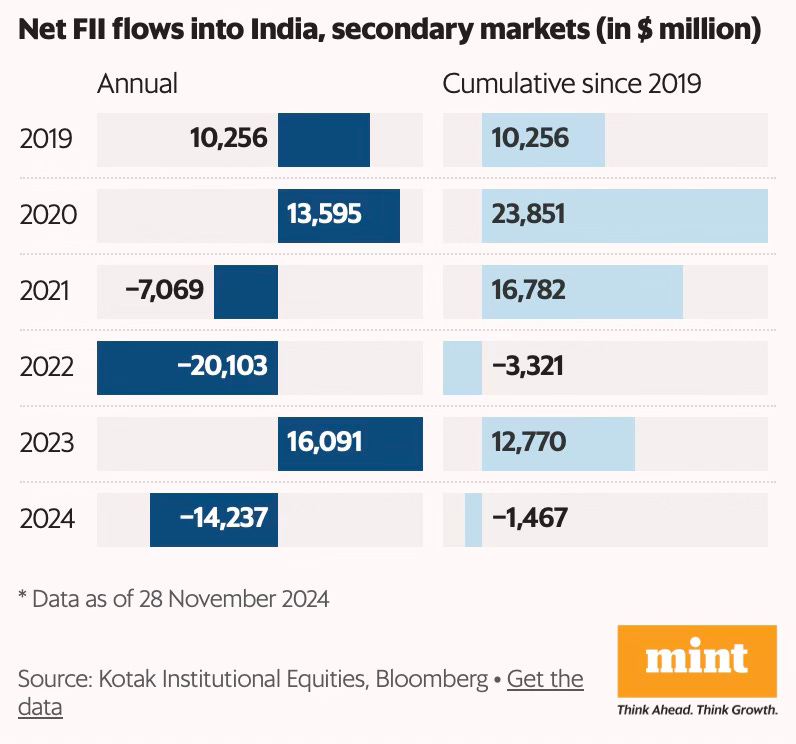
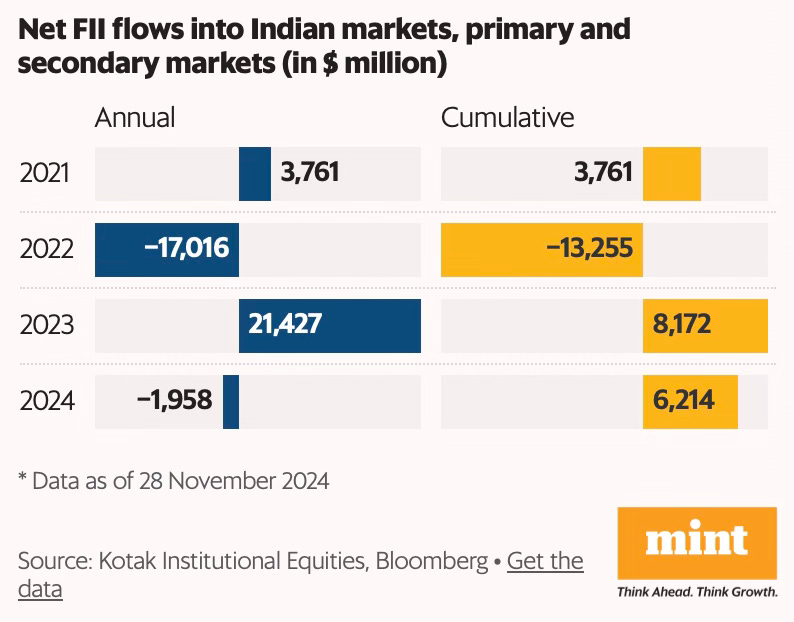
5. Foreign Institutional Investors (FII) have been net sellers in India’s secondary markets since 2019.
Even after considering their primary investments in IPOs, QIPs etc., the cumulative inflow over the last four years is only $6 billion or about two-three months’ worth of SIP inflows.
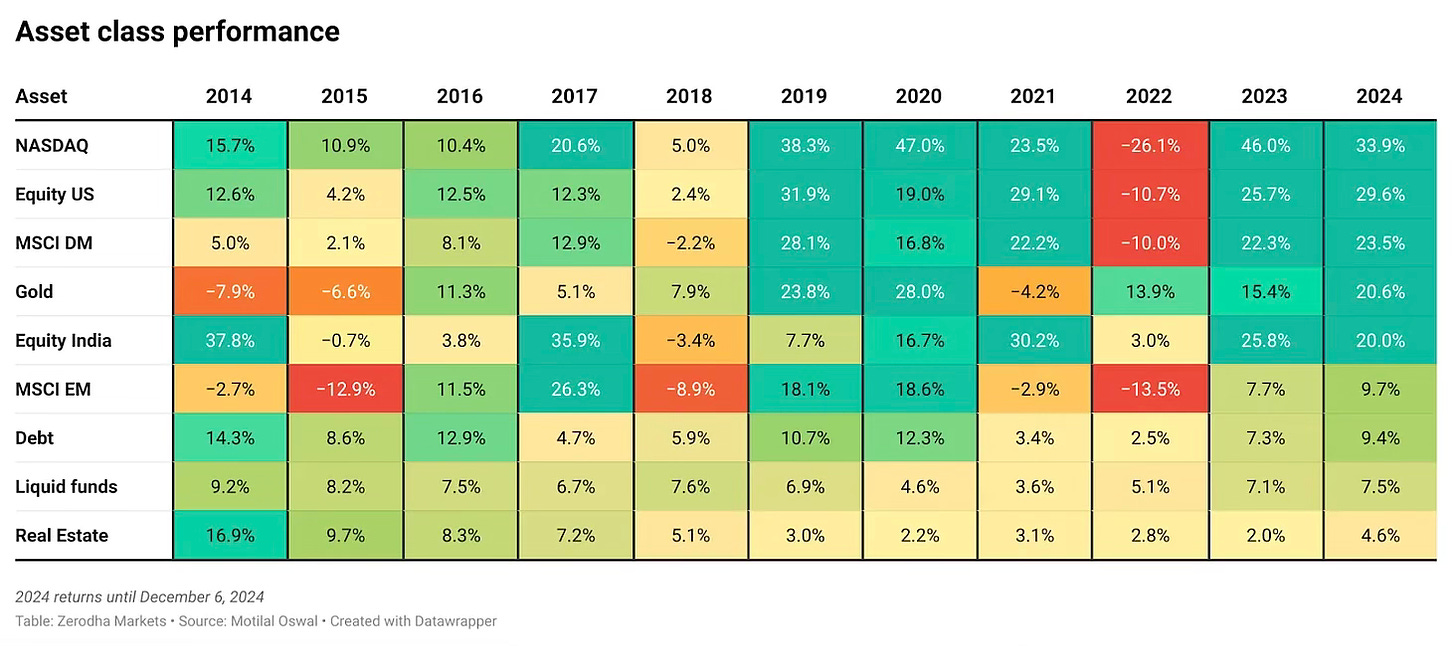
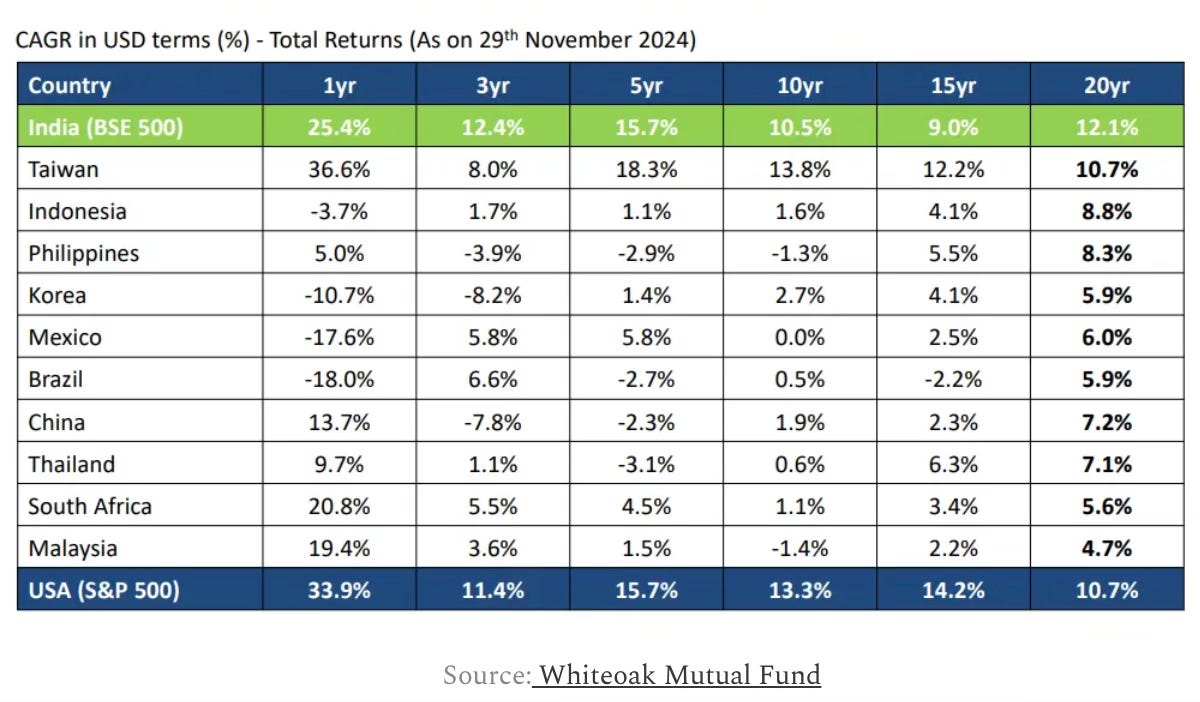
6. Among asset classes, Indian equity topped EM equity in 2024 by a big distance.
In fact, India has consistently been among the best performing EM for at least two decades.
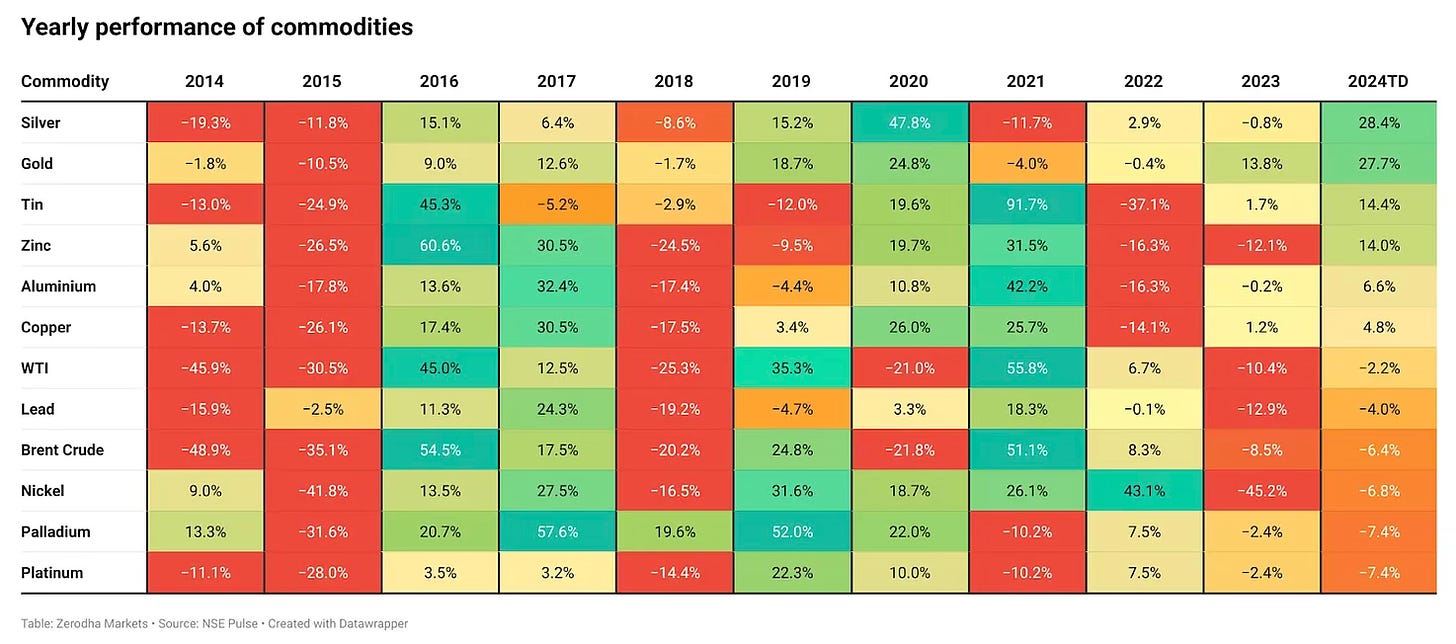
7. Commodities had a generally weak year, contributing to easing inflation pressures.
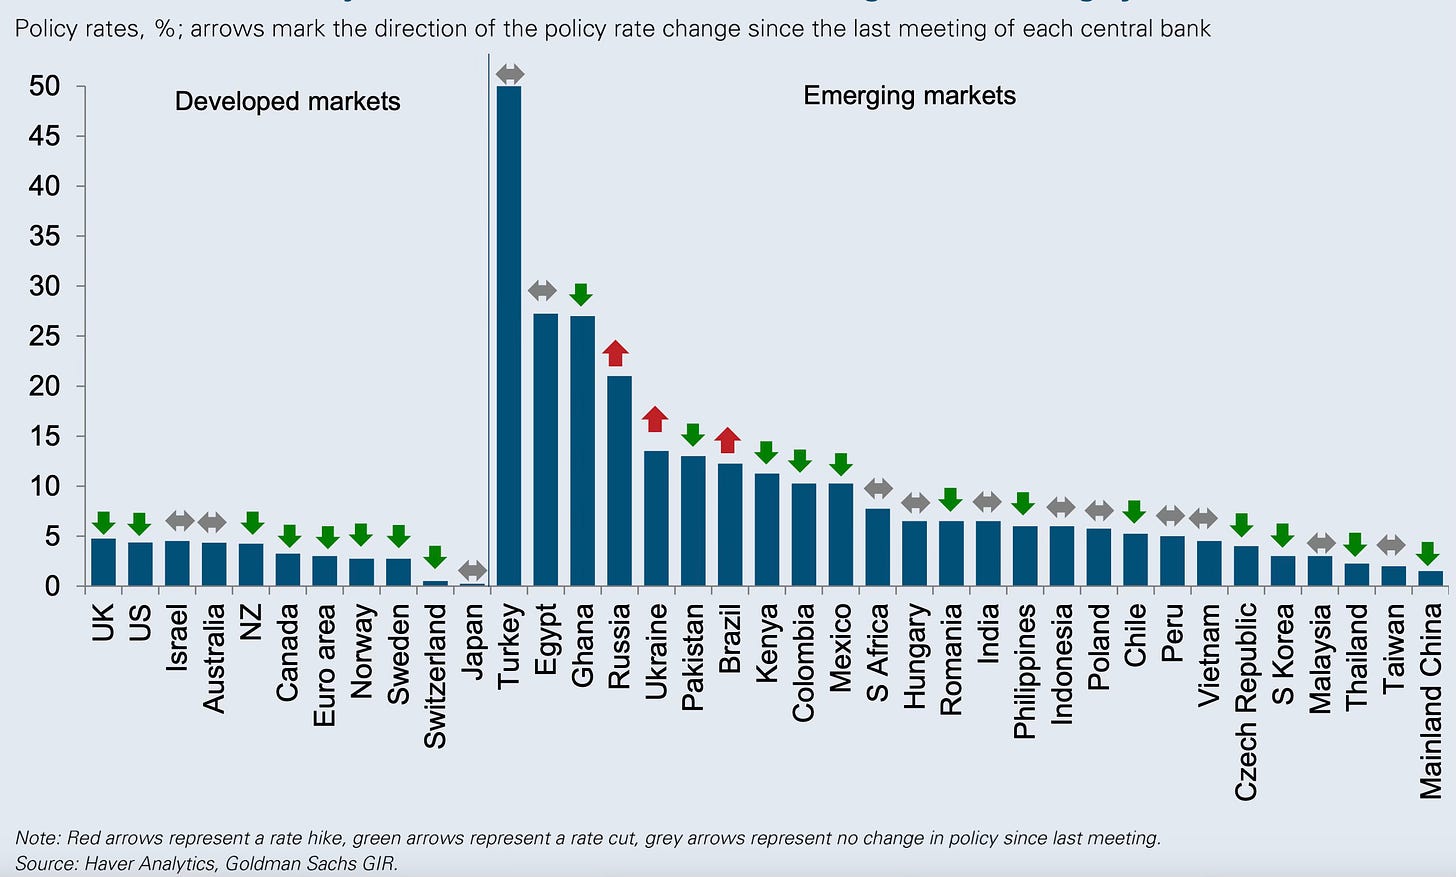
8. Central banks across developed and developing countries have started cutting rates.
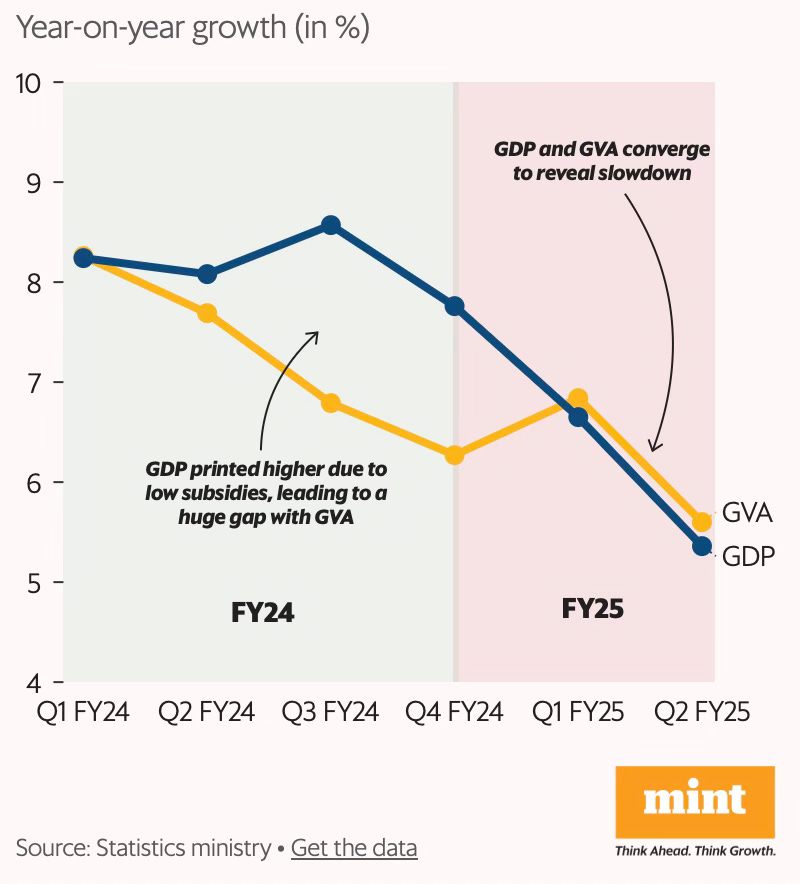
9. India’s GDP growth has declined for the last three quarters.
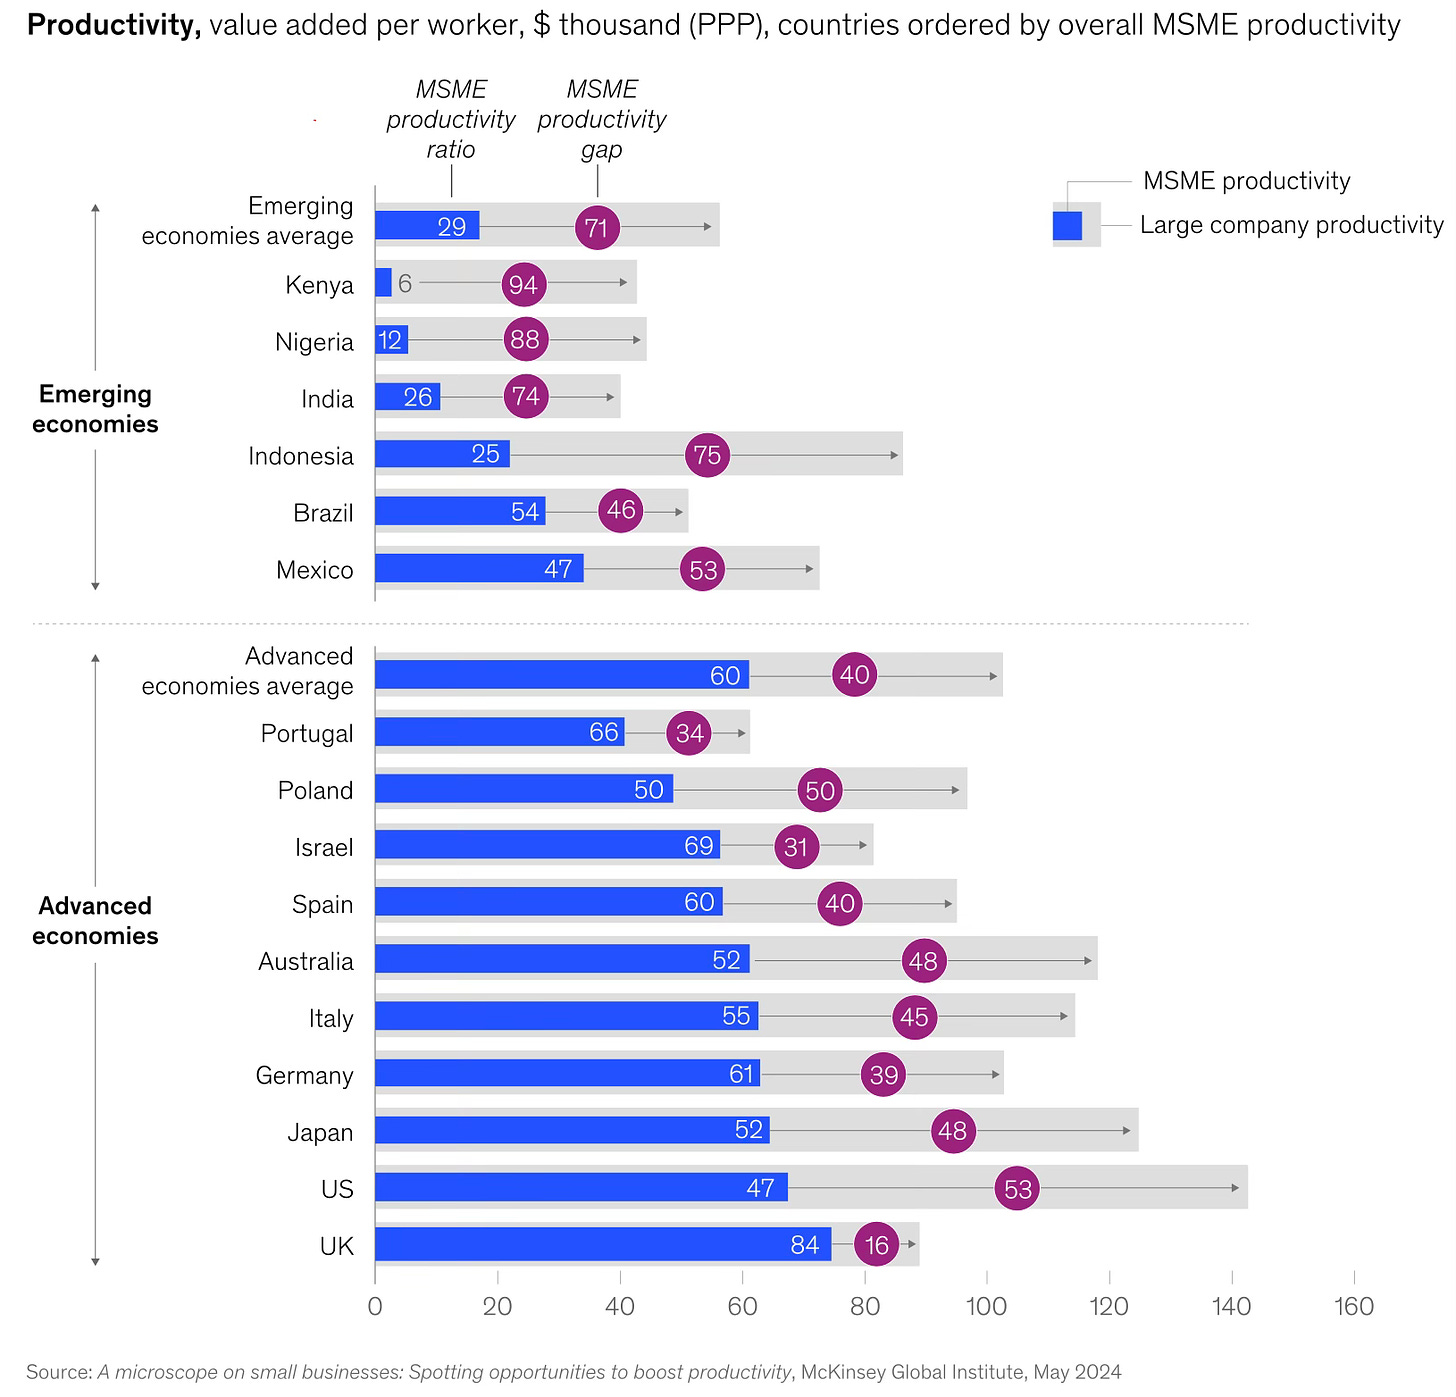
10. MSMEs account for half economic output, but are orders of magnitude less productive than firms in the top-quartile.
Indian large firms are far less productive than those of Brazil, Mexico, and Indonesia.
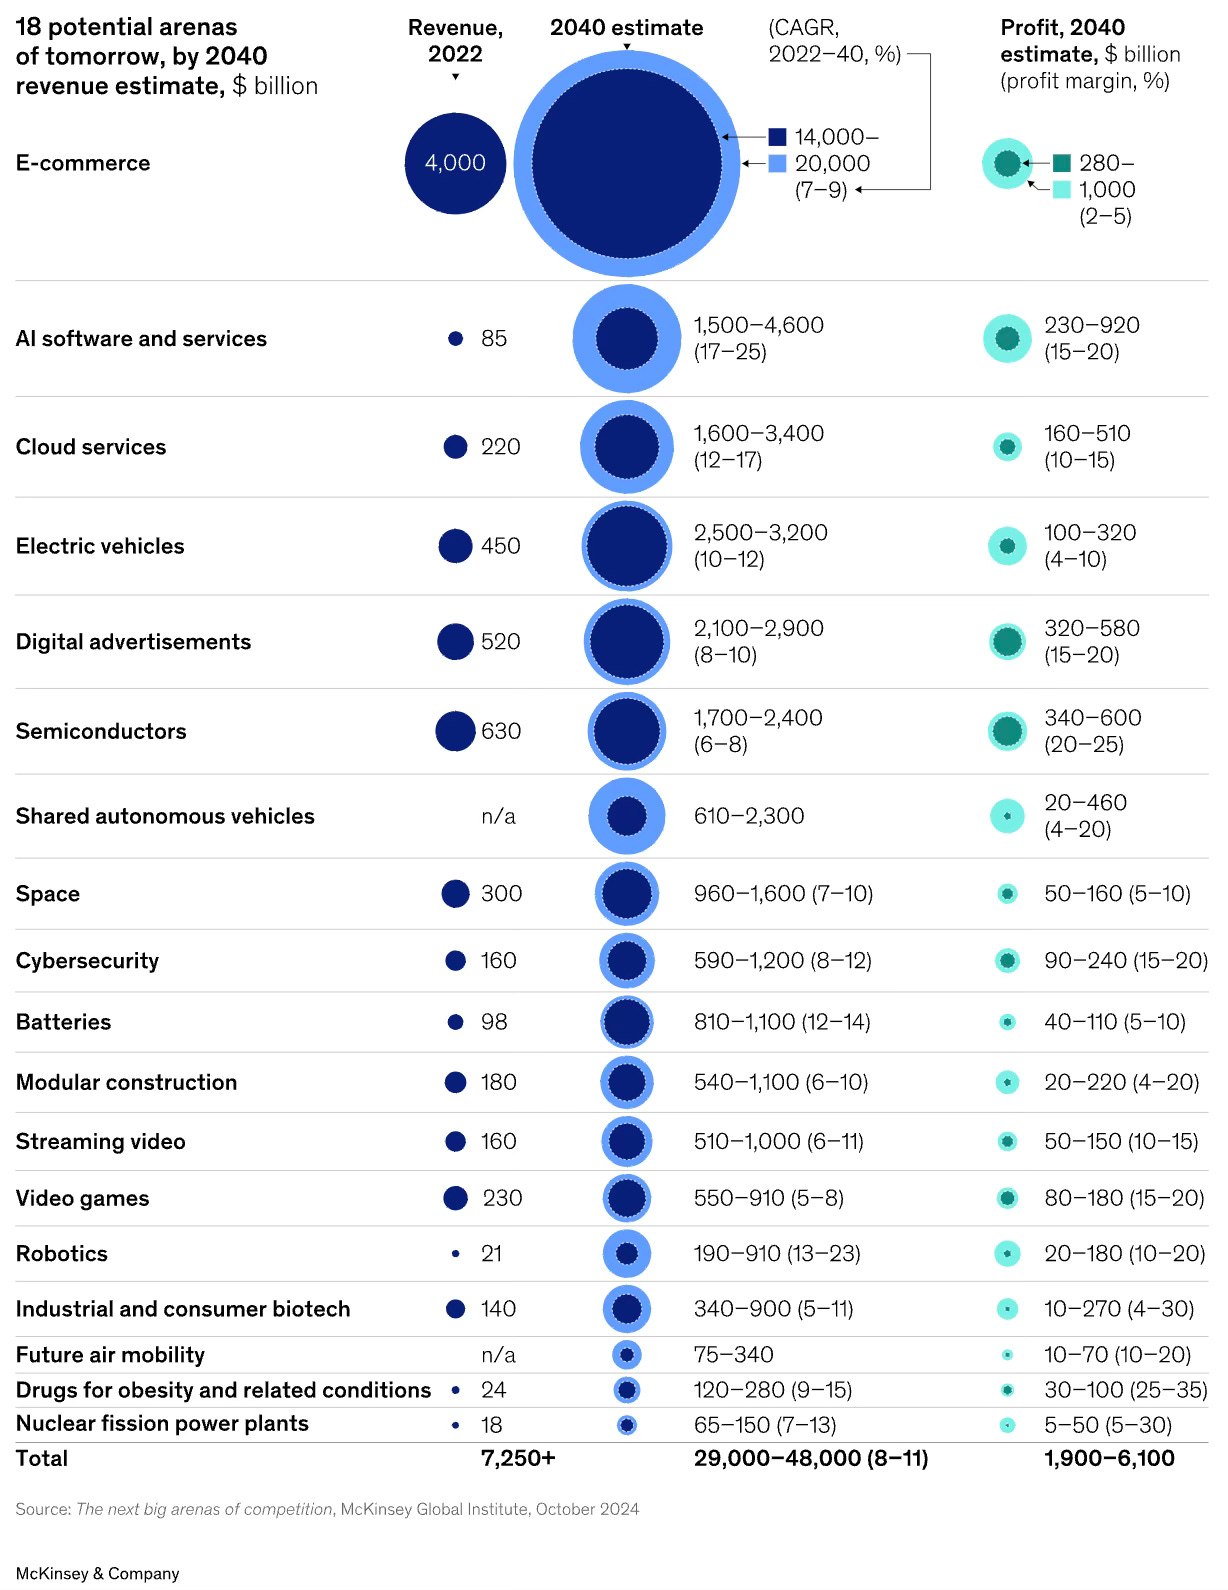
11. McKinsey has 18 potential areas that could generate $29 trillion to $48 trillion in revenues and $2 trillion to $6 trillion in profits by 2040.
12. Consolidation of all graphical stories in the year from NYT.
13. World Bank’s key development challenges in graphics for 2024.
14. Finally, a prediction from McKinsey’s year in Charts.

No comments:
Post a Comment