The graphic below represents a two factor economy, consisting of physical infrastructure and human resources. It traces the evolution of the two-factor production possibility frontier (PPF) and aggregate demand of the economy over the 1995-2010 period.
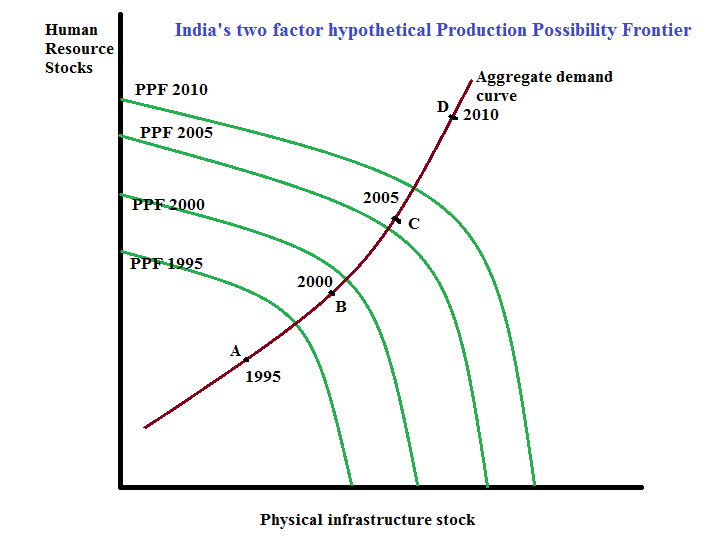
As can be imagined, from the discussion in the earlier post, the economy can be assumed to be operating well within the PPF in 1995 (point A) and moving closer to PPF by 2000 (point B). It has gone slightly beyond the PPF by 2005 (point C). However, by 2010, the aggregate demand (point D) has gone well past the PPF for the year. The economy is clearly over-heating. Note that the PPF has expanded by more or less the same pace. This trend is clearly unsustainable.
No comments:
Post a Comment